
Physicochemical Characterization and Antimicrobial Analysis of Vegetal Chitosan Extracted from Distinct Forest Fungi Species


 ,
, 
Abstract
:1. Introduction
2. Materials and Methods
2.1. Extraction of Chitosan
2.2. Characterisation of Chitosan
2.3. Degree of Deacetylation
2.4. X-ray Diffractometry (XRD)
2.5. Moisture and Ash Content Determination
2.6. Solubility Determination
2.7. Antimicrobial Activity
2.8. Statistical Analysis
3. Results and Discussion
3.1. Yield of Chitin and Chitosan
3.2. Characterisation of the Vegetal Chitosan
3.2.1. Scanning Electron Microscopy (SEM)
3.2.2. Energy Dispersive X-ray (EDX) Spectroscopy
3.2.3. Fourier Transform Infrared Spectroscopy (FTIR)
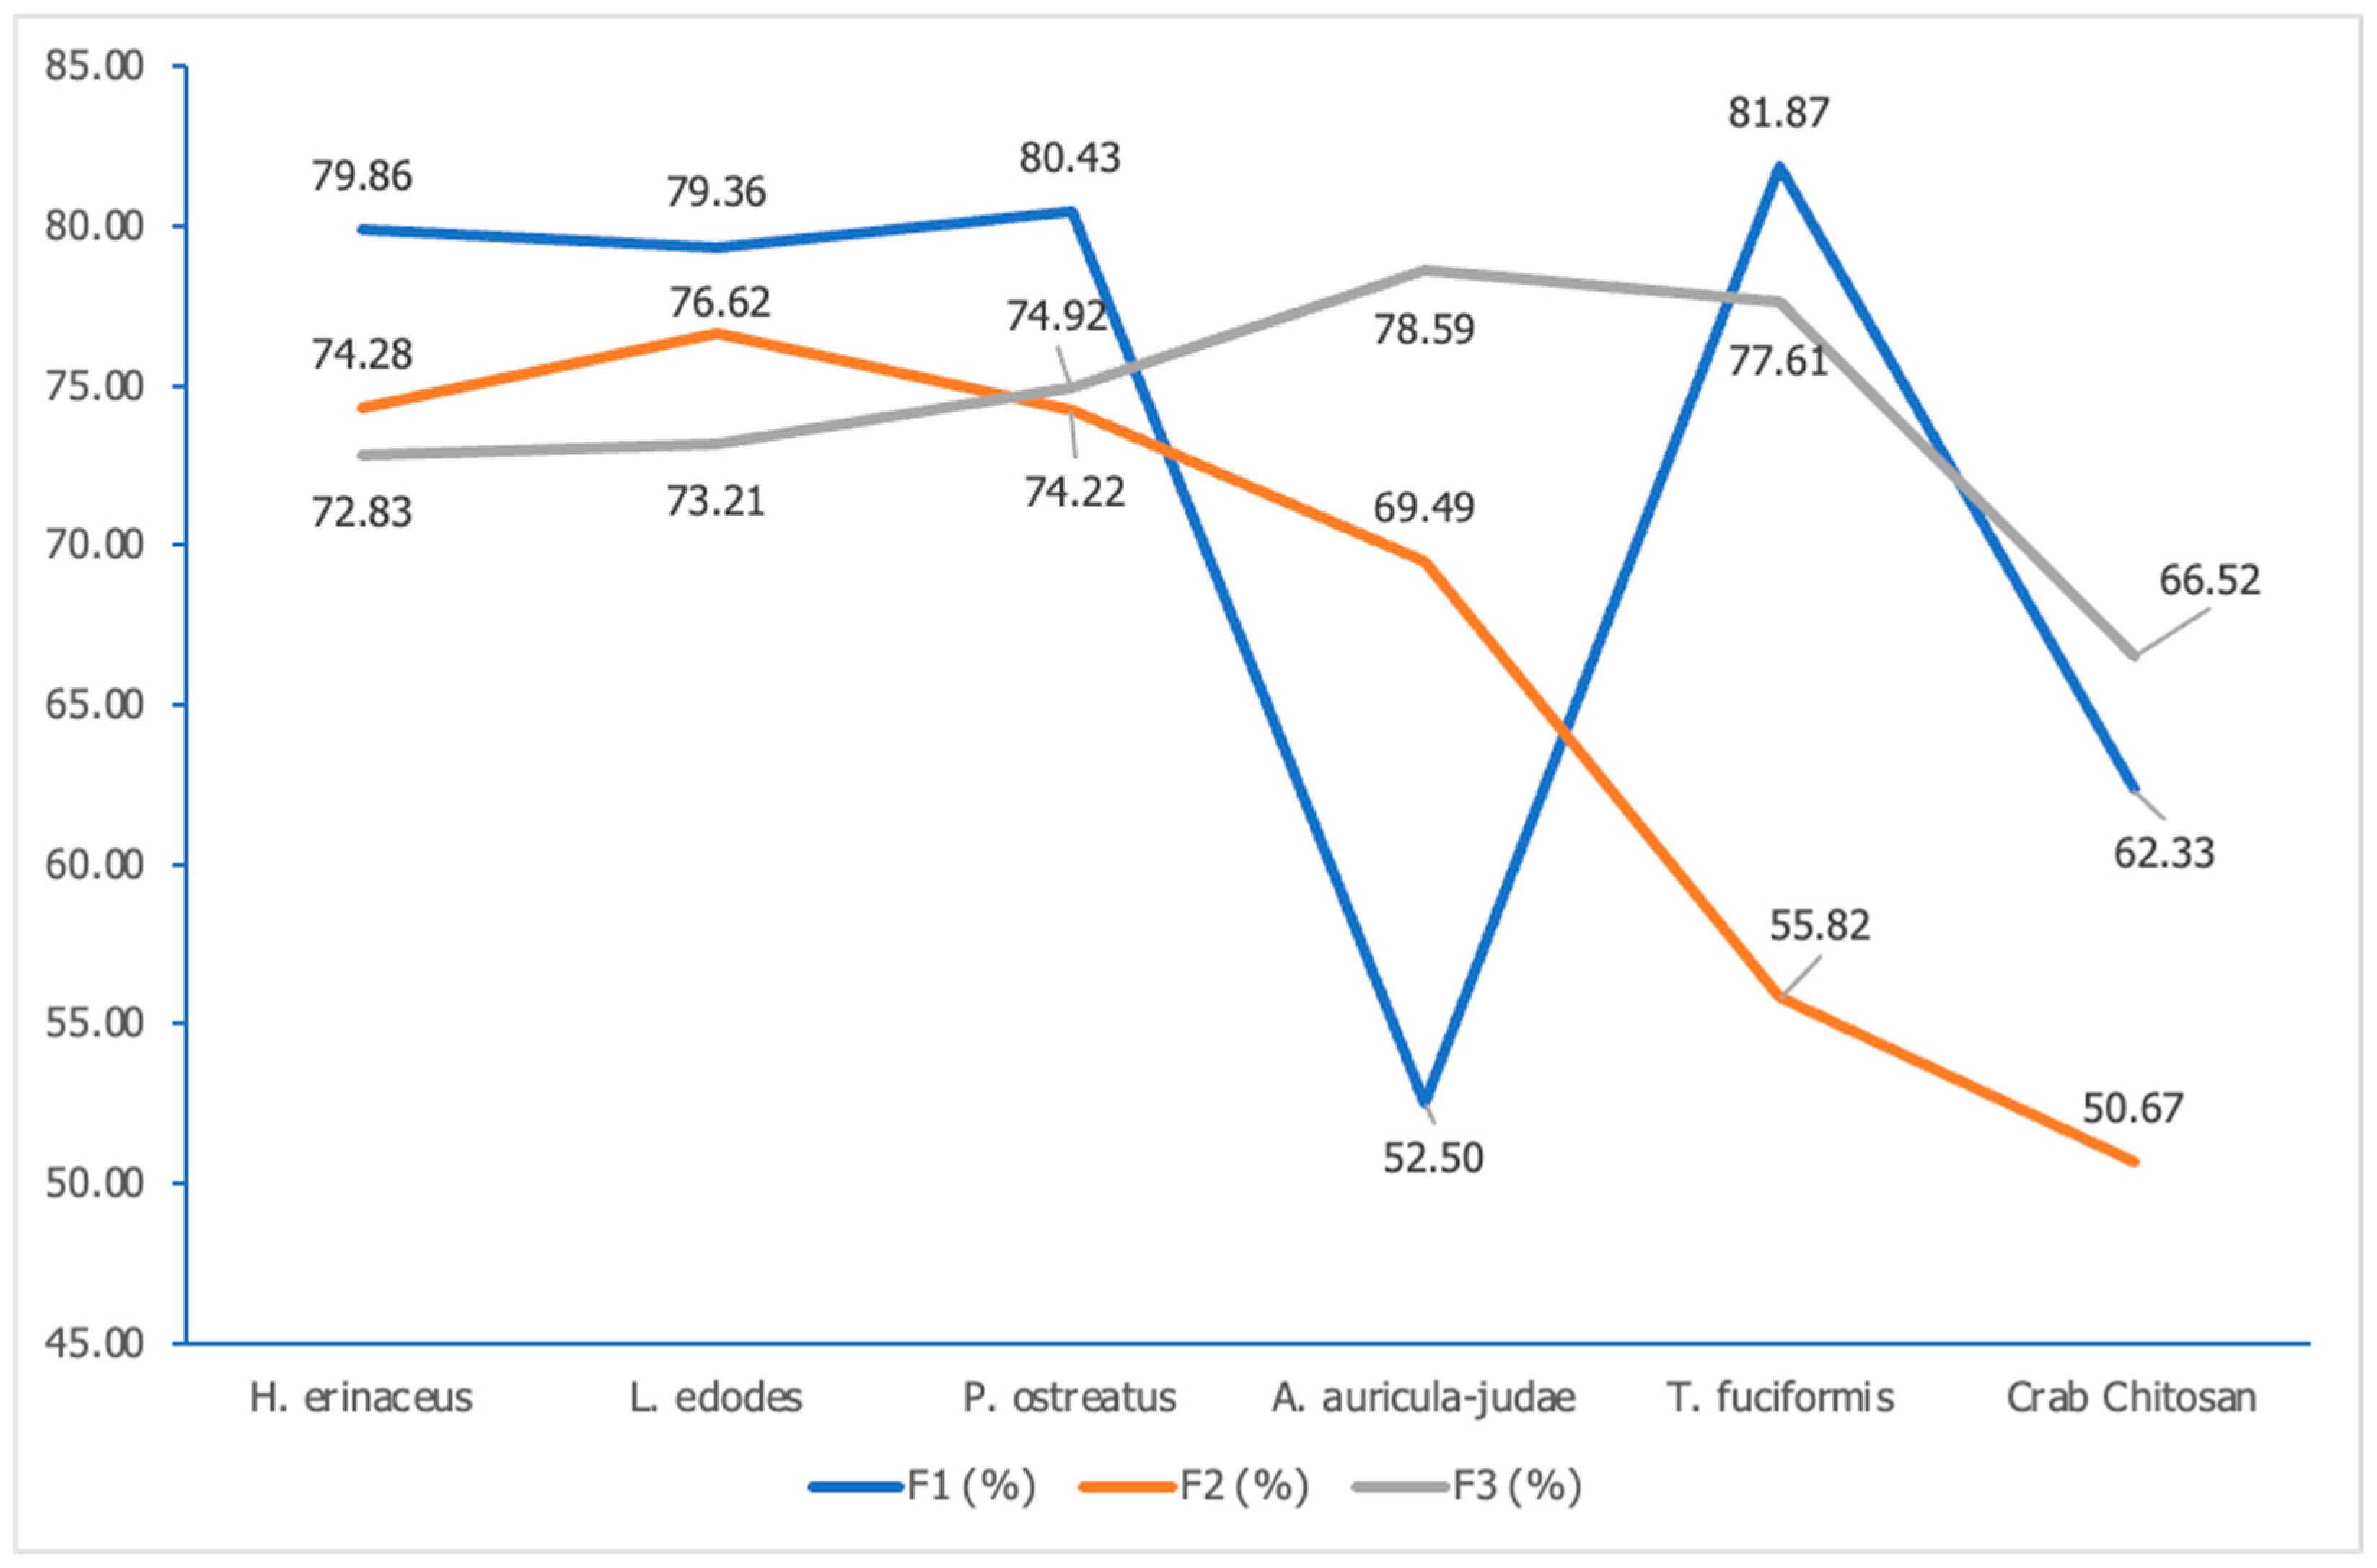
3.2.4. Degree of Deacetylation
3.2.5. X-ray Diffractometry (XRD)
3.2.6. Moisture and Ash Content Determination
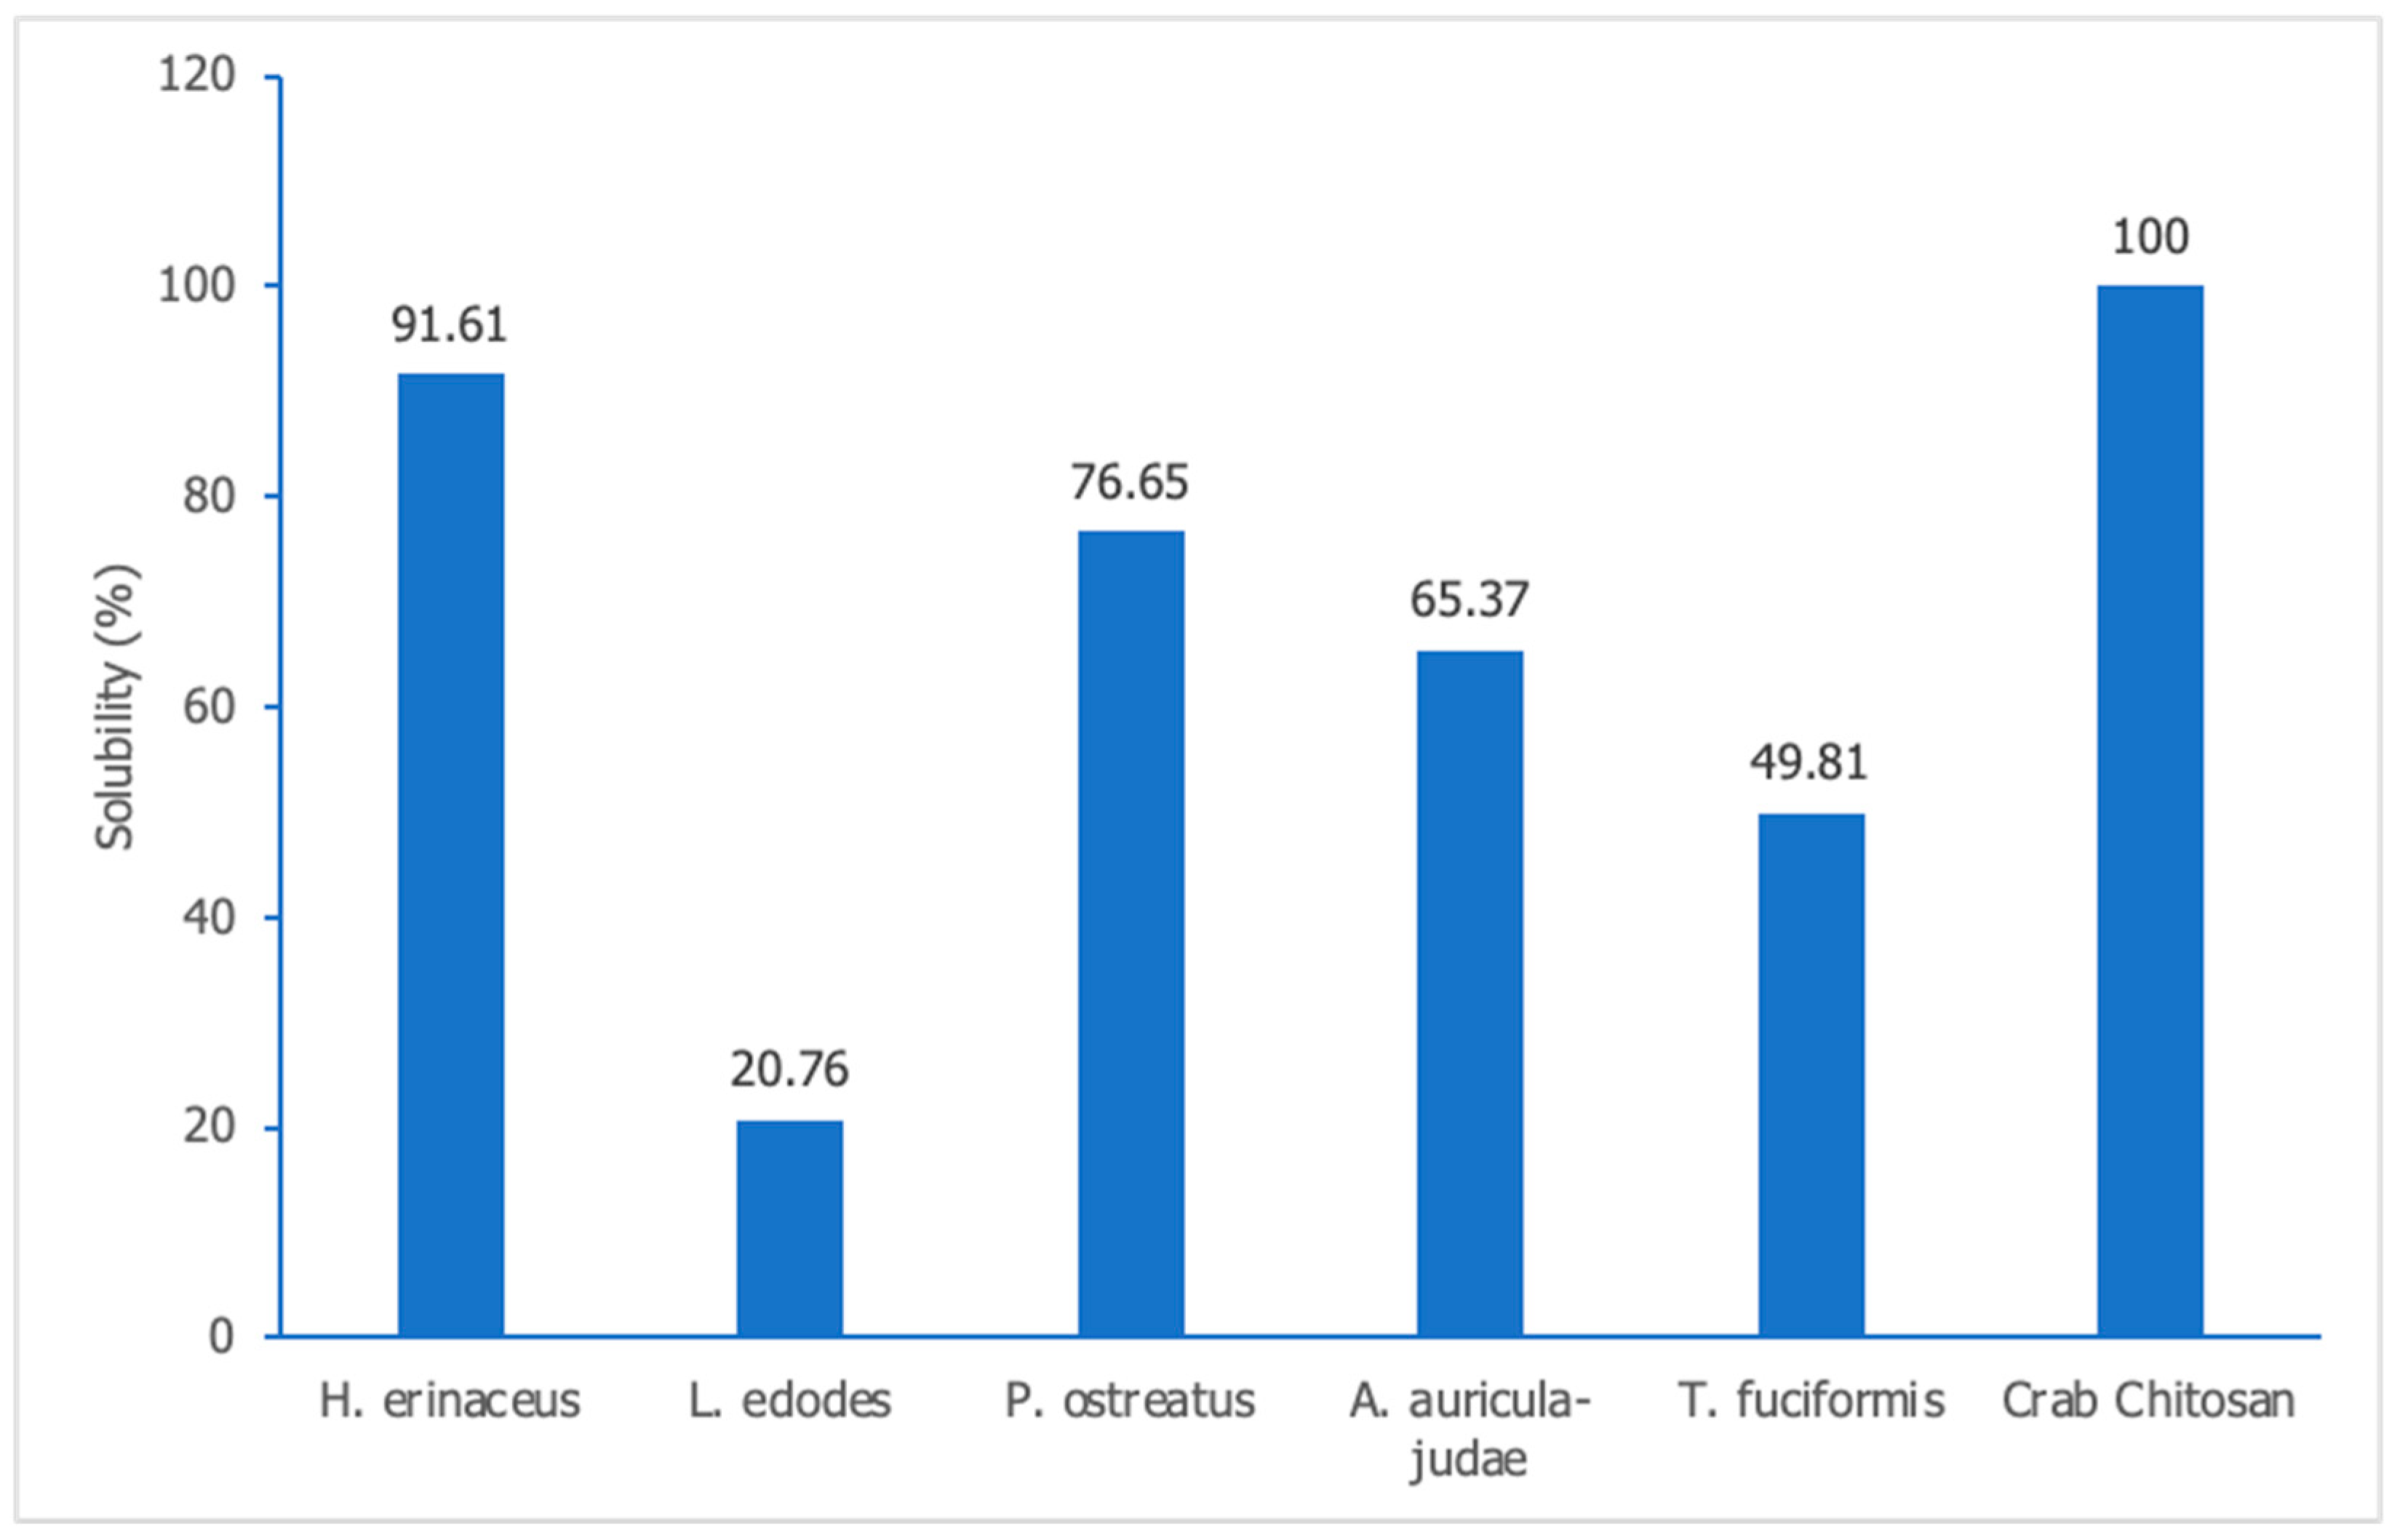
3.2.7. Solubility Determination
3.3. Antimicrobial Activity
4. Conclusions
Author Contributions
Funding
Institutional Review Board Statement
Data Availability Statement
Acknowledgments
Conflicts of Interest
References
- Ibrahim, S.; Riahi, O.; Said, S.M.; Sabri, M.F.; Rozali, S. Biopolymers from Crop Plants. MSEB 2019, 13, 457. [Google Scholar] [CrossRef]
- Mtibe, A.; Motloung, M.P.; Bandyopadhyay, J.; Ray, S.S. Synthetic Biopolymers and Their Composites: Advantages and Limitations—An Overview. Macromol. Rapid Commun. 2021, 42, 2100130. [Google Scholar] [CrossRef] [PubMed]
- Madni, A.; Kousar, R.; Naeem, N.; Wahid, F. Recent advancements in applications of chitosan-based biomaterials for skin tissue engineering. J. Bioresour. Bioprod. 2021, 6, 11–25. [Google Scholar] [CrossRef]
- Zhang, X.; Ismail, B.B.; Cheng, H.; Jin, T.Z.; Qian, M.; Arabi, S.A.; Guo, M. Emerging chitosan-essential oil films and coatings for food preservation-A review of advances and applications. Carbohydr. Polym. 2021, 273, 118616. [Google Scholar] [CrossRef] [PubMed]
- Iversen, L.J.L.; Rovina, K.; Vonnie, J.M.; Matanjun, P.; Erna, K.H.; Aqilah, N.M.N.; Funk, A.A. The Emergence of Edible and Food-Application Coatings for Food Packaging: A Review. Molecules 2022, 27, 5604. [Google Scholar] [CrossRef]
- Basumatary, I.B.; Mukherjee, A.; Katiyar, V.; Kumar, S.; Dutta, J. Chitosan-Based Antimicrobial Coating for Improving Postharvest Shelf Life of Pineapple. Coatings 2021, 11, 1366–1369. [Google Scholar] [CrossRef]
- Vanitha, P.D.; Sudersan, K.; Arun, K.S.; Arumugam, P.; Gobi, N.; Siva, S.P.; Anuradha, V.; Sivasankar, P. Extraction of Chitosan from Crab Shells Using Five Different Chemical Methods and its Characterization. Int. J. Recent Sci. Res. 2018, 9, 28512–28517. [Google Scholar]
- Ospina, A.S.P.; Ramírez, C.D.A.; Escobar, S.D.M.; Ossa, O.C.P.; Rojas, V.D.F.; Zapata, O.P.; Atehortúa, L. Comparison of Extraction Methods of Chitin from Ganoderma lucidum Mushroom Obtained in Submerged Culture. Biomed Res. Int. 2014, 14, 169071. [Google Scholar] [CrossRef]
- Sarbon, N.; Sandanamsamy, S.; Kamaruzaman, S.; Ahmad, F. Chitosan extracted from mud crab (Scylla olivicea) shells: Physicochemical and antioxidant properties. J. Food Sci. Technol. 2014, 52, 4266–4275. [Google Scholar] [CrossRef]
- Poeloengasih, C.D.; Hernawan, H.; Angwar, M. Isolation and Characterization of Chitin And Chitosan Prepared Under Various Processing Times. Indones. J. Chem. 2008, 8, 189–192. [Google Scholar] [CrossRef]
- Pathan, A.; Bond, J.; Gaskin, R. Sample preparation for SEM of plant surfaces. Mater. Today 2010, 12, 32–43. [Google Scholar] [CrossRef]
- Villegas-Peralta, Y.; López-Cervantes, J.; Madera Santana, T.J.; Sánchez-Duarte, R.G.; Sánchez-Machado, D.I.; Martínez-Macías, M.D.R.; Correa-Murrieta, M.A. Impact of the molecular weight on the size of chitosan nanoparticles: Characterization and its solid-state application. Polym. Bull. 2020, 78, 813–832. [Google Scholar] [CrossRef]
- Zvezdova, D. Synthesis and characterization of chitosan from marine sources in Black Sea. Annu. Proc. Angel Kanchev Univ. Ruse 2010, 49, 65–69. [Google Scholar]
- Queiroz, F.M.; Melo, K.; Sabry, D.; Sassaki, G.; Rocha, H. Does the Use of Chitosan Contribute to Oxalate Kidney Stone Formation? Mar. Drugs 2014, 13, 141–158. [Google Scholar] [CrossRef]
- Czechowska-Biskup, R.; Jarosińska, D.; Rokita, B.; Ulanski, P.; Rosiak, J.M. Determination of Degree of Deacetylation of Chitosan—Comparision of Methods. Prog. Chem. Appl. Chitin Deriv. 2012, 17, 5–20. [Google Scholar]
- Jampafuang, Y.; Tongta, A.; Waiprib, Y. Impact of crystalline structural differences between α-and β-chitosan on their nanoparticle formation via ionic gelation and superoxide radical scavenging activities. Polymers 2019, 11, 2010. [Google Scholar] [CrossRef]
- Podgorbunskikh, E.; Kuskov, T.; Rychkov, D.; Lomovskii, O.; Bychkov, A. Mechanical Amorphization of Chitosan with Different Molecular Weights. Polymers 2022, 14, 4438. [Google Scholar] [CrossRef]
- Korsrud, G.O.; Boison, J.O.; Nouws, J.F.; Macneil, J.D. Bacterial inhibition tests used to screen for antimicrobial veterinary drug residues in slaughtered animals. J. AOAC Int. 1998, 81, 21–24. [Google Scholar] [CrossRef]
- Tu, J.; Brennan, M.; Brennan, C. An insight into the mechanism of interactions between mushroom polysaccharides and starch. Curr. Opin. Food Sci. 2021, 37, 17–25. [Google Scholar] [CrossRef]
- Hosney, A.; Ullah, S.; Barčauskaitė, K. A Review of the Chemical Extraction of Chitosan from Shrimp Wastes and Prediction of Factors Affecting Chitosan Yield by Using an Artificial Neural Network. Mar. Drugs 2022, 20, 675. [Google Scholar] [CrossRef]
- Cosme, F.; Vilela, A. Chitin and Chitosan in the Alcoholic and Non-Alcoholic Beverage Industry: An Overview. Appl. Sci. 2021, 11, 11427. [Google Scholar] [CrossRef]
- Dolgopiatova, N.; Kuchina, Y.; Dyakina, T.; Volkova, T. Effect of heterogeneous deacetylation on the properties of northern shrimp chitin and chitosan. KnE Life Sci. 2020, 2020, 315–324. [Google Scholar] [CrossRef]
- Ma, X.; Yang, M.; He, Y.; Zhai, C.; Li, C. A review on the production, structure, bioactivities and applications of Tremella polysaccharides. Int. J. Immunopathol. Pharmacol. 2021, 35, 205873842110005. [Google Scholar] [CrossRef] [PubMed]
- Jones, M.; Kujundzic, M.; John, S.; Bismarck, A. Crab vs. Mushroom: A Review of Crustacean and Fungal Chitin in Wound Treatment. Mar. Drugs 2020, 18, 64. [Google Scholar] [CrossRef]
- Nikolova, D.; Simeonov, M.; Tzachev, C.; Apostolov, A.; Christov, L.; Vassileva, E. Polyelectrolyte complexes of chitosan and sodium alginate as a drug delivery system for diclofenac sodium. Polym. Int. 2022, 71, 668–678. [Google Scholar] [CrossRef]
- Oh, J.W.; Chun, S.C.; Chandrasekaran, M. Preparation and In Vitro Characterization of Chitosan Nanoparticles and Their Broad-Spectrum Antifungal Action Compared to Antibacterial Activities against Phytopathogens of Tomato. Agronomy 2019, 9, 21. [Google Scholar] [CrossRef]
- Wolfgong, W.J. Chemical analysis techniques for failure analysis. In Handbook of Materials Failure Analysis with Case Studies from the Aerospace and Automotive Industries; Butterworth-Heinemann: Oxford, UK, 2016; Volume 1, pp. 279–307. [Google Scholar]
- Nandiyanto, A.B.D.; Oktiani, R.; Ragadhita, R. How to Read and Interpret FTIR Spectroscope of Organic Material. Indones. J. Sci. Technol. 2019, 4, 97. [Google Scholar] [CrossRef]
- Kasaai, M. A review of several reported procedures to determine the degree of N-acetylation for chitin and chitosan using infrared spectroscopy. Carbohydr. Polym. 2008, 71, 497–508. [Google Scholar] [CrossRef]
- Escárcega-Galaz, A.A.; Sánchez-Machado, D.I.; López-Cervantes, J.; Sanches-Silva, A.; Madera-Santana, T.J.; Paseiro-Losada, P. Mechanical, structural and physical aspects of chitosan-based films as antimicrobial dressings. Int. J. Biol. Macromol. 2018, 116, 472–481. [Google Scholar] [CrossRef]
- He, X.; Li, K.; Xing, R.; Liu, S.; Hu, L.; Li, P. The production of fully deacetylated chitosan by compression method. Egypt. J. Aquat. Res. 2016, 42, 75–81. [Google Scholar] [CrossRef]
- Schmitz, C.; González Auza, L.; Koberidze, D.; Rasche, S.; Fischer, R.; Bortesi, L. Conversion of chitin to defined chitosan oligomers: Current status and future prospects. Mar. Drugs 2019, 17, 452. [Google Scholar] [CrossRef]
- Pakizeh, M.; Moradi, A.; Ghassemi, T. Chemical extraction and modification of chitin and chitosan from shrimp shells. Eur. Polym. J. 2021, 159, 110709. [Google Scholar] [CrossRef]
- Islam, N.; Dmour, I.; Taha, M.O. Degradability of chitosan micro/nanoparticles for pulmonary drug delivery. Heliyon 2019, 5, e01684. [Google Scholar] [CrossRef] [PubMed]
- Ghannam, H.E.; Talab, A.; Dolgano, N.; Husse, A.; Abdelmagui, N.M. Characterization of Chitosan Extracted from Different Crustacean Shell Wastes. Res. J. Appl. Sci. 2016, 16, 454–461. [Google Scholar] [CrossRef]
- Sreelekshmi, R.S.; Alex, L.; Jose, J.J. Shelf-Life Specific Moisture Variation in Chitosan of Genus Fenneropenaeus Distributed Along Arabian Sea, India. PhD Thesis, University of Kerala, Thiruvananthapuram, India, 2022. [Google Scholar]
- Aranaz, I.; Alcántara, A.R.; Civera, M.C.; Arias, C.; Elorza, B.; Heras Caballero, A.; Acosta, N. Chitosan: An Overview of Its Properties and Applications. Polymer 2021, 13, 3256–3265. [Google Scholar] [CrossRef]
- Wu, M.; Long, Z.; Xiao, H.; Dong, C. Recent research progress on preparation and application of N, N, N-trimethyl chitosan. Carbohydr. Res. 2016, 434, 27–32. [Google Scholar] [CrossRef]


| Type of Fungus | Chitin Yield (%) | Chitosan Yield (%) |
|---|---|---|
| H. erinaceus | 17.13 ± 1.33 c | 2.69 ± 0.22 bc |
| L. edodes | 35.17 ± 4.25 b | 4.28 ± 0.35 b |
| P. ostreatus | 6.38 ± 0.64 d | 4.08 ± 0.39 b |
| A. auricula-judae | 55.97 ± 3.62 a | 15.67 ± 1.90 a |
| T. fuciformis | 2.74 ± 0.78 d | 2.74 ± 0.78 d |
| Type of Fungus | Moisture Content (%) | Ash Content (%) |
|---|---|---|
| H. erinaceus | 3.520 ± 0.24 ab | 7.817 ± 0.24 d |
| L. edodes | 8.443 ± 0.59 c | 8.140 ± 0.59 d |
| P. ostreatus | 2.803 ± 0.61 a | 5.690 ± 0.61 c |
| A. auricula-judae | 3.440 ± 0.35 ab | 6.743 ± 0.35 cd |
| T. fuciformis | 2.910 ± 0.86 a | 2.997 ± 0.86 b |
| Crab Chitosan | 5.013 ± 0.26 b | 0.597 ± 0.26 a |
| Type of Fungus | Hand Sampling | Banana Sampling |
|---|---|---|
| H. erinaceus | 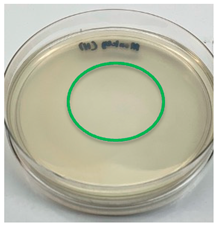 | 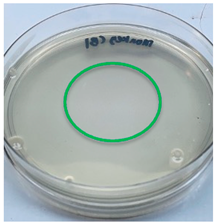 |
| L. edodes | 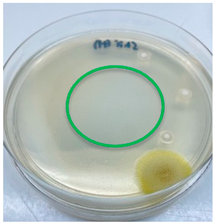 | 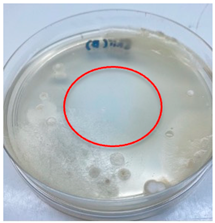 |
| P. ostreatus |  | 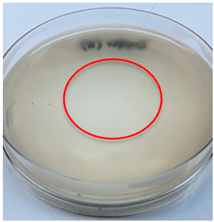 |
| A. auricula-judae | 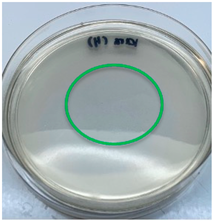 |  |
| T. fuciformis |  |  |
| Crab chitosan | 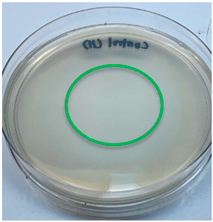 | 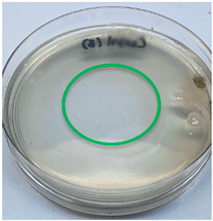 |
| Control (distilled water) | 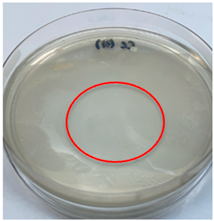 |  |
Disclaimer/Publisher’s Note: The statements, opinions and data contained in all publications are solely those of the individual author(s) and contributor(s) and not of MDPI and/or the editor(s). MDPI and/or the editor(s) disclaim responsibility for any injury to people or property resulting from any ideas, methods, instructions or products referred to in the content. |
© 2023 by the authors. Licensee MDPI, Basel, Switzerland. This article is an open access article distributed under the terms and conditions of the Creative Commons Attribution (CC BY) license (https://creativecommons.org/licenses/by/4.0/).
Share and Cite
Lam, I.L.J.; Mohd Affandy, M.A.; ‘Aqilah, N.M.N.; Vonnie, J.M.; Felicia, W.X.L.; Rovina, K. Physicochemical Characterization and Antimicrobial Analysis of Vegetal Chitosan Extracted from Distinct Forest Fungi Species. Polymers 2023, 15, 2328. https://doi.org/10.3390/polym15102328
Lam ILJ, Mohd Affandy MA, ‘Aqilah NMN, Vonnie JM, Felicia WXL, Rovina K. Physicochemical Characterization and Antimicrobial Analysis of Vegetal Chitosan Extracted from Distinct Forest Fungi Species. Polymers. 2023; 15(10):2328. https://doi.org/10.3390/polym15102328
Chicago/Turabian StyleLam, Iversen Luk Jun, Mariah Aqilah Mohd Affandy, Nasir Md Nur ‘Aqilah, Joseph Merillyn Vonnie, Wen Xia Ling Felicia, and Kobun Rovina. 2023. "Physicochemical Characterization and Antimicrobial Analysis of Vegetal Chitosan Extracted from Distinct Forest Fungi Species" Polymers 15, no. 10: 2328. https://doi.org/10.3390/polym15102328