
Bonding Performance of Glass Fiber-Reinforced Polymer Bars under the Influence of Deformation Characteristics

Abstract
:1. Introduction
2. Methodology
2.1. Materials
2.2. Test Design
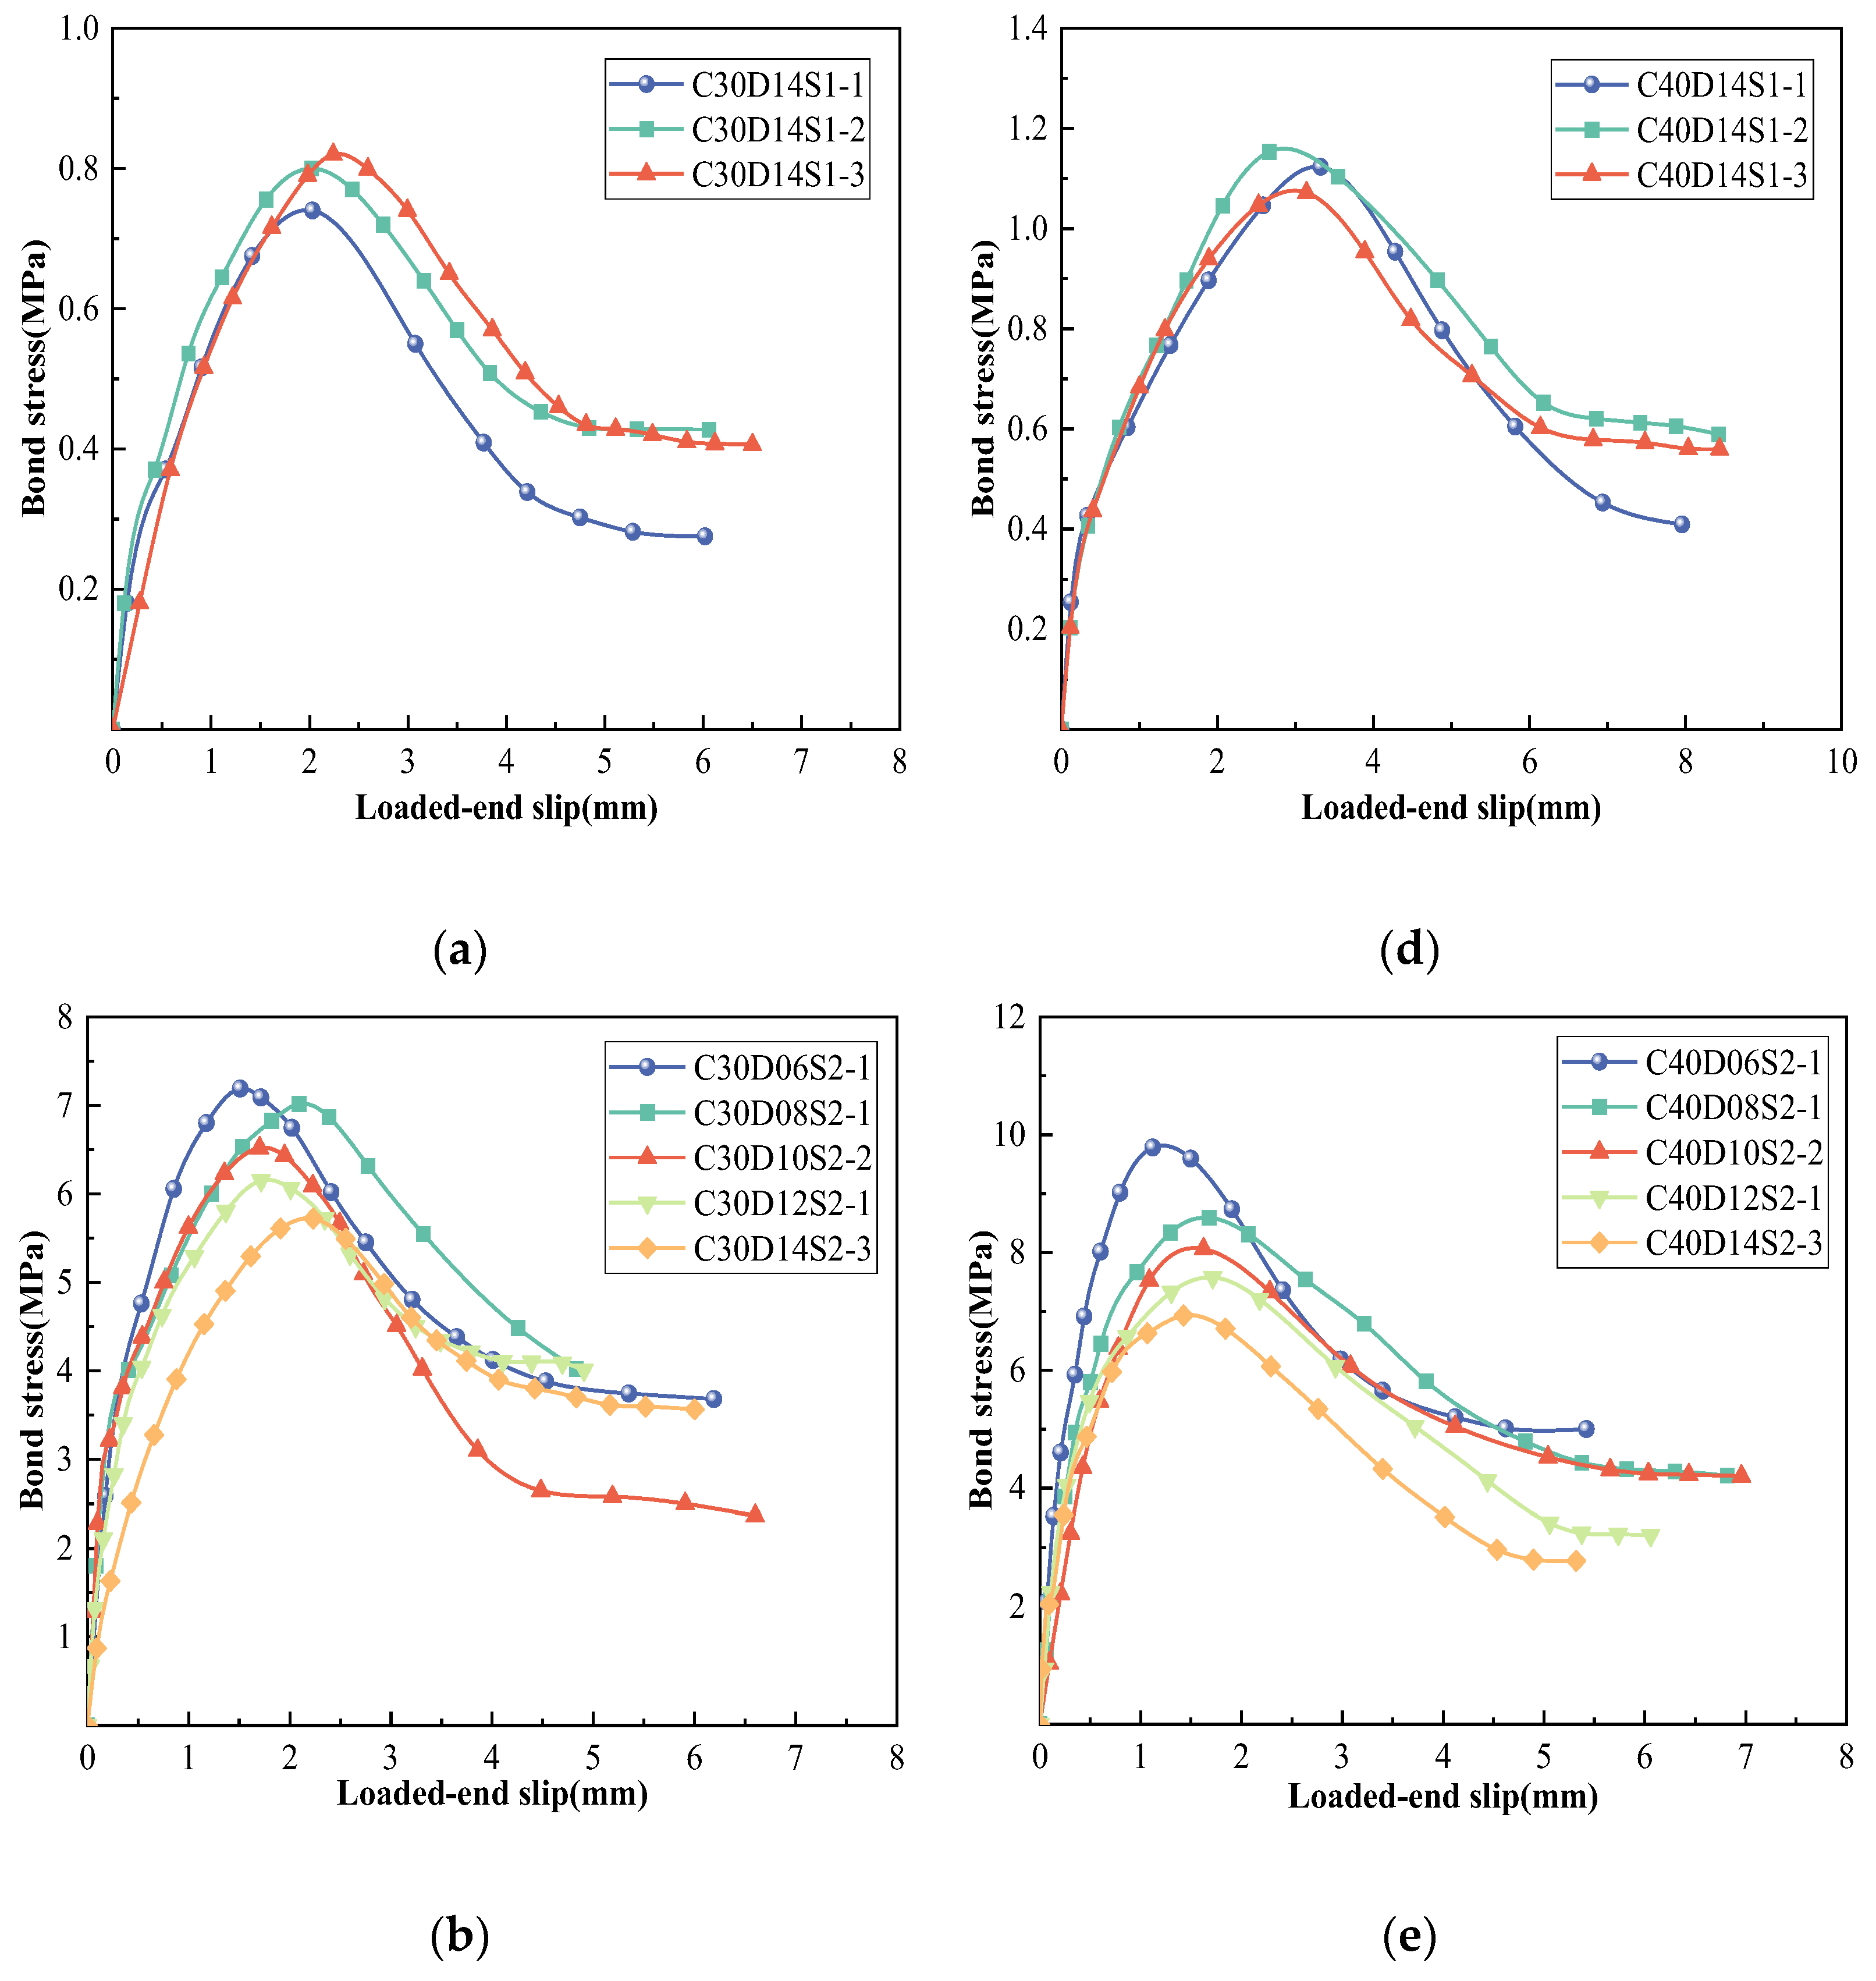
3. Results
4. Engineering Characteristics
5. Bond–Slip Model Prediction
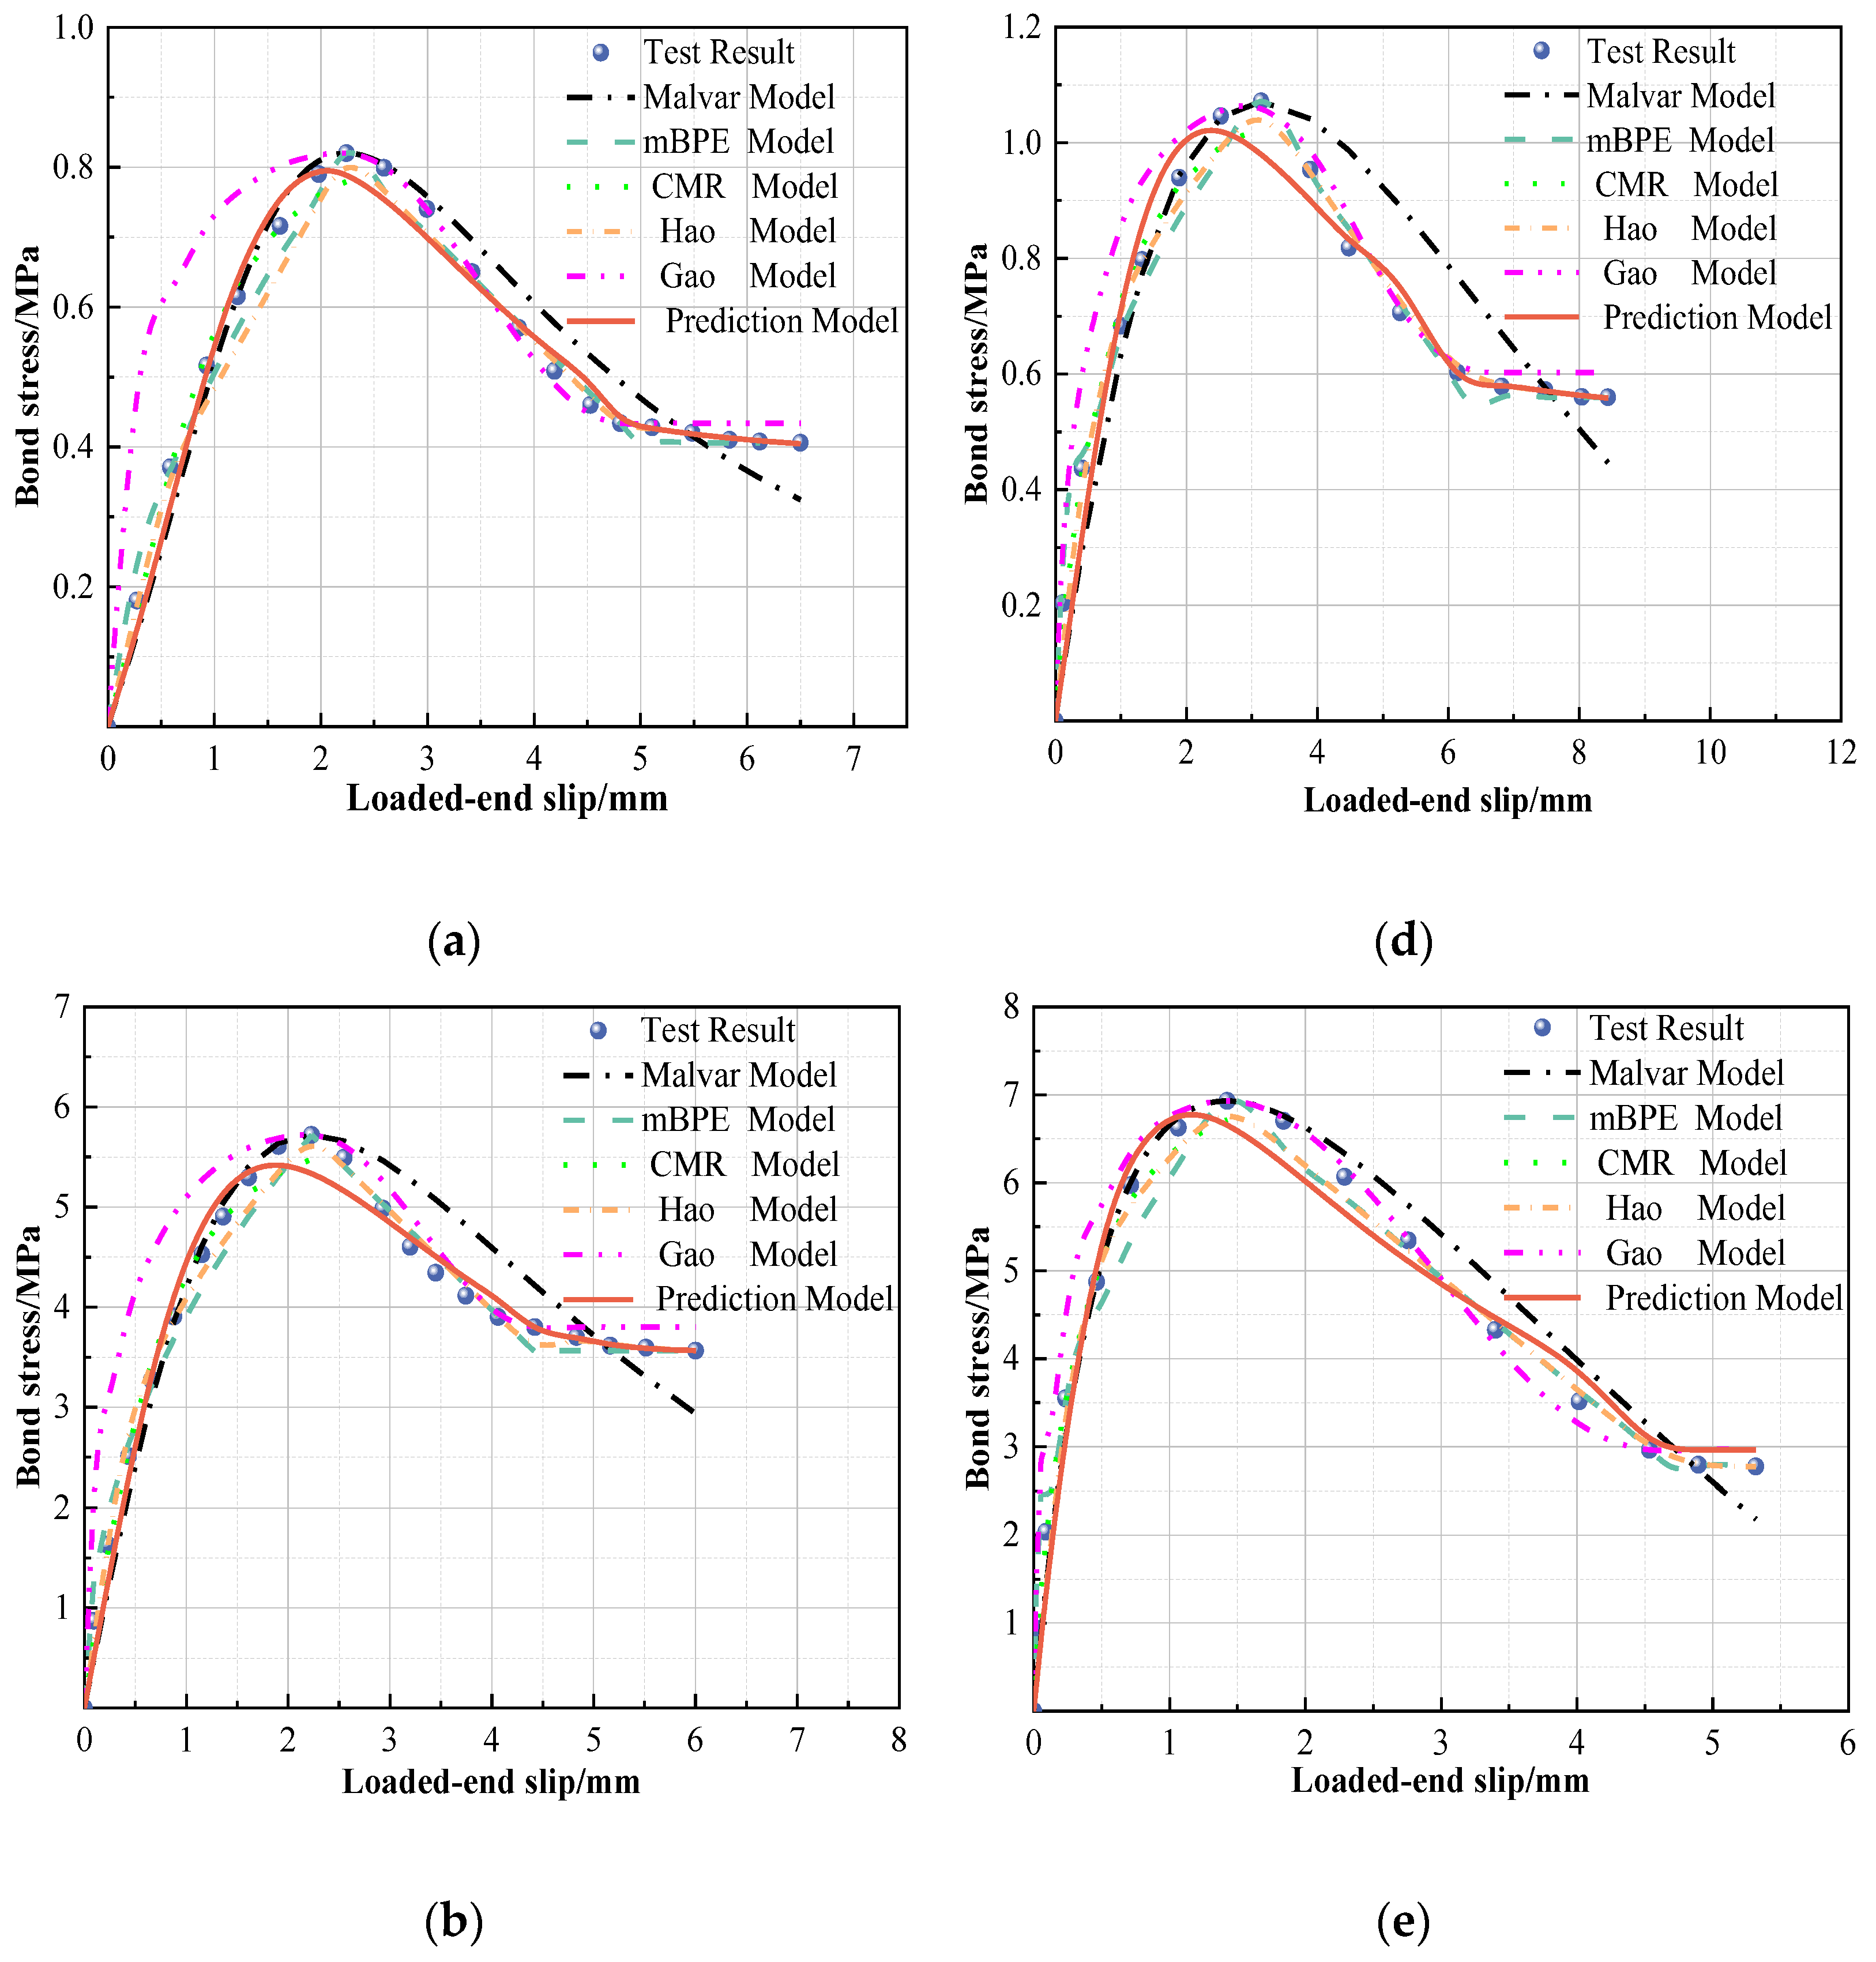
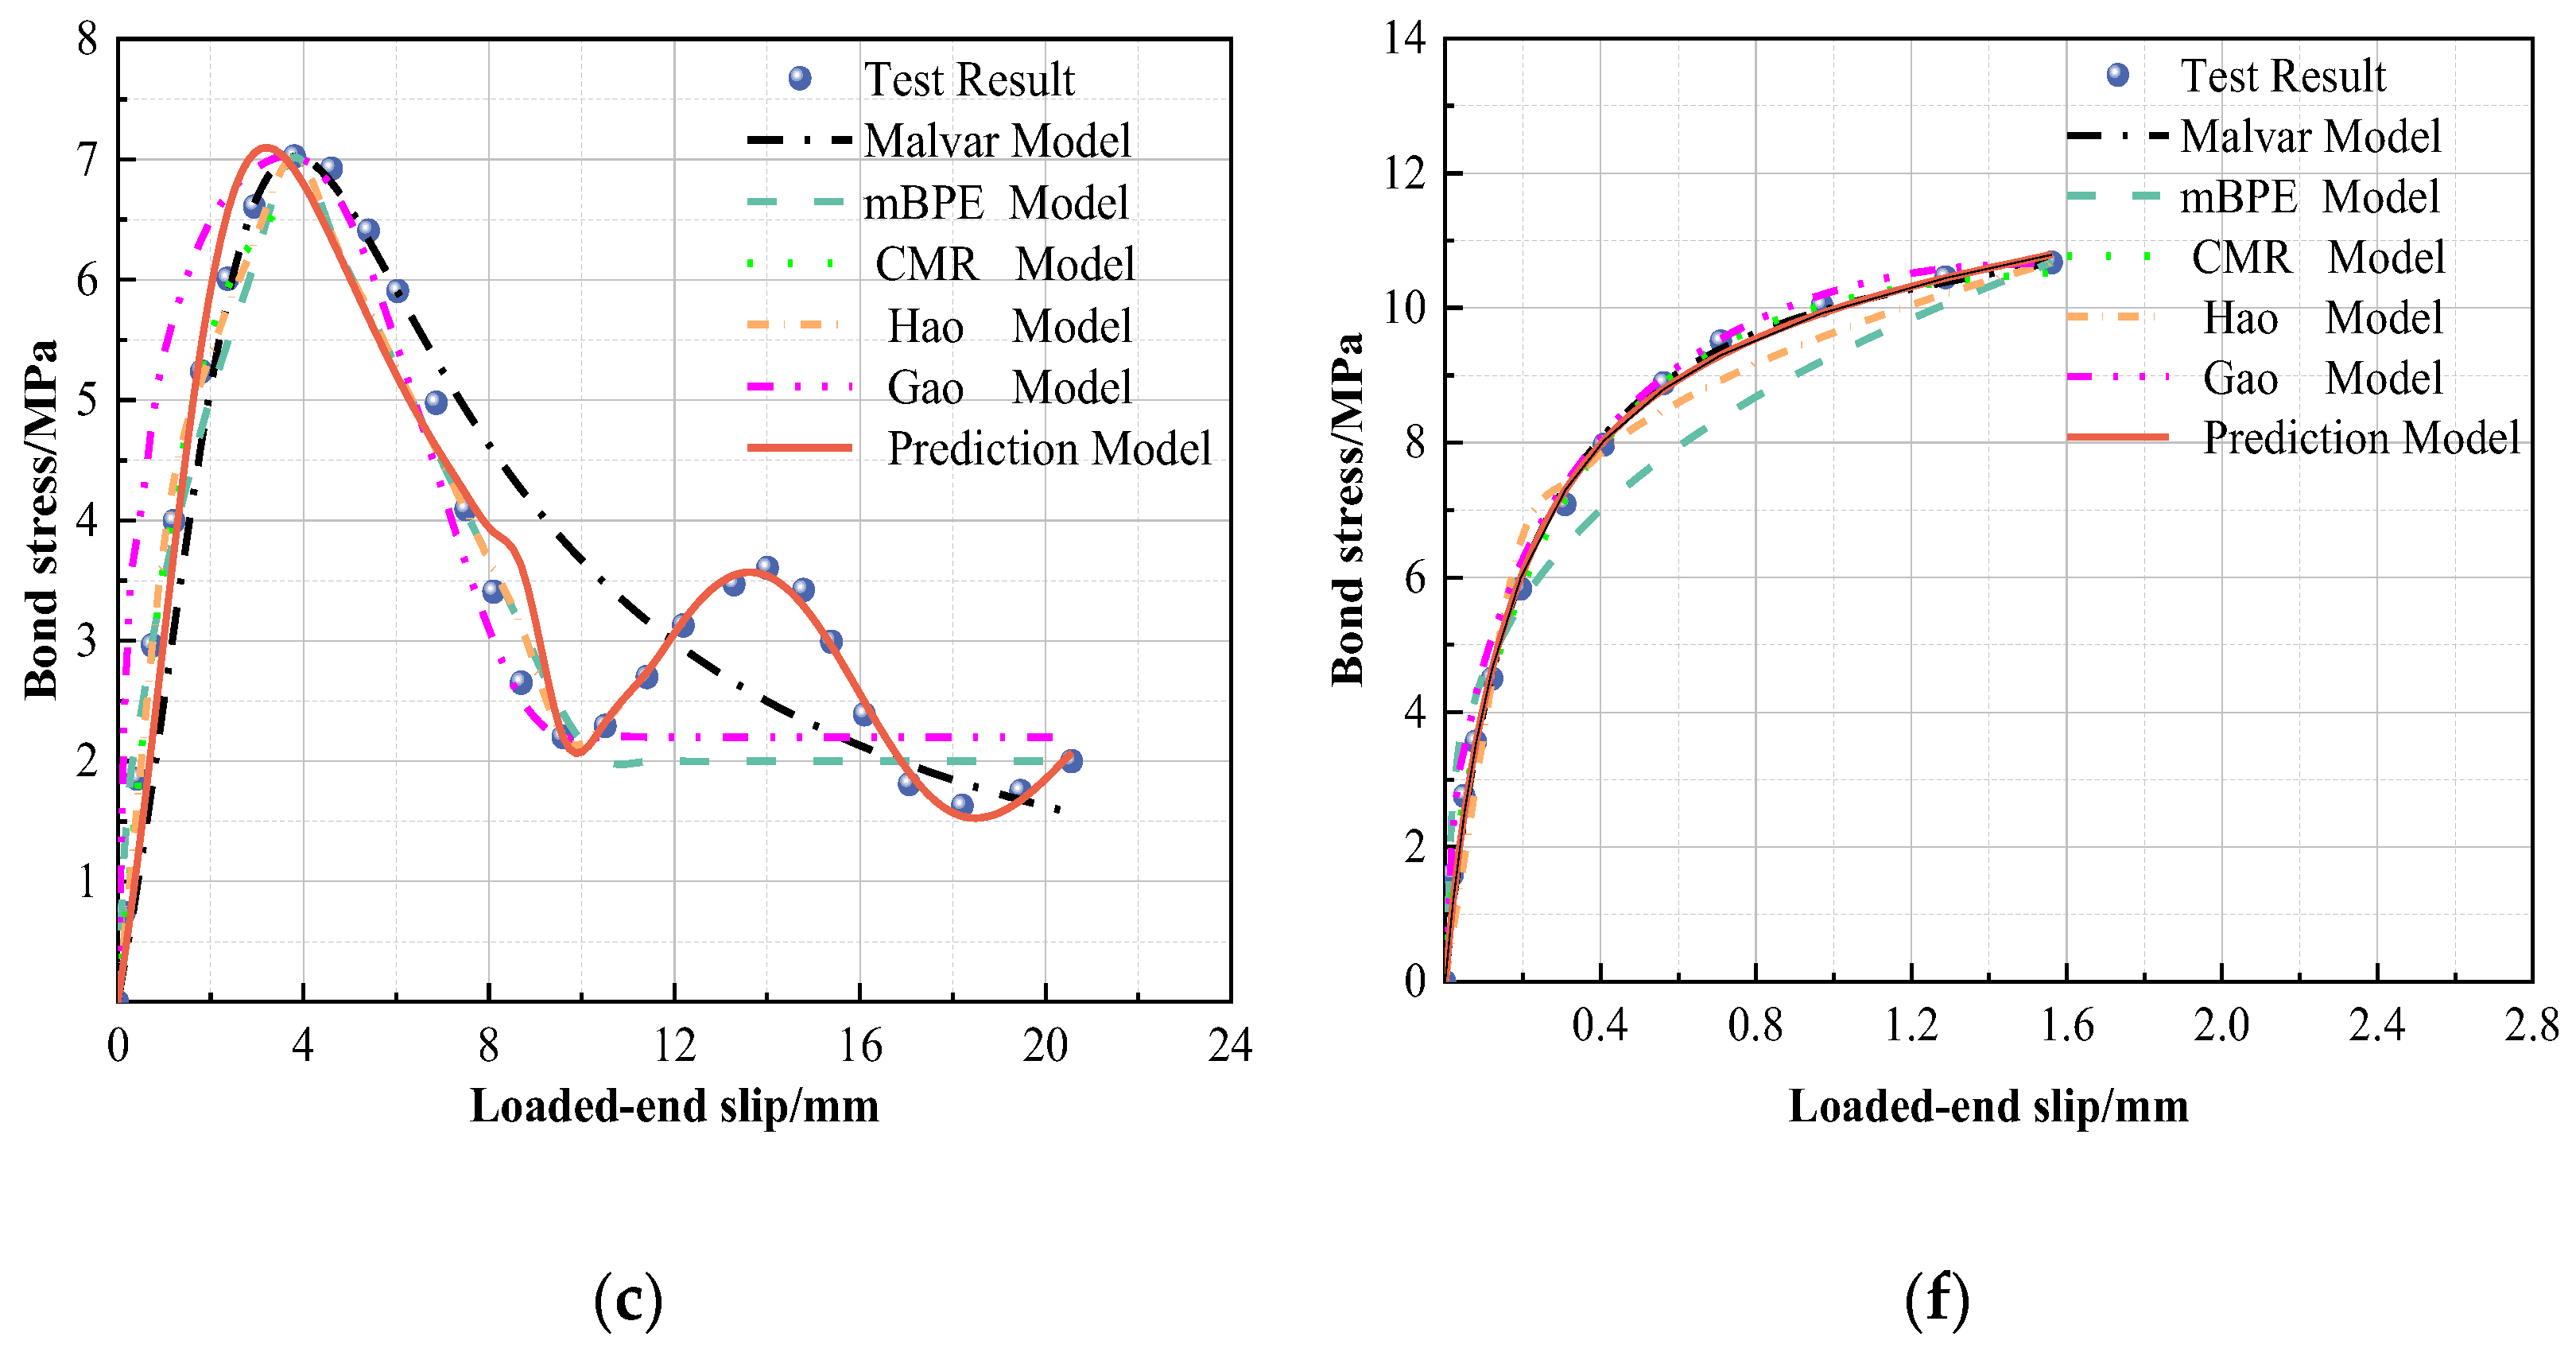
5.1. Calibration of Test Results with Existing Model
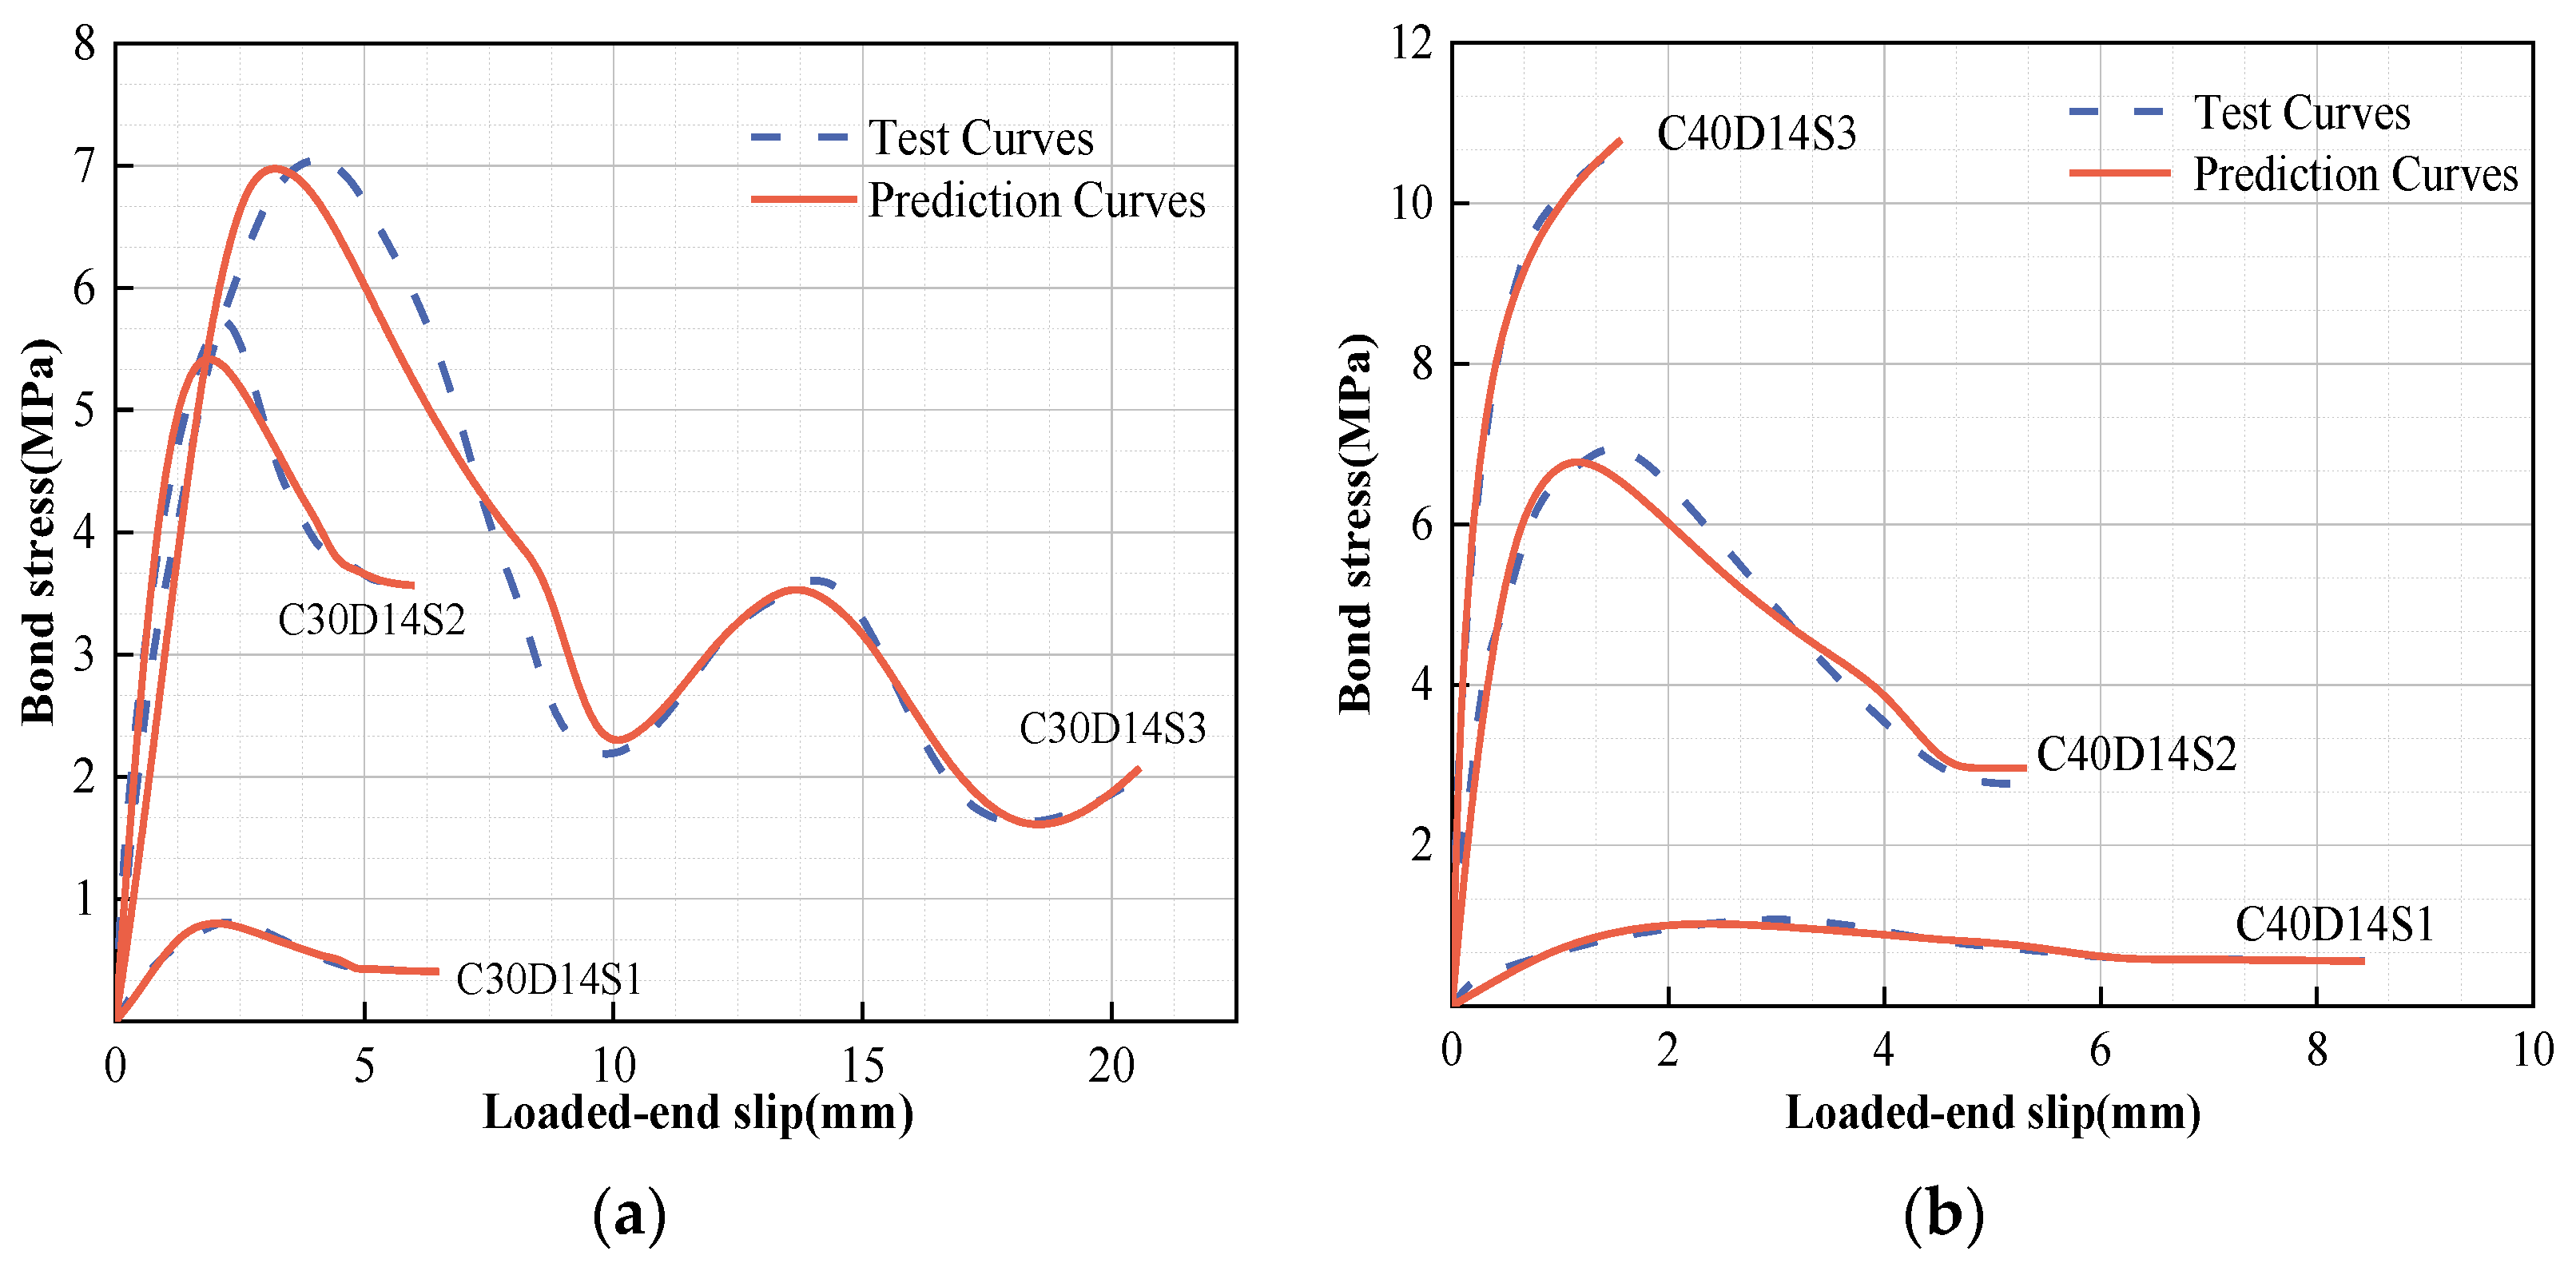
5.2. Simplified Constitutive Model
6. Conclusions
- While increasing the deformation coefficient from 39% (S1) to 44% (S2) and 53% (S3), the bond strength for C30S2 and C30S3 increased by 630% and 840%, respectively relative to that of C30S1, and by 530% and 850%, respectively, for C40S2 and C40S3, relative to that of C40S1. Additionally, when increasing the compressive strength of the concrete from 31 to 41 MPa, the bond strengths of the specimens increased by 20%–44%. Meanwhile, the bond strength of the specimen decreased by approximately 5% on average per 2 mm when increasing the diameter of the GFRP bars.
- While both the deformation coefficient and concrete strength of the GFRP bars were increased, the bond failure mode of the composite member will be more likely changed from a typical pull-out failure to a concrete splitting failure. In engineering applications, much more attention should be paid to the joint effect on both the bar deformation coefficients and concrete strengths, in order to achieve a composite design with a balance of structural strength and engineering performance.
- Members with larger deformation coefficients and moderate concrete grades generally have excellent mechanical and engineering properties. The S3 GFRP bar was recommended for use in concrete C30 as an alternative to steel bars thanks to its superior performance. The total energy dissipation and ductility of C30S3 members are 200% to 250% relative to that of steel members.
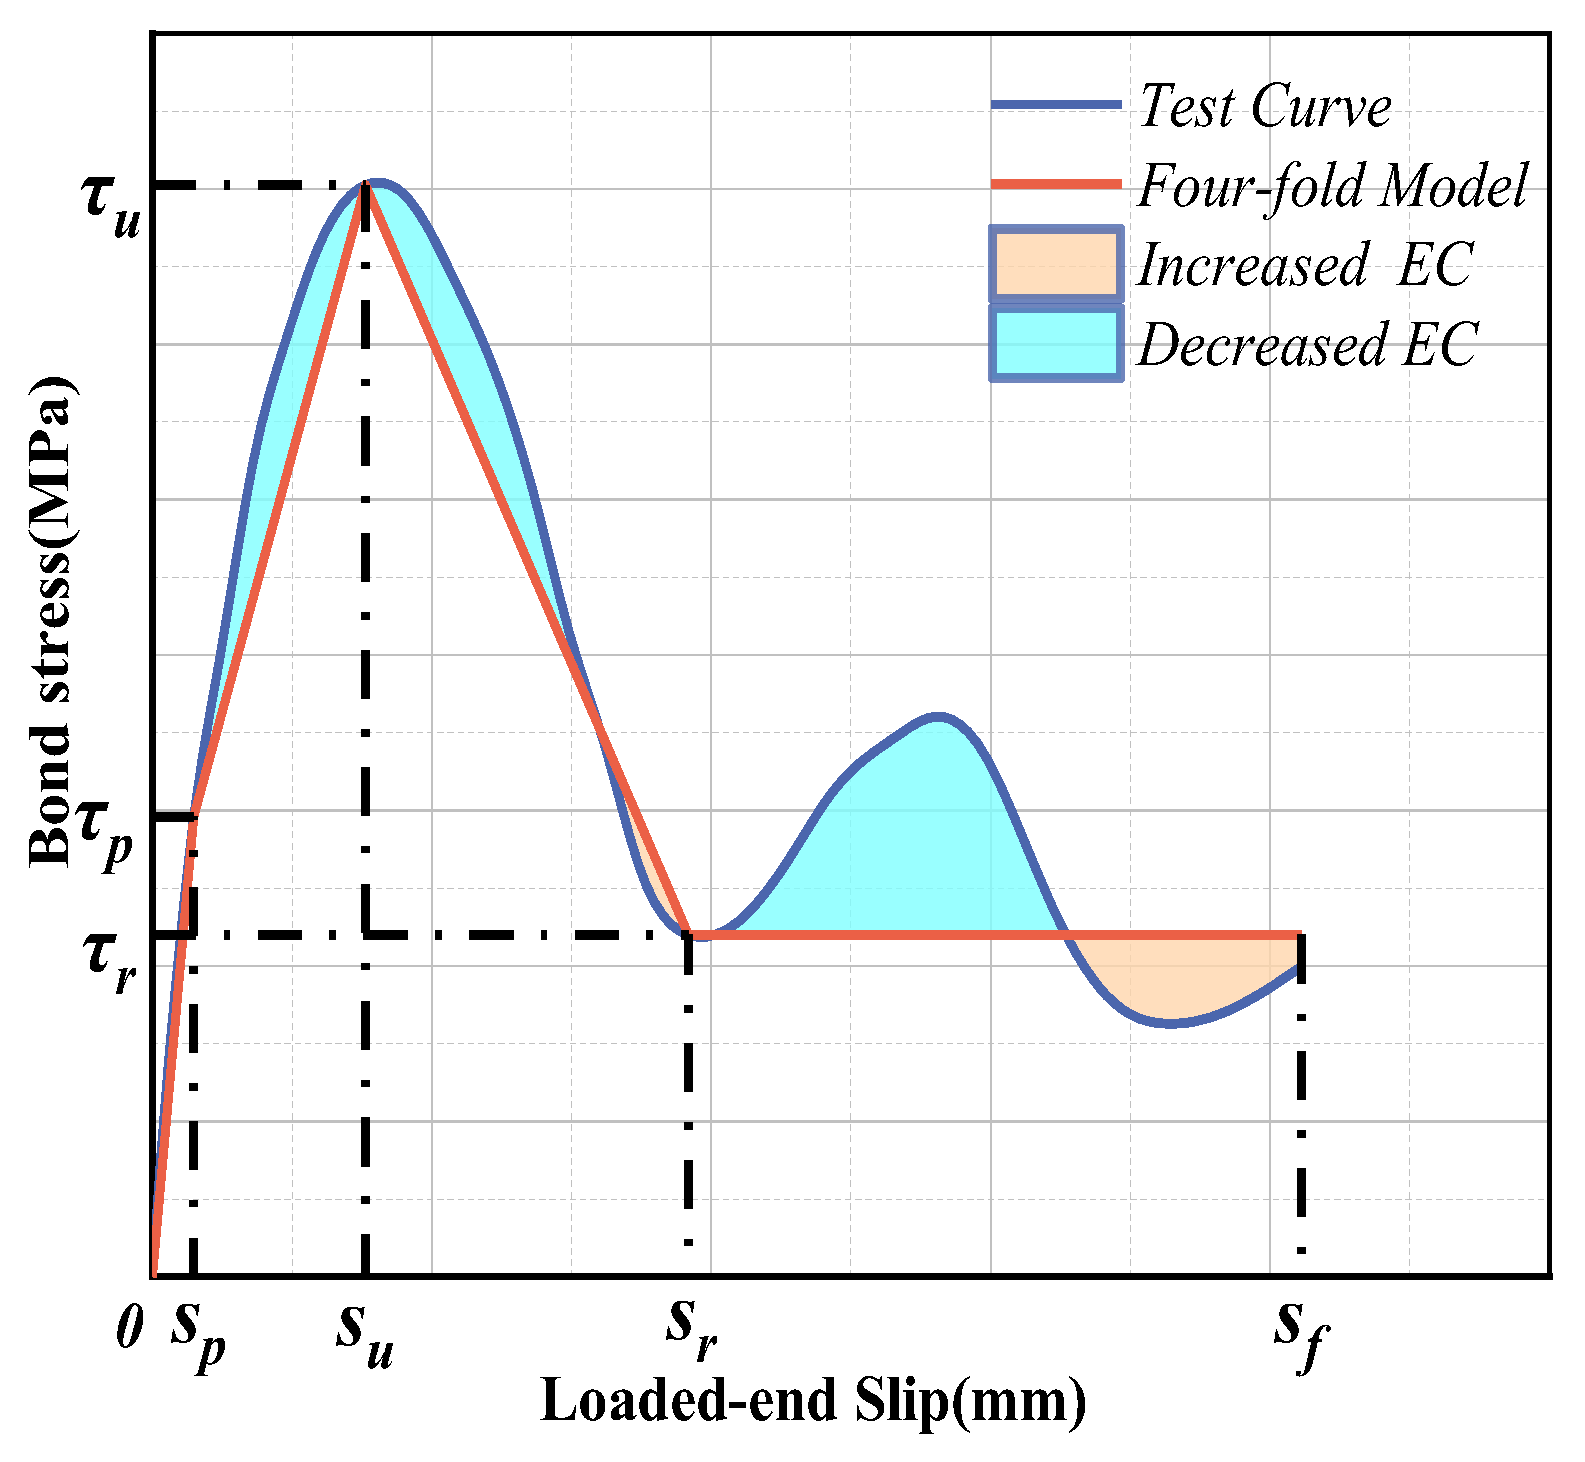
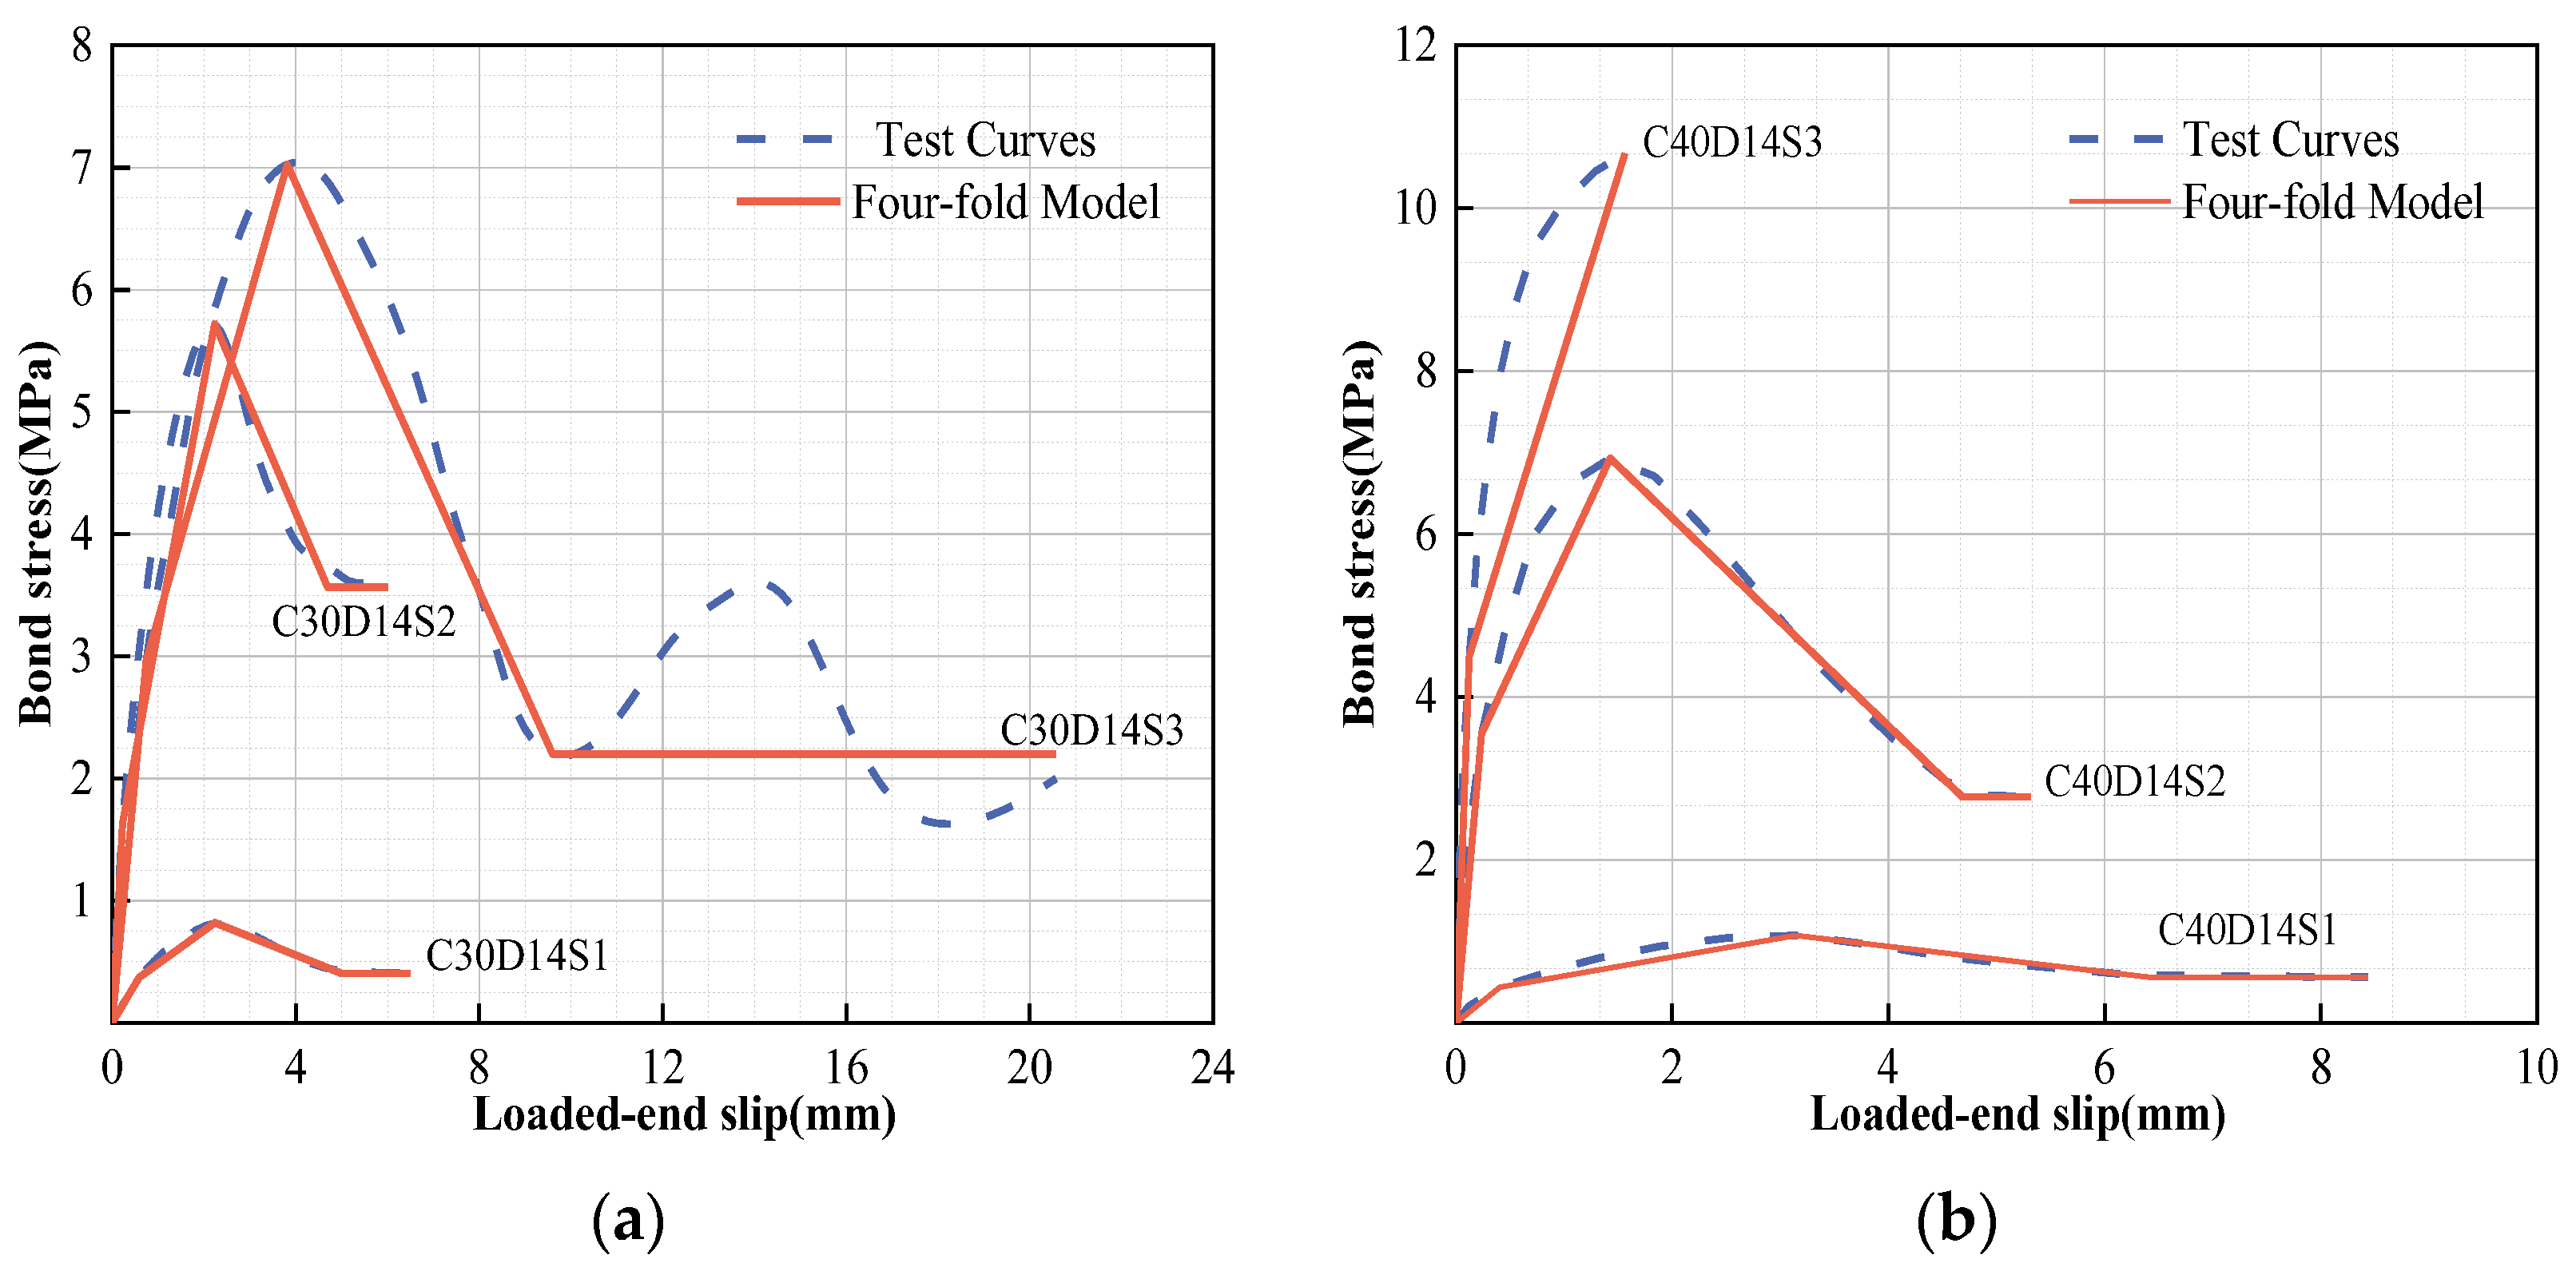
- When compared with the existing bond and slip constitutive models, the proposed curve prediction model can better exhibit the unique influence of deformation coefficients on bonding behavior and the engineering performance of GFRP bars. The four-fold model, which is slightly conservative at approximately 83–99% of the actual energy consumption, is able to provide a better balanced design with original constitutive characteristics and engineering performance.
Author Contributions
Funding
Institutional Review Board Statement
Data Availability Statement
Acknowledgments
Conflicts of Interest
References
- Toimil, A.; Losada, I.J.; Nicholls, R.J.; Dalrymple, R.A.; Stive, M.J. Addressing the challenges of climate change risks and adaptation in coastal areas: A review. Coast. Eng. 2020, 156, 103611. [Google Scholar] [CrossRef]
- Lin, B.B.; Ossola, A.; Alberti, M.; Andersson, E.; Bai, X.; Dobbs, C.; Elmqvist, T.; Evans, K.L.; Frantzeskaki, N.; A Fuller, R.; et al. Integrating solutions to adapt cities for climate change. Lancet Planet. Health 2021, 5, e479–e486. [Google Scholar] [CrossRef] [PubMed]
- Mishra, V.; Sadhu, A. Towards the effect of climate change in structural loads of urban infrastructure: A review. Sustain. Cities Soc. 2022, 89, 104352. [Google Scholar] [CrossRef]
- El-Gamal, S.; El-Salakawy, E.; Benmokrane, B. Influence of reinforcement on the behavior of concrete bridge deck slabs reinforced with FRP bars. J. Compos. Constr. 2007, 11, 449–458. [Google Scholar] [CrossRef]
- Yuan, F.; Chen, M.; Pan, J. Experimental study on seismic behaviours of hybrid FRP-steel-reinforced ECC-concrete composite columns. Compos. Part B Eng. 2019, 176, 107272. [Google Scholar] [CrossRef]
- Attari, N.; Youcef, Y.S.; Amziane, S. Seismic performance of reinforced concrete beam-column joint strengthening by frp sheets. Structures 2019, 20, 353–364. [Google Scholar] [CrossRef]
- Chen, Y.; Davalos, J.F.; Ray, I.; Kim, H.-Y. Accelerated aging tests for evaluations of durability performance of FRP reinforcing bars for concrete structures. Compos. Struct. 2007, 78, 101–111. [Google Scholar] [CrossRef]
- Chang, Y.; Wang, Y.; Wang, M.; Zhou, Z.; Ou, J. Bond durability and degradation mechanism of GFRP bars in seawater sea-sand concrete under the coupling effect of seawater immersion and sustained load. Constr. Build. Mater. 2021, 307, 124878. [Google Scholar] [CrossRef]
- Dong, S.; Li, C.; Xian, G. Environmental impacts of glass-and carbon-fiber-reinforced polymer bar-reinforced seawater and sea sand concrete beams used in marine environments: An LCA case study. Polymers 2021, 13, 154. [Google Scholar] [CrossRef]
- Jiang, Y.; Lu, J.; Wu, H.; Tan, S.; Zhang, Y.; Cai, X. Analysis of GFRP insulator characteristics under multiphysical fields in electromagnetic rail launchers. Compos. Struct. 2019, 221, 110900. [Google Scholar] [CrossRef]
- Choi, J.; Choi, J.; Kim, H.; Cho, J.; Kim, S. A study on designing the electrical insulation of condenser-type terminations for 154 kV class HTS cables. Phys. C Supercond. 2009, 469, 1707–1711. [Google Scholar] [CrossRef]
- Hamad, R.J.A.; Johari, M.A.M.; Haddad, R.H. Mechanical properties and bond characteristics of different fiber reinforced polymer rebars at elevated temperatures. Constr. Build. Mater. 2017, 142, 521–535. [Google Scholar] [CrossRef]
- Chen, J.; Wang, J.; Xie, F.; Jin, W.-L. Behavior of thin-walled dodecagonal section double skin concrete-filled steel tubes under bending. Thin-Walled Struct. 2016, 98, 293–300. [Google Scholar] [CrossRef]
- Chen, J.; Wang, J.; Xie, F.; Duan, A. Behavior of thin-walled dodecagonal section double skin concrete-filled steel tubular beam-columns. Thin-Walled Struct. 2016, 104, 135–143. [Google Scholar] [CrossRef]
- Xie, F.; Chen, J.; Dong, X.; Feng, B. Flexural behavior of GFRP tubes filled with magnetically driven concrete. Materials 2018, 11, 92. [Google Scholar] [CrossRef] [PubMed] [Green Version]
- Xie, F.; Chen, J.; Yu, Q.Q.; Dong, X. Behavior of cross arms inserted in concrete-filled circular GFRP tubular columns. Materials 2019, 12, 2280. [Google Scholar] [CrossRef] [Green Version]
- Feng, B.; Zhu, Y.-H.; Xie, F.; Chen, J.; Liu, C.-B. Experimental investigation and design of hollow section, centrifugal concrete-filled GFRP tube columns. Buildings 2021, 11, 598. [Google Scholar] [CrossRef]
- Feng, B.; Cheng, Y.; Cui, X. Critical loads of axially compressed GFRP round tubes considering shear deformations. J. Zhejiang Univ. 2015, 55, 1894–1902. [Google Scholar] [CrossRef]
- Malvar, L.J. Tensile and bond properties of GFRP reinforcing bars. Mater. J. 1995, 92, 276–285. [Google Scholar] [CrossRef]
- Micelli, F.; Nanni, A. Durability of FRP rods for concrete structures. Constr. Build. Mater. 2004, 18, 491–503. [Google Scholar] [CrossRef]
- Xie, F.; Yang, H.M.; Liang, M.; Wang, G.; Qiu, H. Study on the tensile and shear properties of GFRP tendons. J. Shaoxing Univ. 2021, 41, 1–8. [Google Scholar] [CrossRef]
- Yan, F.; Lin, Z. Bond behavior of GFRP bar-concrete interface: Damage evolution assessment and FE simulation implementations. Compos. Struct. 2016, 155, 63–76. [Google Scholar] [CrossRef]
- Gudonis, E.; Kacianauskas, R.; Gribniak, V.; Weber, A.; Jakubovskis, R.; Kaklauskas, G. Mechanical properties of the bond between GFRP reinforcing bars and concrete. Mech. Compos. Mater. 2014, 50, 457–466. [Google Scholar] [CrossRef]
- Ehsani, M.R.; Saadatmanesh, H.; Tao, S. Design recommendations for bond of GFRP rebars to concrete. J. Struct. Eng. 1996, 122, 247–254. [Google Scholar] [CrossRef]
- Sofi, M.; van Deventer, J.S.J.; Mendis, P.A.; Lukey, G.C. Bond performance of reinforcing bars in inorganic polymer concrete (IPC). J. Mater. Sci. 2007, 42, 3107–3116. [Google Scholar] [CrossRef]
- Li, W.; Fan, S.; Ho, S.C.M.; Wu, J.; Song, G. Interfacial debonding detection in fiber-reinforced polymer rebar–reinforced concrete using electro-mechanical impedance technique. Struct. Health Monit. 2017, 17, 461–471. [Google Scholar] [CrossRef]
- Büyüköztürk, O.; Yu, T. Far-field radar NDT technique for detecting GFRP debonding from concrete. Constr. Build. Mater. 2009, 23, 1678–1689. [Google Scholar] [CrossRef]
- Xu, K.; Ren, C.; Deng, Q.; Jin, Q.; Chen, X. Real-time monitoring of bond slip between GFRP bar and concrete structure using piezoceramic transducer-enabled active sensing. Sensors 2018, 18, 2653. [Google Scholar] [CrossRef] [Green Version]
- Zhang, L.; Zheng, Y.; Hu, S.; Yang, J.; Xia, L. Identification of bond-slip behavior of GFRP-ECC using smart aggregate transducers. Front. Mater. 2020, 7, 165. [Google Scholar] [CrossRef]
- Achillides, Z.; Pilakoutas, K. Bond behavior of fiber reinforced polymer bars under direct pullout conditions. J. Compos. Constr. 2004, 8, 173–181. [Google Scholar] [CrossRef]
- Okelo, R.; Yuan, R.L. Bond strength of fiber reinforced polymer rebars in normal strength concrete. J. Compos. Constr. 2005, 9, 203–213. [Google Scholar] [CrossRef]
- Lee, J.-Y.; Lim, A.-R.; Kim, J.; Kim, J. Bond behaviour of GFRP bars in high-strength concrete: Bar diameter effect. Mag. Concr. Res. 2017, 69, 541–554. [Google Scholar] [CrossRef]
- Dong, Z.; Wu, G.; Xu, Y. Experimental study on the bond durability between steel-FRP composite bars (SFCBs) and sea sand concrete in ocean environment. Constr. Build. Mater. 2016, 115, 277–284. [Google Scholar] [CrossRef]
- Baena, M.; Torres, L.; Turon, A.; Llorens, M.; Barris, C. Bond behaviour between recycled aggregate concrete and glass fibre reinforced polymer bars. Constr. Build. Mater. 2016, 106, 449–460. [Google Scholar] [CrossRef] [Green Version]
- Shen, D.; Ojha, B.; Shi, X.; Zhang, H.; Shen, J. Bond stress–slip relationship between basalt fiber-reinforced polymer bars and concrete using a pull-out test. J. Reinf. Plast. Compos. 2016, 35, 747–763. [Google Scholar] [CrossRef]
- Tang, W.C.; Lo, T.Y.; Balendran, R.V. Bond performance of polystyrene aggregate concrete (PAC) reinforced with glass-fibre-reinforced polymer (GFRP) bars. Build. Environ. 2008, 43, 98–107. [Google Scholar] [CrossRef]
- Henin, E.; Morcous, G. Bond behavior of helically wrapped sand coated deformed Glass Fiber-Reinforced Polymer (GFRP) bars in concrete. Constr. Build. Mater. 2021, 288, 123120. [Google Scholar] [CrossRef]
- Yoo, D.-Y.; Kwon, K.-Y.; Park, J.-J.; Yoon, Y.-S. Local bond-slip response of GFRP rebar in ultra-high-performance fiber-reinforced concrete. Compos. Struct. 2015, 120, 53–64. [Google Scholar] [CrossRef]
- Yang, S.; Chen, Y.; Du, D.; Fan, G. Determination of boundary effect on shear fracture energy at steel bar–concrete interface. Eng. Fract. Mech. 2016, 153, 319–330. [Google Scholar] [CrossRef]
- Jiang, T.; Wu, Z.; Ye, H.; Fei, X.; Yu Rena, C. Bond behavior of deformed bars in self-compacting lightweight aggregate concrete subjected to lateral tensions. J. Mater. Civ. Eng. 2019, 31, 04019176. [Google Scholar] [CrossRef]
- Pecce, M.; Manfredi, G.; Realfonzo, R.; Cosenza, E. Experimental and analytical evaluation of bond properties of GFRP bars. J. Mater. Civ. Eng. 2001, 13, 282–290. [Google Scholar] [CrossRef] [Green Version]
- Masmoudi, R.; Masmoudi, A.; Ouezdou, M.B.; Daoud, A. Long-term bond performance of GFRP bars in concrete under temperature ranging from 20 °C to 80 °C. Constr. Build. Mater. 2011, 25, 486–493. [Google Scholar] [CrossRef]
- Fursa, T.V.; Utsyn, G.E.; Korzenok, I.N.; Petrov, M.V.; Reutov, Y.A. Using electric response to mechanical impact for evaluating the durability of the GFRP-concrete bond during the freeze-thaw process. Compos. Part B Eng. 2016, 90, 392–398. [Google Scholar] [CrossRef]
- Kim, B.; Doh, J.H.; Yi, C.K.; Lee, J.Y. Effects of structural fibers on bonding mechanism changes in interface between GFRP bar and concrete. Compos. Part B Eng. 2013, 45, 768–779. [Google Scholar] [CrossRef]
- Arias, J.P.M.; Vazquez, A.; Escobar, M.M. Use of sand coating to improve bonding between GFRP bars and concrete. J. Compos. Mater. 2012, 46, 2271–2278. [Google Scholar] [CrossRef]
- Aiello, M.A.; Leone, M.; Pecce, M. Bond performances of FRP rebars-reinforced concrete. J. Mater. Civ. Eng. 2007, 19, 205–213. [Google Scholar] [CrossRef]
- Baena, M.; Torres, L.; Turon, A.; Barris, C. Experimental study of bond behaviour between concrete and FRP bars using a pull-out test. Compos. Part B Eng. 2009, 40, 784–797. [Google Scholar] [CrossRef]
- Malvar, L.J. Bond Stress-Slip Characteristics of FRP Rebars; Defense Technical Information Center: Fort Belvoir, VA, USA, 1994.
- Eligehausen, R.; Popov, E.P.; Bertero, V.V. Local Bond Stress-Slip Relationships of Deformed Bars under Generalized Excitations; Earthquake Engineering Research Center: Oakland, CA, USA, 1982. [Google Scholar]
- Cosenza, E.; Manfredi, G.; Realfonzo, R. Analytical modeling of bond between FRP reinforcing barsand concrete. In Non-Metallic (FRP) Reinforcement for Concrete Structures; Taerwe, L., Ed.; E and FN Spon: London, UK, 1995; pp. 164–171. [Google Scholar]
- Cosenza, E.; Manfredi, G.; Realfonzo, R. Behavior and modeling of bond of FRP rebars to concrete. J. Compos. Constr. 1997, 1, 40–51. [Google Scholar] [CrossRef]
- Hao, Q.D.; Wang, Y.L.; Hou, J.L. Experimental study on the bond performance of GFRP ribbed bars. Eng. Mech. 2008, 10, 158–165+179. [Google Scholar]
- Gao, D.Y.; Zhu, H.T.; Xie, J.J. Bond-slip constitutive model of fiber reinforced plastic bar concrete. Ind. Constr. 2003, 7, 41–43+82. [Google Scholar] [CrossRef]
- ACI 440.3R-04; Guide Test Methods for Fiber-Reinforced Polymers (FRPs) for Reinforcing or Strengthening Concrete Structures, ACI Committee 440. American Concrete Institute: Farmington Hills, MI, USA, 2004.
- BS EN12390; Testing Hardened Concrete-Part 3: Compressive Strength of Test Specimens. British Standards Institution: London, UK, 2009.
- Abosrra, L.; Ashour, A.F.; Youseffi, M. Corrosion of steel reinforcement in concrete of different compressive strengths. Constr. Build. Mater. 2011, 25, 3915–3925. [Google Scholar] [CrossRef]
- An, X.; Wang, L.; Jiang, Y.; Zhang, C.; Liu, H. Study on bonding properties between deformed steel bars and recycled concrete. J. Hebei Univ. Eng. 2022, 39, 60–64+83. [Google Scholar] [CrossRef]
- Chu, S.H.; Kwan, A.K.H. A new bond model for reinforcing bars in steel fibre reinforced concrete. Cem. Concr. Compos. 2019, 104, 103405. [Google Scholar] [CrossRef]
- GB 50010-2010; Code for Design of Concrete Structure. China State Construction Industry Press: Beijing, China, 2010.
- Alsiwat, J.M.; Saatcioglu, M. Reinforcement anchorage slip under monotonic loading. J. Struct. Eng. 1992, 118, 2421–2438. [Google Scholar] [CrossRef]
- Harajli, M.H. Development/splice strength of reinforcing bars embedded in plain and fiber reinforced concrete. Struct. J. 1994, 91, 511–520. [Google Scholar] [CrossRef]


| Concrete Type | Water (%) | Cement (%) | Fine Aggregate (%) | Coarse Aggregate (%) | Compressive Strength (MPa) |
|---|---|---|---|---|---|
| C30 | 7.7 | 13.5 | 27.6 | 51.2 | 31.40 |
| C40 | 7.6 | 17.1 | 23.3 | 52.0 | 41.25 |
| GFRP Bar Type | Diameter (mm) | Epoxy Resin (%) | Glass Fibers (%) | Elastic Modulus (GPa) | Tensile Strength (MPa) |
|---|---|---|---|---|---|
| S1 | 14 | 25 | 75 | 50.00 ± 0.20 | 1013.54 ± 49.97 |
| S2 | 6 | 25 | 75 | 46.10 ± 0.11 | 1264.76 ± 50.56 |
| 8 | 25 | 75 | 47.16 ± 0.36 | 1149.10 ± 45.90 | |
| 10 | 25 | 75 | 46.84 ± 0.34 | 1101.73 ± 36.07 | |
| 12 | 25 | 75 | 48.21 ± 0.19 | 1096.27 ± 28.53 | |
| 14 | 25 | 75 | 50.71 ± 0.51 | 945.64 ± 18.53 | |
| S3 | 14 | 25 | 75 | 47.81 ± 0.20 | 860.00 ± 39.99 |
| Test Specimen | Compressive Strength (MPa) | Diameter (mm) | Bar Type | Rib Height (mm) | Rib Spacing (mm) | Rib Width (mm) | Rc (%) | Anchor Length (mm) | τu (MPa) | Failure Mode | D | IR | IT | EC |
|---|---|---|---|---|---|---|---|---|---|---|---|---|---|---|
| C30D14S1 | 31.40 | 14 | S1 | 0.10 | 5.00 | 4.60 | 38.64 | 70 | 0.79 ± 0.03 | P | 4.10 | 0.11 | 3.40 | 3.51 |
| C30D06S2 | 6 | S2 | 0.80 | 8.00 | 6.60 | 44.36 | 50 | 7.34 ± 0.29 | P | 4.68 | 0.23 | 29.71 | 29.94 | |
| C30D08S2 | 8 | 50 | 6.97 ± 0.16 | P | 3.59 | 1.01 | 24.82 | 25.83 | ||||||
| C30D10S2 | 10 | 50 | 6.69 ± 0.34 | P | 4.90 | 0.44 | 25.79 | 26.23 | ||||||
| C30D12S2 | 12 | 60 | 6.12 ± 0.20 | P | 3.19 | 0.20 | 22.76 | 22.96 | ||||||
| C30D14S2 | 14 | 70 | 5.78 ± 0.18 | P | 3.77 | 0.21 | 24.59 | 24.80 | ||||||
| C30D14S3 | 14 | S3 | 1.50 | 10.00 | 6.80 | 52.95 | 70 | 7.41 ± 0.27 | P | 17.76 | 1.19 | 72.98 | 74.17 | |
| C40D14S1 | 41.25 | 14 | S1 | 0.10 | 5.00 | 4.60 | 38.64 | 70 | 1.12 ± 0.03 | P | 5.23 | 0.13 | 6.09 | 6.22 |
| C40D06S2 | 6 | S2 | 0.80 | 8.00 | 6.60 | 44.36 | 50 | 9.75 ± 0.31 | P | 4.30 | 0.26 | 35.80 | 36.06 | |
| C40D08S2 | 8 | 50 | 8.66 ± 0.23 | P | 5.14 | 0.54 | 40.17 | 40.71 | ||||||
| C40D10S2 | 10 | 50 | 8.04 ± 0.27 | P | 5.32 | 0.96 | 37.09 | 38.05 | ||||||
| C40D12S2 | 12 | 60 | 7.62 ± 0.23 | P | 4.34 | 0.62 | 31.13 | 31.75 | ||||||
| C40D14S2 | 14 | 70 | 7.03 ± 0.18 | P | 3.89 | 0.52 | 24.76 | 25.28 | ||||||
| C40D14S3 | 14 | S3 | 1.50 | 10.00 | 6.80 | 52.95 | 70 | 10.69 ± 0.18 | S | 0.00 | 0.34 | 13.21 | 13.55 |
| Rebar Type | Concrete Type | D | Representative Stress | Test Results | Four-Fold Model | Curve Model | |||||||
|---|---|---|---|---|---|---|---|---|---|---|---|---|---|
| τp (MPa) | τu (MPa) | τr (MPa) | IR | IT | EC | IRs | ITs | ECs | R2 | ECf/EC | |||
| S1 class GFRP bar | C30 | 6.19 | 0.37 | 0.82 | 0.41 | 0.11 | 3.40 | 3.51 | 0.11 | 3.28 | 3.39 | 0.9826 | 0.9930 |
| C40 | 8.27 | 0.47 | 1.07 | 0.56 | 0.13 | 6.09 | 6.22 | 0.09 | 5.87 | 5.96 | 0.9680 | 0.9886 | |
| S2 class GFRP bar | C30 | 6.00 | 1.63 | 5.72 | 3.56 | 0.21 | 24.59 | 24.80 | 0.18 | 23.47 | 23.65 | 0.9825 | 0.9952 |
| C40 | 5.32 | 3.55 | 6.93 | 2.77 | 0.52 | 24.76 | 25.28 | 0.42 | 23.81 | 24.23 | 0.9722 | 0.9965 | |
| S3 class GFRP bar | C30 | 21.31 | 2.96 | 7.02 | 2.00 | 1.19 | 72.98 | 74.17 | 1.10 | 66.16 | 67.26 | 0.9552 | 0.9908 |
| C40 | 1.38 | 4.50 | 10.67 | – | 0.34 | 13.21 | 13.55 | 0.27 | 10.93 | 11.20 | 0.9976 | 0.9973 | |
| Steel bar [56] | C30 | 9.01 | 7.97 | 8.83 | 0.90 | 1.16 | 27.25 | 28.41 | 1.05 | 26.60 | 27.75 | – | – |
| C40 | 9.81 | 11.54 | 12.40 | 1.76 | 0.27 | 61.55 | 61.82 | 0.56 | 60.83 | 61.39 | – | – | |
| Steel bar [57] | C30 | 7.00 | 4.71 | 9.38 | 3.11 | 0.77 | 34.13 | 34.90 | 0.63 | 31.96 | 32.59 | – | – |
| Steel bar [58] | C40 | 8.00 | 4.00 | 14.11 | 1.76 | 0.34 | 61.45 | 61.79 | 0.25 | 60.70 | 60.95 | – | – |
Disclaimer/Publisher’s Note: The statements, opinions and data contained in all publications are solely those of the individual author(s) and contributor(s) and not of MDPI and/or the editor(s). MDPI and/or the editor(s) disclaim responsibility for any injury to people or property resulting from any ideas, methods, instructions or products referred to in the content. |
© 2023 by the authors. Licensee MDPI, Basel, Switzerland. This article is an open access article distributed under the terms and conditions of the Creative Commons Attribution (CC BY) license (https://creativecommons.org/licenses/by/4.0/).
Share and Cite
Xie, F.; Tian, W.; Diez, P.; Zlotnik, S.; Gonzalez, A.G. Bonding Performance of Glass Fiber-Reinforced Polymer Bars under the Influence of Deformation Characteristics. Polymers 2023, 15, 2604. https://doi.org/10.3390/polym15122604
Xie F, Tian W, Diez P, Zlotnik S, Gonzalez AG. Bonding Performance of Glass Fiber-Reinforced Polymer Bars under the Influence of Deformation Characteristics. Polymers. 2023; 15(12):2604. https://doi.org/10.3390/polym15122604
Chicago/Turabian StyleXie, Fang, Wanming Tian, Pedro Diez, Sergio Zlotnik, and Alberto Garcia Gonzalez. 2023. "Bonding Performance of Glass Fiber-Reinforced Polymer Bars under the Influence of Deformation Characteristics" Polymers 15, no. 12: 2604. https://doi.org/10.3390/polym15122604