Article

Conformal Cooling Channel Design for Improving Temperature Distribution on the Cavity Surface in the Injection Molding Process

1
Faculty of Mechanical Engineering, Ho Chi Minh City University of Technology and Education, Ho Chi Minh City 71307, Vietnam
2
Faculty of Mechanical Engineering, Industrial University of Ho Chi Minh City, Nguyen Van Bao Street, Ward 4, Go Vap District, Ho Chi Minh City 70000, Vietnam
*
Authors to whom correspondence should be addressed.
Polymers 2023, 15(13), 2793; https://doi.org/10.3390/polym15132793
Submission received: 2 May 2023 / Revised: 14 June 2023 / Accepted: 20 June 2023 / Published: 23 June 2023

Abstract

:
Mold heating is an essential process in plastic injection molding. Raising the temperature of the mold before injecting liquefied plastic can ease the mold-filling process. A cooling channel can be used to transport high-temperature fluids for this purpose, such as hot water or oil. This dual purpose is a cost-effective solution for heating the mold because the target temperature is easily achieved using this method. In addition, a conformal cooling channel (CCC) can provide more efficient mold heating than a straight cooling channel. This study used the response surface methodology to determine the optimum CCC shape for heat distribution in a mold, and the simulation results confirmed its optimization. The average temperature of the mold using a CCC was better than that using a straight cooling channel, and the heat zone was uniform across the mold surface.

1. Introduction

Recently, additive manufacturing (AM) has emerged as a promising manufacturing method that, in many cases, could replace traditional manufacturing methods [1,2,3]. The original material shapes for the AM method are powder or wire, and they are melted and adhered to generate the designed forms. Powder materials require a laser beam or electron beam, which are expensive and high-energy consumption devices, despite the fact that they could build high-resolution parts [4,5,6,7,8]. Compared to powder materials, wire shapes have the merits of saving fusion energy and time during the additive process. Significantly, the metal wire could create high mechanical characteristics that could be applied in marine, aerospace, and automobile industries [9,10,11,12].
The injection-molding process has been widely used to manufacture plastic products of various shapes and sizes owing to its high manufacturing productivity and low associated costs. This process can be separated into four steps: filling/injection, packing, cooling, and ejection. The cooling step is the most important of these four processes and constitutes the most extensive injection-cycle process. Contrastingly, this step severely affects the mold temperature, directly impacting shrinkage; S.-C. Nian et al. [1] showed that the optimal cooling channel system provides a better heat-transfer area. The heat quickly dissipated from the mold and the part deformation decreased by 37% in the warpage, welding line, and sink mark. As discussed by B. Ravikiran et al. [2], the cooling step is the most significant control factor, with a 29.04% contribution that affects the weld line width and sink mark depth. Moreover, these two factors affect the part strength and the optimal cooling time, which could reduce the weld line width and lead to 56.4% and 68.9% sink mark depth and filling ability, respectively, when melting into the cavity. During the cooling process, cooling fluid is used to lower the mold temperature through the cooling channel system, reducing the product temperature to induce solidification [3]. As cooling quality directly affects the quality of the product, temperature uniformity can restrict many defects, specifically, those associated with material warpage and shrinkage.
To prevent the injection issue as mentioned above, the mold temperature is the important factor. Many methods could be used to raise the mold temperature so the melted plastic could easily fill out the mold and prevent the injection issue. The effect of mold temperature on the filling ability of melted plastic has been studied. By using external induction to raise the mold temperature, the filling percentage of the product increased from 10.2% to 100% when heating the mold with the 5 mm inductor coil in 5 s [4]. The gas-assisted method also controls mold temperature, which shows an impressive effect on the injection process, especially with the thin product. With the gas-assisted method, mold temperature reached 158.4 °C in 20 s and the flow length increased from 37.85~41.32 mm with PP plastic and 14.54~15.8 mm with ABS plastic [6]. Hot gas heating could also improve the filling ratio on the microgroove by up to 91% [7]. This method also showed the effectiveness of the thin-wall product; with 300 °C hot gas assisted, the melted plastic could fill the cavity with a thickness of 0.5 mm and an area of 39 × 120 mm [8]. The above methods show high effectiveness of the injection process, but the disadvantage of that method is costly because they require an external component to raise the mold temperature. So, the cooling channel system could be used as an effective method. The cooling channel system is not only responsible for mold cooling through cooling-fluid distribution, but in many cases, it is also used as a straightforward and effective method to heat the mold. However, the shape and drilling process of straight-drilled channels limit their ability to reach optimal cooling and heating targets. The need to avoid cavity interference and the restriction to straight drilling inherently constrains the design of these channels, potentially compromising their cooling efficiency. A practical example of these limitations is evident when straight-drilled channels are utilized to cool a curved cavity. In such a case, the gap between the straight channel and the curved cavity varies, leading to uneven cooling rates across the cavity surface. This inconsistency in cooling can trigger temperature irregularities, culminating in variable shrinkage and potential warpage of the manufactured component [9,10,11].
Adding to these concerns, the ejection of the part from the mold can only happen when the entire cavity has cooled to below the ejection temperature. Consequently, cooling time hinges on both the highest temperature point within the cavity and its local cooling rate. In general, traditional cooling channel systems (straight cooling channels) are shown to be effective with simple product molds of uniform thickness, but in the case of complex product molds with varying thicknesses, conformal cooling channels (CCCs) are considered as they better conform to the mold surface.
Recently, there have been many studies on CCCs, focusing on their effectiveness during the cooling process and the impact this has on product quality. Shaiful et al. [12] analyzed material warpage using Autodesk mold flow and analyzed results using ANOVA and Taguchi. Factors such as the coolant temperature, melt temperature, packing pressure, and packing time affected the injection temperature. The results of these changes were compared to the warpage percent between the straight and CCCs. The results showed that the CCC produced less material warping with optimal parameters based on the cooling channel type than the straight cooling channel (0.2826 mm versus 0.3005 mm). Vojnová et al. [13] studied the benefits of the CCC system in the molding process. The spiral cooling channel was developed, and analysis shows that cooling and production cycle times reduced up to 20% and 10%, respectively. Li et al. [14] studied topology optimization to design CCCs. This study uses the boundary-element method (BEM) for optimizing the cooling channel. An optimal geometric and topologic structure can be obtained for the cooling system by deleting invalid channel sections. The result showed that the cooling effectiveness increased by more than 50% with each case study. However, this has limited practical application as the resulting cooling channel is difficult to manufacture using a traditional machining method.
To address the challenge of manufacturing conformal cooling channels, several solutions [15,16,17] have been suggested. Because of the intricate 3D internal configurations that are a hallmark of optimal conformal cooling (CC) designs, traditional mechanical cutting techniques (subtractive manufacturing) cannot be employed to machine CC channels. Several methodologies for fabricating CC molds have been suggested since the late 1990s, each with its own constraints:
  • Casting [18,19,20]: While casting can produce complex structures, the accuracy and resolution might be compromised, especially for intricate designs. It is also labor-intensive and may not be suitable for high volume production.
  • Milled groove method [21,22,23,24,25]: This method provides better accuracy compared to casting, but it is not feasible for extremely complex geometries. The longevity of the mold might also be compromised due to the stress concentration in the grooved area.
  • Laminated tooling [26,27,28,29,30]: While this method can handle more complex designs, the alignment of layers might be challenging, potentially impacting the accuracy and quality of the final mold.
  • Powder-based additive manufacturing [31,32,33,34]: This method offers great freedom of design, but the resulting molds often have a rough surface finish. It can also be time-consuming and costly, especially for large parts.
  • Hybrid additive/subtractive manufacturing [35,36,37]: This combines the best of both worlds but can be complex to implement and control. It may also require specialized equipment, which increases the overall cost.
To address the aforementioned limitations in existing techniques, this research proposes a new method that combines the wire arc additive manufacturing (WAAM) method with conventional milling [38]. This innovative approach aims to shape the mold plate to include the conformal cooling channel. The following highlights detail the myriad of advantages of this combination:
  • Unleashing creative design possibilities: WAAM facilitates the construction of intricate geometries that traditional methods find challenging or impossible. Once these complex structures are erected, milling steps in to refine and perfect the part. This collaborative effort results in delivering precision and enhancing the quality of the meticulously designed shapes.
  • Material and cost efficiency: WAAM, a form of directed energy deposition (DED) technology, provides stellar material usage efficiency. Since it primarily engages the deposition of wire-fed materials, the resultant waste is negligible, leading to a significant reduction in raw material costs. Further, the subtractive nature of milling is carefully regulated to cut down waste, fostering even greater cost-efficiency.
  • Time-efficient production: The impressive deposition rates of WAAM facilitate a swift production of large components or molds. Subsequently, milling refines these products rapidly and accurately. This amalgamation of processes potentially leads to substantial time savings, especially when compared to the utilization of either technique in isolation.
  • Enhancement of mechanical properties: The layer-by-layer additive procedure inherent to WAAM can culminate in the refinement of mechanical properties, brought about by rapid cooling and grain refinement. This enhancement can be especially observable in the case of alloyed materials.
  • Repair and remanufacturing capabilities: The synergy of WAAM and milling also proves beneficial for mold repair or remanufacturing. It adds material precisely where required and mills it to achieve the perfect, final shape. This strategy prolongs the lifecycle of molds or parts, eliminating the need for a complete overhaul.
  • Hybrid flexibility: The integration of both additive and subtractive methods within a single setup paves the way for remarkable flexibility. By transitioning between processes as required, manufacturers can fine-tune different aspects of production, such as material usage, surface finish, and dimensional accuracy.
While this method brings about several advantages, it is also critical to consider potential challenges such as managing heat input to prevent warping or distortion, overseeing the transition between additive and subtractive processes, and ensuring the compatibility of equipment.
As a solution, additive manufacturing, such as metal three-dimension printing, could create this type of cooling channel. Park and Dang [39] have developed an injection mold with a CCC. They tried to solve an automotive part’s uneven cooling and long cycle times of the molding process. The result shows that the CCC has a more uniform temperature distribution than the traditional cooling channel, and the cooling time is reduced by more than 30%. In 2017, Suchanan et al. [40] investigated the optimization of CCCs by analyzing the cooling time and thermal-mechanical mold interactions. The authors used designs based on experimentation to research the effect of critical design parameters of CCCs on the cooling time and thermo-mechanical performance of molds. However, this research is still limited to simulation; the actual results of this cooling channel still need to be verified by experimentation. Venkatesh and Kumar [41] also analyzed the thermal performance of CCCs. This simulation changed the cooling shape (circle, trapezoid, and rectangle), path (straight, spiral, and spiral square), and cooling distance to find the optimum cooling shape. The results show that a spiral path CCC with a circle profile achieves the minimum surface temperature. A CCC shows a better temperature distribution in the cooling process than a straight cooling channel (90.36 °C versus 100.33 °C).
As previously mentioned, most of the research on CCCs has focused on analyzing the cooling process. However, it is essential to note that mold heating plays a critical role in the injection process. It has been found that higher mold temperatures result in better flow characteristics for melting plastic and filling the mold. In this study, we have used a CCC in the heating process and optimized it by carefully considering the temperature distributions of the mold at the end of both the heating and cooling steps. We utilized the response surface methodology to optimize the cooling channels to achieve this optimization.

2. Simulation and Experimental Methods

2.1. Design Products for Experiments

In previous studies on mold-temperature control for injection molding [42,43,44,45,46,47], the straight cooling channel was used with different heating methods. However, more realistic products will have many complex cavity-surface geometries. Therefore, the distance between the cooling channel and the cavity surface will vary. This issue will lead to different heat transfer rates from the hot-melt plastic to the wall of the cooling channel, resulting in an imbalance of temperature at the cavity surface. Thus, to mitigate this problem, the CCC was suggested for balancing the heat transfer from the cavity surface to the cooling channel, which will lead to improved temperature distribution on the cavity wall surface and machine part temperatures. The products in Figure 1 with a plate and wave profile were chosen for the experiment in a previous study concerned with optimizing the cooling channel shape. The wave profile resulted in a non-uniform mold thickness; therefore, using a straight cooling channel will result in unbalanced temperature distributions for this product geometry.

2.2. Mold Design

In this study, we aimed to optimize the cooling geometry to improve the temperature distribution on the mold face. Thus, only the mold plate was designed, simulated, and subjected to experimentation. We selected one product in the cavity and two cooling channels. The cooling channel design should consider the thickness of the experimental product; therefore, the channel diameter is based on the product thickness. If the channel diameter is d (mm), the distance between the centerline of the two channels should be between 3d and 4d, and the distance from the channel centerline to the mold surface should be between 2d and 3d. Guidelines for the cooling parameters are shown in Table 1.
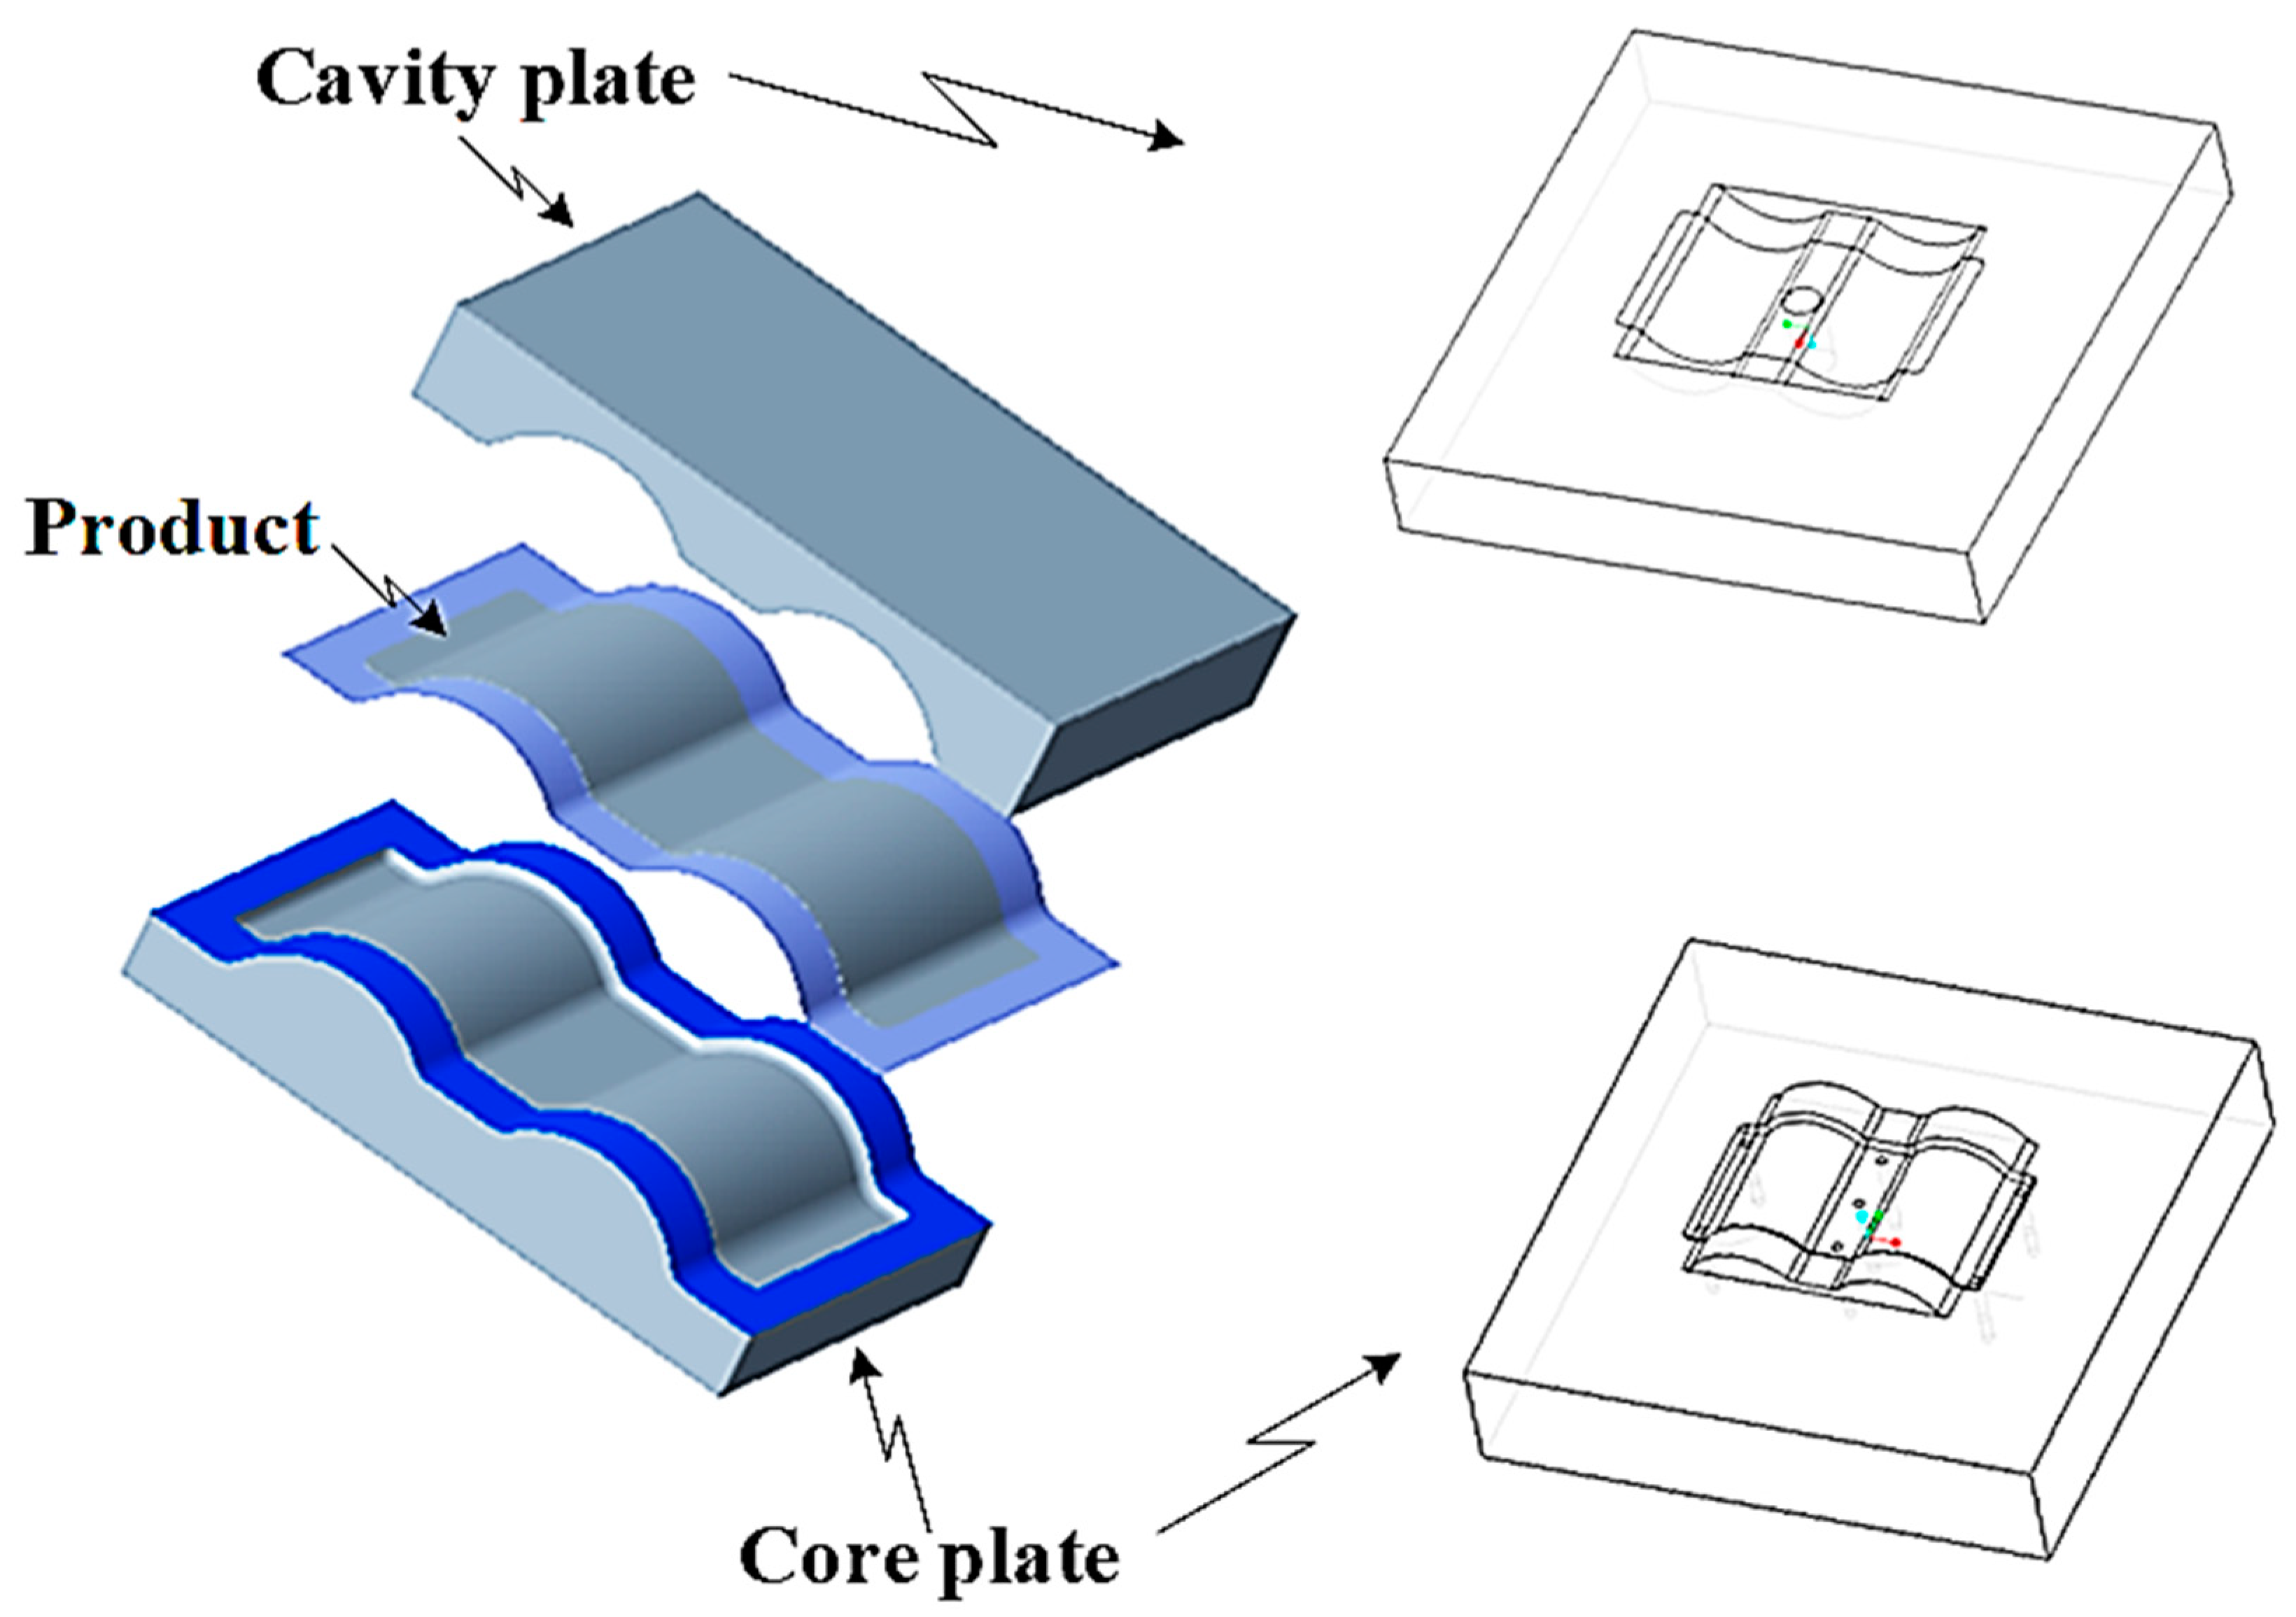
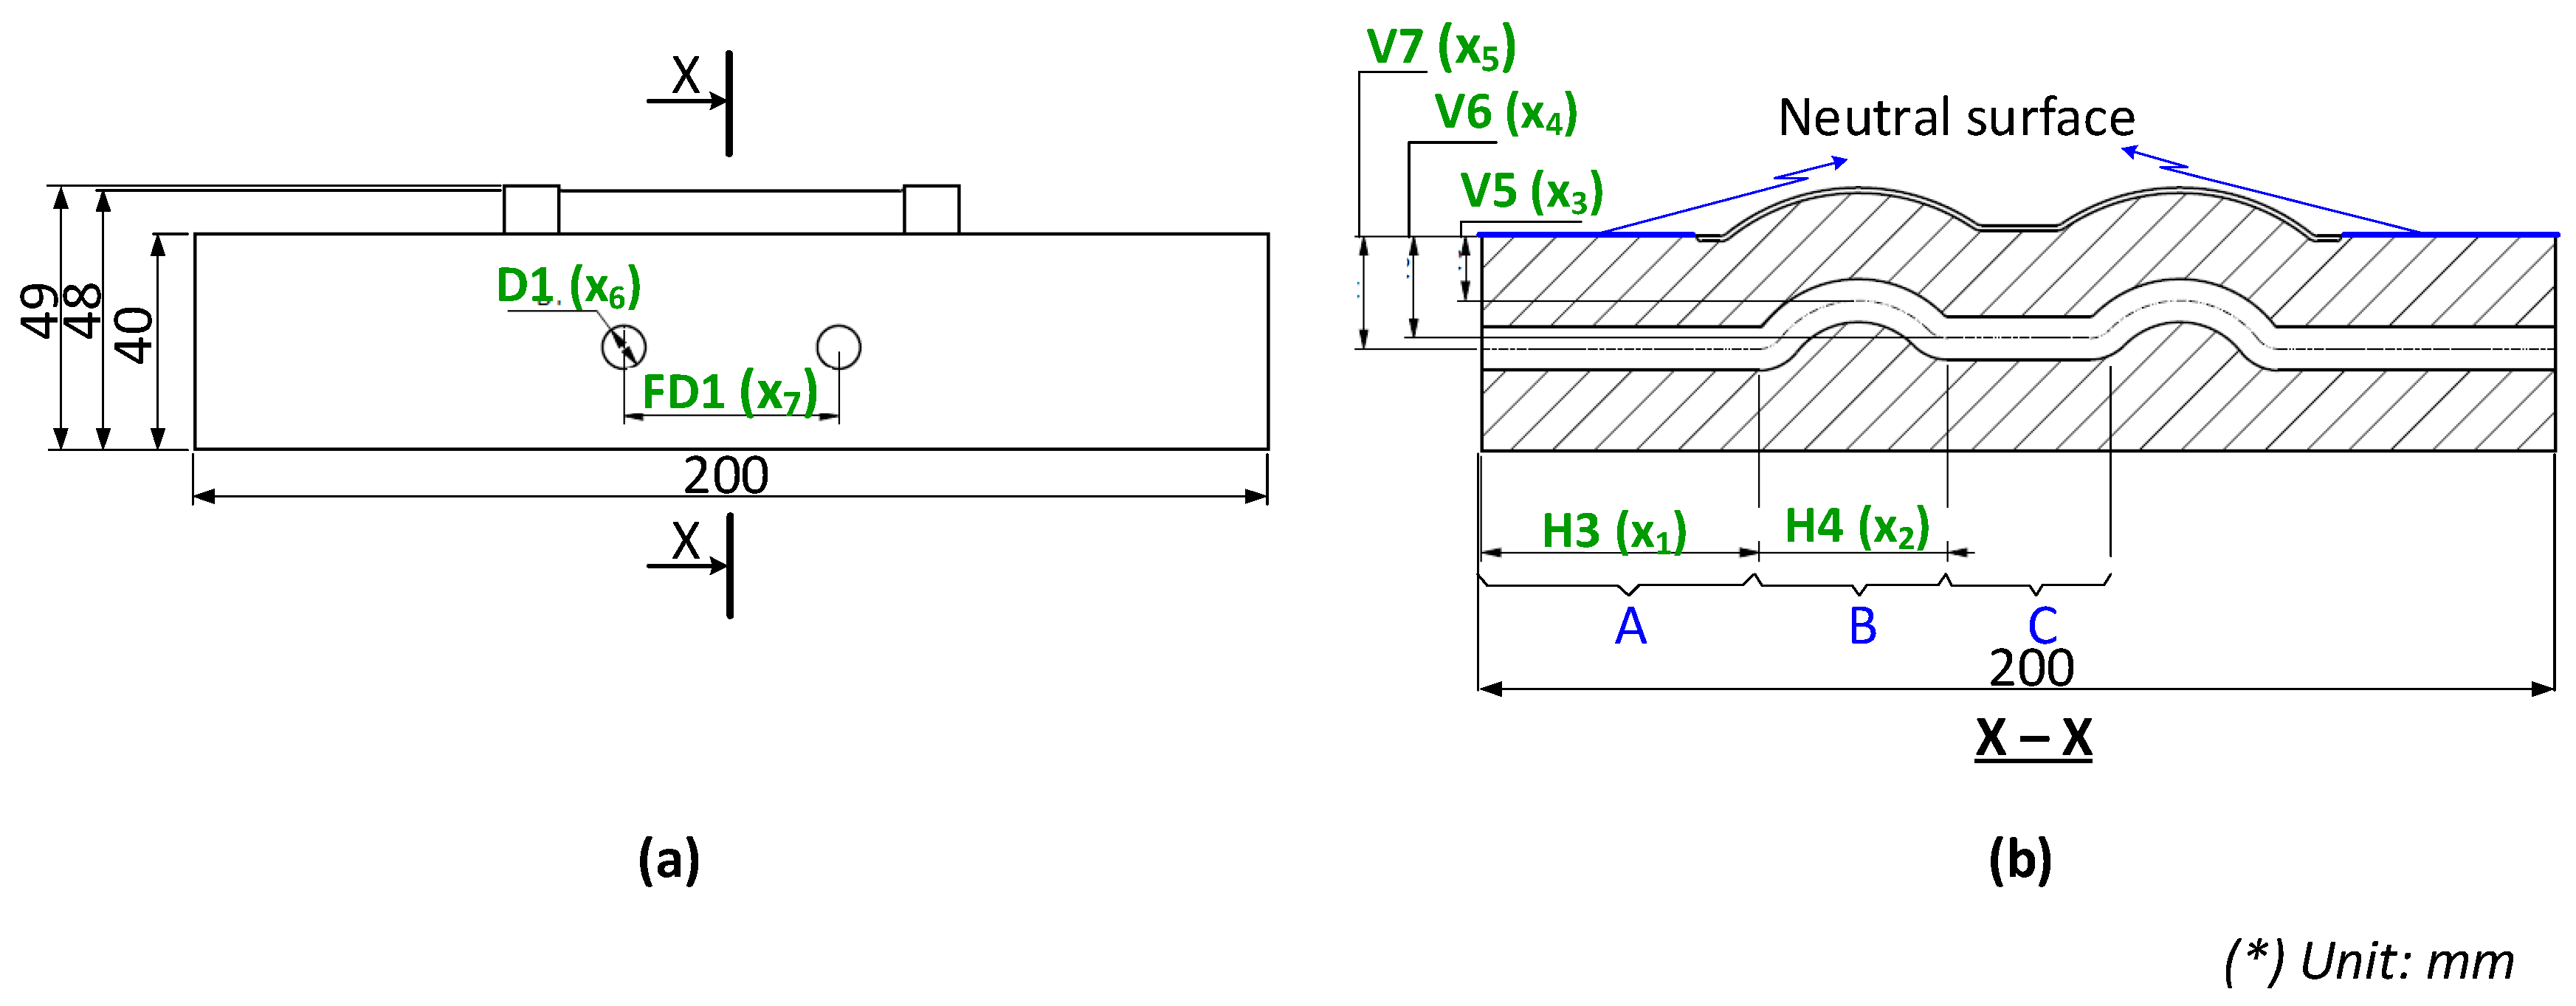
Figure 2 shows the CAD model of a generic injection mold. A proposal for the CCC design parameters has been constructed using the design guidelines shown in Table 1. Figure 3 shows the parameters for the optimization process. Seven parameters must be set to define the shape of the cooling channel fully: channel distance (FD1), diameter (D1), length (H3 and H4), and distance from the centerline of the cooling channel to the mold surface (V7, V6, and V5). The cooling design is shown in Figure 3, and the parameter ranges are defined in Table 2.

2.3. Simulation Setup

Hot water was recirculated during the heating process to raise the mold temperature. The water temperature was controlled by a temperature control machine and maintained at 90 °C at the inlet of the cooling channel. At the same time, a manifold collected water at the outlet and recycled it back to the inlet through ducting.
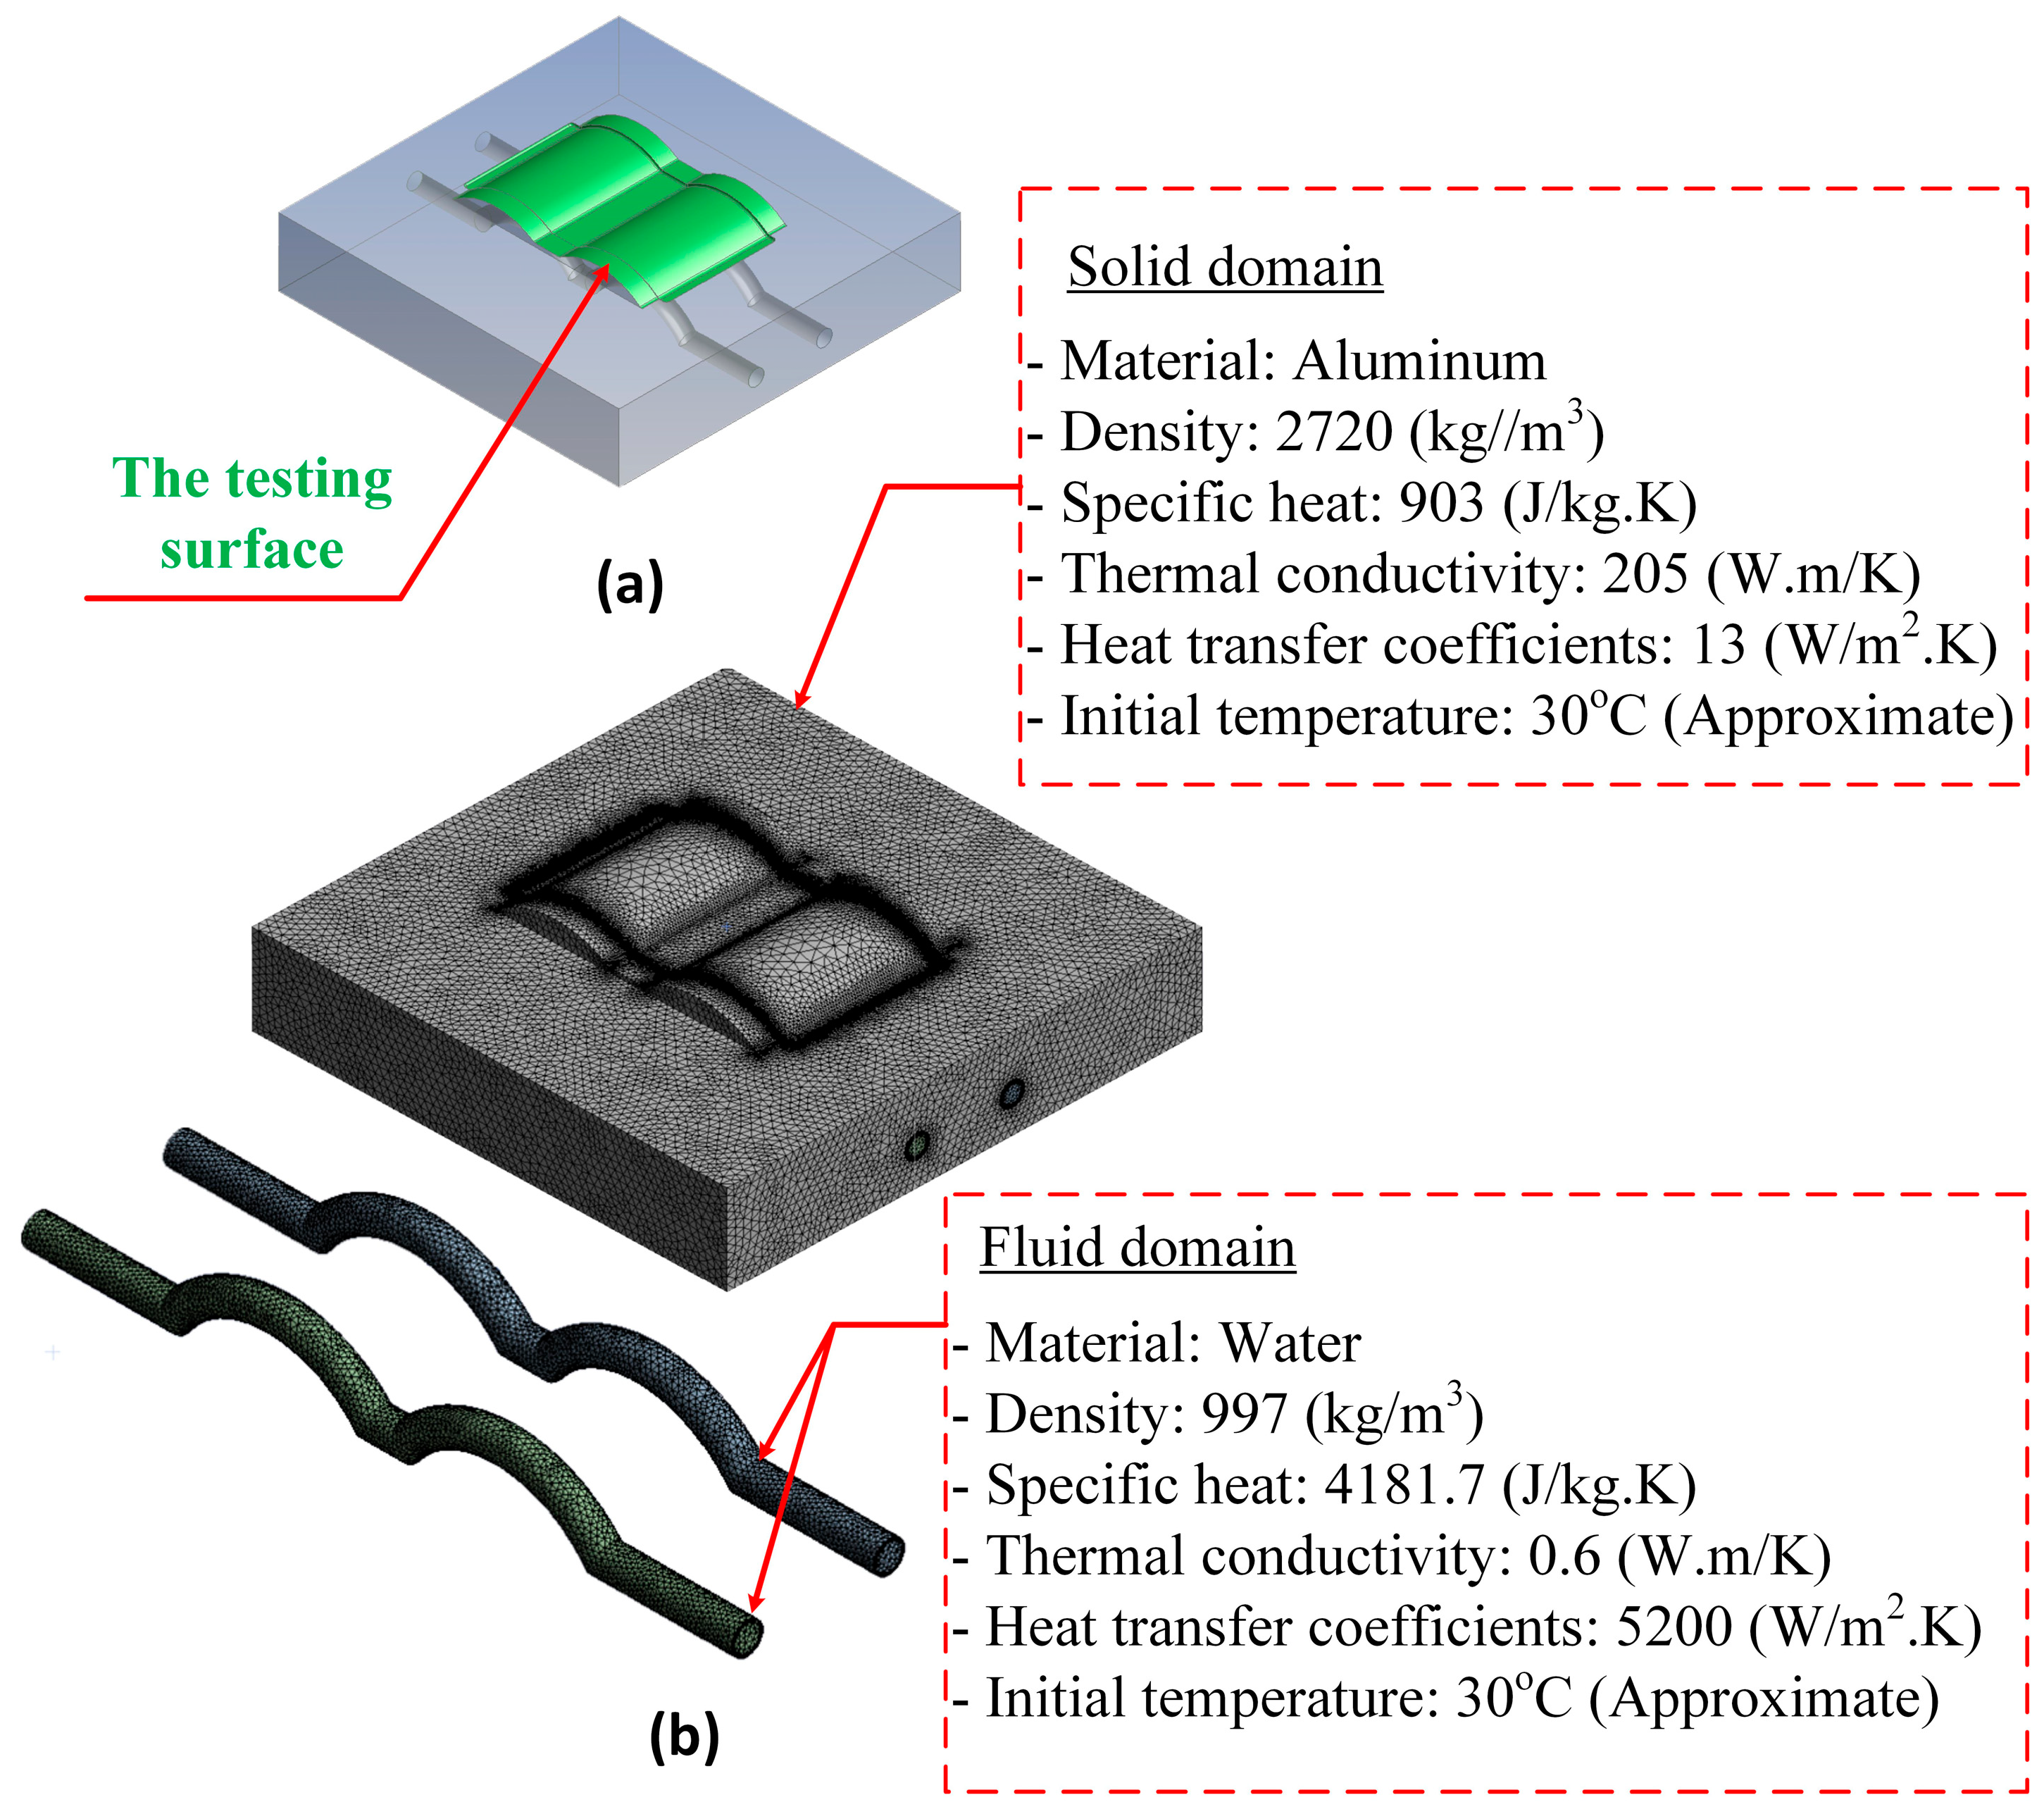
For the mold (solid domain), the material used for the cavity was aluminum alloy. The heat-transfer process included conduction from water in the cooling channel to the mold surface. Heat loss occurred due to heat transfer from the mold surface to the surrounding environment through free convection. The ambient temperature was estimated to be 30 °C. The heat transfer schematic is shown in Figure 4, while the thermal properties of each material are listed in Table 3.
The simulation was based on the experimental setup described. Without loss of generality or oversimplification, the simulation will only focus on the cavity. The simulation used two domains: the solid domain (mold) and two fluid domains (two cooling channels were separated into two domains and used with the same settings). The thermal properties of each material used in the simulation are listed in Table 3 [40], and a schematic of the heat transfer is shown in Figure 4.
As mentioned, the temperature of the cavity surface will directly impact part quality and the filling ability of melted plastic; therefore, this surface is observed and discussed in this study. The temperature was taken on the surface of the mold in contact with the part, shown as a green surface in Figure 5a. The simulation was used to determine the average and differential temperatures on the mold surface. The simulation was performed using the ANSYS software version 19.2 with the meshing model and the boundary conditions, as shown in Figure 5b.

2.4. Response Surface Methodology

Response surface methodology (RSM) is an effective method of evaluating the influence of experimental variables on the response. The relationship between the variables and the response is expressed as a surface, also known as the “response surface.” This surface can be represented as a curved surface with two variables in three-way space. However, the response surface becomes a hypersurface in multidimensional space with the addition of experimental variables. This method can advantageously represent the relationship between observed variables and the response through a mathematical model, which can optimize the response and determine individual responses. Parameters include a set of variables to achieve the required value. The mathematical model showing variables and reactions used in this method can be expressed as follows:
Y = β O + i = 1 k β i · X i + i = 1 k β i i X i 2 + i = 1 k j = 1 k β i j · X i · X j + ε
In this equation:
  • Y: response;
  • i = 1 k β i · X i : linear component of the equation;
  • i = 1 k β i i X i 2 : quadratic component of the equation;
  • i = 1 k j = 1 k β i j · X i · X j : interaction between variables;
  • β O : constant;
  • ε : error.
These components are not required based on the relation between response and variables. Typically, to correctly determine the equation result, the initial model must fully include these components. A mathematical model was derived using experimental results to find the coefficients in which all components were re-evaluated by the statistical method, and statistically insignificant parts were removed. The mathematical model was built this way until only statistically substantial elements remained.
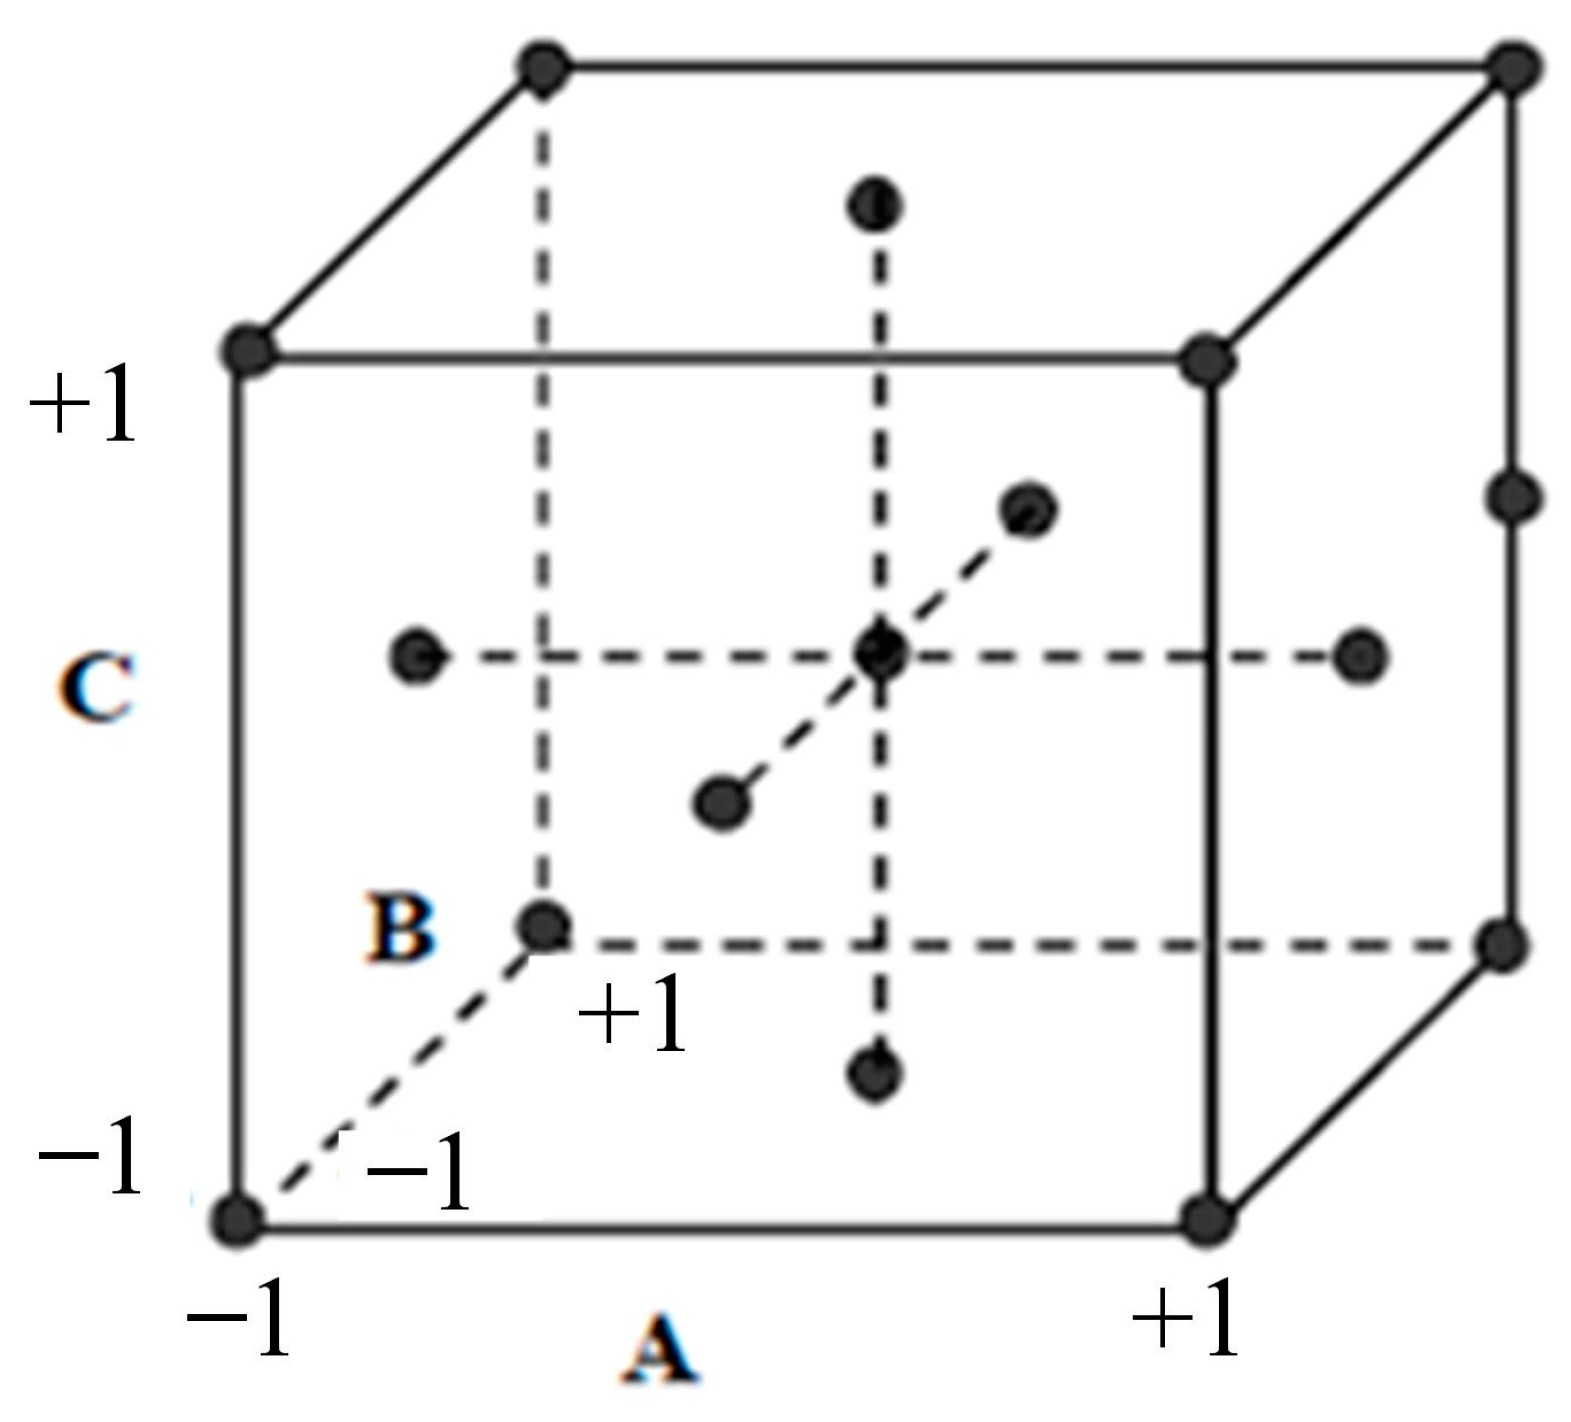
To find the regression equation coefficients, the figure of variables and responses throughout each experiment was used. Design of experiments (DOE) is an efficient experimental strategy for determining the relationship between variables and responses. The most widely accepted experimental designs are full and fractional factorial, with the number of levels depending on the relationship between variables and responses. A complete factorial design consists of all possible combinations between each level of the variables. Therefore, the number of experiments observed from a complete factorial design is numerous, especially in the case of many variables. In this study, with the number of variables being seven and the number of levels being three, the number of experiments observed from a complete factorial design could be 37 = 2187. Instead of a complete factorial design, a fractional factorial design could be a compelling DOE for this study. There are two primary types of DOE for response surface designs: central composite design (CCD) and Box–Behnken design [48,49,50,51]. The Box–Behnken design has fewer experimental design points than the CCD design and only supports up to three levels of each variable. However, the CCD design has to run more experimental trials than the Box–Behnken. However, the disadvantage of this type of experiment is that some design points are located at the axis, making it impossible to experiment because it is beyond the upper or lower value of the variable. To prevent this, face–center design experiments have been developed. This parameter is a variant of CCD, where α = 1. The schematic of the face-centered design can be derived from Figure 6. In this study, the face–center design has been used to implement the experiments. Each variable was separated into three levels, and the number of experiments was 143.
The experimental data will be imported into Ansys software and simulated to observe the result. In this study, the simulation result and the response differed between the maximum and minimum temperatures (P8) and the average temperatures (P9). The mathematical model only included significant components at 5% (p-value). The regression equation obtained from each response is presented below:
P 8 = 88.5 1.559 x 1 0.767 x 2 2.356 x 3 + 1.239 x 4 0.197 x 5 + 0.775 x 6 0.699 x 7 + 0.076 x 3 2 + 0.019 x 1 x 2 + 0.02 x 1 x 3 0.011 x 1 x 4 + 0.022 x 1 x 5 0.023 x 3 x 4 0.008 x 3 x 5 + 0.004 x 3 x 7 0.035 x 4 x 5 + 0.005 x 3 x 7 ,
P 9 = 47.04 0.031 x 1 0.023 x 2 + 0.096 x 3 0.491 x 4 + 0.401 x 5 + 0.96 x 6 + 0.404 x 7 0.003 x 7 2 + 0.003 x 1 x 3 + 0.007 x 1 x 4 0.007 x 1 x 5 + 0.003 x 2 x 3 + 0.003 x 2 x 4 0.004 x 2 x 5 0.012 x 3 x 4 0.02 x 3 x 5 0.011 x 3 x 7 + 0.013 x 4 x 5 0.001 x 4 x 7 0.001 x 5 x 7 + 0.019 x 6 x 7 .
The analysis of the variance for all factors with each response is shown in Table 4 and Table 5.
In Equations (2) and (3), all the components, including linear, quadratic, and two-way interaction, appeared in the regression model. Through the analysis of the variance table, the p-value of each element is smaller than 0.05, which means all component appearances on the regression equation have statistical significance. The coefficient of determination (R-sq) also has very high values (98.82% for P8 and 99.80% for P9), proving that the regression equation fits the data. The mathematical model can predict the value of response with each deterministic variable, and the regression equation can also be used to optimize the response value.

2.5. Multi-Response Optimization

Optimization with a single response value was relatively easy to find. The optimum value of each response was obtained using numerical methods for regression (2) and (3). However, this study aims to find the optimum shape of cooling; with this cooling shape, the temperature could be distributed uniformly on the mold surface. If only one response has been used to find the optimum cooling form, this shape may bring the highest temperature on the mold surface, but the different temperatures may be large and contrary. These numerical results can be seen in Table 6. These two observed simulation results showed that with a higher average, the temperature difference increased. The primary purpose of optimization was to find the best value of each variable such that the average temperature is highest, and the contrast of temperature is minimized.
Solving this issue, the desirability function approach could be used. This function was developed by Harrington and his partner [52] and then popularized by Derringer and Suich [53]. The main idea of this approach is to transform the response function into a suitable function and then optimize it. The overall desirability function was synthesized from the expectation functions of each response [54,55,56]. The object here maximizes the overall desirability function. The overall desirability function can be determined by the function below:
D = d 1 k 1 · d 2 k 2 · · d i k i k 1 + k 2 + + k i
In this function:
  • di: desirability function of response i;
  • ki: the importance coefficient of response i.
The desirability of each response received values from 0 to 1. The desirability di of response I could be presented as the function below:
When the optimum object is at the maximum:
d i = 0   k h i y i < L i y i     L i T i     L i w i   k h i L i < y i < T i 1   k h i y i L i .
When the optimum object is at the minimum:
d i = 1   k h i y i < T i U i     y i U i     T i w i   k h i T i < y i < U i 0   k h i y i U i .
In this formula:
  • Li: the upper bound value;
  • Ui: the lower bound value;
  • Ti: the desirability value;
  • wi: weight of each response.
The value of the weight when describing the expected function will determine the shape of the graph representing this function. When we choose a weight larger than 1, we emphasize the importance of attaining an objective function close to the desired value. Conversely, when the weight is less than 1, we extend the acceptance more when the objective function is far from the desired value. Figure 7 shows the desirability of the maximum and minimum optimization when the weight of each response is 0.2, 1, and 5.
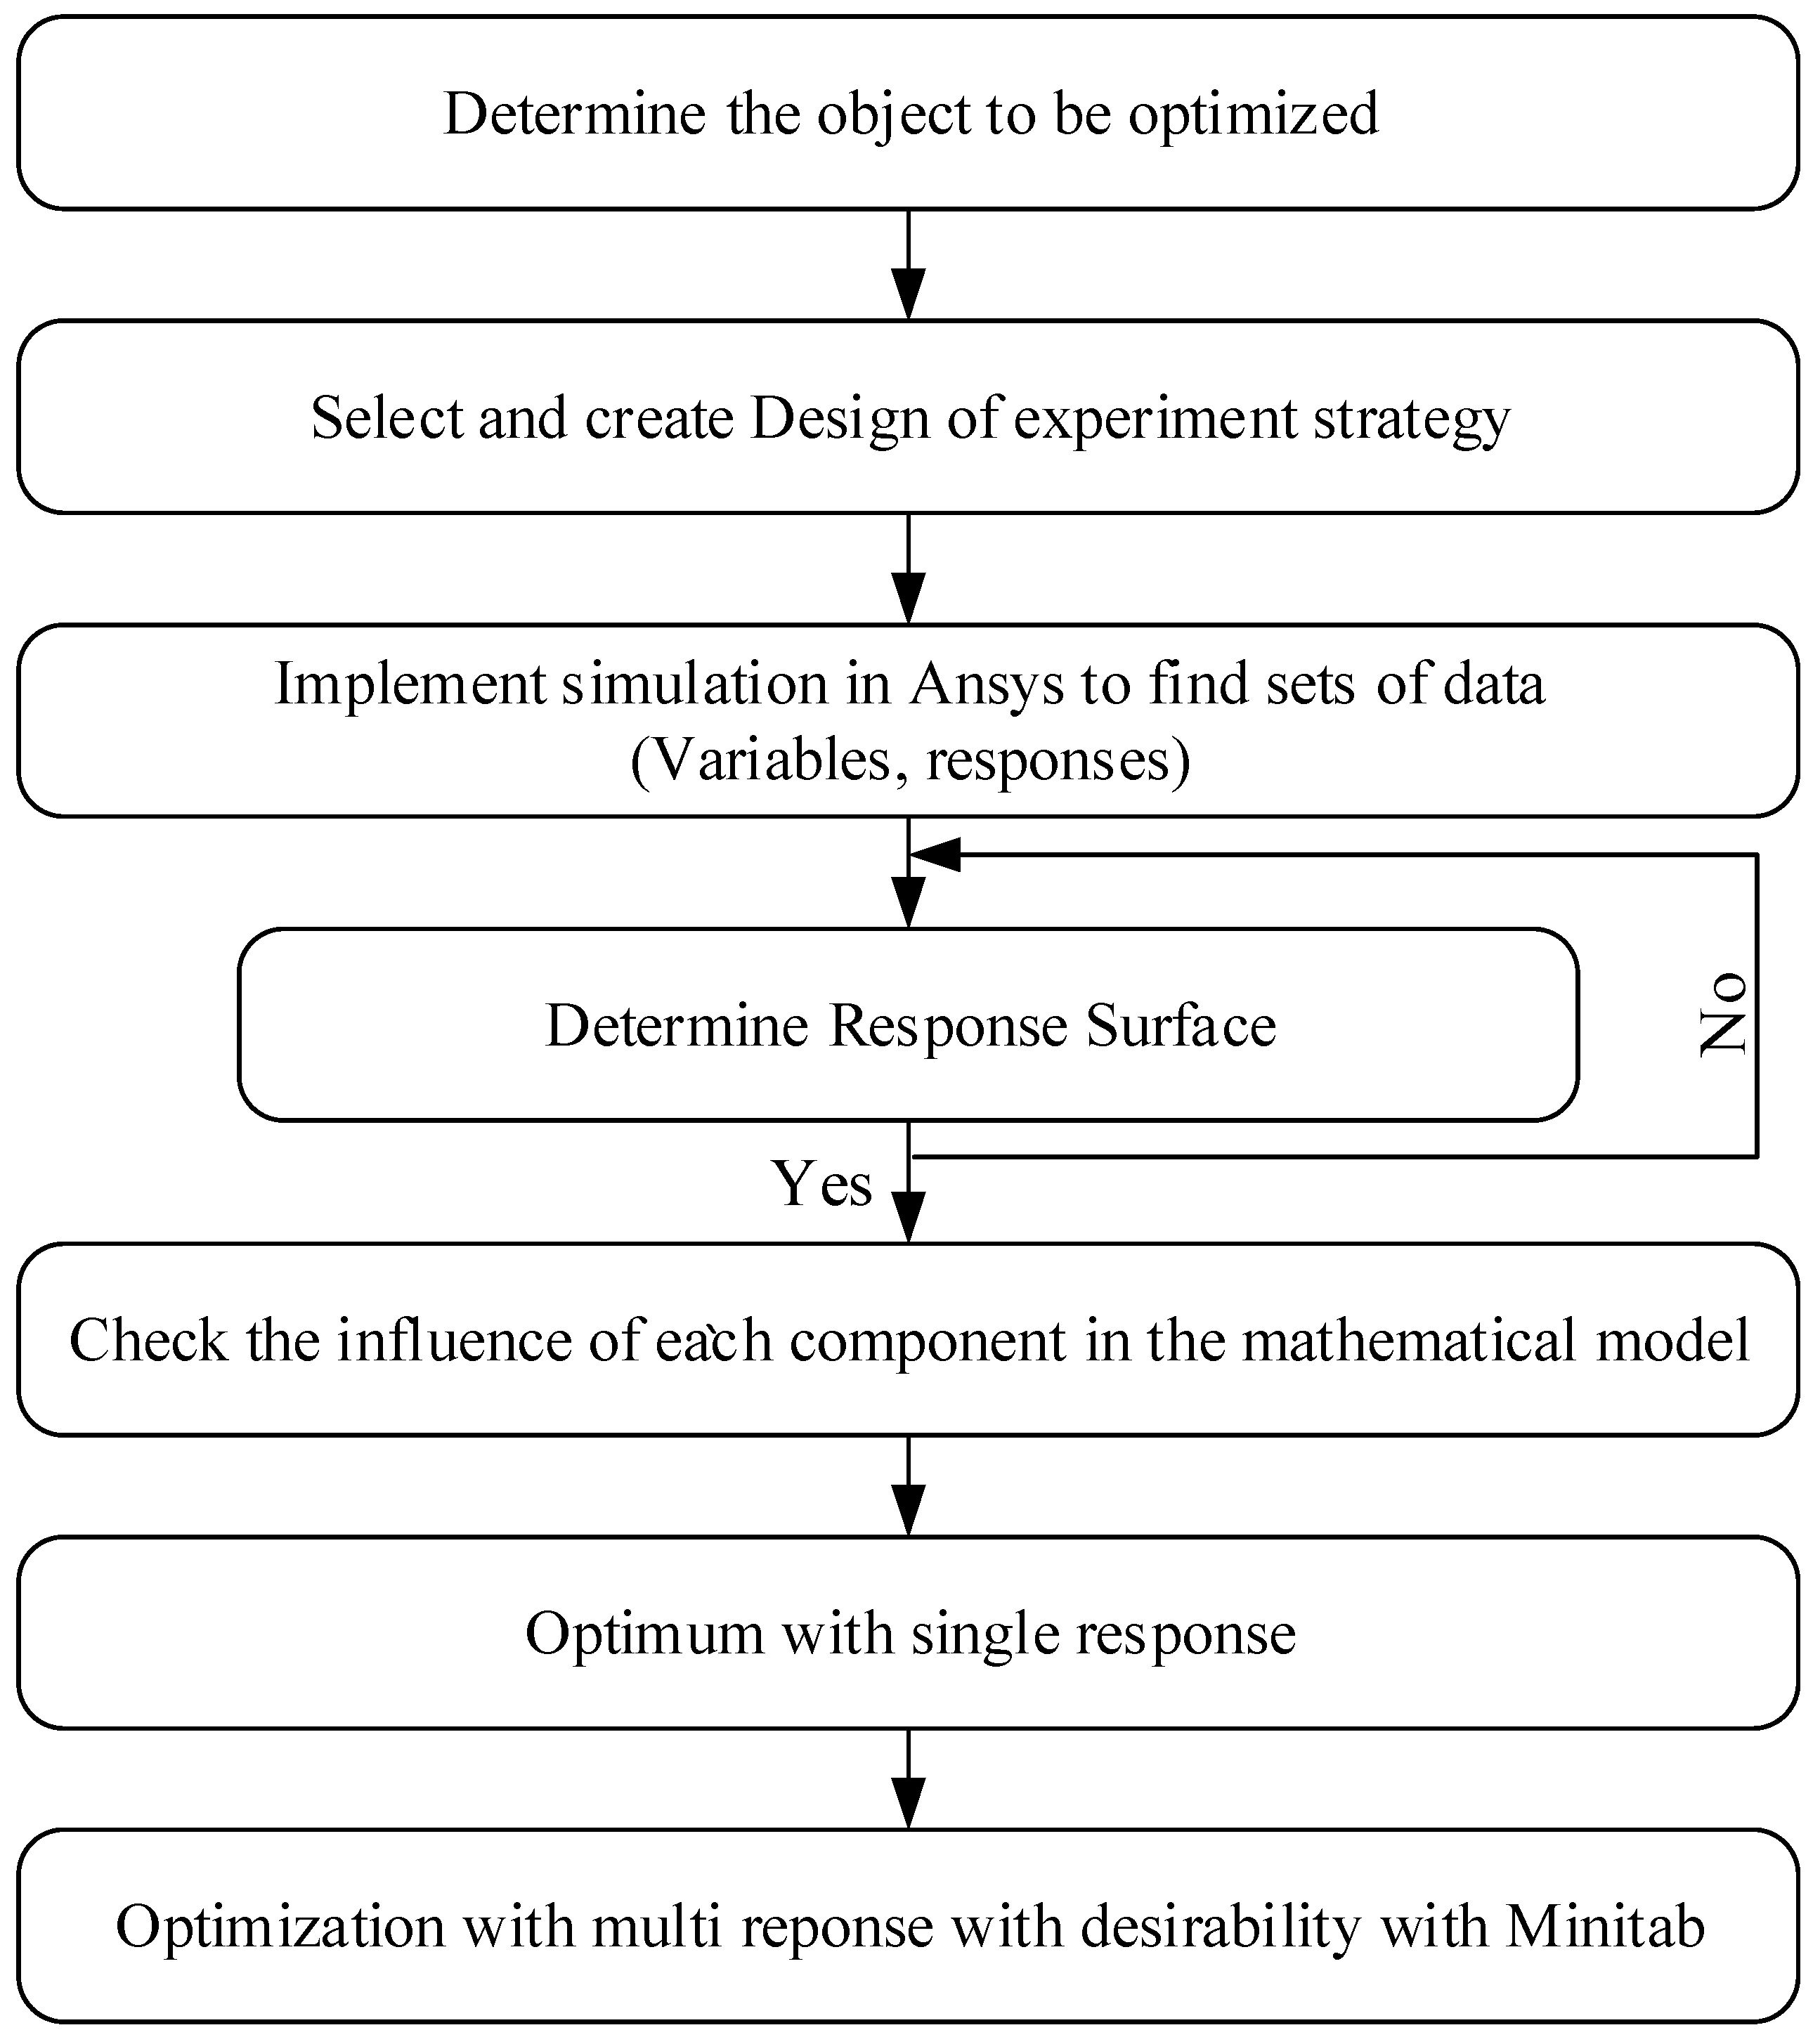
In this study, the P8 (temperature difference) optimized object was depreciation, and the P9 (average temperature) optimized object was maximization. The optimization process is illustrated in the figure. A regression equation based on the CCD method was used to find the optimum point. The optimization process with the desirability function approach could be easily solved using an added tool such as Minitab, and the progress is shown in Figure 8.
The optimization plots for each response are shown in Figure 9. The optimum point and predicted value of each response were determined.
The result in Table 7 shows that the optimized value of each response was 13.2292 °C, which is far from the target value (8.5874 °C), so the desirable value was relatively low (77.02%), but it is still in the acceptable range (8.5874 °C ≤ P8 ≤ 28.7853 °C). On the contrary, the average temperature response optimized value was predicted at 67.2494 °C, close to the target value (69.5697 °C); therefore, the desirable value was relatively high (83.69%). The overall desirable value for these two responses was 80.28% (composite desirability); this value could be accepted.
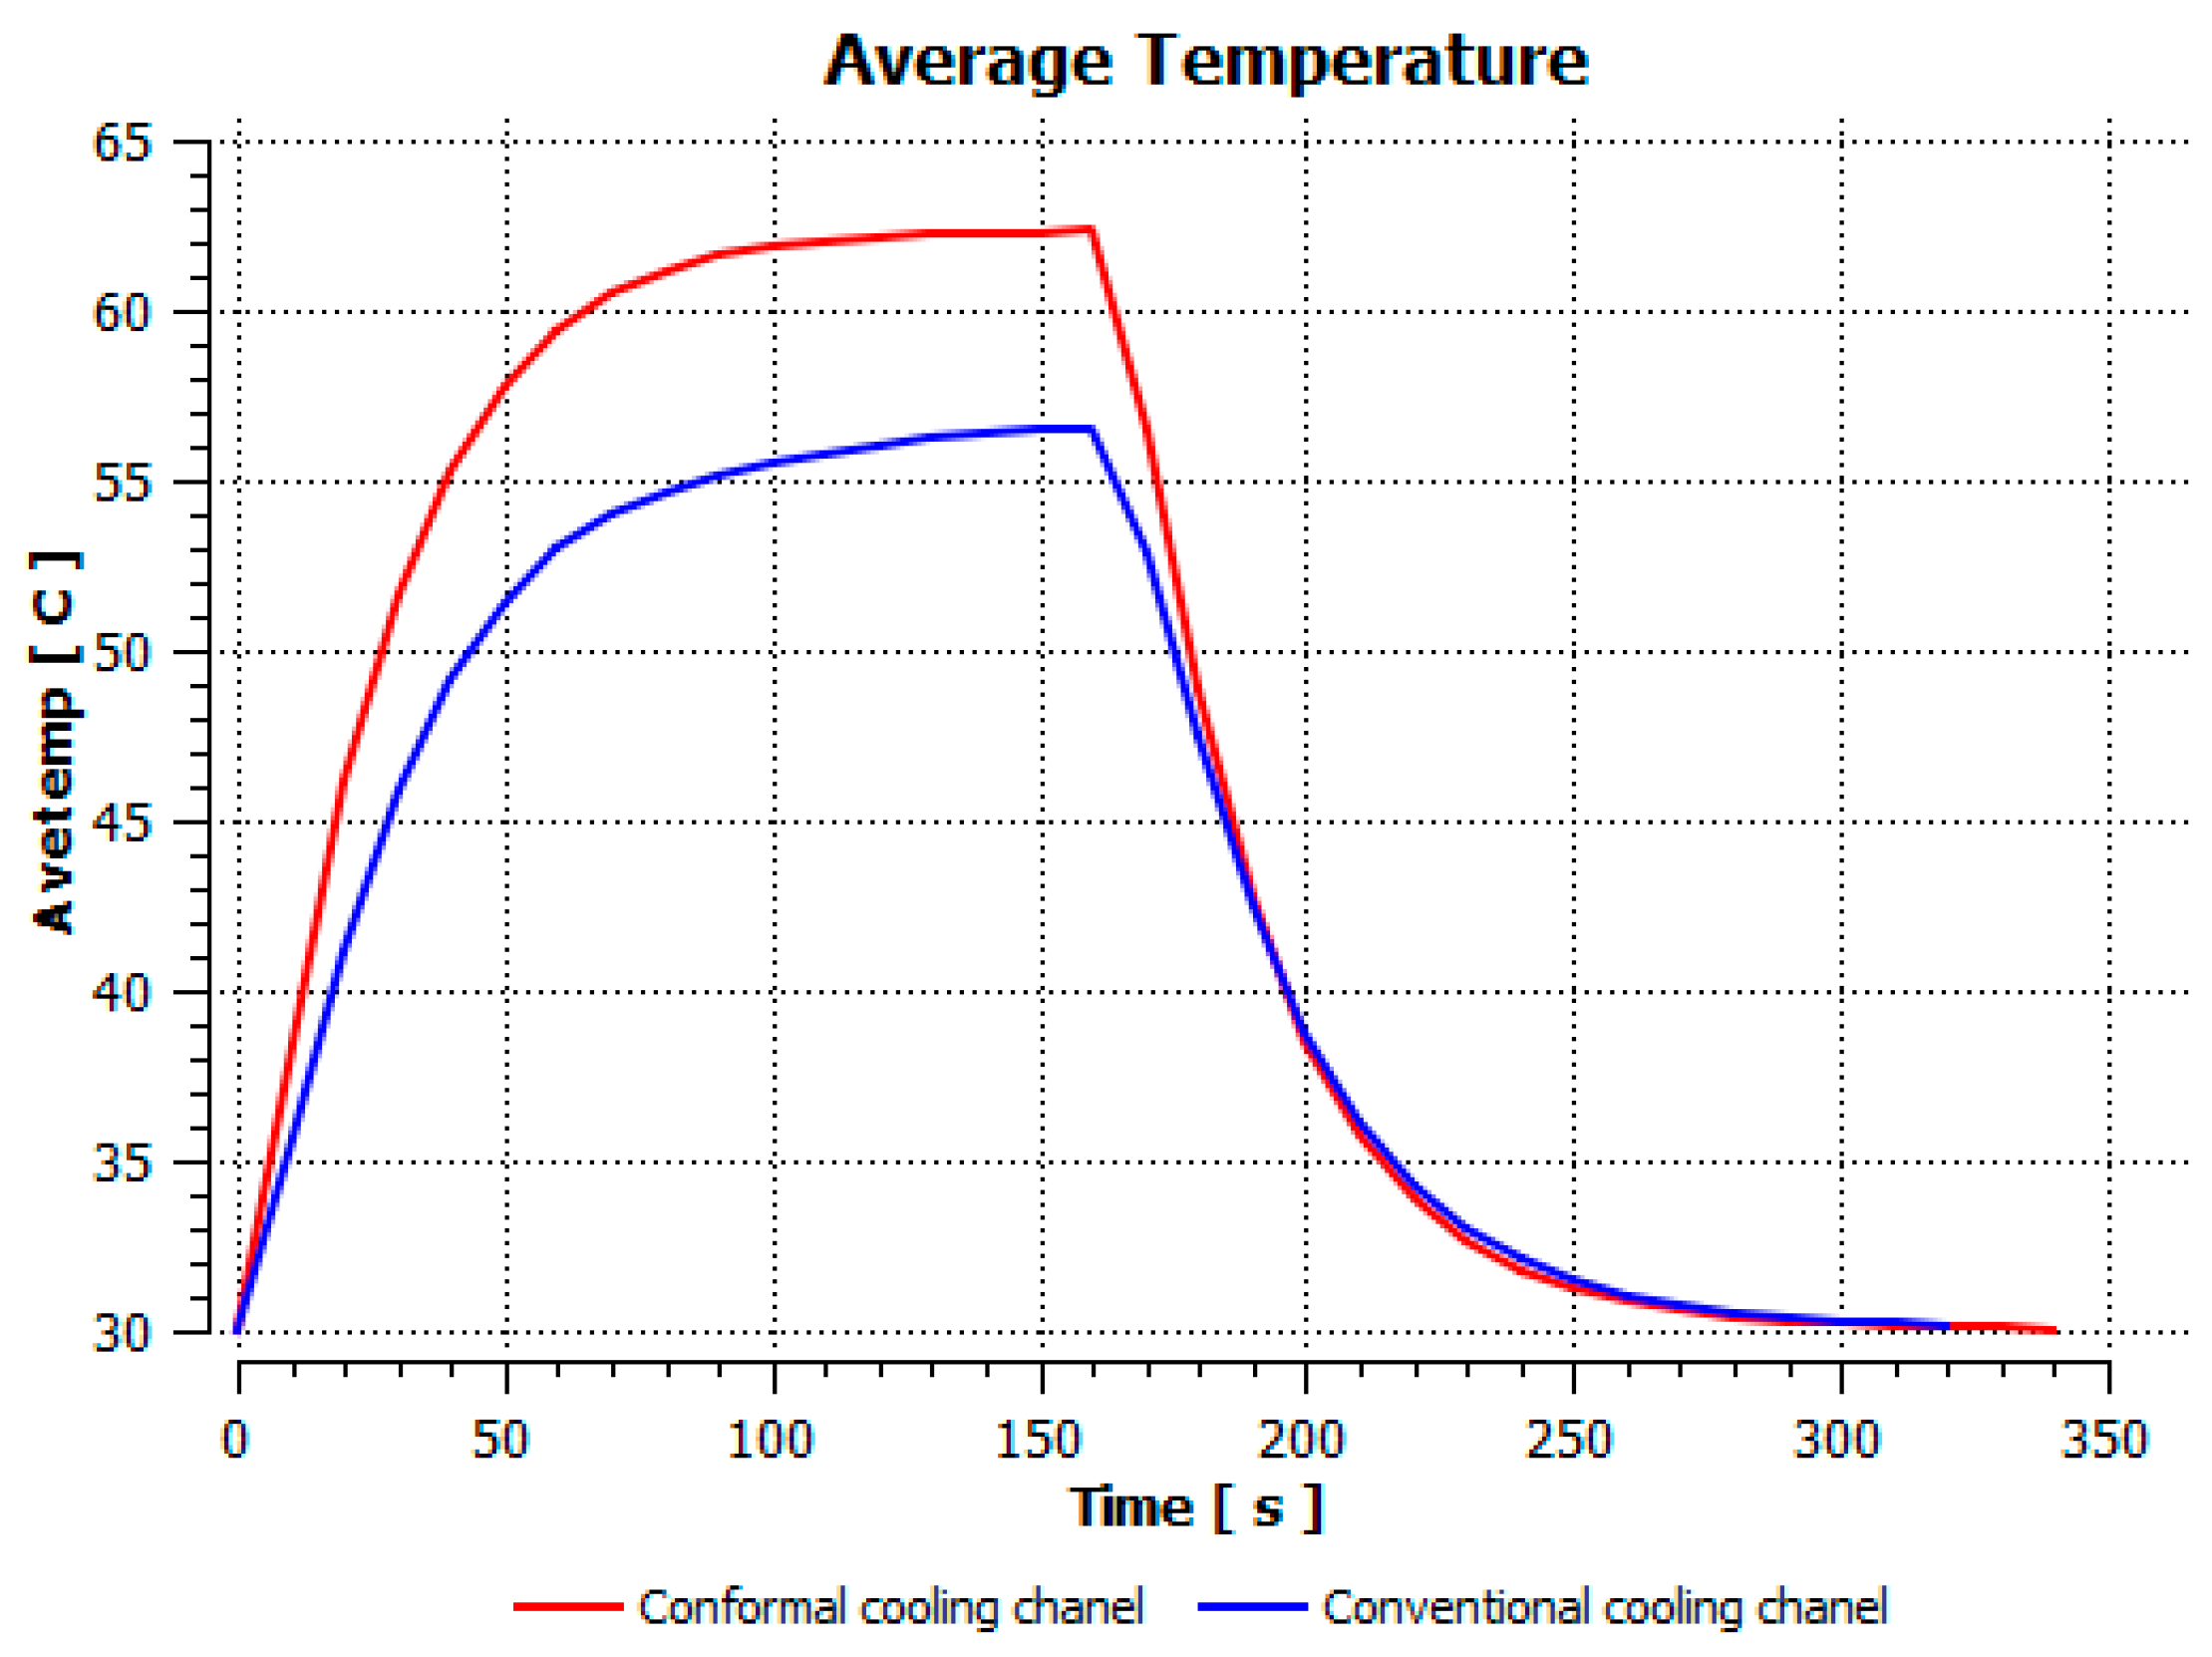
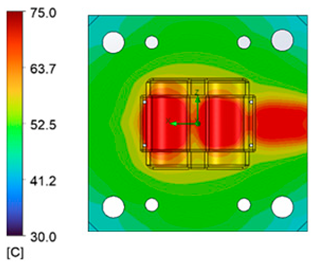
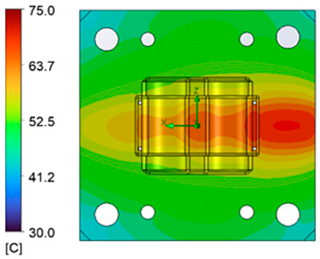
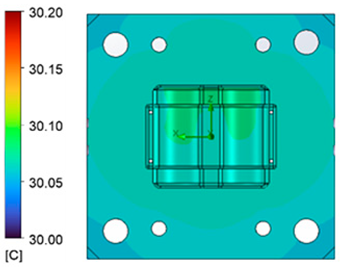
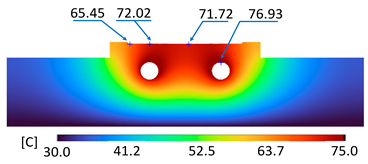
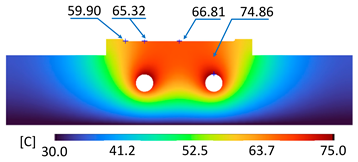
The optimum point of each variable obtained from the optimization process was used to modify the shape of the cooling channel and rerun the simulation on Ansys software to verify the values predicted. In addition to the heating process, the simulation analyzed the cooling process. In the cooling process, water at 30 °C was used. A comparison between the prediction and simulation values of the heating process is shown in Table 8. It can be seen that the difference between the prediction value and simulation value is minimal (0.79% with P9 response and 4.8% with P8 response). Figure 10 shows the average temperature history of the testing surface when the CCC and the conventional channel were used. This result shows that the CCC supports the higher heat transfer coefficient for the heating period, which could keep a higher temperature at the end of the heating step. The temperature distribution at the core surface could be observed at the end of the heating step (Table 9) and the end of the cooling phase (Table 10). In the heating process, the average temperature surged quickly in the first 60 s, and it was consistently more significant in the mold that used a CCC than the mold that used a conventional cooling channel; in the steady state, the average temperature on the CCC mold was 66.72 °C, while the traditional cooling channel only reached 63.08 °C. It can be seen from Table 9 that in the CCC mold, the high temperature (>71 °C) was distributed over a large area on the mold surface. Still, in the conventional cooling channel mold, the heat zone with the most significant size had a temperature of only 67 °C. Meanwhile, in the simulation, the cooling process used water at 30 °C on both types of molds. The figure in Table 10 clearly shows the effectiveness of each cooling channel type. The temperature distribution of the mold using the CCC was more uniform than the mold that used the straight cooling channel.
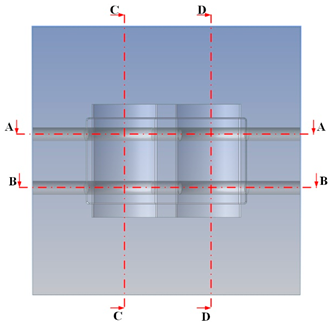
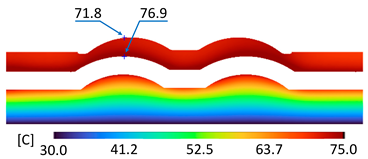
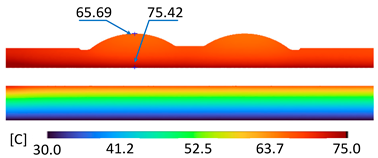
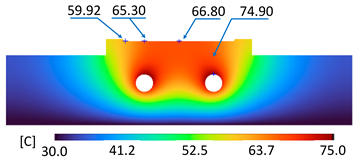
Table 11 shows the temperature distribution at each mold section compared to the mold used in CCC, which used a straight cooling channel. In the two types of molds, it is evident that the temperature decreases when moving away from the surface where there is contact with the high-temperature fluid to the top surface of the mold, but the figure shows a big difference between the two types of molds. In sections A-A and B-B, the temperature decreased from approximately 77 °C to 72 °C at the top surface. The temperature dropped by 5 °C in the mold using a CCC. Meanwhile, in the mold that used a straight cooling channel, the temperature was reduced by 9.8 °C from the maximum temperature at contact with the hot water surface (75.5 °C) to the temperature at the top surface (65.68 °C). In sections C-C and D-D within the mold that used the CCC, the temperature decreased by 4.9 °C in the vertical axis from the cooling channel to the top surface, and this decreased from 72.07 °C to 64.45 °C when moving from the cooling channel’s centerline to the boundary edge of the top surface, and to 71.4 °C in the middle of the mold. The amount of temperature relieved was 6.6 °C in the horizontal side. In the same section, the temperature decreased significantly more in the mold that used a straight cooling channel than in the mold that used CCC on both sides, vertical and horizontal. More specifically, when moved from the cooling channel surface to the top surface, the temperature went down 8.1 °C, which means double that of the CCC mold, from 74.9 °C to 66.8 °C. Along the horizontal side, the temperature decreased by 6.9 °C from the middle of the mold to the boundary edge.

2.6. Experimental Verification

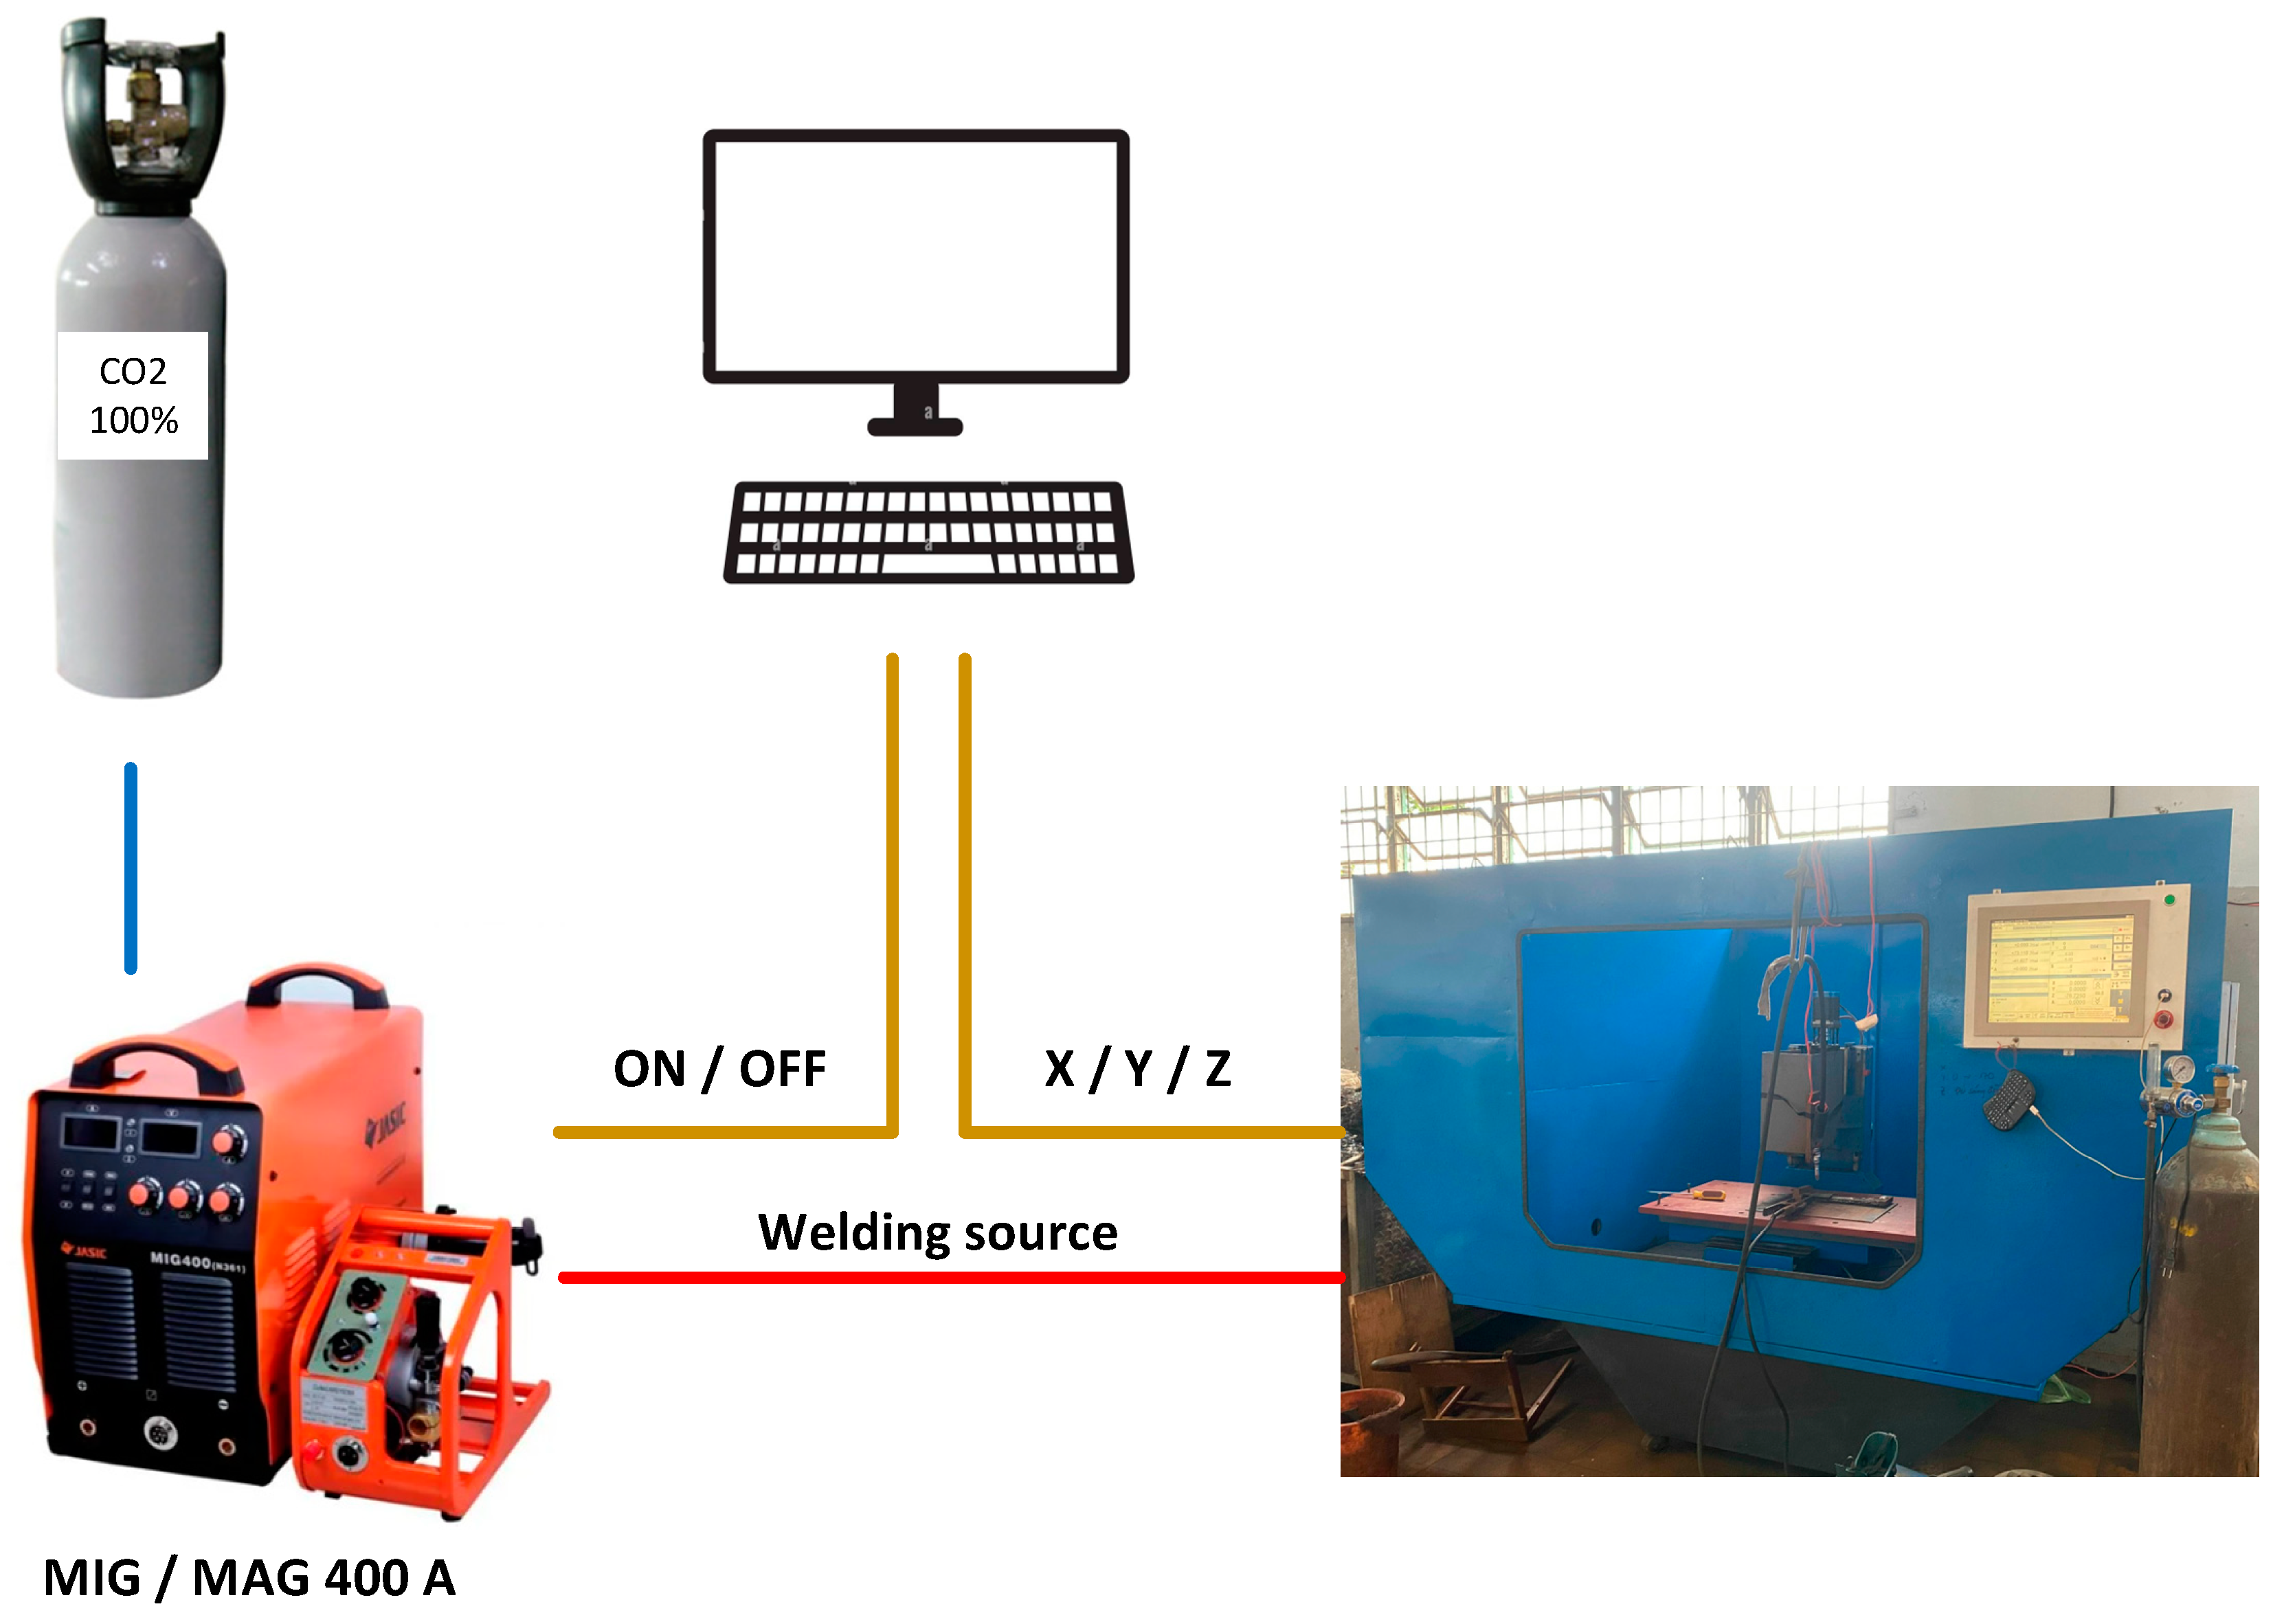
Two models were manufactured to verify the simulation results for two types of cooling channels (CCC and straight cooling channel). The fabrication of the cavity mold with a linear cooling channel was simple, but the process was more difficult with the CCC mold. In this research, the mold plate with two CCC was manufactured by the WAAD combined with the milling method. The proposed MAG welding system introduces a metal deposition process via gas metal arc welding (GMAW) to manufacture a mold plate featuring two conformal cooling channels. Essentially an additive manufacturing (AM) method, it involves the deposition of a weld bead in a track-by-track and layer-by-layer manner. To facilitate this, a machine setup was constructed by affixing a GMAW torch to a computer numerical control (CNC) machine, as depicted in Figure 11. An ER70S-6 wire (diameter 1.2 mm) was used in this setup. In order to minimize weld splash, an optimal set of process parameters were determined: voltage of 19.5 V, current of 115 A, standoff distance of 8.5 mm, shielding gas flow rate of 18 L/min, and a travel speed of 250 mm/min. Subsequent to the additive manufacturing, the milling method was utilized to polish the surface and create a precise, finished product.
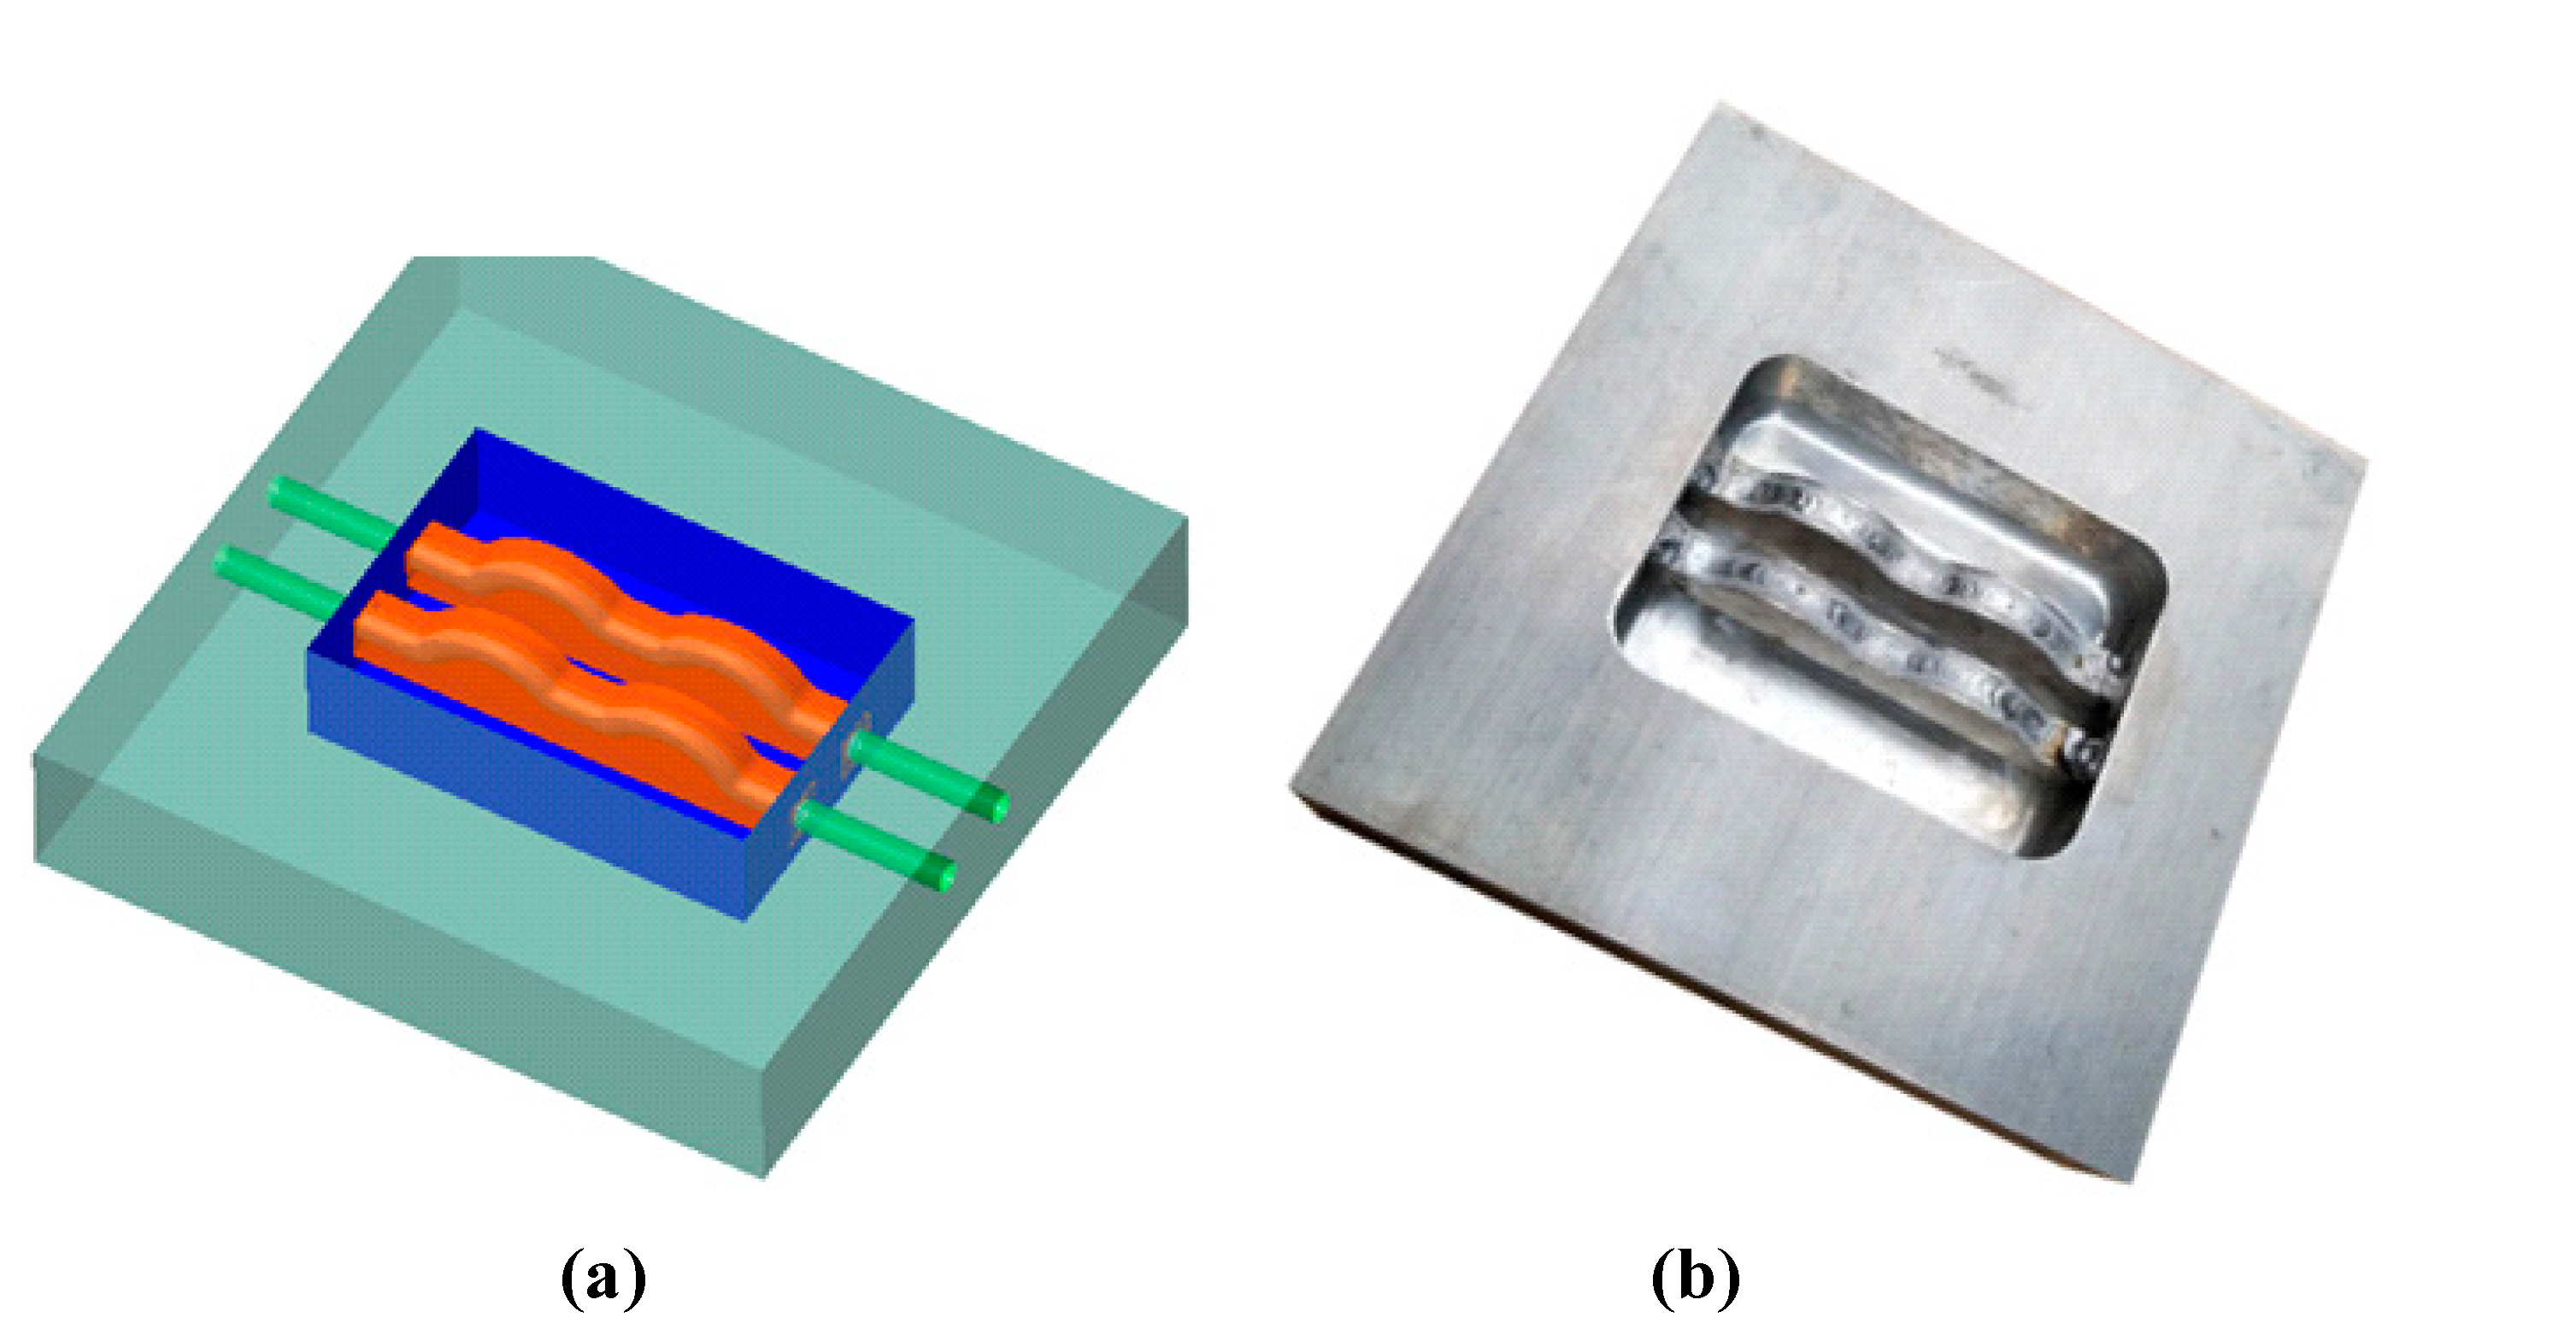
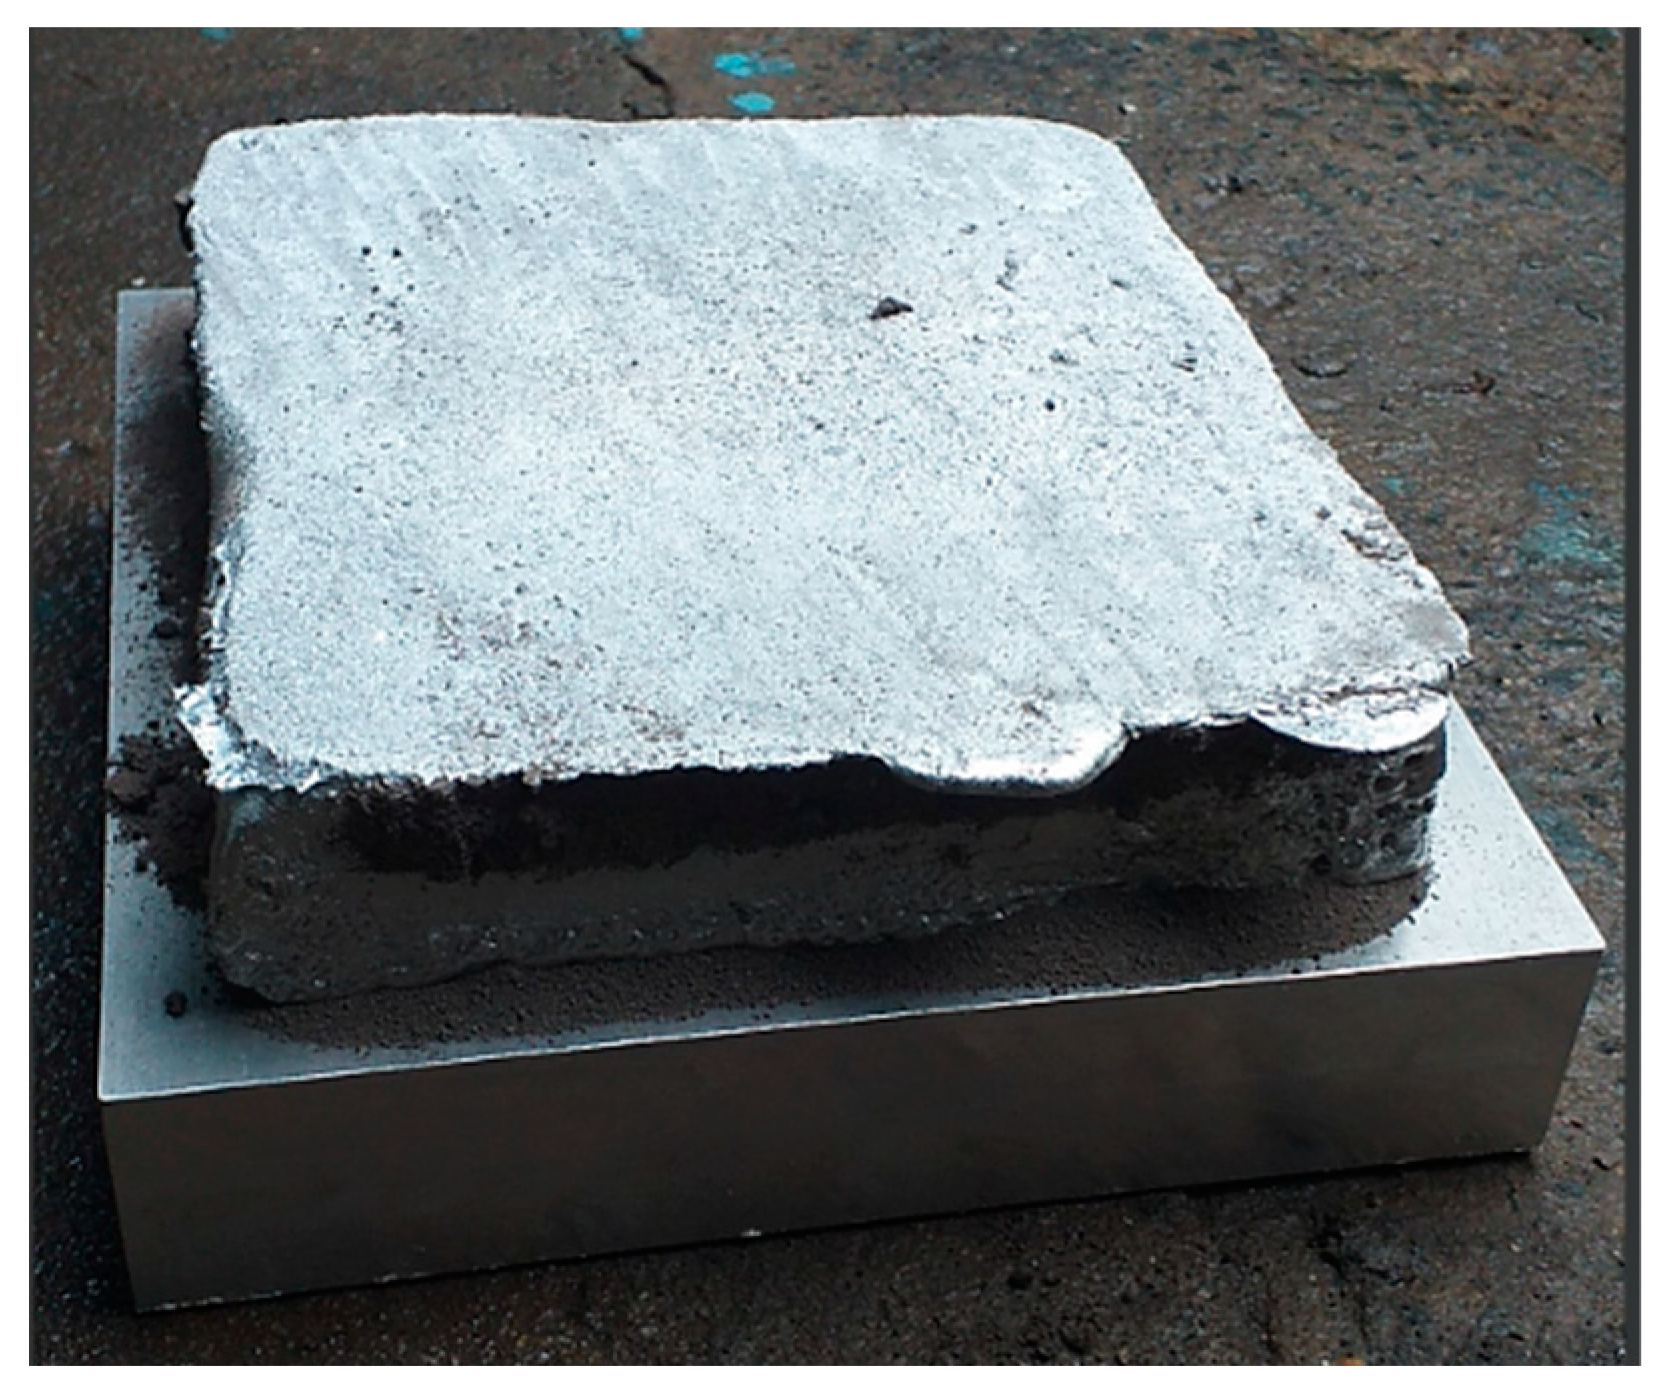
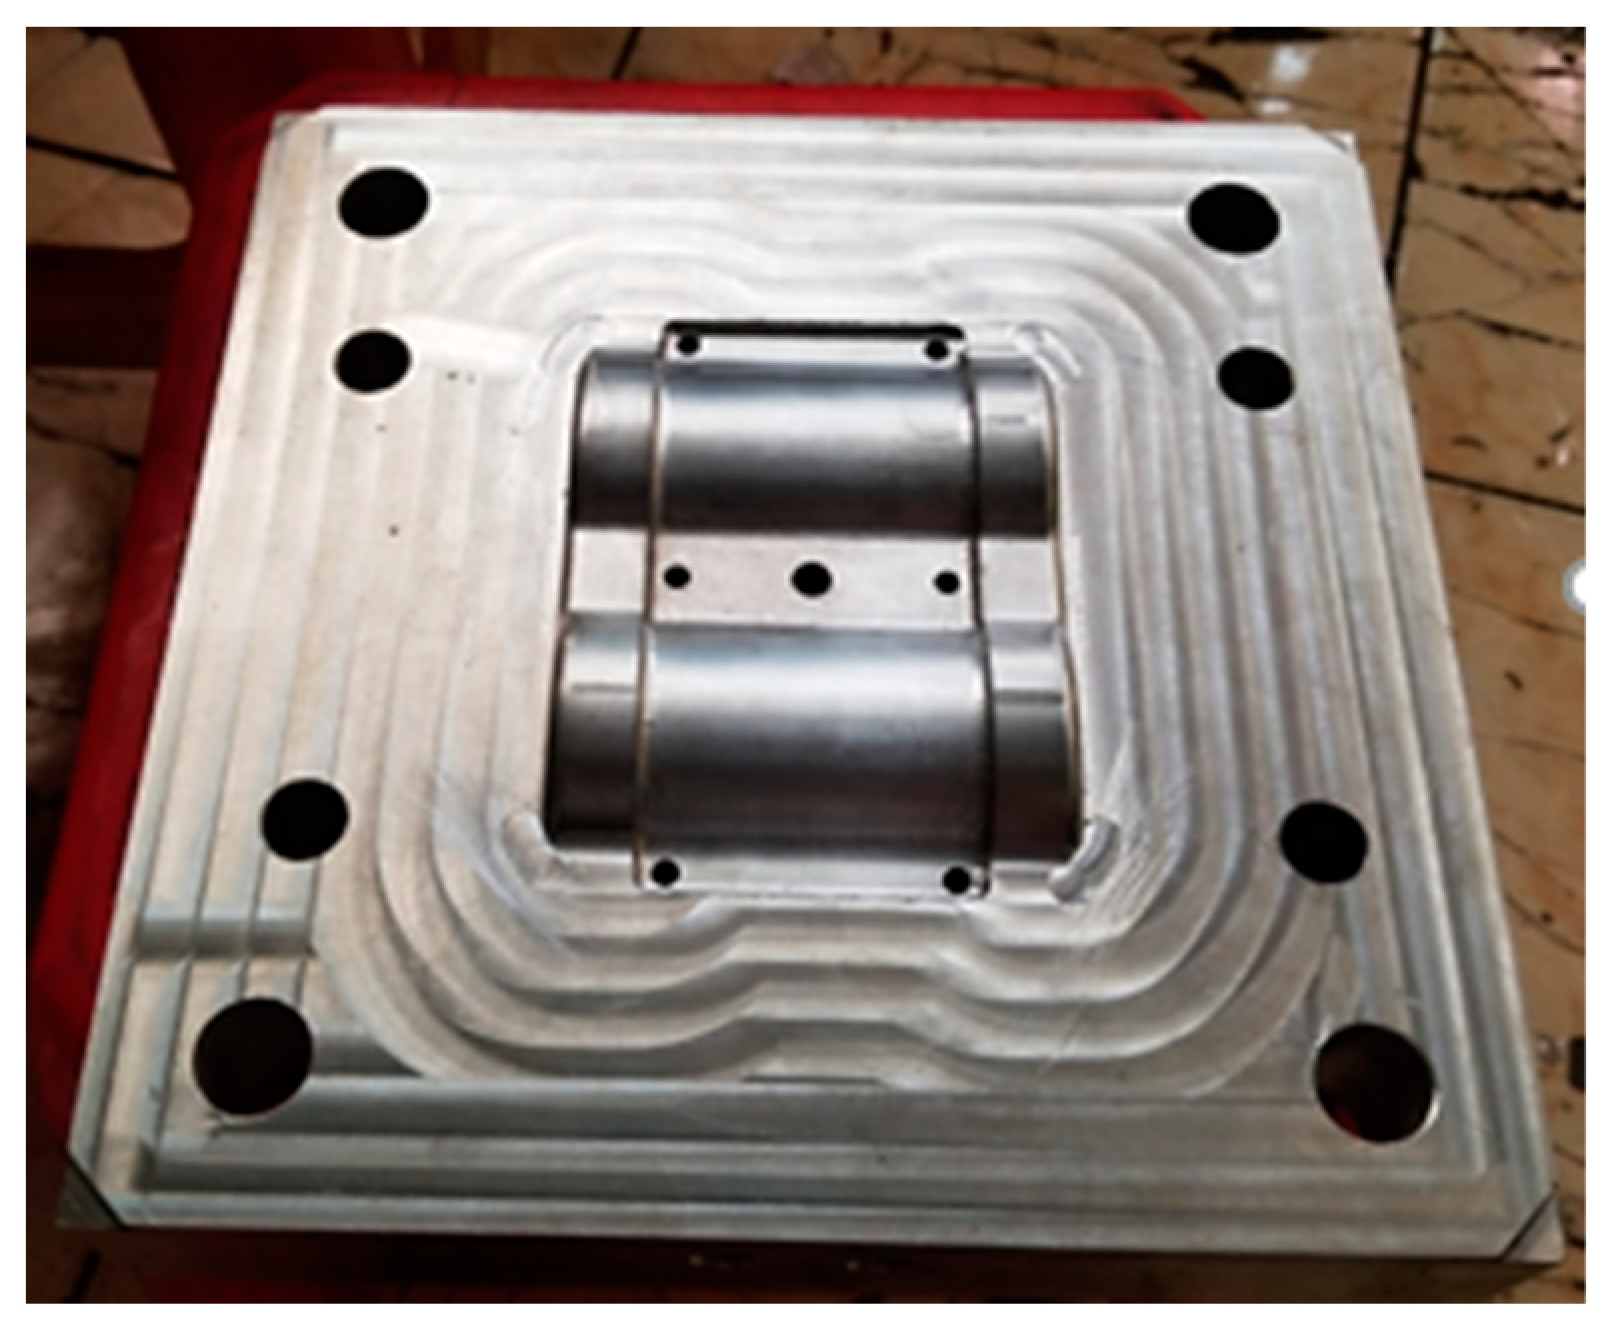
For the creation of the conformal cooling channel (CCC), two inserts were pre-manufactured, each one possessing a profile that matched the optimized parameters (as seen in Figure 12). These inserts were then welded together as displayed in Figure 12. The assembled inserts were then fitted into the plate via a strategically placed hole (Figure 13). The WAAM process was then carried out to deposit the additive material, with the results visible in Figure 14. At the conclusion of the WAAM process, it was observed that the plate’s geometry did not perfectly align with the intended design. However, this issue was resolved through the milling process, with the final plate displayed in Figure 15.
This finalized plate was then integrated with the other mold components in preparation for molding, as well as for the observation of temperature distribution across the mold during the molding process.
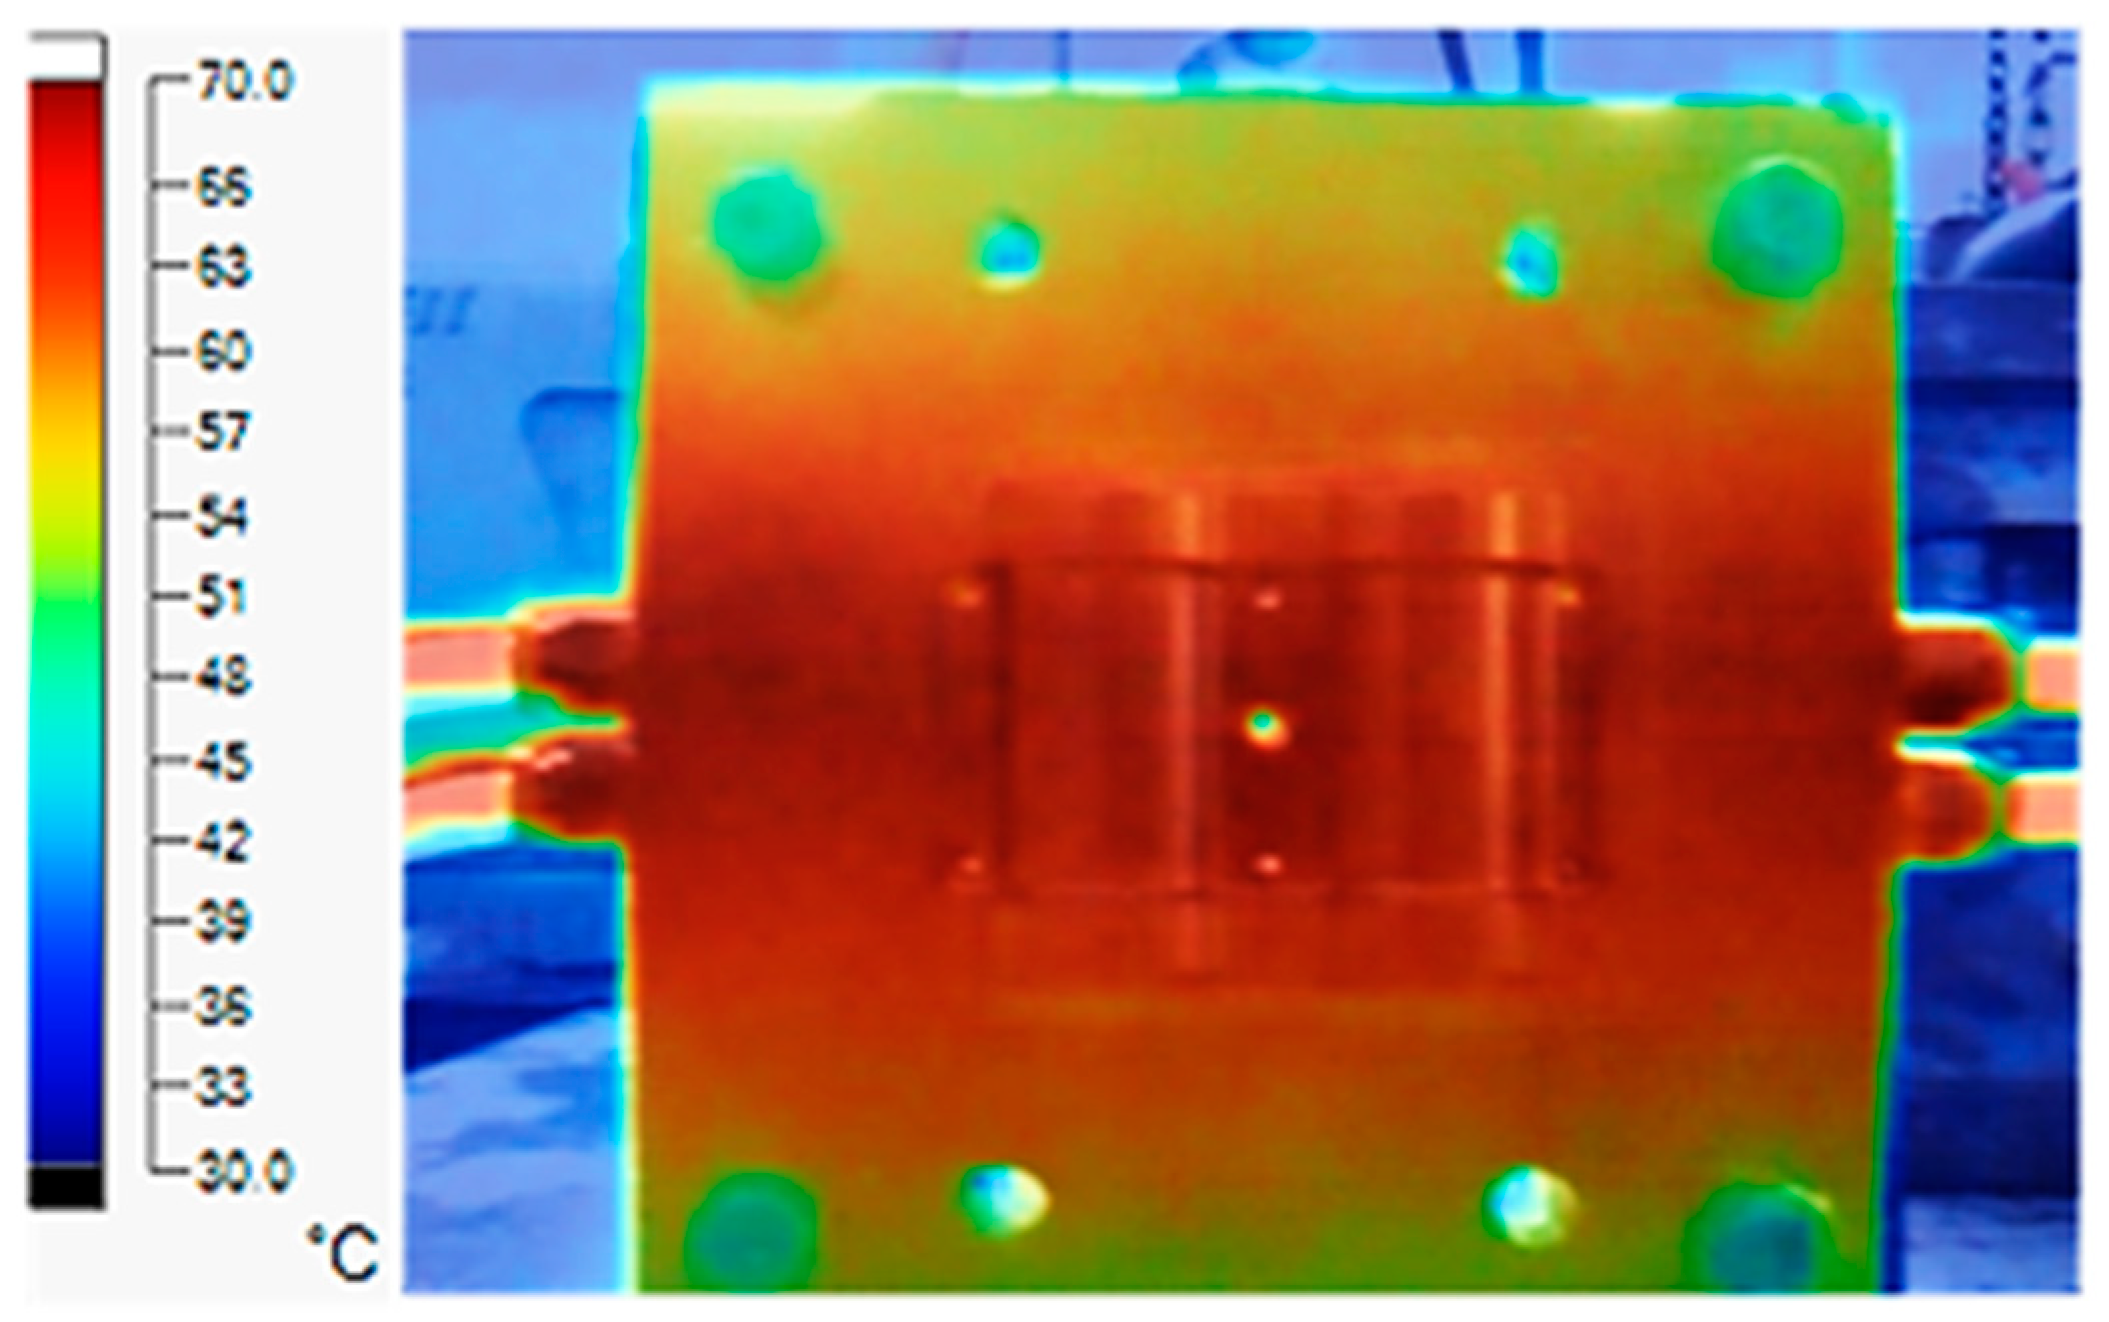
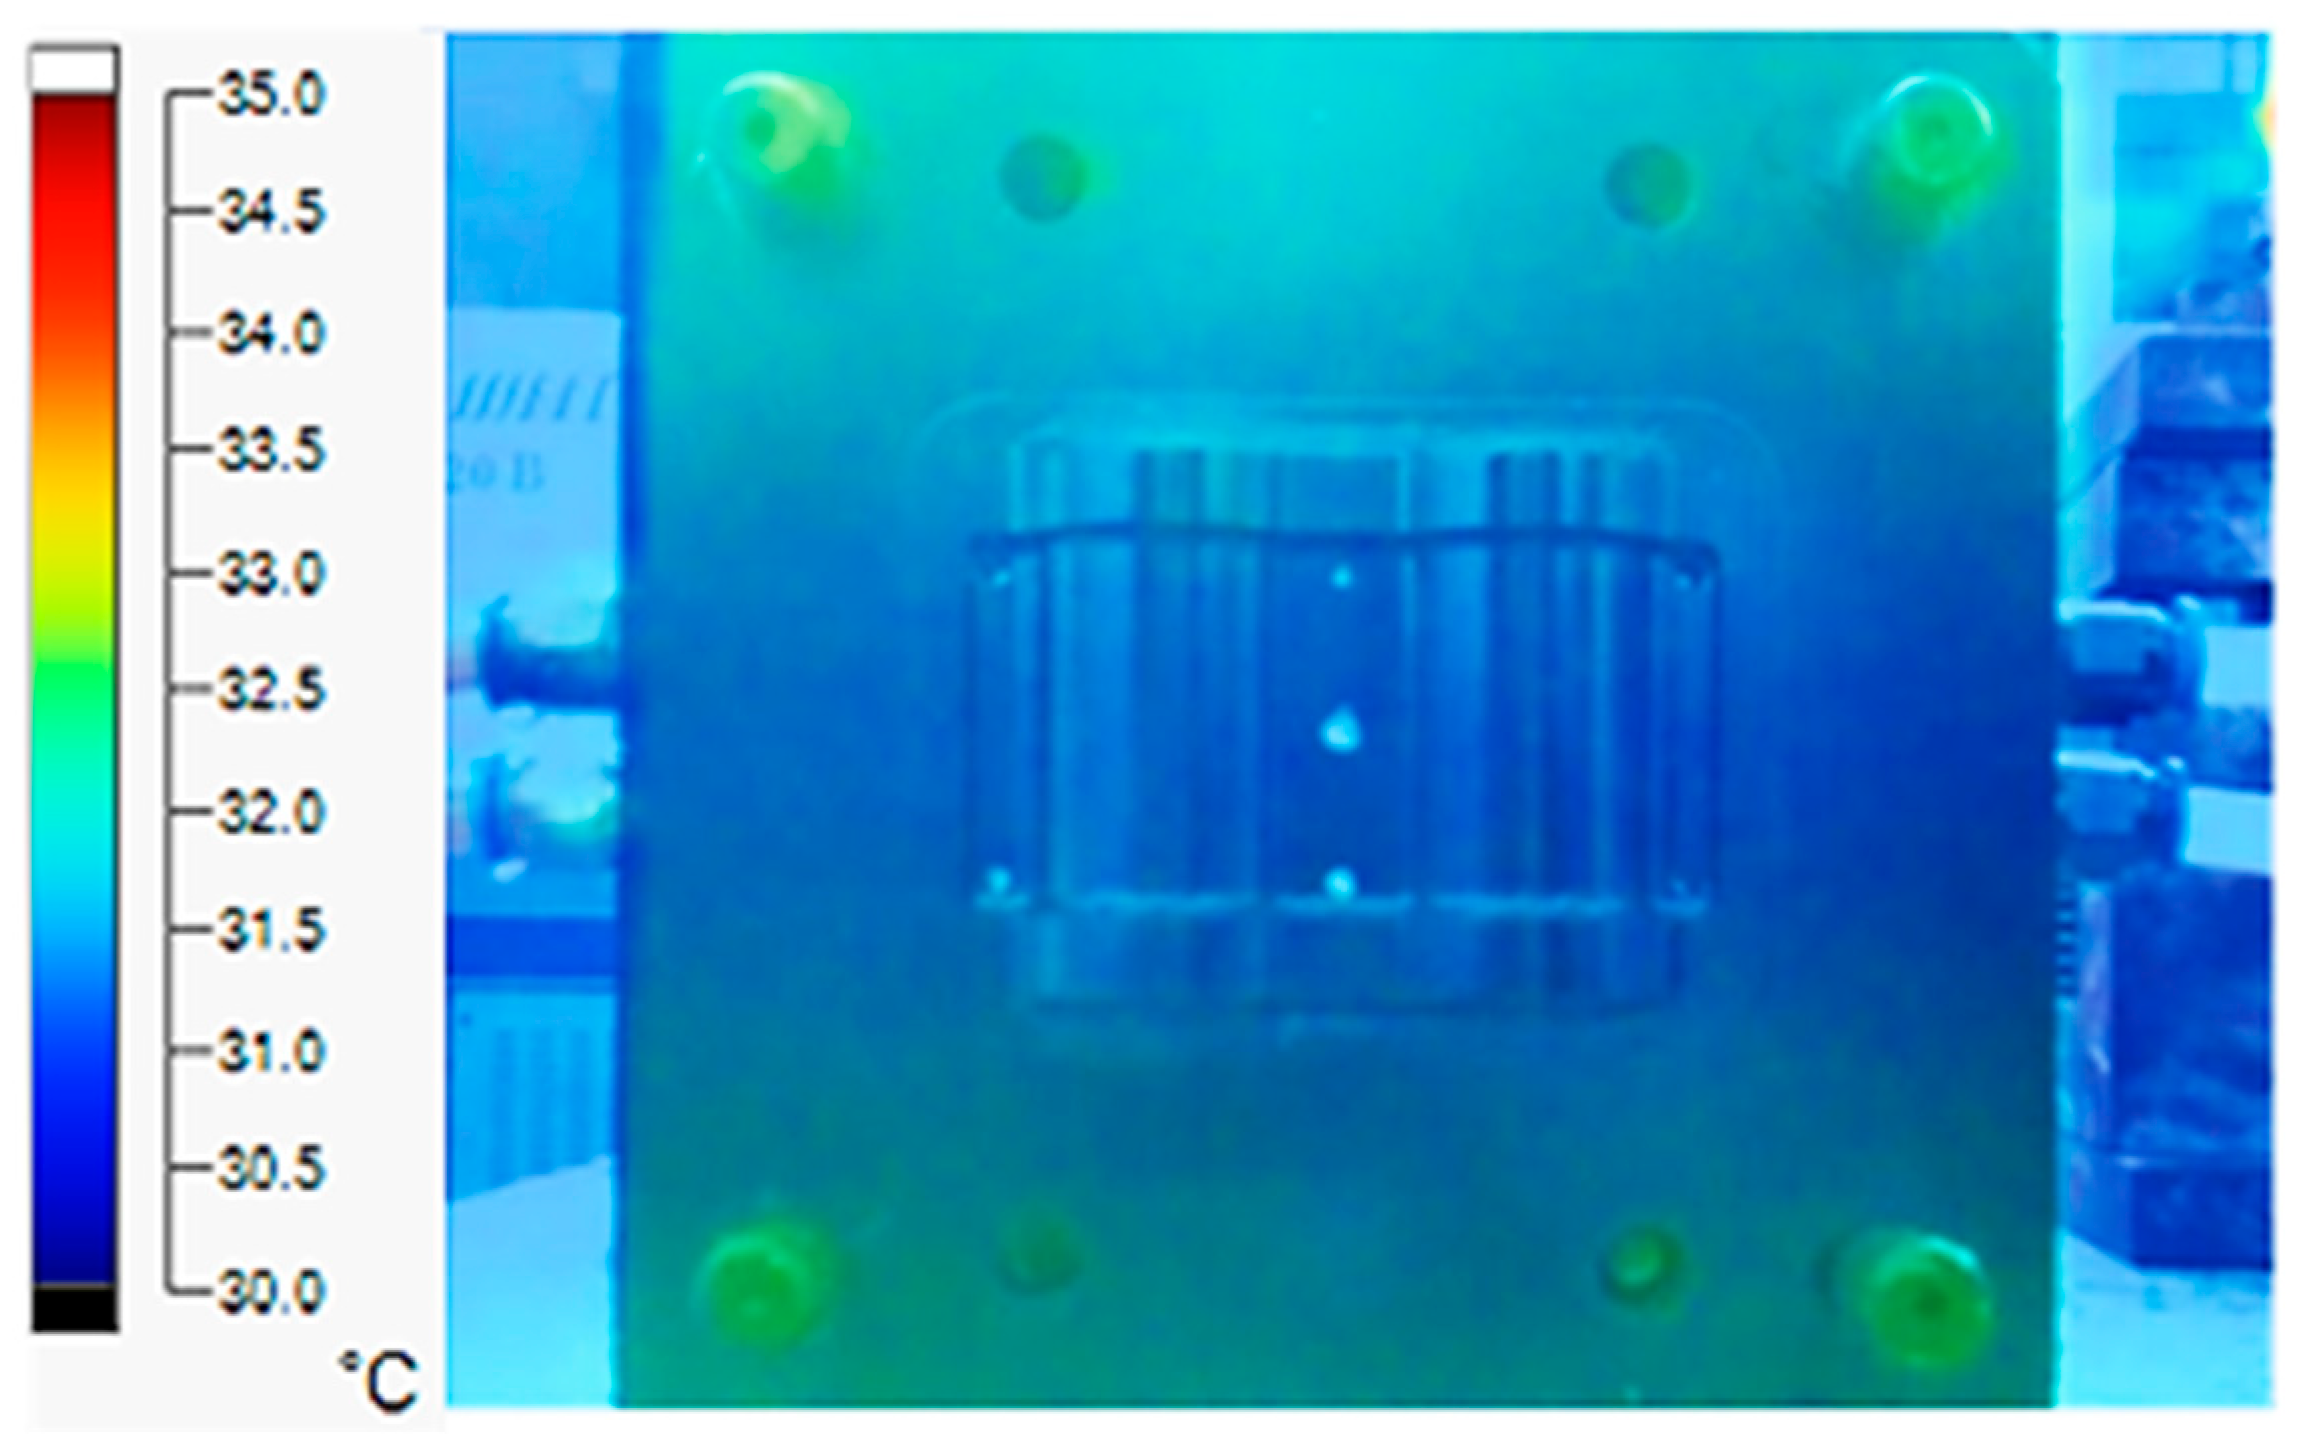
The experiment was implemented using hot water at 80 °C. An infrared camera was used to capture the temperature of the mold surface at the end of the heating and cooling steps. The temperature distributions on the mold surface at the end of the heating and cooling steps are shown in Figure 16, Figure 17, Figure 18 and Figure 19.
During the heating step, Figure 16 and Figure 17 show that when comparing the simulation and experimental results, the deviation between these two results does not vary much. Specifically, within the straight cooling channel mold, the simulation results for the average and maximum temperature were 63.01 °C and 66.8 °C, respectively, whereas the experimental results for those parameters were 64 °C and 67.8 °C. With the CCC mold, the simulation result nearly matched the experimental results. In the simulation, the average and maximum temperatures were 66.72 °C and 72.07 °C, respectively, and the experiment yielded 64.6 °C and 68.4 °C, respectively. The deviation between the simulation and the investigation was insignificant. The straight cooling channel mold was from 1 °C to 3.3 °C, whereas the CCC mold temperature deviation was from 2.12 °C to 4 °C. This error can be readily accepted because of the differences between experimental and simulation conditions, such as environmental effects, machining-modeling errors, and mold material variations. In addition, the material properties do not perfectly conform to the ideal material used in the simulation, and all these factors are attributed to the observed variations.
When comparing the experimental results between the straight and CCCs, the latter displayed more heating and cooling effectiveness on the heating mold. The temperature distribution of the CCC mold surface was more uniform than that of the straight cooling channel. The average temperature of the CCC mold was higher than the straight cooling channel mold (64.6 °C and 63.01 °C, respectively). Throughout the experiment, the CCC mold temperature remained higher than that of the straight cooling channel.
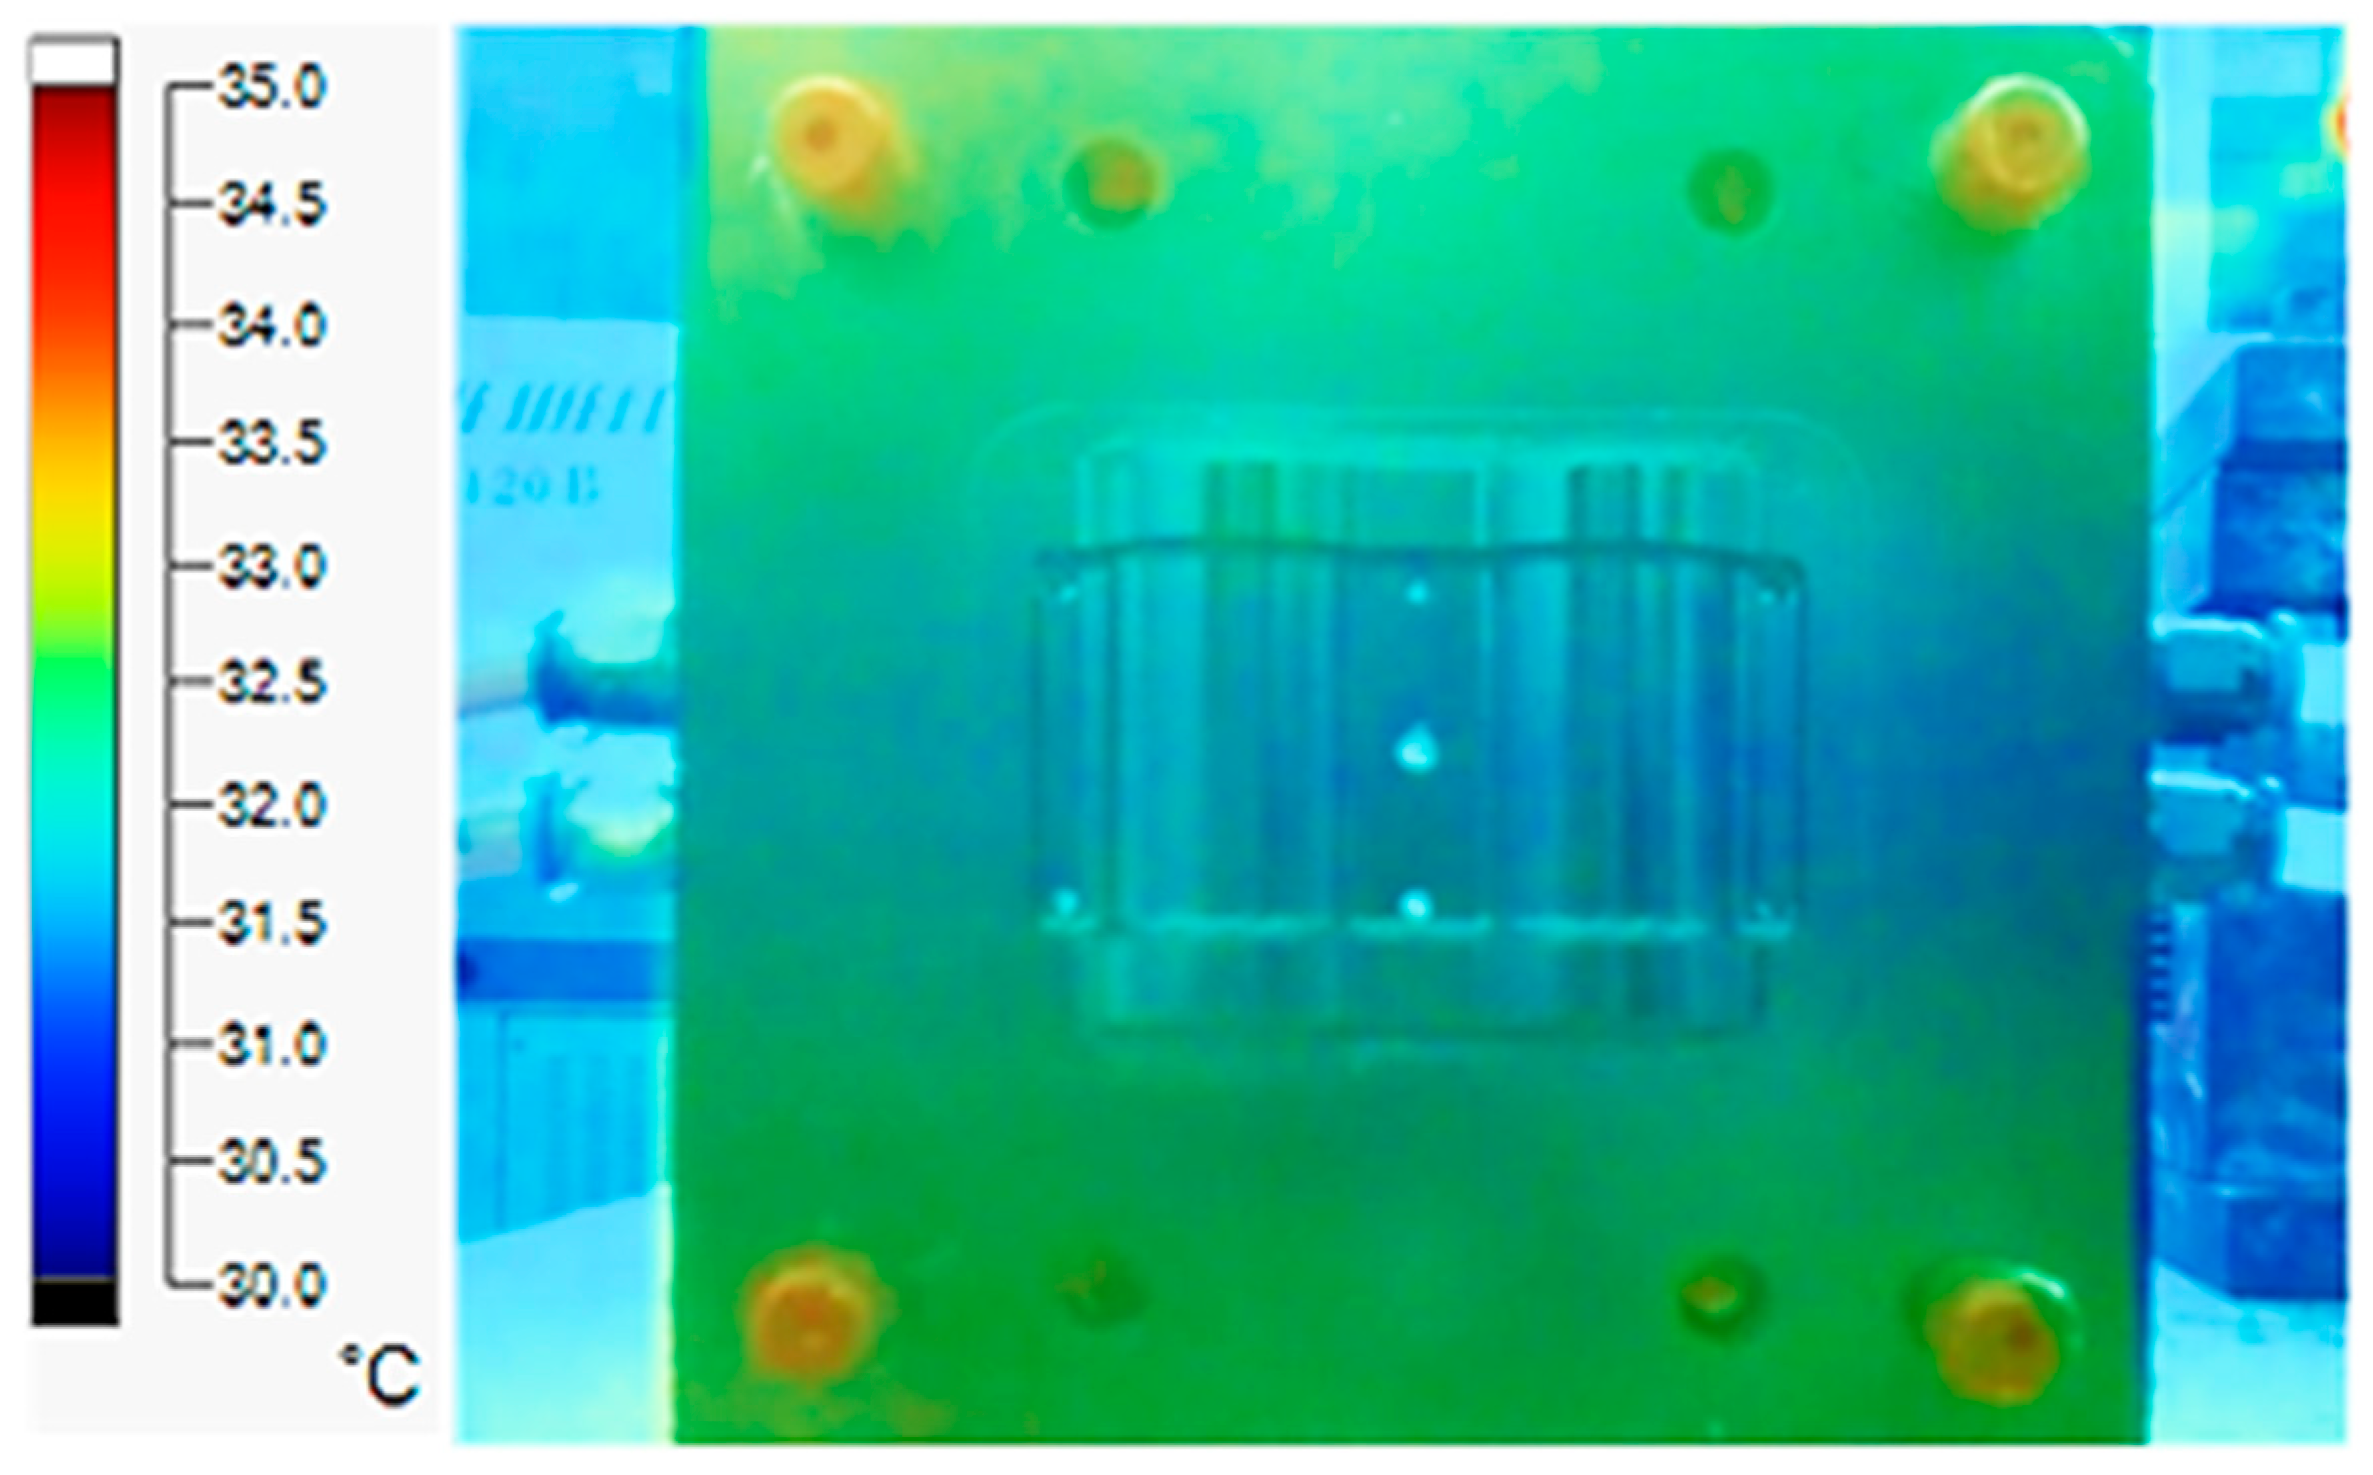
The same conditions were used for the cooling process, and the results were similar to the simulation. First, looking at the experimental result in Figure 18, the straight cooling channel mold surface shows a maximum temperature of approximately 34 °C. However, as shown in Figure 19, the temperature distribution of the mold surface was more uniform at about 31 °C. There was no point on the surface of the CCC mold where the temperature was higher than 34 °C.
Figure 20 shows the temperature distribution of the mold using a conformal and straight cooling channel during the experiment. The mold using a CCC had a faster heating speed than the other mold using a linear channel. Specifically, as shown in the figure, during the heating process, the brown lines (heating of the CCC) were always above the blue bars (heating of the straight channel), indicating that at any given time the cavity temperature of the CCC mold was higher than that of the linear channel. In the cooling process, the brown lines were always below and had a steeper slope than the blue lines, demonstrating that the 3D channel cooling capacity was higher than that of the straight channel. The temperature distribution graphs also show that the mold using a CCC had faster heating and cooling rates.
The simulation and experimental results could be compared, as presented in Figure 10 and Figure 20. The results show that this deviation is relatively small, and the results can be considered satisfactory.

3. Conclusions

This study determined the effectiveness of cooling channel geometry on the heat transfer process using the response surface methodology of two regression equations, which were modeled for average and varying temperatures with upper and lower bounds. The optimum geometry for the cooling channel was defined using these two equations. The effectiveness of the CCCs was demonstrated through analysis and verified experimentally. The average temperature was consistently higher when the CCC heated the mold. Additionally, the high-temperature heat zone in a mold that used a CCC was more significant than in molds using conventional cooling channels.

Author Contributions

T.M.T.U., P.S.M. and V.-T.N.: conceptualization and funding acquisition; P.S.M., V.-T.N. and N.C.H.: writing original draft and investigation; N.C.H. and V.-T.N.: analyzing and visualization; T.M.T.U., P.S.M. and V.-T.N.: project administration; T.T.D., P.S.M. and N.C.H.: investigation; V.T.T.N., P.S.M. and V.-T.N.: writing and review and editing. All authors have read and agreed to the published version of the manuscript.

Funding

The authors acknowledge the support of HCMC University of Technology and Education for this study.

Institutional Review Board Statement

Not applicable.

Informed Consent Statement

Not applicable.

Data Availability Statement

The data used to support the findings of this study are available from the corresponding author upon request.

Acknowledgments

The authors acknowledge the support of HCMC University of Technology and Education for this study.

Conflicts of Interest

The authors declare no conflict of interest.

References

  1. Nian, S.-C.; Li, M.-H.; Huang, M.-S. Warpage control of headlight lampshades fabricated using external gas-assisted injection molding. Int. J. Heat Mass Transf. 2015, 86, 358–368. [Google Scholar] [CrossRef]
  2. Ravikiran, B.; Pradhan, D.K.; Jeet, S.; Bagal, D.K.; Barua, A.; Nayak, S. Parametric optimization of plastic injection moulding for FMCG polymer moulding (PMMA) using hybrid Taguchi-WASPAS-Ant Lion optimization algorithm. Mater. Today Proc. 2021, 56, 2411–2420. [Google Scholar] [CrossRef]
  3. Sreedharan, J.; Jeevanantham, A. Optimization of Injection Molding Process to Minimize Weld-line and Sink-mark Defects Using Taguchi based Grey Relational Analysis. Mater. Today Proc. 2018, 5, 12615–12622. [Google Scholar] [CrossRef]
  4. Minh, P.S.; Le, M.-T. Improving the Melt Flow Length of Acrylonitrile Butadiene Styrene in Thin-Wall Injection Molding by External Induction Heating with the Assistance of a Rotation Device. Polymers 2021, 13, 2288. [Google Scholar] [CrossRef] [PubMed]
  5. Singh, M.; Sharma, S.; Muniappan, A.; Pimenov, D.Y.; Wojciechowski, S.; Jha, K.; Dwivedi, S.P.; Li, C.; Królczyk, J.B.; Walczak, D.; et al. In Situ Micro-Observation of Surface Roughness and Fracture Mechanism in Metal Microforming of Thin Copper Sheets with Newly Developed Compact Testing Apparatus. Materials 2022, 15, 1368. [Google Scholar] [CrossRef]
  6. Nhan, P.T.; Do, T.T.; Anh Son, T.; Son Minh, P. Study on External Gas-Assisted Mold Temperature Control for Improving the Melt Flow Length of Thin Rib Products in the Injection Molding Process. Adv. Polym. Technol. 2019, 5973403. [Google Scholar] [CrossRef]
  7. Chen, S.-C.; Lin, C.-Y.; Chang, J.-A.; Minh, P.S. Gas-Assisted Heating Technology for High Aspect Ratio Microstructure Injection Molding. Adv. Mech. Eng. 2013, 5, 282906. [Google Scholar] [CrossRef] [Green Version]
  8. Minh, P.S.; Do, T.T.; Uyen, T.M.T. The feasibility of external gas-assisted mold-temperature control for thin-wall injection molding. Adv. Mech. Eng. 2018, 10, 1687814018806102. [Google Scholar] [CrossRef] [Green Version]
  9. Park, H.-S.; Dang, X.-P. Optimization of conformal cooling channels with array of baffles for plastic injection mold. Int. J. Precis. Eng. Manuf. 2010, 11, 879–890. [Google Scholar] [CrossRef]
  10. Mazur, M.; Brincat, P.; Leary, M.; Brandt, M. Numerical and experimental evaluation of a conformally cooled H13 steel injection mould manufactured with selective laser melting. Int. J. Adv. Manuf. Technol. 2017, 93, 881–900. [Google Scholar] [CrossRef]
  11. Meckley, R.J. Edwards, A Study on the Design and Effectiveness of Conformal Cooling Channels in Rapid Tooling Inserts. Technol. Interface J. 2009, 10, 1–28. Available online: https://www.academia.edu/download/32648037/RT_with_cc.pdf (accessed on 10 March 2023).
  12. Shayfull, Z.; Sharif, S.; Zain, A.M.; Ghazali, M.F.; Saad, R.M. Potential of Conformal Cooling Channels in Rapid Heat Cycle Molding: A Review. Adv. Polym. Technol. 2013, 33, 21381. [Google Scholar] [CrossRef]
  13. Vojnová, E. The Benefits of a Conforming Cooling Systems the Molds in Injection Moulding Process. Procedia Eng. 2016, 149, 535–543. [Google Scholar] [CrossRef]
  14. Li, Z.; Wang, X.; Gu, J.; Ruan, S.; Shen, C.; Lyu, Y.; Zhao, Y. Topology Optimization for the Design of Conformal Cooling System in Thin-wall Injection Molding Based on BEM. Int. J. Adv. Manuf. Technol. 2018, 94, 1041–1059. [Google Scholar] [CrossRef]
  15. Sachs, E.; Wylonis, E.; Allen, S.; Cima, M.; Guo, H. Production of Injection Molding Tooling with Conformal Cooling Channels Using the Three Dimensional Printing Process; Massachusetts Institute of Technology: Cambridge, MA, USA, 1995; Available online: https://dspace.mit.edu/bitstream/handle/1721.1/10727/36829909-MIT.pdf?sequence=2 (accessed on 15 March 2023).
  16. Song, Y.A.; Park, S.; Jee, H.; Choi, D.; Shin, B. 3D welding and milling—A direct approach for fabrication of injection molds. In Proceedings of the Solid Freeform Fabrication Symposium; University of Texas at Austin: Austin, TX, USA, 1999; pp. 793–800. [Google Scholar]
  17. Song, Y.A.; Park, S.; Hwang, K.; Choi, D.; Jee, H. 3D welding and milling for direct prototyping of metallic parts. In 1998 International Solid Freeform Fabrication Symposium; The University of Texas at Austin: Austin, TX, USA, 1998; pp. 495–502. [Google Scholar] [CrossRef]
  18. Kuo, C.-C.; Chen, B.-C. Development of hot embossing stamps with conformal cooling channels for microreplication. Int. J. Adv. Manuf. Technol. 2016, 88, 2603–2608. [Google Scholar] [CrossRef]
  19. Cheng, R.; Wu, X.Y.; Zheng, J.P. Indirect rapid manufacture of injection mould with conformal cooling channels based on SLS. Die Mould Ind. 2011, 37, 70–75. [Google Scholar]
  20. Yang, Y.; Hannula, S.-P. Development of precision spray forming for rapid tooling. Mater. Sci. Eng. A 2008, 477, 63–68. [Google Scholar] [CrossRef]
  21. Dang, X.-P.; Park, H.-S. Design of U-shape milled groove conformal cooling channels for plastic injection mold. Int. J. Precis. Eng. Manuf. 2011, 12, 73–84. [Google Scholar] [CrossRef]
  22. Shayfull, Z.; Sharif, S.; MohdZain, A.; MohdSaad, R.; Fairuz, M.A. Milled Groove Square Shape Conformal Cooling Channels in Injection Moulding Process. Mater. Manuf. Process. 2013, 28, 884–891. [Google Scholar] [CrossRef]
  23. Saifullah, A.B.M.; Masood, S.H.; Sbarski, I. New cooling channel design for injection moulding. In Proceedings of the World Congress on Engineering, London, UK, 1–3 July 2009. [Google Scholar]
  24. Huang, J.; Lu, Y.; Wang, Q.; Lin, F. Design and Fabrication of Conformal Cooling Channels with Vacuum Diffusion Bonding. Recent Patents Chem. Eng. 2014, 6, 176–183. [Google Scholar] [CrossRef]
  25. Hughes, A. Method of Manufacturing a Mold with Conformal Cooling Passages and Mold Manufactured According to Said Method. US Patent Application US 13/679,318, 21 March 2013. [Google Scholar]
  26. Ahari, H.; Khajepour, A.; Bedi, S. Manufacturing optimization of laminated tooling with conformal cooling channels. Rapid Prototyp. J. 2011, 17, 429–440. [Google Scholar] [CrossRef]
  27. Ahari, H.; Khajepour, A.; Bedi, S. Laminated injection mould with conformal cooling channels: Optimization, fabrication and testing. J. Mach. Manuf. Autom. 2013, 2, 16–24. [Google Scholar]
  28. Hölker, R.; Haase, M.; Ben Khalifa, N.; Tekkaya, A.E. Hot Extrusion Dies with Conformal Cooling Channels Produced by Additive Manufacturing. Mater. Today Proc. 2015, 2, 4838–4846. [Google Scholar] [CrossRef]
  29. Yoo, S. Design of Conformal Cooling/Heating Channels for Layered Tooling. In Proceedings of the 2008 International Conference on Smart Manufacturing Application, Goyang-Si, Republic of Korea, 9–11 April 2008; IEEE: Piscataway, NJ, USA, 2008; pp. 126–129. [Google Scholar] [CrossRef]
  30. Williams, R.E.; Walczyk, D.F.; Dang, H.T. Using abrasive flow machining to seal and finish conformal channels in laminated tooling. Rapid Prototyp. J. 2007, 13, 64–75. [Google Scholar] [CrossRef]
  31. Dimitrov, D.; Moammer, A. Investigation of the impact of conformal cooling on the performance of injection moulds for the packaging industry. J. New Gener. Sci. 2003, 8, 29–46. [Google Scholar]
  32. Wang, L.; Wei, Q.S.; Xue, P.J.; Shi, Y.S. Fabricate Mould Insert with Conformal Cooling Channel Using Selective Laser Melting. Adv. Mater. Res. 2012, 502, 67–71. [Google Scholar] [CrossRef]
  33. Klingaa, C.G.; Technical University of Denmark (DTU); Bjerre, M.K.; Baier, S.; De Chiffre, L.; Mohanty, S.; Hattel, J.H. Roughness Investigation of SLM Manufactured Conformal Cooling Channels Using X-ray Computed Tomography. In Proceedings of the 9th Conference on Industrial Computed Tomography (ICT 2019), Padova, Italy, 13–15 February 2019; pp. 1–10. [Google Scholar] [CrossRef]
  34. Feng, S.; Chen, S.; Kamat, A.M.; Zhang, R.; Huang, M.; Hu, L. Investigation on shape deviation of horizontal interior circular channels fabricated by laser powder bed fusion. Addit. Manuf. 2020, 36, 101585. [Google Scholar] [CrossRef]
  35. Legesse, F.; Karunakaran, K.P. Additive manufacturing of tooling element with conformal cooling channel. J. Def. Technol. 2015, 10, 82–89. [Google Scholar]
  36. Karunakaran, K.; Kapil, S.; Vithasth, H.; Legesse, F. Additive manufacturing of H13 tooling element with conformal cooling channel using MIG cladding. Int. J. Rapid Manuf. 2018, 7, 1–24. [Google Scholar] [CrossRef] [Green Version]
  37. Soshi, M.; Ring, J.; Young, C.; Oda, Y.; Mori, M. Innovative grid molding and cooling using an additive and subtractive hybrid CNC machine tool. CIRP Ann. 2017, 66, 401–404. [Google Scholar] [CrossRef]
  38. Eiamsa-Ard, K.; Wannissorn, K. Conformal bubbler cooling for molds by metal deposition process. Comput. Des. 2015, 69, 126–133. [Google Scholar] [CrossRef]
  39. Park, H.-S.; Dang, X.-P. Development of a Smart Plastic Injection Mold with Conformal Cooling Channels. Procedia Manuf. 2017, 10, 48–59. [Google Scholar] [CrossRef]
  40. Jahan, S.A.; Wu, T.; Zhang, Y.; Zhang, J.; Tovar, A.; Elmounayri, H. Thermo-mechanical Design Optimization of Conformal Cooling Channels using Design of Experiments Approach. Procedia Manuf. 2017, 10, 898–911. [Google Scholar] [CrossRef]
  41. Venkatesh, G.; Kumar, Y.R. Thermal Analysis for Conformal Cooling Channel. Mater. Today Proc. 2017, 4, 2592–2598. [Google Scholar] [CrossRef]
  42. Barbeiro, S.; Enguiça, R.; Lobo, D. Automatic Generation of Conformal Cooling Channels in Injection Moulding. Comput. Des. 2022, 150, 103312. [Google Scholar] [CrossRef]
  43. Minh, P.S.; Nguyen, V.-T.; Nguyen, V.T.; Uyen, T.M.T.; Do, T.T.; Nguyen, V.T.T. Study on the Fatigue Strength of Welding Line in Injection Molding Products under Different Tensile Conditions. Micromachines 2022, 13, 1890. [Google Scholar] [CrossRef]
  44. Shen, S.; Kanbur, B.B.; Zhou, Y.; Duan, F. Thermal and mechanical analysis for conformal cooling channel in plastic injection molding. Mater. Today Proc. 2020, 28, 396–401. [Google Scholar] [CrossRef]
  45. Jahan, S.A.; El-Mounayri, H. Optimal Conformal Cooling Channels in 3D Printed Dies for Plastic Injection Molding. Procedia Manuf. 2016, 5, 888–900. [Google Scholar] [CrossRef] [Green Version]
  46. Venkatesh, G.; Kumar, Y.R.; Raghavendra, G. Comparison of Straight Line to Conformal Cooling Channel in Injection Molding. Mater. Today Proc. 2017, 4, 1167–1173. [Google Scholar] [CrossRef]
  47. Kitayama, S.; Tamada, K.; Takano, M.; Aiba, S. Numerical optimization of process parameters in plastic injection molding for minimizing weldlines and clamping force using conformal cooling channel. J. Manuf. Process. 2018, 32, 782–790. [Google Scholar] [CrossRef]
  48. Khuri, I.A.; Cornell, A.J. Response Surfaces: Designs and Analyses, 2nd ed.; Marcel Dekker Inc.: New York, NY, USA, 1996. [Google Scholar]
  49. Şimşek, B.; Iç, Y.T.; Şimşek, E.H. A RSM-Based Multi-Response Optimization Application for Determining Optimal Mix Proportions of Standard Ready-Mixed Concrete. Arab. J. Sci. Eng. 2015, 41, 1435–1450. [Google Scholar] [CrossRef]
  50. Nguyen, T.T.; Tran, V.T.; Pham, T.H.N.; Nguyen, V.-T.; Thanh, N.C.; Thi, H.M.N.; Duy, N.V.A.; Thanh, D.N.; Nguyen, V.T.T. Influences of Material Selection, Infill Ratio, and Layer Height in the 3D Printing Cavity Process on the Surface Roughness of Printed Patterns and Casted Products in Investment Casting. Micromachines 2023, 14, 395. [Google Scholar] [CrossRef]
  51. The Mould Design Guide; Smithers Rapra Technology: Shawbury, UK, 2008.
  52. Harrington, E.C., Jr. The desirability function industrial. Qual. Control 1965, 21, 494–498. [Google Scholar]
  53. Derringer, G.; Suich, R. Simultaneous Optimization of Several Response Variables. J. Qual. Technol. 1980, 12, 214–219. [Google Scholar] [CrossRef]
  54. Cheng, C.-D.; Liao, Y.-L.; Tsai, H.-H. Investigation of the Warpage of a High-Density Polyethylene Pallet by Plastic Injection Compression Molding: Part I—Numerical Approach. Polymers 2022, 14, 1437. [Google Scholar] [CrossRef] [PubMed]
  55. Ren, J.; Lin, L.; Jiang, J.; Li, Q.; Hwang, S.-S. Effect of Gas Counter Pressure on the Surface Roughness, Morphology, and Tensile Strength between Microcellular and Conventional Injection-Molded PP Parts. Polymers 2022, 14, 1078. [Google Scholar] [CrossRef]
  56. Turek, P.; Budzik, G.; Sęp, J.; Oleksy, M.; Józwik, J.; Przeszłowski, Ł.; Paszkiewicz, A.; Kochmański, Ł.; Żelechowski, D. An Analysis of the Casting Polymer Mold Wear Manufactured Using PolyJet Method Based on the Measurement of the Surface Topography. Polymers 2020, 12, 3029. [Google Scholar] [CrossRef] [PubMed]
Figure 1. Detailed drawing of the experimental product.
Polymers 15 02793 g001
Figure 2. CAD model of the injection mold.
Polymers 15 02793 g002
Figure 3. Design parameters for the conformal cooling channel (CCC) on core plate with the side view (a) and the cross-section X-X (b).
Polymers 15 02793 g003
Figure 4. Schematic of heat transfer.
Polymers 15 02793 g004
Figure 5. Testing surfaces (a) and meshing model (b).
Polymers 15 02793 g005
Figure 6. Face–center design schematic.
Polymers 15 02793 g006
Figure 7. Desirability function of the maximum optimization (a) and the minimum optimization (b).
Polymers 15 02793 g007
Figure 8. Optimization process diagram.
Polymers 15 02793 g008
Figure 9. Optimization plots for responses P8 and P9.
Polymers 15 02793 g009
Figure 10. Average temperature between the CCC and a conventional cooling channel.
Polymers 15 02793 g010
Figure 11. Manufacturing equipment for the GMAW deposition and milling process.
Polymers 15 02793 g011
Figure 12. Insert for forming the CCC in the WAAD process.
Polymers 15 02793 g012
Figure 13. Cooling channel assembled to the mold base with the 3D model (a) and the experimental part (b).
Polymers 15 02793 g013
Figure 14. Mold base generated with WAAM.
Polymers 15 02793 g014
Figure 15. Finished model.
Polymers 15 02793 g015
Figure 16. Straight cooling channel heating result.
Polymers 15 02793 g016
Figure 17. CCC heating.
Polymers 15 02793 g017
Figure 18. Straight cooling channel cooling result.
Polymers 15 02793 g018
Figure 19. CCC cooling result.
Polymers 15 02793 g019
Figure 20. Temperature history of the testing surface for the CCC and conventional cooling channels.
Polymers 15 02793 g020
Table 1. Design guidelines for cooling channels.
Product ThicknessChannel DiameterDistance between Two ChannelsDistance from the Channel Centerline to the Mold Surface
2 mm8–10 mm24~40 mm16~30 mm
4 mm10–12 mm30~48 mm20~36 mm
6 mm12–15 mm36~60 mm24~45 mm
Table 2. CCC design parameter range.
Lower Bound (mm)Upper Bound (mm)
H3 (x1)3540
H4 (x2)5055
V5 (x3)515
V6 (x4)1523
V7 (x5)1624
D1 (x6)810
FD1 (x7)2440
Table 3. Density and thermal properties of aluminum and water.
Density
(kg·m−3)
Specific Heat
(J·kg−1·K−1)
Thermal Conductivity
(W·m−1·K)
Heat Transfer Coefficients (W·m−2·K)
Water997.04181.70.65200
Aluminum2720903205.0013
Table 4. Analysis of variance for all factors with response P8.
SourceDFAdj SSAdj MSF-Valuep-Value
Model173941.18231.83617.160.000
 Linear73802543.141445.890.000
  H3113.8413.8436.840.000
  H412.122.125.640.019
  V511018.711018.712711.90.000
  V612.082.085.550.020
  V7132.5432.5486.620.000
  D1177.9877.98207.590.000
  FD112654.732654.737067.120.000
 Square142.3942.39112.840.000
  V5*V5142.3942.39112.840.000
 Two-Way Interaction996.7910.7528.630.000
  H3*H411.821.824.850.030
  H3*V518.088.0821.510.000
  H3*V611.621.624.30.040
  H3*V716.186.1816.440.000
  V5*V6128.228.275.070.000
  V5*V713.513.519.350.003
  V5*FD113.863.8610.290.002
  V6*V7140.5740.571080.000
  V6*FD112.962.967.880.006
Error12546.960.38
Total1423988.14
SR-sqR-sq (adj)
0.61288998.82%98.66%
Table 5. Analysis of variance for all factors with response P9.
SourceDFAdj SSAdj MSF-Valuep-Value
Model211889.0389.952861.980.000
 Linear71824.79260.688293.950.000
  H310.430.4313.640.000
  H410.150.154.670.033
  V511151.521151.5236,636.80.000
  V611.321.3242.130.000
  V7116.3116.31519.040.000
  D11313.69313.699980.470.000
  FD11341.37341.3710,860.90.000
 Square10.570.5718.040.000
  FD1*FD110.570.5718.040.000
 Two-Way Interaction1363.674.9155.830.000
  H3*V510.180.185.740.018
  H3*V610.570.57180.000
  H3*V710.710.7122.450.000
  H4*V510.240.247.530.007
  H4*V610.130.134.020.047
  H4*V710.230.237.210.008
  V5*V617.257.25230.550.000
  V5*V7120.8820.88664.290.000
  V5*FD1125.1225.12799.210.000
  V6*V715.315.31168.90.000
  V6*FD110.140.144.470.036
  V7*FD110.120.123.730.056
  D1*FD112.822.8289.740.000
Error1213.80.03
Total1421892.83
SR-sqR-sq (adj)
0.17728799.80%99.76%
Table 6. Simulation result of two combination variables.
H3H4V5V6V7D1FD1P8P9
35505232482413.0862.94
35505231684010.0362.64
Table 7. Optimum point and predicted values of each response.
SolutionH3H4V5V6V7D1FD1P9
Fit
P8
Fit
Composite
Desirability
140507.531516104067.249413.22920.802845
Table 8. Comparison between RSM prediction and simulation results.
H3H4V5V6V7D1FD1P9P8
Prediction40507.51516104067.25 °C13.23 °C
Simulation62.34 °C12.59 °C
Table 9. Temperature distribution of the testing surface during the heating process.
Conformal Cooling ChannelConventional Cooling Channel
Heating processPolymers 15 02793 i001Polymers 15 02793 i002
Table 10. Temperature distribution of the mold surface during the cooling process.
Conformal Cooling ChannelConventional Cooling Channel
Cooling processPolymers 15 02793 i003Polymers 15 02793 i004
Table 11. Temperature distribution at each section.
Conformal Cooling ChannelConventional Cooling Channel
Polymers 15 02793 i005Polymers 15 02793 i006
A-APolymers 15 02793 i007Polymers 15 02793 i008
B-BPolymers 15 02793 i009Polymers 15 02793 i010
C-CPolymers 15 02793 i011Polymers 15 02793 i012
D-DPolymers 15 02793 i013Polymers 15 02793 i014
Disclaimer/Publisher’s Note: The statements, opinions and data contained in all publications are solely those of the individual author(s) and contributor(s) and not of MDPI and/or the editor(s). MDPI and/or the editor(s) disclaim responsibility for any injury to people or property resulting from any ideas, methods, instructions or products referred to in the content.