3.1. Mechanical Tests
The PLA/CLS composite samples printed using the FDM technique were tested for impact, tensile, and flexural strength properties, both after conditioning at room temperature and after accelerated ageing in a weathering chamber—
Figure 2,
Figure 3 and
Figure 4.
In the previous paper, similar tests were carried out on samples produced by injection moulding [
24]. Impact strength of neat-injection-moulded polylactide samples was approximately 19 kJ/m
2, while after accelerated ageing in the weathering chamber, it decreased by 5 kJ/m
2. The impact strength of the reference 3D-printed sample was 19.3 kJ/m
2 and approximately 21 kJ/m
2 after ageing in the weathering chamber (
Figure 2). As in the neat PLA samples, most filled samples of both types showed some reinforcement after accelerated ageing in the weathering chamber. CLS filler introduced a gradual decrease in impact strength with its content; however, sedA CaCO
3-rich systems generally showed worse properties than sedB systems with mixed components filler (additional hardening effect of silica and aluminosilicates).
Figure 2.
Impact strength of composites obtained by 3D printing; RT—room temperature, CCh—climate chamber.
Figure 2.
Impact strength of composites obtained by 3D printing; RT—room temperature, CCh—climate chamber.
Cyclic conditioning at temperatures reaching +50 °C, close to the T
g of PLA, may have caused an increase in the ratio of the PLA crystalline phase with better mechanical properties than the amorphous one. This was also observed for most of the other mineral-filler-containing PLA systems tested and for the other printed objects subjected to varying temperatures [
25,
26]. The lower impact strength of filled samples than that of neat PLA can be explained by the presence of internal notches in the material resulting from weak interactions at the interfacial boundary between the mineral filler grains and the polymer matrix. Mineral fillers, e.g., aluminosilicates, often agglomerate in the polymer matrix [
27]. Impact strength tests have shown that composites containing SedA and SedB have similar impact strengths in general. However, the broad results distribution introduced by the high anisotropy of the properties in such systems hinders a proper assessment of the filler effect [
28].
The tensile strength of a neat printed polylactide exhibited a value of 60 MPa, both before and after the accelerated weathering test (
Figure 3). This is slightly lower than for the injected samples. Significant differences were observed for the sediment-filled systems, especially in the sedA series.
The addition of the CLS fillers used did not significantly impair the tensile strength of the printed samples. A decrease in strength below 55 MPa occurred only at high filler content in the polymer matrix (10% SedA and 15% SedB). For all systems tested, a slight improvement in strength was observed after CCh, with the exception of the 10sedA composition in the PLA samples (
Figure 3).
Figure 3.
Tensile strength of printed composites; RT—room temperature, CCh—weathering chamber.
Figure 3.
Tensile strength of printed composites; RT—room temperature, CCh—weathering chamber.
The elasticity of PLA/CLS composites on the base of elongation at break is lower compared with the unmodified polymer. This decrease in elasticity is proportional to the increase in stiffness (Young’s modulus) caused by the addition of the sediments (
Table 4). After the accelerated ageing in the weathering chamber, the stiffness of the SedB specimens remained at the same level, while an increase in elasticity was observed. Composites containing SedA show deteriorated stiffness as a result of being in the weathering chamber. The tensile behavior of the pure polymer does not change significantly as a result of ageing in the weathering chamber.
On the basis of flexural strength tests, it can be concluded that the presence of sedB results in higher elasticity compared with the composite samples with sedA. Moreover, the parameters obtained for the composite with sedB are higher compared with the tests conducted for neat PLA (
Figure 4).
The flexural strength and stiffness of 3D-printed neat PLA deteriorated due to the cyclic exposure to varying temperatures. The 15sedA- and 2.5SedB-printed composites exhibited flexural strength at the level of the neat PLA. Conditioning the SedA samples in a weathering chamber resulted in a decrease in flexural strength relative to the reference materials conditioned at room temperature (RT). The stiffness of PLA after the introduction of fillers to the polymer matrix remained unchanged or improved for most of the tested printed samples (except for 5SedA). The flexural modulus decreased for PLA and samples containing SedA after CCh. Young’s (flexural) modulus of the SedB composites was kept relatively constant throughout the filler concentration.
Figure 4.
Maximum flexural stress of printed composites (left); Flexural modulus of printed composites (right); RT—room temperature, CCh—weathering chamber.
Figure 4.
Maximum flexural stress of printed composites (left); Flexural modulus of printed composites (right); RT—room temperature, CCh—weathering chamber.
The phenomenon of improvement of the mechanical properties after treatment in the climate chamber was also observed for the samples that were obtained by the injection moulding technique [
24]. The operation of the climate chamber can be regarded as a short-term conditioning of the samples, which had a positive effect on the mechanical properties of the PLA/CLS composites.
The ANOVA (ANalysis Of VAriance) is a statistical test to determine whether two or more population means are different. In other words, it is used to compare two or more groups to see whether they are significantly different. The results of the stress tests were grouped into sets according to lake sediment content, sediment sampling depth, and the effect of climate chamber operation, and a multivariate analysis of variance with the aov function from the stats package was performed. The results obtained in the strength tests were analysed, and the results are shown in
Figure 5.
The results of the analysis of variance indicated the rejection of the hypothesis of equality of means and allowed us to assume that all values differed in a statistically significant way. The highest differences were shown in the CCh score group for flexural modulus (F = 79.98), sampling depth for flexural strength (F = 289.16), filler concentration: sampling depth for tensile strength (F = 123.012), and CCh score group for impact strength (F = 43.647).
3.4. Composite Surface Morphology—Optical and Electron Microscopy and SEM/EDS Mapping
All images of the surface of the samples were taken at 300× magnification. A portion of the center part of the surface of the sample was analyzed, i.e., in the middle of the width and in the middle of the length, resulting in the observation of only the filling line of the top layer of the 3D model in the images. No changes were observed in the surface structure of the samples after ageing in the weathering chamber, either for the PLA reference sample or the composites with carbonate lake sediments. The filler agglomerates resulted in surface roughness of the printed composites, and their number and diameter increased with filler concentration.
Figure 7 shows the layer thickness and distance measurements.
Table 6 summarizes the fill line width measurements for two adjacent lines for each sample.
In the 3D printing process, a nozzle with a diameter of 400 μm was used, so the fill line width of the printed samples should have been close to this value. Neither measurement of the fill line width for the neat PLA reference sample without filler additive differed much from the value set in the cutting program (“slicer”). For the composite samples with sediments, the fill line widths were significantly lower and deviated from the nominal nozzle diameter (400 μm).
The lowest, as well as the highest, values of fill line width were recorded for the 2.5sedB sample. This error was due to the partial overlap of the two lines. The significant differences in the fill line width values of the composite samples were due to changes in the rheological properties of the materials melted in the printer nozzle, as well as to the inhomogeneity of the composite and the lower dispersion of the filler in the polymer matrix. These factors were able to affect the uniformity of material dispensing during the printing process, resulting in uneven structures and microstructures.
Figure 8 and
Figure 9 show images of the surfaces of FDM-printed samples taken with a digital optical microscope before (
Figure 8) and after ageing in the weathering chamber (
Figure 9).
Observations of the breakthroughs of the samples were also made. Microscopic analysis was performed at the upper left corner of the cross section (
Figure 10), so the images taken show two outline lines on the left side of the photo and model fill lines arranged at a 45° angle to the outline. The images were taken using the 3D depth composition function and 100× magnification.
Figure 11 shows an image of the breakthrough cross section of the contour lines of a PLA sample and a composite with 15% filler content.
Figure 12 and
Figure 13 show images of the cross section of the specimens after the impact strength test prior to and after ageing in the weathering chamber. The contour lines break transversely to their length during the impact, so the cross-sectional shape of the successively superimposed contour lines, the size of the voids between them, and where they overlap can be seen. Comparing the photos of specimens before and after accelerated ageing in the climatic chamber, no significant differences are observed. Where the contour lines overlap with the filler lines, the breakthrough structure is noticeably more uniform, with no voids, compared with the breakthrough structure closer to the center of the sample. As the filler content increases, the fracture lines disappear.
Under microscopic observations, the defects in the composites structure were seen, which may have been a result of both the processing and the filler used. Examples of the possible types of defects are shown schematically in
Figure 14.
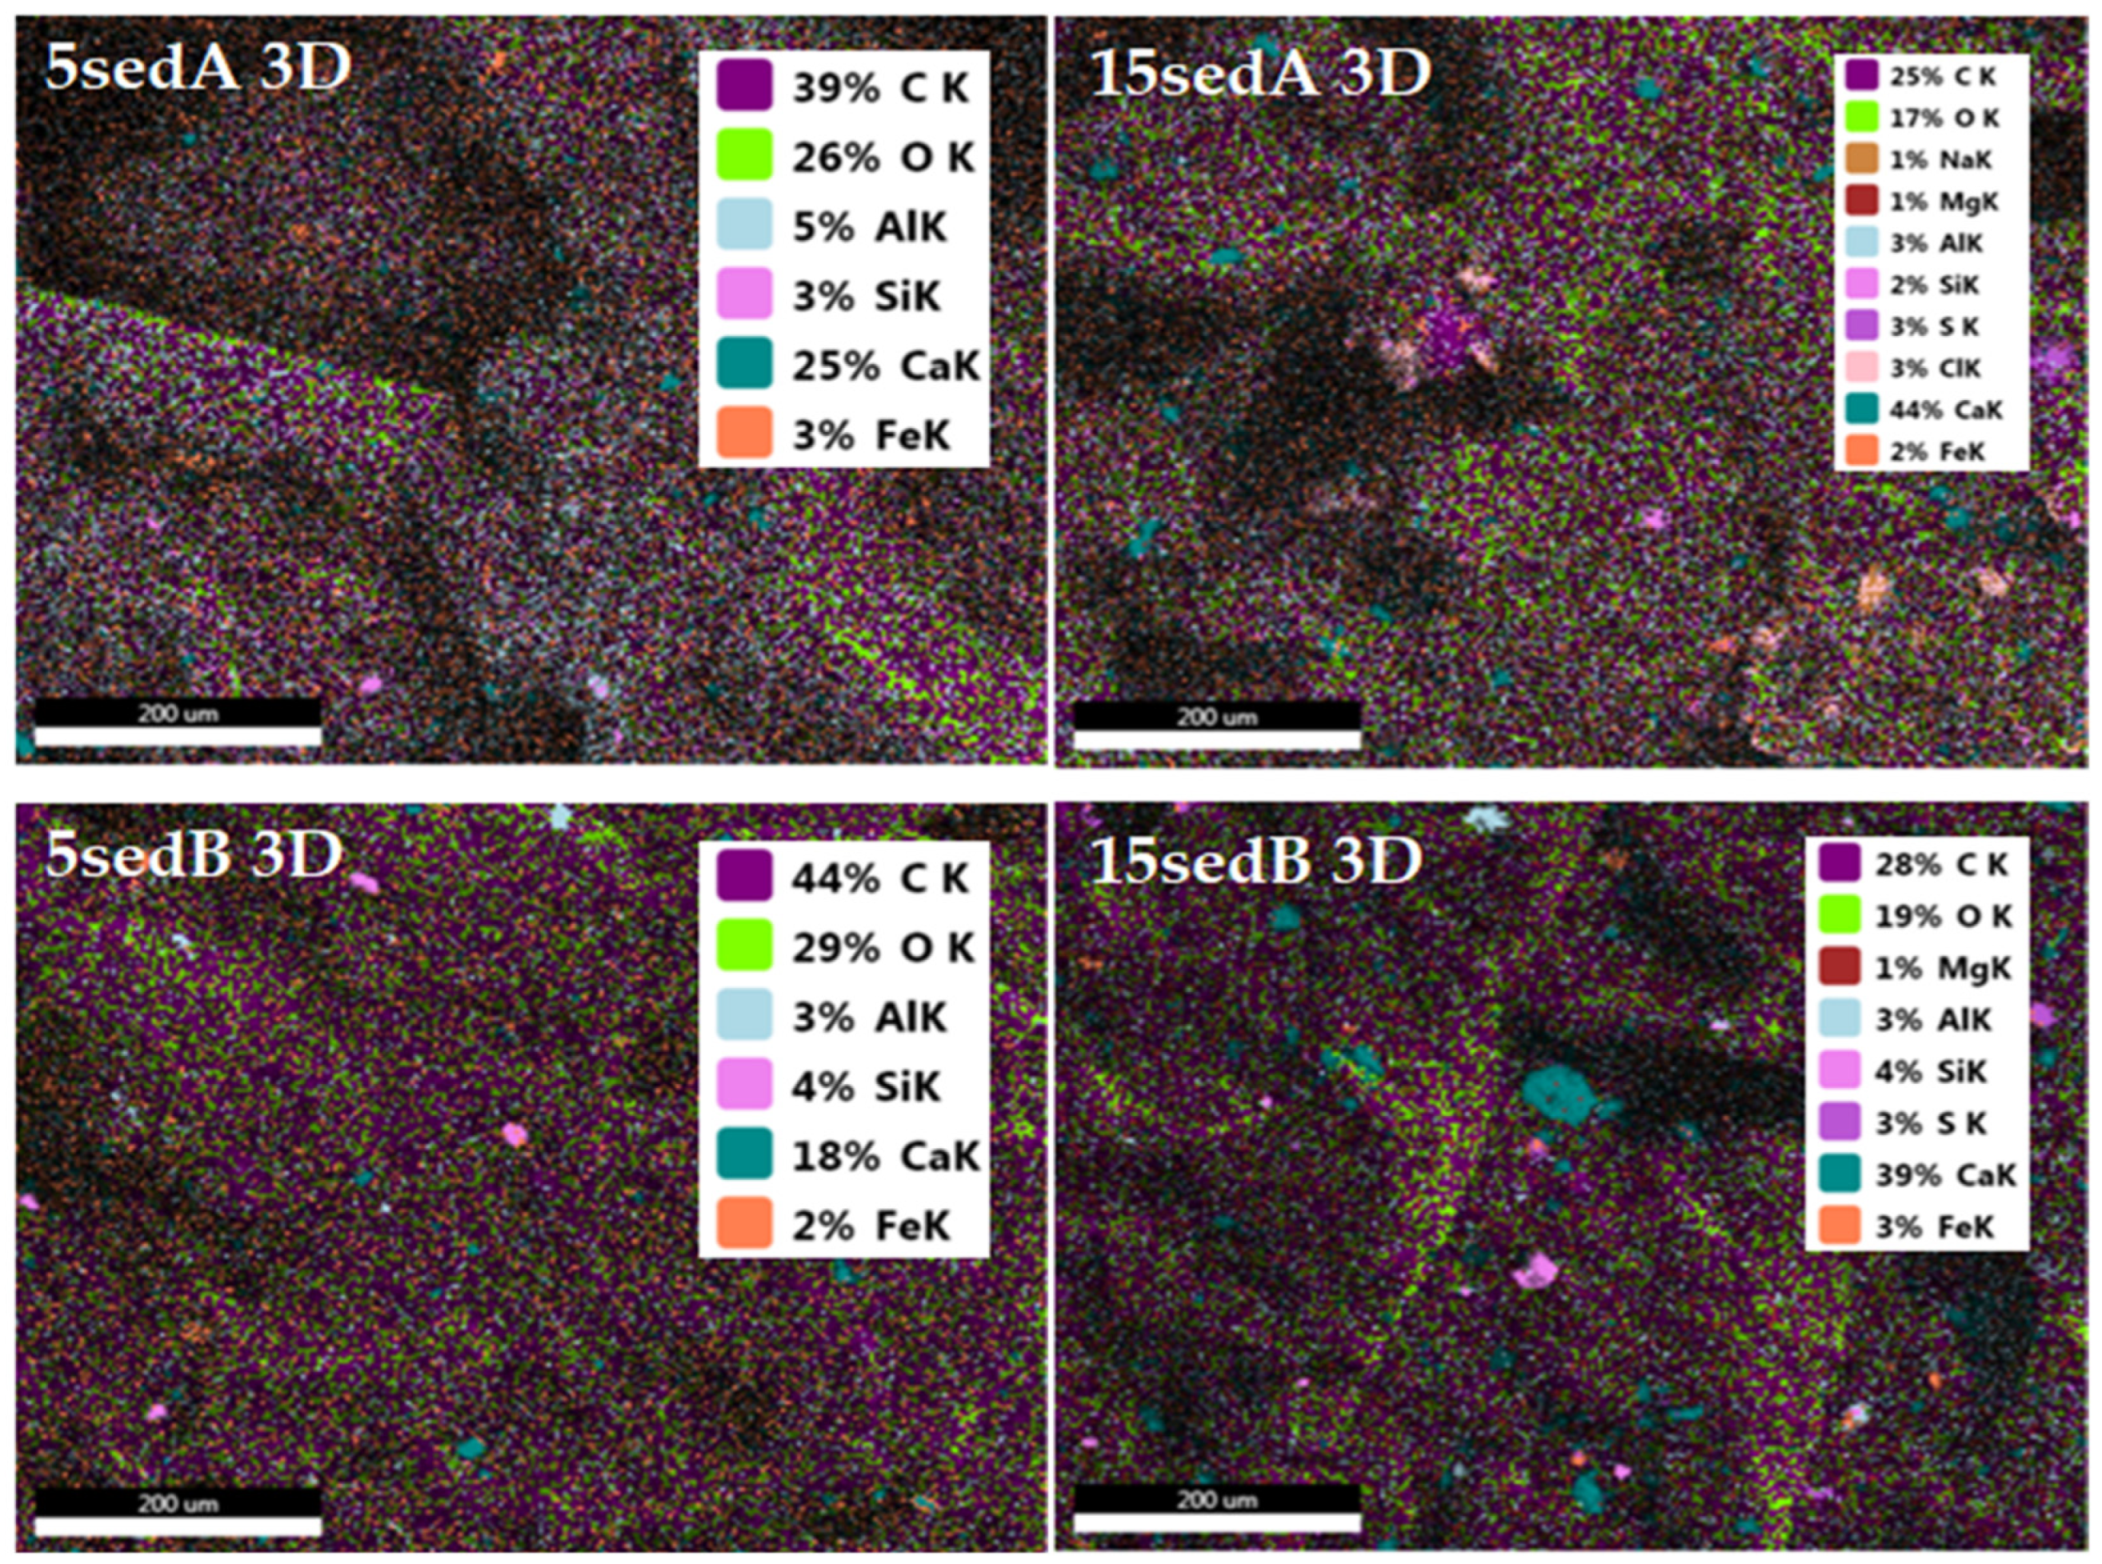
EDS mapping of elements for fractures of the printed 3D composite samples allowed the determination of the distribution of filler particles in the PLA matrix (
Figure 15). The dispersion of sediments particles in the matrix was not homogenic. Similar results were obtained in our previous work with injection moulding samples [
24]. The highest structure heterogenicity (based on the distribution of calcium) was in the 15sedB system.
The main components of SedA and SedB were CaCO
3 and SiO
2 [
24]. However, as the sampling depth increased, components such as mullite, kaolinite, muscovite, anhydrite, dolomite, or aluminosilicate, and sulfate (SedB) also appeared in the sample [
29]. Diffractograms of 3D-printed composites with SedA and SedB showed reflections originating from PLA at angles of 14, 16, and 32 (2 θ), indicating the presence of the alpha crystalline form of PLA and a broadening corresponding to the amorphous form of PLA (heat treatment in FDM produces amorphous PLA as a non-crystalline peak [
31]).
PLA is characterised by slow crystallisation kinetics often observed in conventional processing methods (extrusion, injection moulding, etc.). This phenomenon has a significant impact on the thermal and mechanical properties of the final product. In many applications, it is desirable to increase the crystallinity of PLA, since in amorphous form, the use of PLA is limited by its low glass transition temperature (T
g). At temperatures higher than T
g, only the crystalline phase of PLA can impart valuable mechanical properties. Thus, the crystalline form is necessary to increase the strength of the material [
32,
33]. Typically, the PLA homopolymer has three crystalline forms [
32,
33,
34], namely α-, β-, and γ-form, which depend on the crystallisation conditions. Among all these crystalline forms, the α-form is the most common and stable polymorph. Thanks to the presence of the α-structure, we can expect an improvement in the mechanical properties of the composites. Moreover, the remaining reflections originated from CaCO
3, and their intensities increased as the filler content increased (
Figure 16).
The presence of SiO
2, aluminosilicates, and other minerals, as well as lower organic matter content in the precipitate derived from deeper parts, positively affected the mechanical properties of the composites with these fillers [
35]. The tensile strength, or Young’s modulus, had higher values compared with the composites with SedA.
Differential scanning calorimetry analysis was carried out for the 3D-printed samples. Measurements were carried out in the temperature range of 20–220 °C and at a 10 °C/min heating rate in an inert gas flow. The characteristic temperatures of phase transition were determined from the second heating cycle. On the basis of the DSC analysis, the effect of fillers on the phase transitions in composites was determined.
Three characteristic peaks can be observed in the presented thermograms (
Figure 17), which originated from the glass transition temperature T
g (range 50–70 °C), the cold crystallisation temperature T
cc (range 100–130 °C), and the melting temperature T
m (range 140–165 °C). These phase transitions are characteristic of semicrystalline polymers, which include polylactide, which has both an amorphous and crystalline phase.
The addition of fillers did not significantly affect the T
g and T
m of the composites obtained. The biggest difference can be seen for the cold crystallisation (T
cc). The thermograms clearly show a peak T
cc for neat polylactide that was hardly noticeable, while the addition of even the lowest precipitate concentration (2.5%) caused a significant change. Narrowed signals of cold crystallisation and lower temperatures were evident for the composites (PLA neat T
cc = 127.8 °C; 10sedA T
cc = 113.1 °C). The pronounced, sharp T
cc peaks of the composites compared with a reference sample of neat PLA indicated higher crystallinity for the materials with fillers. The DSC analysis indicated that the applied deposits in the polylactide matrix exhibited the nucleating properties. Analogous results were obtained in our previous work [
24].


 ,
, 


