Article

Space Charge Characteristics and Breakdown Properties of Nanostructured SiO2/PP Composites

1
Key Laboratory of Engineering Dielectrics and Its Application, Ministry of Education, School of Electrical and Electronic Engineering, Harbin University of Science and Technology, Harbin 150080, China
2
Evonik Specialty Chemicals Co., Ltd., Shanghai 201108, China
3
Evonik Operations GmbH, 63457 Hanau-Wolfgang, Germany
4
Evonik (SEA) Pte Ltd., Singapore 138567, Singapore
5
State Key Laboratory of Electrical Insulation and Power Equipment, Xi’an Jiaotong University, Xi’an 710049, China
*
Author to whom correspondence should be addressed.
Polymers 2023, 15(13), 2826; https://doi.org/10.3390/polym15132826
Submission received: 2 June 2023 / Revised: 17 June 2023 / Accepted: 18 June 2023 / Published: 26 June 2023
(This article belongs to the Special Issue Polymer Matrix Composites for Electronic Components)

Abstract

:
Polypropylene (PP) has gained attention in the industry as an environmentally friendly material. However, its electrical properties are compromised due to space charge accumulation during operation, limiting its application in high-voltage DC cable insulation. This study investigates the effect and mechanism of SiO2 with a DDS surface hydrophobic treatment on space charge suppression and the electrical properties of PP composites. The PP matrix was doped with SiO2 nanostructures, both with a DDS surface hydrophobic treatment and untreated as a control group. The functional group structure and dispersion of nanostructured SiO2 in the matrix were characterized. The findings reveal that the incorporation of SiO2 nanostructures effectively mitigates charge accumulation in PP composites. However, a high concentration of unsurfaced nanostructures tends to agglomerate, resulting in inadequate space charge suppression and a diminished DC breakdown field strength. Nonetheless, surface treatment improves the dispersion of SiO2 within the matrix. Notably, the composite containing 1.0 wt% of surface hydrophobic SiO2 exhibits the least space charge accumulation. Compared to the base material PP, the average charge density is reduced by 83.9% after the 1800 s short-circuit discharges. Moreover, its DC breakdown field strength reaches 3.45 × 10⁸ V/m, surpassing pure PP by 19.4% and untreated SiO2/PP composites of the same proportion by 24.0%.

1. Introduction

DC long-distance transmission has always been a crucial element of the Power Internet of Things, offering distinct advantages over AC cables. These advantages include lower transmission energy losses, reduced voltage drops, and an enhanced resistance to electromagnetic interference. In particular, high voltage direct current (HVDC) transmission holds immense potential for large-scale power transmission systems such as submarine cables, DC motor-driven systems, and renewable energy systems. Within the realm of HVDC transmission modes, the utilization of direct current cables has gained traction owing to their favorable electrical and thermal properties [1,2,3,4,5]. The current insulation material widely used for cables is cross-linked polyethylene (XLPE). Although XLPE possesses low electrical properties such as dielectric loss, chemical resistance, and aging resistance, it faces challenges when applied to long-haul, high-voltage DC cable insulation. During the extrusion of XLPE insulation production, scorch product blockage can introduce a substantial number of impurities that significantly degrade the insulation performance of DC cables. Additionally, the manufacturing process of XLPE involves cross-linking, which consumes a significant amount of energy, incurs high costs, and poses environmental pollution challenges during cable disposal after service retirement [6,7]. Given the growing emphasis on environmental protection in recent years, there is an urgent need for a new material to replace XLPE [6,7]. Polypropylene (PP) is a promising candidate as it possesses a melting point above 150 °C and can withstand long-term operating temperatures of 90 °C [8]. PP has a higher melting point than XLPE, making it suitable for cable insulation in high-temperature operations. It offers advantages such as high mechanical strength and does not require cross-linking during production, making it cost-effective and easier to recycle. As an environmentally friendly insulation material, PP is an excellent thermoplastic material known for its exceptional heat resistance [9,10,11]. However, its poor flexibility, inadequate insulating properties, and susceptibility to aging have impeded its widespread use [12,13,14,15].
In recent years, researchers have discovered that the incorporation of inorganic nanostructures into polymer matrices can effectively enhance the insulation performance of polymers [16,17,18,19,20,21]. Studies by Jain have explored the crystallization behavior of PP/SiO2 composites prepared through solid-state and in-situ methods, indicating that in-situ synthesized nanostructured SiO2 particles act as heterogeneous nucleating agents [22]. Fuse et al. found that certain nano-clay particles introduce ionic groups into the polypropylene matrix, which aggravates the accumulation of space charge in the composites. Hence, the dispersion treatment of nanostructures also significantly influences the insulation performance [23]. L. Cheng et al. investigated the breakdown mechanism in polypropylene-based nano dielectrics and revealed that the interface effect of nanostructures improves the energy level distribution of the semicrystalline polymer, reducing the probability of electrons reaching energies that exceed the breakdown activation energy and increasing the breakdown field strength [24]. Scholars Y. Suzuoki et al. identified space charge accumulation as one of the factors leading to reduced electrical strength in polypropylene. The gradual accumulation of space charge distorts the electric field applied to polypropylene, thereby reducing its electrical strength and potentially causing insulation breakdown in severe cases [25]. The accumulation of space charge in PP accelerates insulation aging and even breakdown, posing safety hazards in cable operations [26,27,28]. Thus, space charge accumulation poses a significant challenge and detrimentally affects the long-term reliability of PP cable operation.
Previous studies have confirmed that the addition of inorganic nanostructures can enhance the comprehensive properties of polymers to a certain extent. However, there is limited research on the DC space charge characteristics of SiO2-modified polypropylene. In this paper, SiO2/PP nanocomposites were studied by incorporating nanostructured SiO2 particles with different contents (0.5 wt%, 1.0 wt%, and 3.0 wt%) and subjecting them to different surface treatments (one without treatment and one with a hydrophobic surface treatment). The space charge characteristics and DC breakdown performance of the SiO2/PP nanocomposites were investigated, with two types of SiO2 particles serving as controls. The influence of nanoparticle surface treatment on the properties of composite materials is discussed, offering valuable insights for the application of polypropylene nanocomposites in cable insulation.

2. Materials and Methods

2.1. Materials

PP (4874, Borealis AG, Vienna, Austria)—density 912 kg/m3; melt flow rate—2.8 g/10 min; Nordic chemical nanostructured SiO2 (AEROSIL 200 and AEROSIL R974, Evonik Industries AG, Essen, Germany), of which AEROSIL 200 is the SiO2 without surface treatment (SiO2 200) and AEROSIL R974 is hydrophobically treated with C2H6Cl2Si SiO2 (SiO2 R974).
The primary reaction process during the surface treatment of DDS is schematically shown in Figure 1. The hydrophilic hydroxyl groups in silica react with Cl in DDS to generate hydrophobic siloxane groups, completing the surface hydrophobicity treatment of SiO2.
SiO2/PP composites were prepared by the melting–blending method. The PP was dried at 60 °C for 24 h, and the SiO2 was dried at 80 °C for eight hours. The dried PP and two kinds of SiO2 were added to the torque rheometer according to the ratio in Table 1. The mixing temperature was 190 °C, the screw speed was 40 r/min, the mixing time was 20 min, and SiO2/PP nanocomposites were obtained. The prepared PP and SiO2/PP composite materials were filled into the mold and put into the plate vulcanizing machine. The temperature of the flat vulcanizer was set to 190 °C. The temperature of the flat vulcanizer was kept at 0 MPa for five minutes to make the sample melt completely. Then, the pressure was increased to 15 MPa (every 5 MPa was one stage), and each stage was kept for 5 min to obtain the required film sample.

2.2. FTIR Characterization

Fourier Transform infrared spectrometer (FTIR, Bruker AG, Germany) was used to measure SiO2 200 and SiO2 R974 in the range of a 4000–400 cm−1 wave number. The FTIR spectra were used to study the effects of SiO2 hydrophobic treatment.

2.3. SEM Characterization

To assess the dispersion of nanostructures within the PP matrix, the composite’s morphology was examined using an SU8020 scanning electron microscope (SEM), manufactured by Hitachi in Japan. Before observation, all samples underwent freezing in liquid nitrogen to induce brittle fracture, followed by gold spraying on the fractured surface. The selected scale for observation was 1 μm.

2.4. Space Charge Test

The space charge distribution in the composites was assessed using pulsed electroacoustics (PEA). The SiO2/PP composite samples were subjected to a field strength of 4 × 10⁷ V/m for 30 min to induce the space charge distribution, which was then measured. Following this, the samples were grounded for 30 min, and the decay of the space charge in the samples was measured after a short-circuit discharge. To ensure optimal contact between the SiO2/PP composite sample and the electrode, silicone oil was applied. The experimental setup of PEA, as depicted in Figure 2, involved several components. The pulsed power supply provided a pulse voltage of 1 kV, a pulse width of 8 ns, and a repetition frequency of 2 kHz. The high voltage power supply supplied a range of a −20 × 103 V to 20 × 103 V DC high voltage. The signal coupling and sensing module offered a pulse time delay of more than 3 μs, a space charge sensitivity of 0.6 μC/m3, and a spatial resolution of 18 μm. Additionally, a preamplifier with a 400 MHz frequency response was employed.

2.5. Volume Resistivity Test

The resistivity of the specimens was measured using a three-electrode system and a pion meter under the action of a DC electric field with an electrode area of 2826 mm2, and the volume resistivity ρv at 4 × 10⁷ V/m was measured and calculated for each composite material using Equation (1).
ρ V = U I V × π D 1 + g 2 4 h
where ρv is the volume resistivity, unit Ω·m; IV is the bulk current, unit A; U is the added DC voltage with a value of 8 × 10³ V; h is the thickness of the specimen with a value of 0.2 mm; D 1 is the diameter of the protected electrode, where the diameter of the electrode used in this experiment is 50 mm; g is the distance between the protected electrode and the measuring electrode, where the gap between the left and right sides is 5 mm.

2.6. Breakdown Strength Test

The DC breakdown performance test used the KZT-5 DC voltage breakdown testing machine produced by Yingkou Special Transformer Equipment Co., Ltd., Yingkou, China. The voltage was increased at a constant speed of l kV/s until the materials broke down. Two electrode systems were used in the DC breakdown experiment. The diameters of the upper and lower electrodes were 25 mm and 50 mm. To prevent surface discharge during the test, the sample and the whole electrode system needed to be wholly immersed in transformer oil. The electric breakdown strength field is generally analyzed by Weibull statistics of 2-parameter fitting measured data [29]. The formula is as follows:
P ( E ) = 1 exp [ ( E / E b ) β ]
where P(E) is the cumulative probability of failure, E is the experimentally measured breakdown field strength, and β is the shape factor representing the dispersion of the data, when E = Eb, then P(E) = 1 − e−1 = 0.632. So, regardless of how β varies, Eb is the breakdown field strength parameter with a cumulative breakdown probability of 63.2%. The 63.2% breakdown probability for solid insulation is considered in engineering to be the closest to the actual breakdown probability.

3. Results

3.1. Structural Characterization of Functional Groups

The absorption bands at 1105 cm−1 and 470 cm−1 are the asymmetric stretching vibrational band and bending vibrational band of Si–O in SiO2, respectively, while the symmetric stretching vibrational band of Si–O is at 799 cm−1, as shown in Figure 3. The strong and wide –OH band of SiO2 200 in the wave number band of 3200–3700 cm−1 is due to the easy water absorption of SiO2. This is also due to the presence of a certain amount of loosely bound and tightly bound water on the surface of SiO2 200 without surface hydrophobic treatment, while the intensity and width of the band of SiO2 R974 treated with a DDS surface hydrophobic treatment is significantly lower than that of SiO2 200, indicating a significant reduction in the hydroxyl content of the hydrophilic groups on the surface and a significant reduction in surface-bound water.

3.2. SEM Morphology

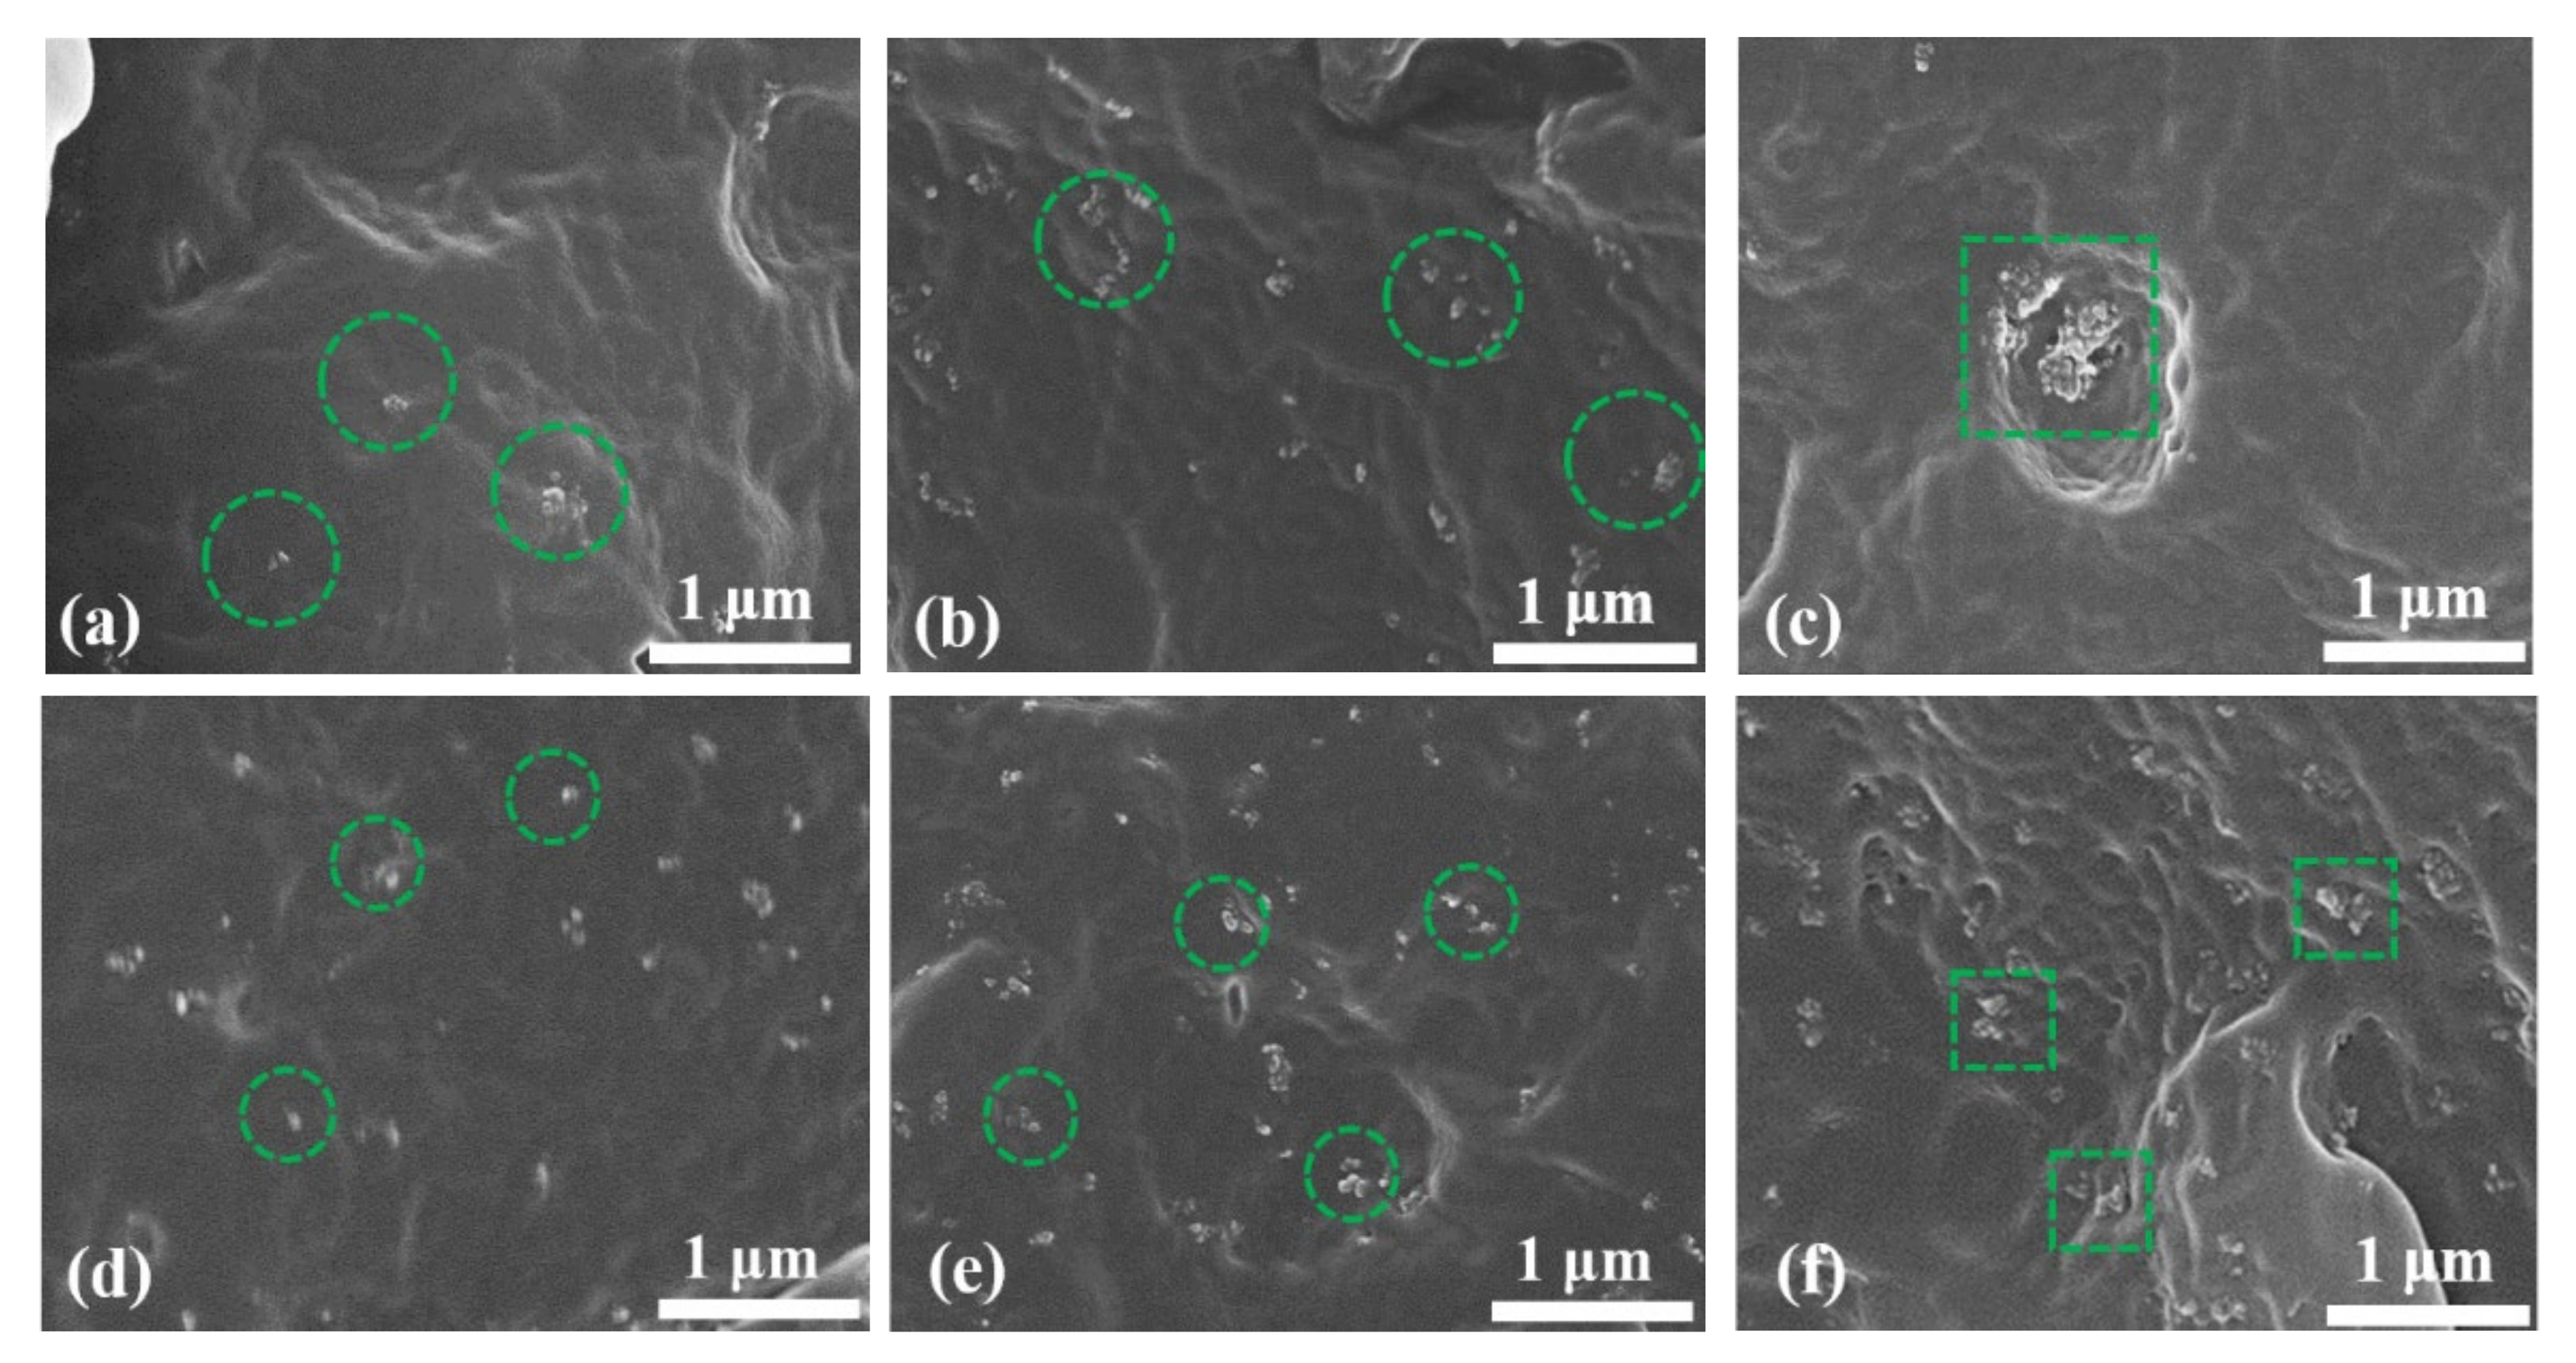
Figure 4 displays the SEM images of the PP and SiO2/PP composites. When the samples undergo brittle fracture treatment, they experience stress, resulting in the appearance of wavy, striped areas in the images. In addition, the nanostructures are marked in the figure, where the positions with large agglomeration are circled by square boxes, and the relatively uniform positions are circled by column boxes. From the SEM images, it can be observed that in composites 0.5 US, 1.0 US, 0.5 TS, and 1.0 TS, the nanostructures are evenly dispersed within the PP matrix, and the agglomeration phenomenon is relatively minor. This is primarily due to the lower nano content in these composites.
However, in composites 3.0 US and 3.0 TS, severe agglomeration is evident. In composite 3.0 US, the agglomeration size reaches approximately 400 nm, which can be attributed to the high content of the untreated nanostructured SiO2. The presence of numerous hydrophilic hydroxyl groups in the material promotes aggregation. In composite 3.0 TS, the agglomeration size is around 150 nm. This is because the nanostructured SiO2 added to composite 3.0 TS undergoes surface treatment, where the hydroxyl groups on the surface of SiO2 react with silane to form a siloxane group. While most of the hydroxyl groups are removed, a small number of residual hydroxyl groups still exist, leading to agglomeration when the nano content is high. However, compared to composite 3.0 US, the agglomeration phenomenon is improved in composite 3.0 TS.

3.3. Space Charge Characteristics

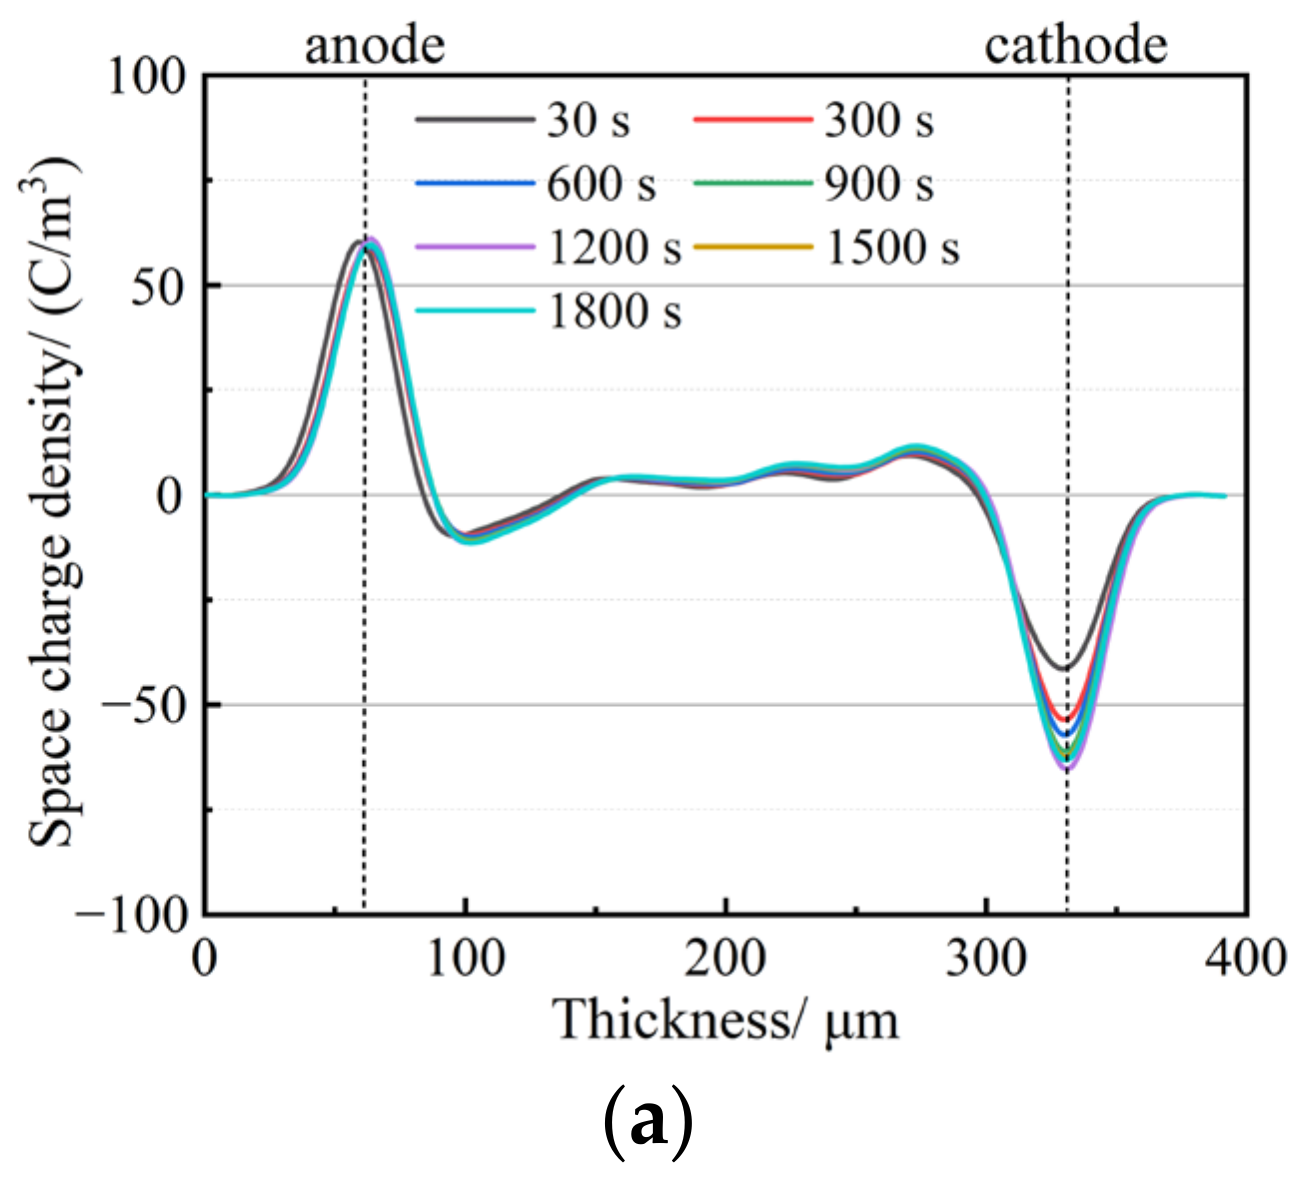
The space charge distribution curves of the PP and SiO2/PP composites were measured at room temperature under a 4 × 10⁷ V/m polarization electric field for a duration of 30 min. The results are depicted in Figure 5. From the figure, it is evident that PP accumulates a significant amount of heteropolar charges at both the cathode and anode. The peak charge near the anode measures −11.40 C·m−3, while the peak charge near the cathode measures 11.74 C·m−3. The entire sample exhibits a substantial amount of space charge, although the accumulation of space charge in SiO2/PP composites is noticeably lower than in PP. However, there are distinct differences in their distribution.
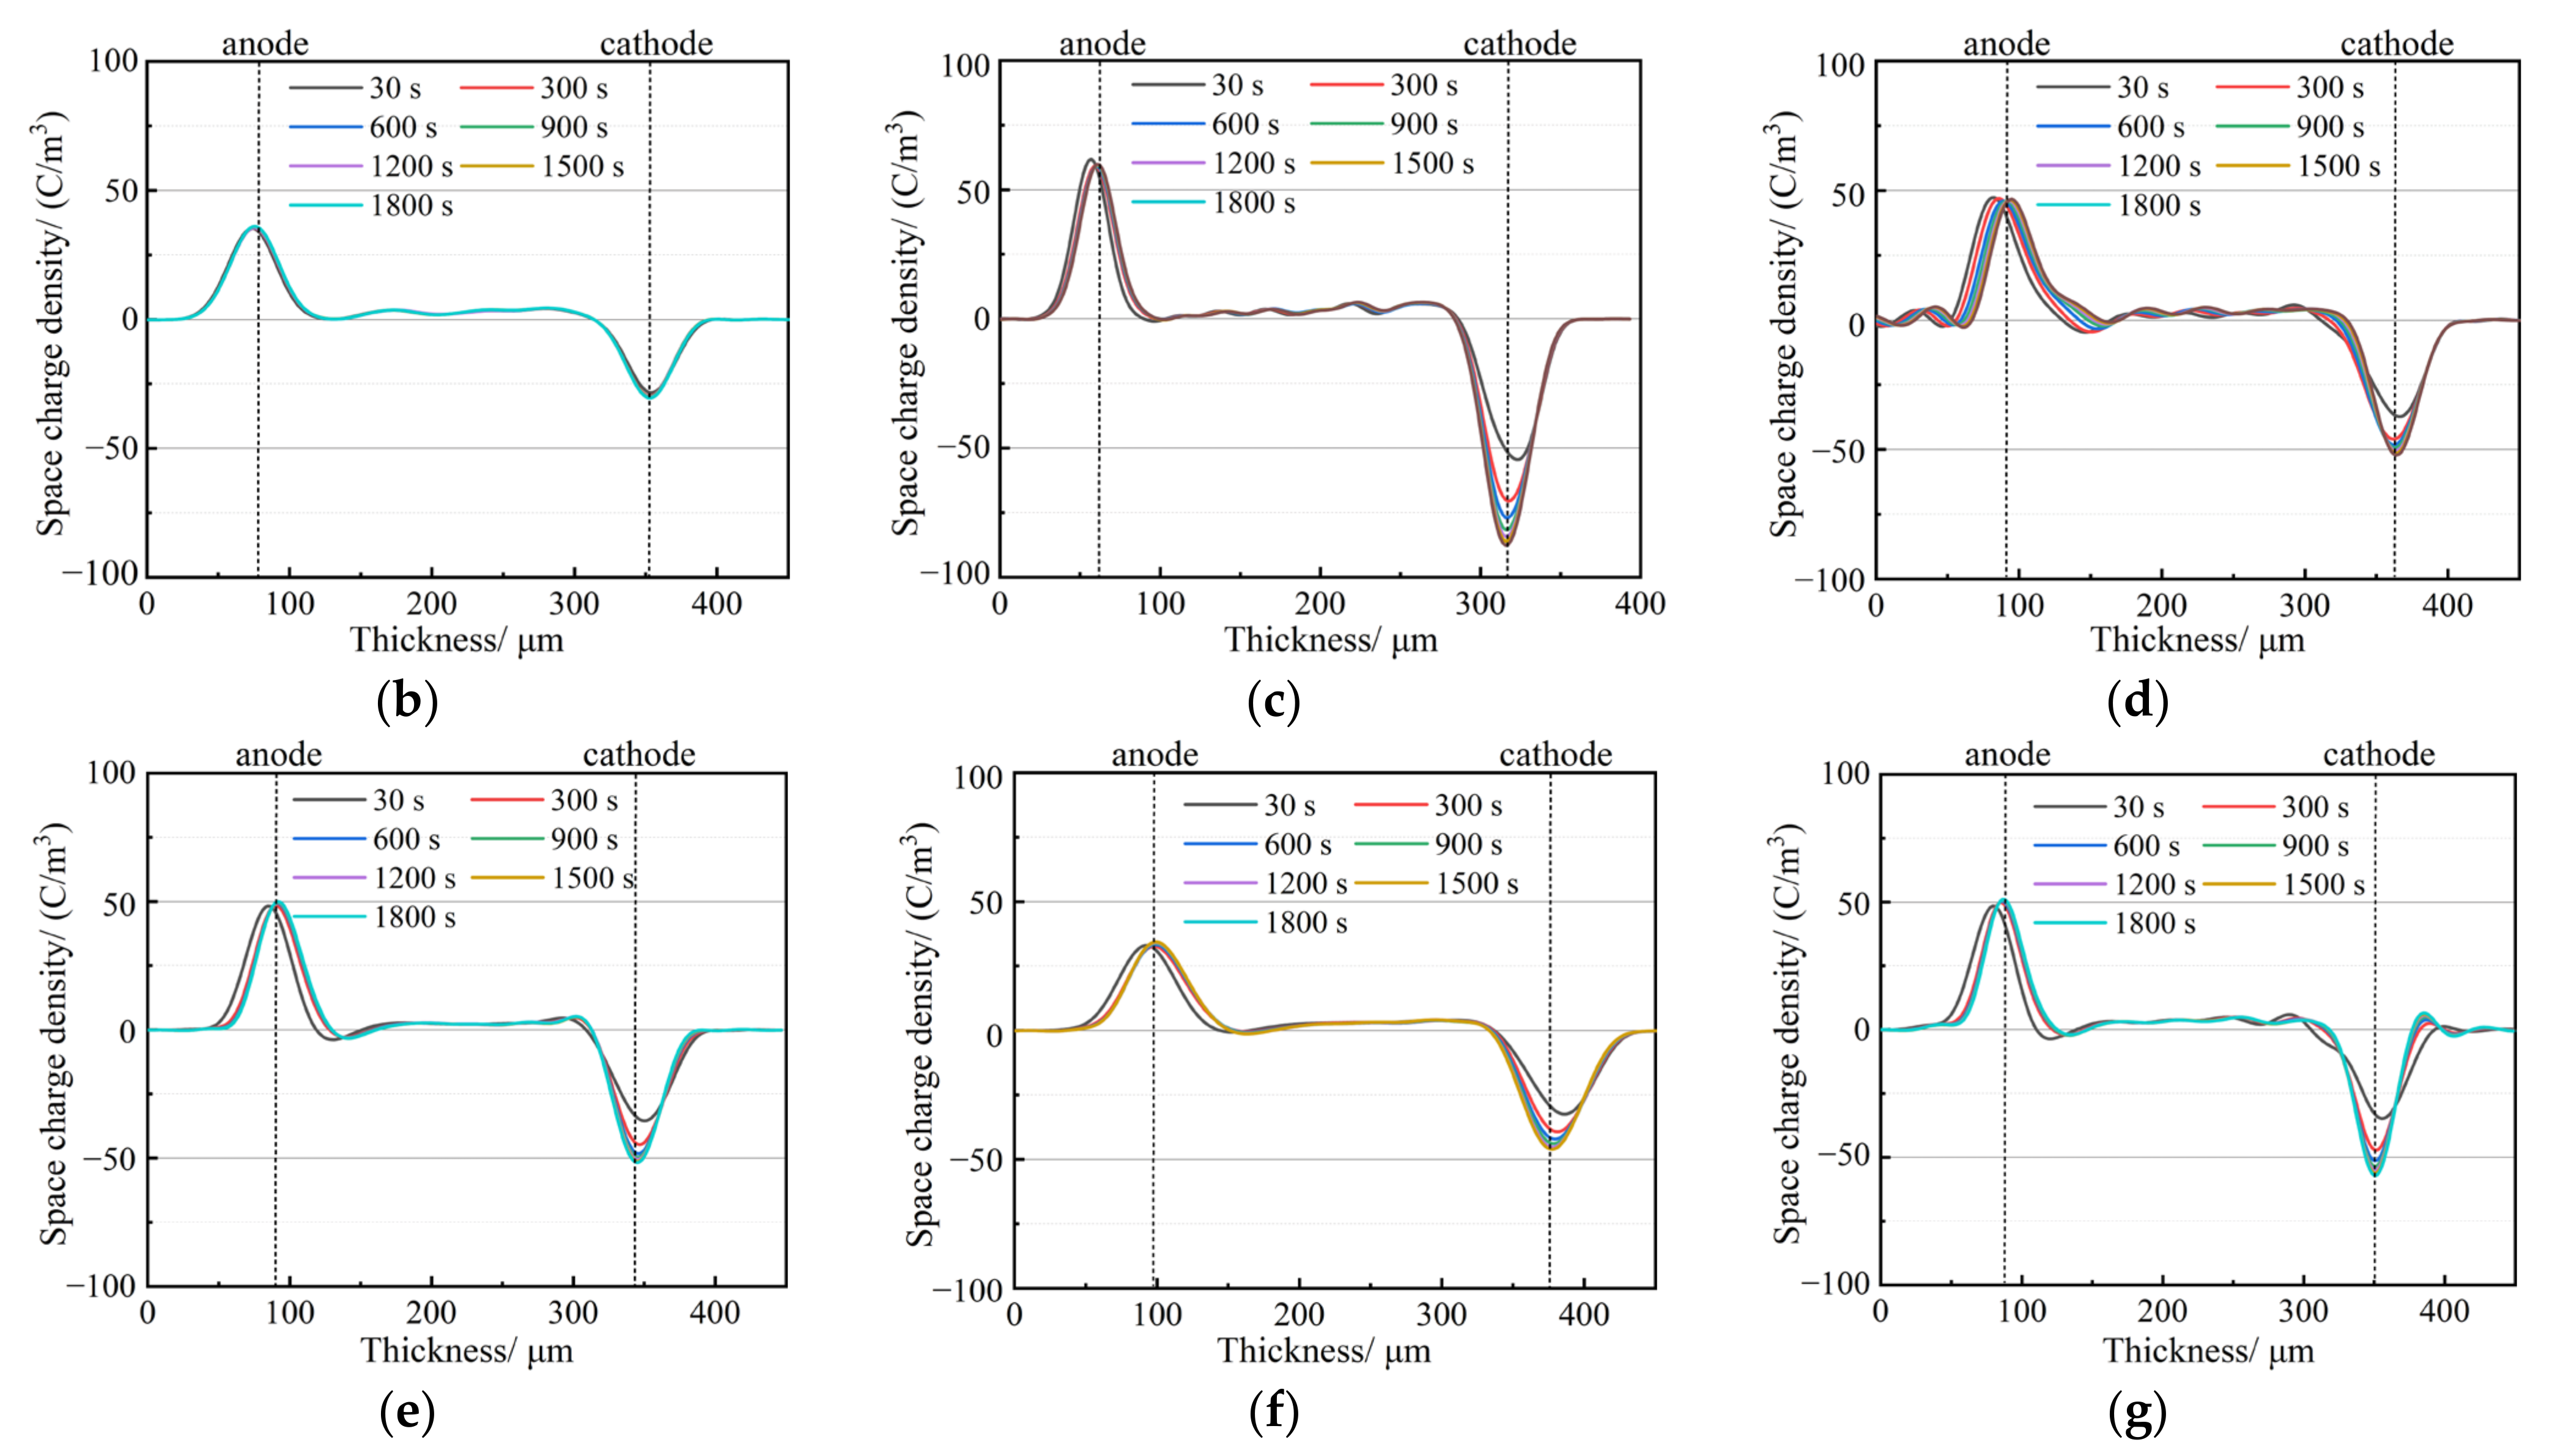
In the case of the SiO2 200/PP system, the accumulation of space charge in PP nanocomposites mixed with 0.5 wt% SiO2 200 is effectively inhibited. With an increase in SiO2 200 content, the space charge inside the sample gradually increases. For instance, when the nm content is 1.0 wt%, the maximum charge density near the cathode after 1800 s of polarization is 6.53 C·m−3. However, at a nano content of 3.0 wt%, charge accumulation occurs at both the anode and cathode, resulting in maximum charge densities of 5.12 C·m−3 and 4.23 C·m−3, respectively. Conversely, the addition of 0.5 wt% and 1.0 wt% SiO2 R974 into the PP matrix minimizes the accumulation of space charge. Among them, 1.0 wt% SiO2 R974 exhibits the strongest inhibitory effect on space charge, with only a small amount of space charge accumulating in the samples even after 1800 s of polarization. However, when the nano content is 3.0 wt%, the inhibitory effect on space charge weakens, and the maximum charge density after 1800 s reaches 4.90 C·m−3. Compared to PP, the peak value of space charge is reduced by 58.2%.
In summary, the results depicted in the figure demonstrate that the accumulation of space charge in SiO2/PP composites is lower than that in PP. The addition of nanomaterials effectively inhibits the accumulation of space charge. In particular, surface-treated SiO2 exhibits a superior inhibitory effect on space charge and minimizes charge accumulation. Notably, the inhibitory effect is prominent at the nano contents of 0.5 wt% and 1.0 wt%.
In Figure 6, the space charge distribution at various time intervals (30 s, 300 s, 600 s, 900 s, 1200 s, 1500 s, and 1800 s) after a short-circuit discharge is depicted. From the figure, it is evident that there is a significant presence of space charges at the cathode and anode of the PP sample after a short circuit, with the largest amount of residual charge. However, the addition of nanostructured SiO2 noticeably reduces the residual charge in the sample. When the nanostructured SiO2 content is 0.5 wt% and 1.0 wt%, the charge distribution of the two types of nanostructured SiO2 is similar, with a small amount of residual charge observed. On the other hand, when the nanostructured SiO2 content is 3.0 wt%, the residual charge is the highest, and there is a certain amount of positive and negative polarity charge at the cathode and anode. As the discharge time increases, the residual charge of all nanocomposites gradually decays to zero. However, even after the 1800 s of discharge, PP still retains a certain amount of residual charge.
To further analyze the internal residual charge of the PP and SiO2/PP composites after 30 min short-circuit discharges, the average volume charge density was used to quantitatively analyze the amount of space charge accumulated in the different samples, and its calculation formula is [30]:
Q ( t ; E t ) = 1 x 2 x 1 x 1 x 2 Q ( x , t ; E t ) d x
where X2 and X1 are the positions of the cathode and anode, respectively; t is the short-circuit time after removing the polarizing electric field; and Q (x, t; Et) is the space charge density inside the sample at any time and any position.
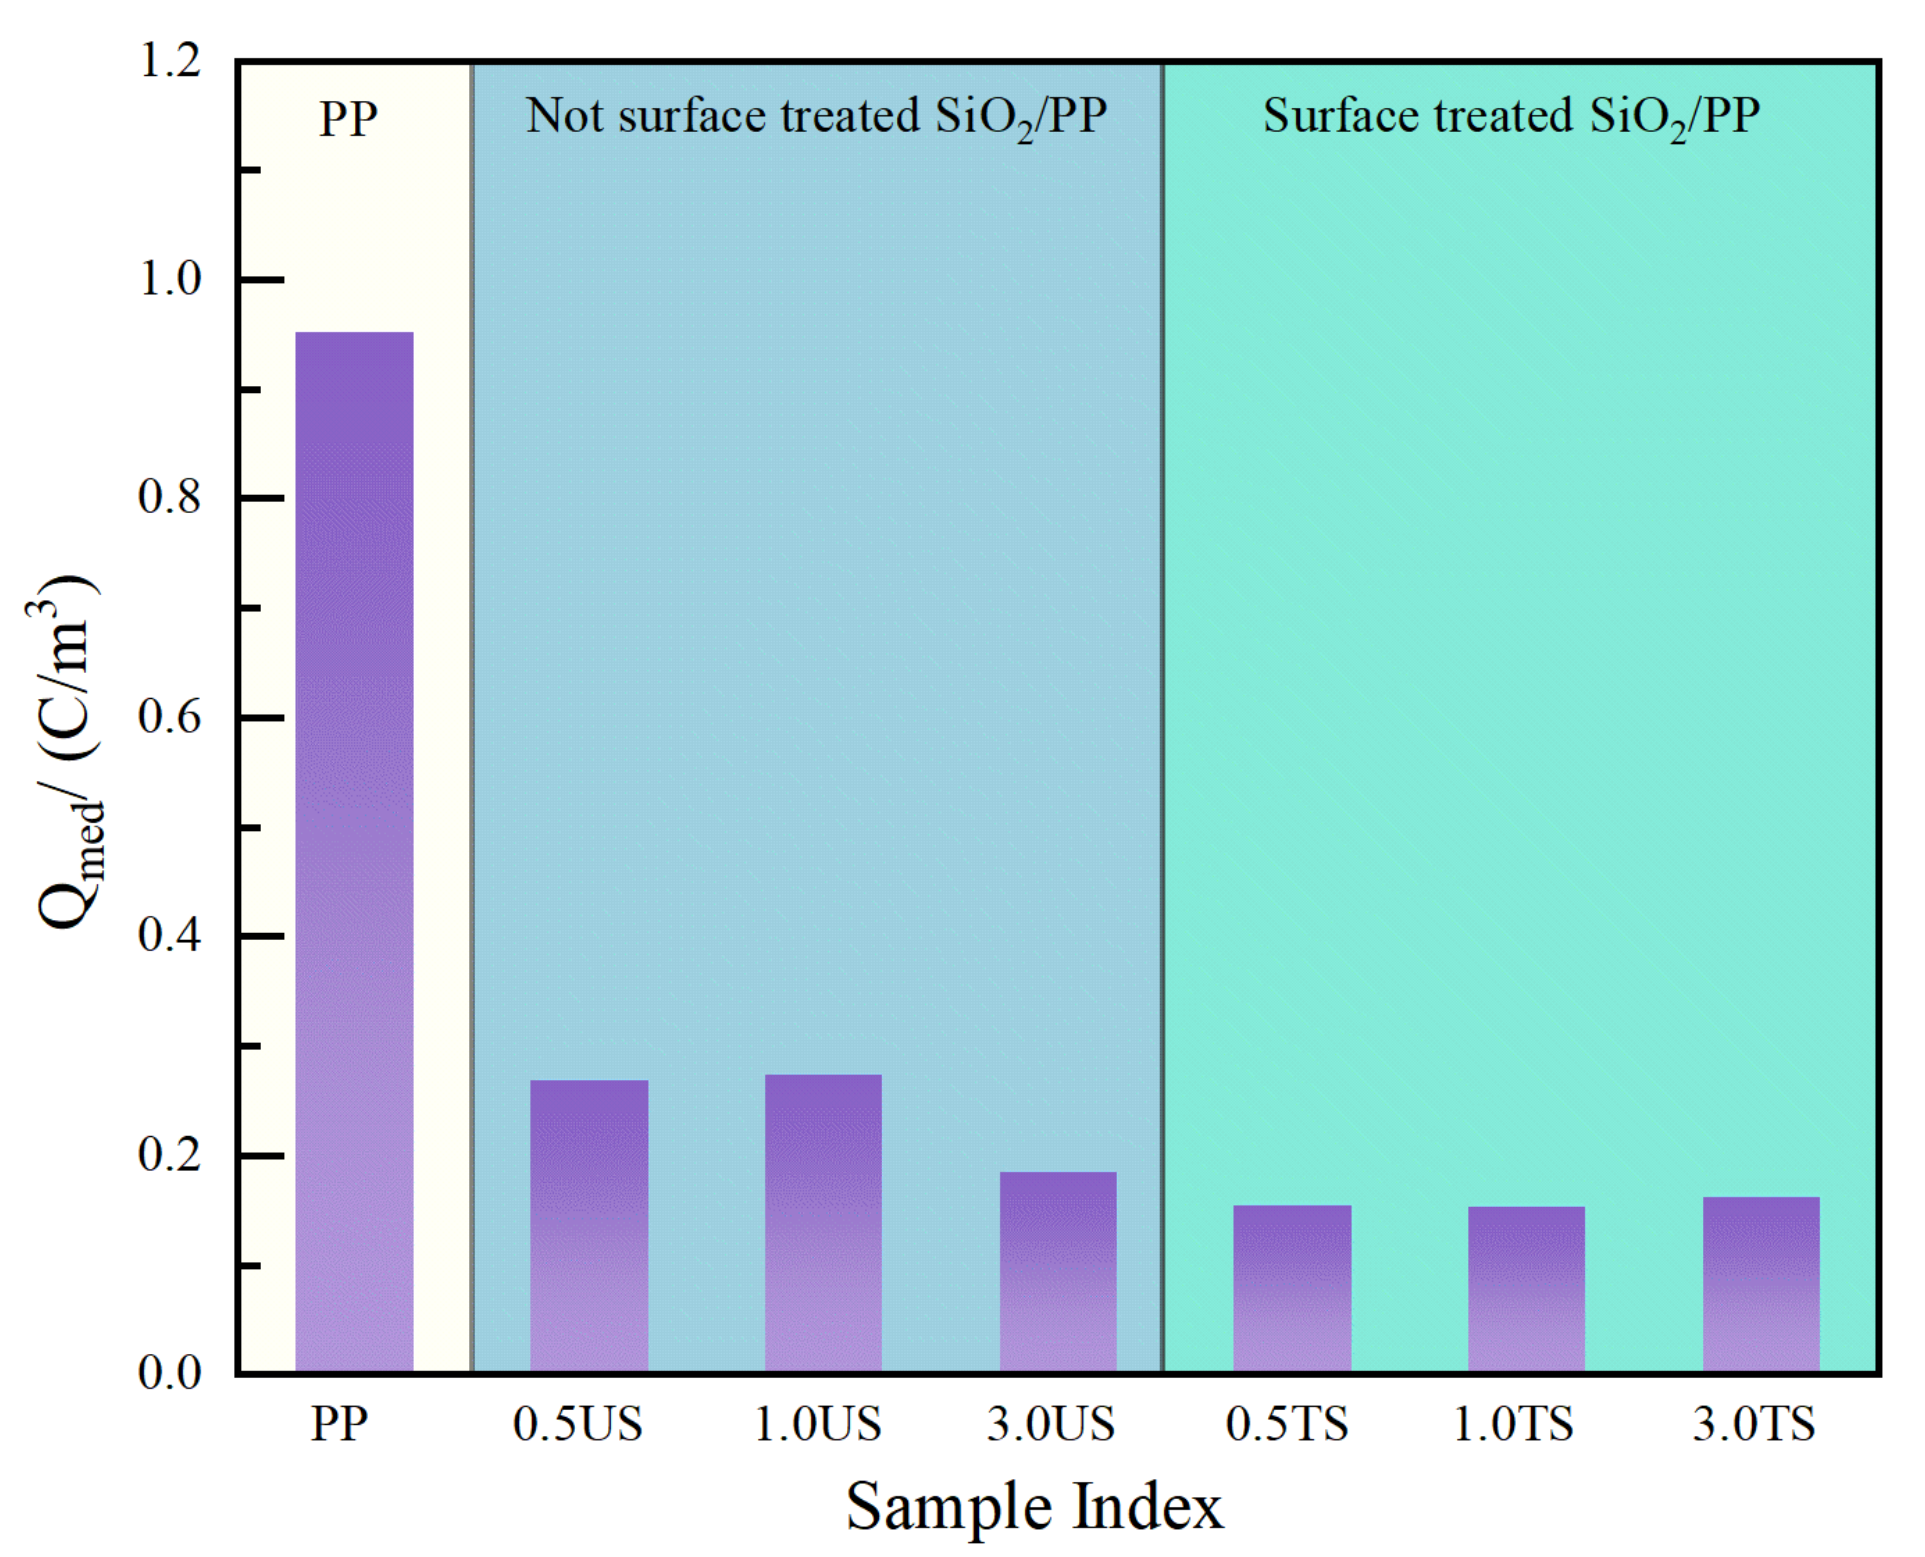
After the short-circuit discharge at 1800 s, the average volume charge density of space charge inside the PP and SiO2/PP composites is shown in Figure 7. As can be seen from the figure, the average charge density of residual charge in the PP material is the largest. The average charge density reaches 0.953 C·m−3 even after an 1800 s discharge. After nanostructured SiO2 was added, the average charge density of all materials decreased. The average charge density of the composite with SiO2 R974 was lower than that of the composite with SiO2 200 on the whole, and the average charge density was the lowest when the SiO2 R974 content was 1.0 wt%, which was only 0.153 C·m−3. Compared with PP, it decreased by 83.9%.

3.4. Volume Resistivity

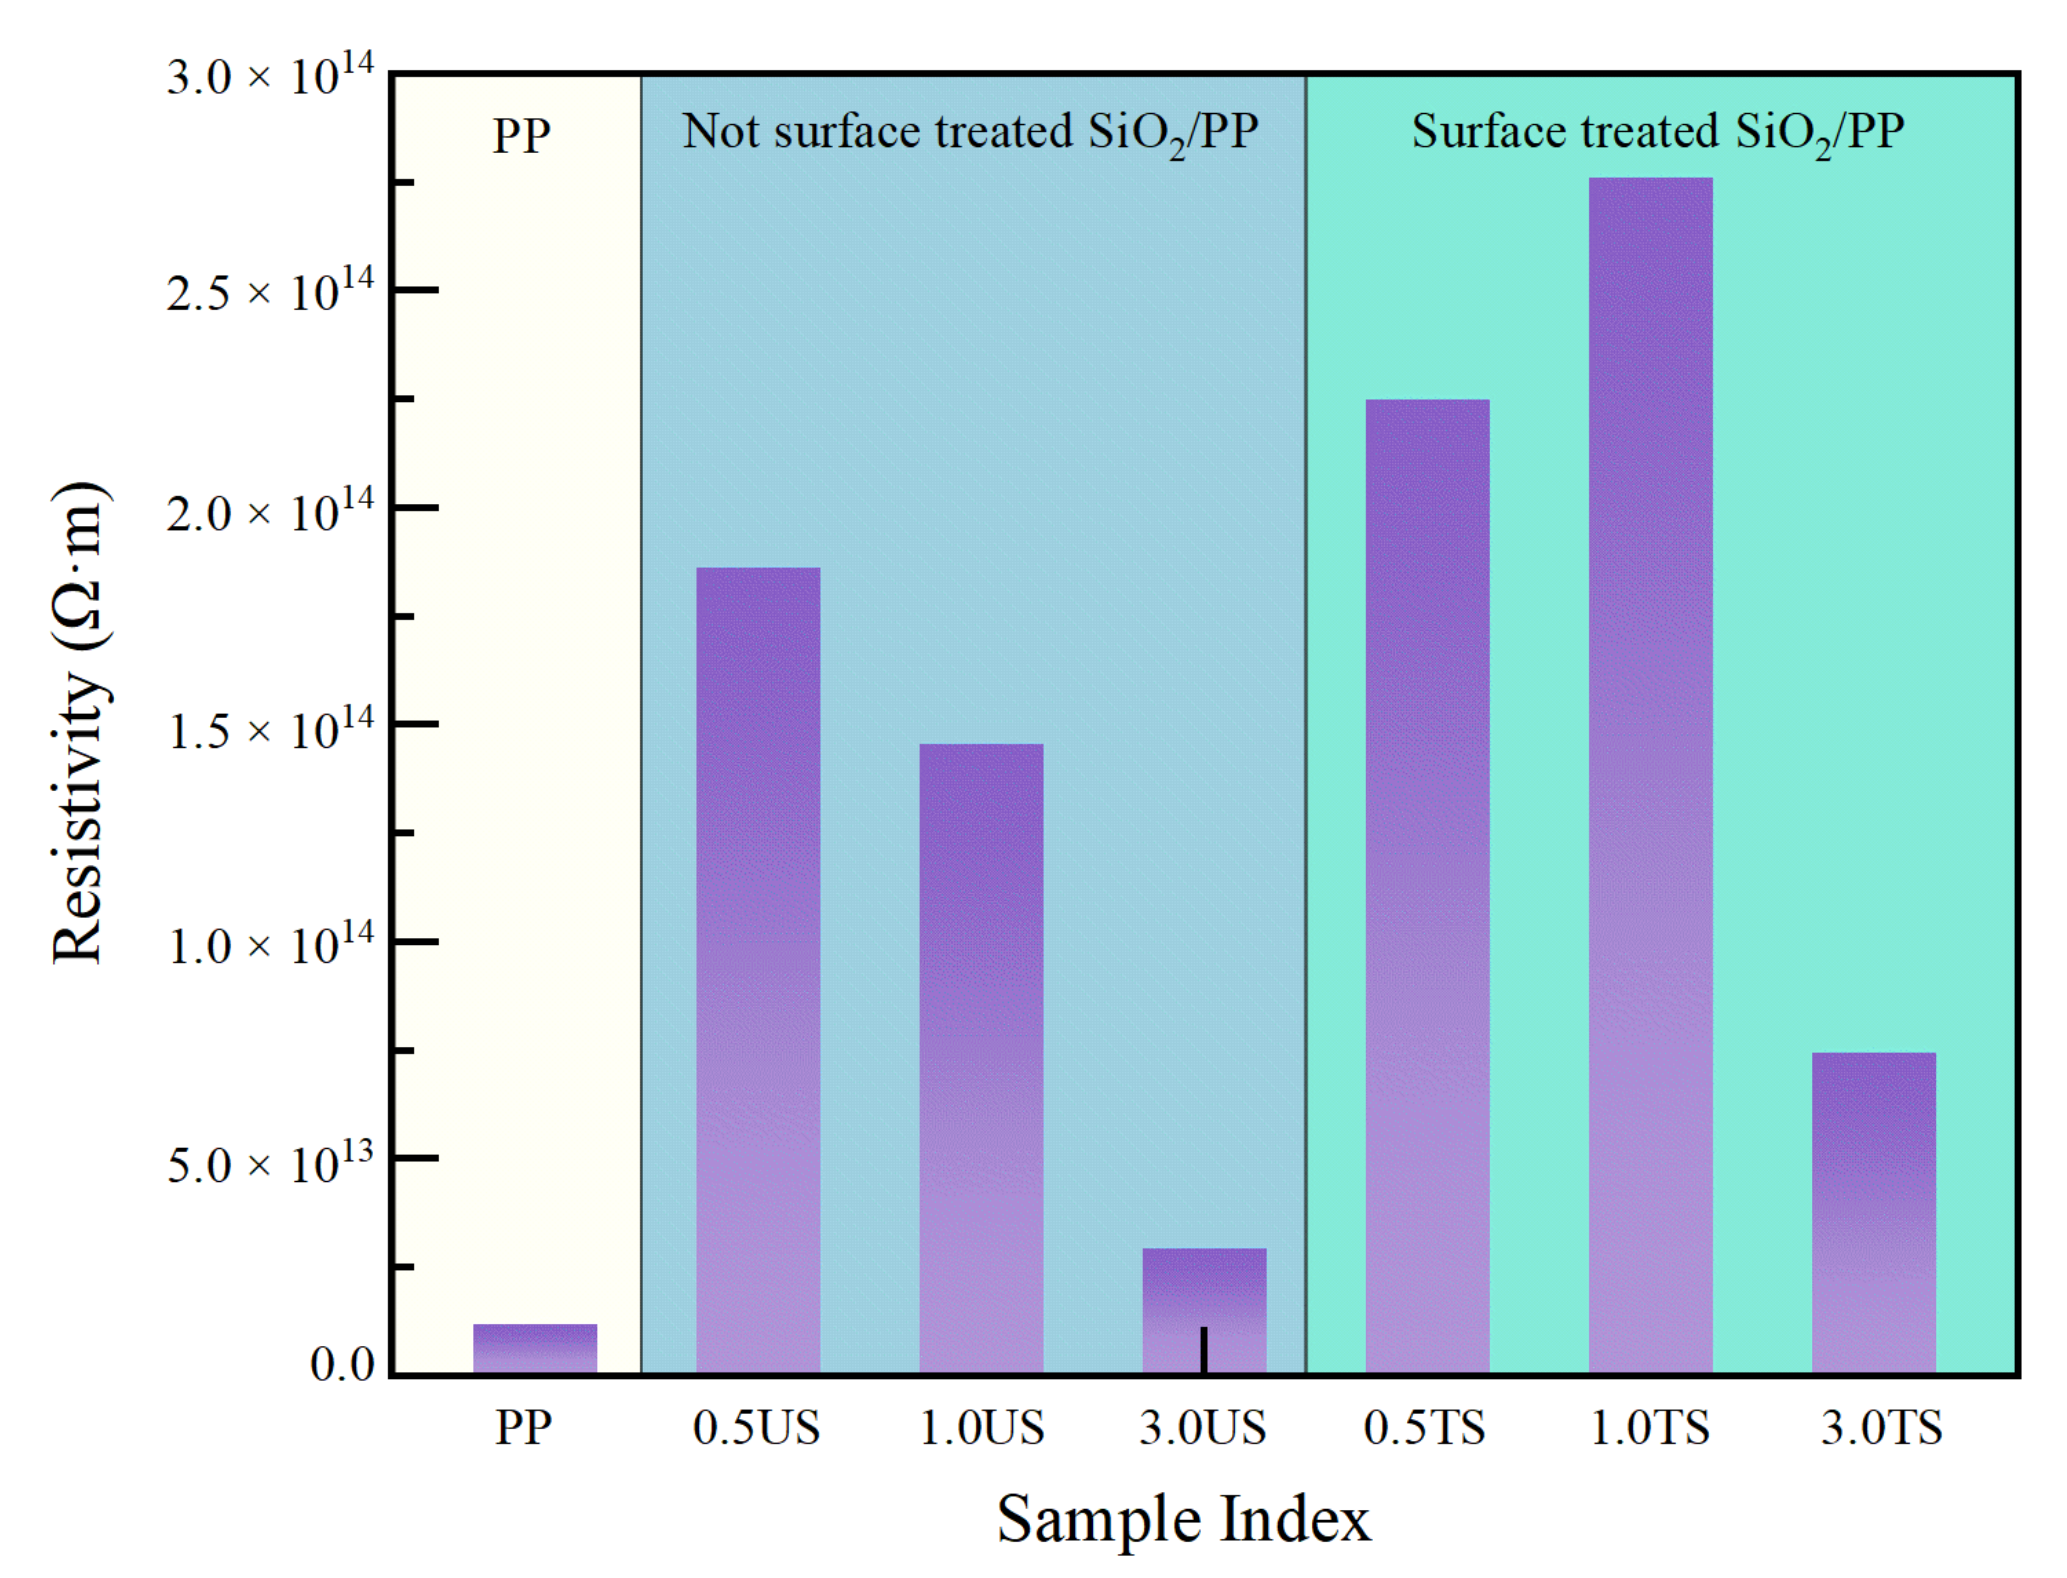
The volume resistivity of each specimen at a DC field of 4 × 10⁷ V/m reveals that nanostructured SiO2 effectively enhances the volume resistivity of PP composites. In Figure 8, among the PP composites doped with SiO2 200, specimen 0.5 US exhibits the highest volume resistivity of 1.86 × 10¹⁴ Ω·m. However, the volume resistivity of specimen 3.0 US is less effective in enhancing the volume resistivity of PP due to the decrease in the specific surface area of nanostructured SiO2 caused by agglomeration.
In contrast, the enhancement of the volume resistivity of PP by SiO2 R974 is more pronounced compared to SiO2 200. In the PP composite system with SiO2 R974, the volume resistivity of the PP composites with 0.5 wt% and 1.0 wt% performs well in the matrix. Specifically, specimen 0.5 TS exhibits a resistivity of 2.25 × 10¹⁴ Ω·m, while specimen 1.0 TS shows a resistivity of 7.41 × 10¹⁴ Ω·m. This can be attributed to the more uniform dispersion of SiO2 R974 nanostructures in the matrix after surface hydrophobic treatment. The improved interfacial interaction between SiO2 and the PP matrix enhances the compatibility between the inorganic nanofillers and the polymer matrix. The interfacial domains formed by this interaction are also more uniformly distributed, which introduces a scattering effect on the free-moving electrons and limits the rapid movement of carriers in the matrix. In Yao Zhou’s study on the effect of the space charge accumulation of titanium oxide nanostructures in PP composites, it was found that the presence of titanium oxide increased the number of shallow traps. This increase in shallow traps inhibited the accumulation of space charges and, as a result, enhanced the mobility of charge carriers. Consequently, the conductivity of the composites increased, leading to a decrease in volume resistivity [31].

3.5. DC Breakdown Strength

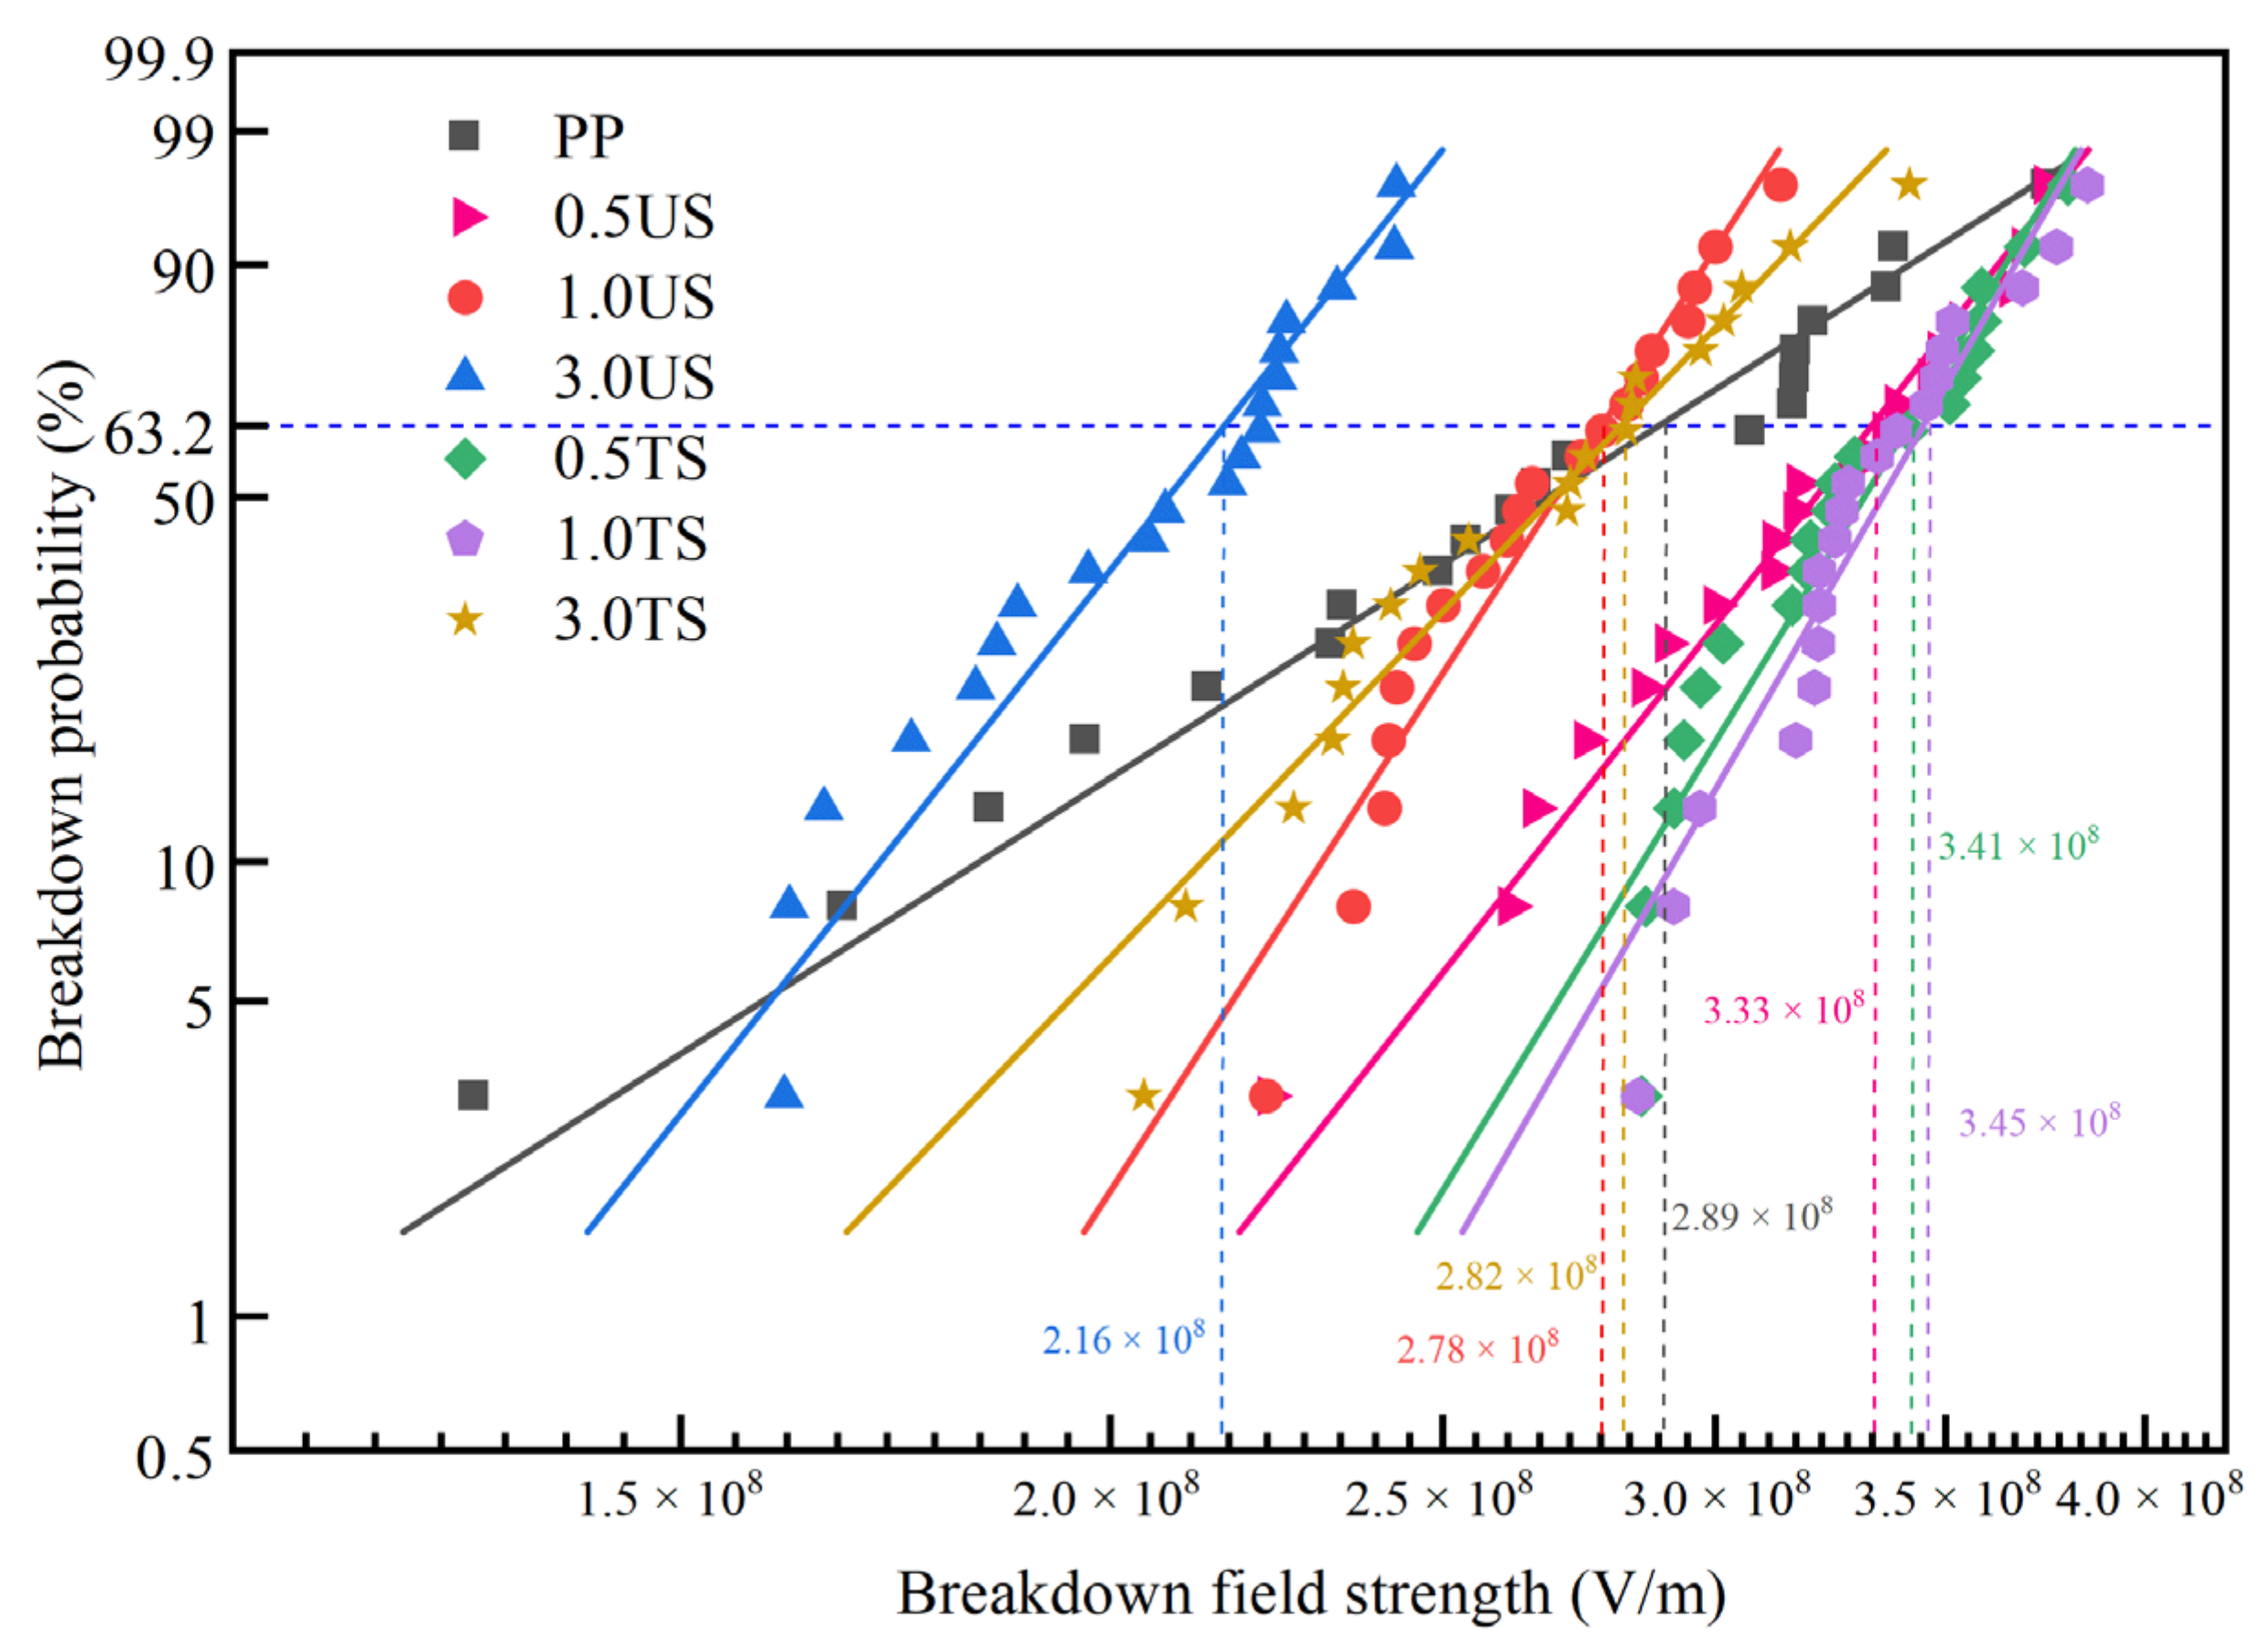
The breakdown strength test results of the PP and SiO2/PP composites were fitted using the Weibull distribution, and the findings are presented in Figure 9. The breakdown field strength results fitted by Weibull are summarized in Table 2. Based on the results of the DC breakdown experiment, it is observed that when using SiO2 200 as the nanofiller with a nano content of 0.5 wt%, the DC breakdown field strength is the highest, exhibiting a 15.30% increase compared to pure PP. However, when the SiO2 content is increased to 1.0 wt% and 3.0 wt%, the DC breakdown field strength decreases, with the greatest reduction of 25.25% observed at 3.0 wt%. Similarly, when SiO2 R974 is used as the nanofiller at 0.5 wt% and 1.0 wt%, the DC breakdown field strength increases by 18.18% and 19.40%, respectively. In experiments conducted by Zhe Li to investigate the space charge and electrical strength of MgO nanostructures/PP composites, it was found that while MgO nanostructures can effectively inhibit charge injection into PP composites, the DC breakdown field strength of PP composites decreases as the particle concentration increases [32]. The comparison shows that SiO2 has a positive effect on the DC breakdown field strength of PP composites.
However, at a nano content of 3.0 wt%, the DC breakdown field strength of both nanocomposites decreases. Nevertheless, the DC breakdown field strength of the SiO2 R974/PP composite still exhibits a 30.58% increase compared to the SiO2 200/PP composite. This can be attributed to the agglomeration of nanostructures in the matrix as the nano content increases. SiO2 200, without surface treatment, exhibits poor compatibility with the PP matrix, leading to a more severe agglomeration in the matrix. This agglomeration acts as large particle impurities, increasing the heterogeneity of the material and significantly reducing the breakdown field strength. On the other hand, the addition of SiO2 R974 helps improve the agglomeration phenomenon. As a result, even at high nano content, the DC breakdown field strength only experiences a slight decrease. In contrast, Timothy Krentz investigated the impact of anthracene surface-modified SiO2 on the breakdown characteristics of PP composites. The findings revealed that at a low level, the use of treated SiO2 enhanced the breakdown field strength of PP composites. However, at a high level, there was a reduction of 15% in the breakdown field strength [33].

4. Discussion

According to space charge theory [34], space charge in polymers can originate from three main sources: electrode injection, impurity ion dissociation, and dipole orientation. Among these, electrode injection is the primary source of space charge. Observing the space charge distribution in the PP and SiO2/PP composites, as well as the residual charge after short-circuiting discharge, it becomes apparent that PP exhibits significant space charge accumulation under high field strengths of 4 × 10⁷ V/m. This is due to the rapid migration of electrode-injected charges and impurity-dissociated charges towards the poles, resulting in a higher accumulation of heteropolar charges near the electrodes. These heteropolar charges strengthen the electric field near the electrodes, thereby intensifying space charge accumulation [35]. Notably, even after short-circuit discharge, a considerable amount of residual charge remains in the samples.
By doping SiO2 particles into the PP matrix, numerous interfacial regions are introduced, which restrict the movement of electrons and contribute to the good bulk resistivity exhibited by the SiO2/PP composite [36,37]. Additionally, the presence of SiO2 nanostructures causes the scattering of carriers, reducing their mobility and mitigating charge accumulation. During the pressurization process, the SiO2 particles near the electrode trap polar charges, forming a shielding layer that weakens the electric field in the vicinity of the electrode and reduces charge injection to some extent. Consequently, the space charge within the nanocomposite is reduced.
The lower space charge accumulation and average charge density after discharge in the composites incorporating SiO2 R974 compared to those incorporating SiO2 200 can be primarily attributed to the surface treatment of SiO2 with DDS. This treatment renders the siloxane chains and methyl groups formed by the reaction hydrophobic in nature. Consequently, the nanostructures are brought closer to the non-polar PP structure, facilitating better binding of the inorganic particles to the polymer matrix. As a result of the improved binding, the dispersion of nanomaterials within the matrix is enhanced, leading to tighter interfaces with the PP molecular chains. This, in turn, reduces defects in the PP structure, such as micron-sized cavities, and mitigates the damage caused to the PP molecular chains by high-energy electrons. The good dispersion of nanostructures provides more charge-trapping sites within the composite, and this is confirmed by the increased volume resistivity [19]. Ultimately, these factors contribute to an improvement in the DC breakdown field strength of the composite [38]. The schematic diagram of the SiO2 limiting carrier migration mechanism is shown in Figure 10.

5. Conclusions

Based on the findings from the SEM images, the PEA analysis, the volume resistivity test, and the DC breakdown tests, the following conclusions can be drawn from this paper:
  • SEM images reveal that when the nanoparticle content reaches 3.0 wt%, agglomeration occurs in the matrix, which introduces impurities and reduces the breakdown field strength. However, with the addition of SiO2 R974, the surface hydrophobic treatment greatly reduced the hydroxyl content and improved the agglomeration phenomenon, resulting in a 30.58% increase in breakdown field strength and an enhanced space charge suppression compared to SiO2 200 at the same ratio.
  • The addition of a small amount of nanostructured SiO2 effectively inhibits space charge accumulation, weakens electrode charge injection, significantly reduces residual charge after short-circuiting discharge, and enhances charge capture capability. The hydrophobic siloxane group formed after surface treatment improves the compatibility between SiO2 and non-polar PP and reduces structural defects in the amorphous zone. Consequently, SiO2 R974 exhibits lower charge accumulation and residual charge after discharge compared to SiO2 200. The composite with 1.0 wt% SiO2 R974 shows the least space charge accumulation and residual charge after discharge, with an average charge density of only 0.153 C·m−3 after 1800 s of a short-circuit discharge, which is 83.9% lower than that of PP.
  • The addition of a small amount of nanostructured SiO2 into the PP matrix increases the DC breakdown field strength. When 0.5 wt% SiO2 200 is added, the breakdown field strength increases by 15.3% compared to pure PP. Similarly, the addition of SiO2 R974 at 0.5 wt% and 1.0 wt% leads to an increase of 18.2% and 19.4% in the breakdown field strength, respectively, compared to PP. The surface treatment reduces the hydrophilicity of nanomaterials, improves their bonding with the polymer matrix, forms a higher polarity interface, and enhances dispersion. Therefore, SiO2 R974 exhibits a more significant effect in improving the breakdown field strength of PP.
By doping the PP material with an appropriate amount of SiO2 in the form of a DDS surface treatment, the accumulation of space charge in the composite can be effectively suppressed, and the breakdown field strength can be improved. This provides an excellent solution for the preparation of green cables.

Author Contributions

Conceptualization, J.-G.G. and W.-W.W.; Software, R.W.; Formal analysis, T.-t.L. and U.S.; Investigation, H.K. and G.-W.Z.; Resources, U.S.; Writing—original draft, G.-W.Z.; Writing—review and editing, J.-G.G. and T.-t.L. All authors have read and agreed to the published version of the manuscript.

Funding

This research work was funded by the National Natural Science Foundation of China (grant number 51577045) and the Postdoctoral Research Startup Fund Project of Heilongjiang Province of China (grant number LBH-Q19106).

Institutional Review Board Statement

Not applicable.

Data Availability Statement

The data presented in this study are available on request from the corresponding author.

Conflicts of Interest

The authors declare no conflict of interest.

References

  1. Gao, J.G.; Liu, L.W.; Sun, W.F. Dielectric Characteristics of Crosslinked Polyethylene Modified by Grafting Polar-Group Molecules. Polymers 2023, 15, 231. [Google Scholar] [CrossRef] [PubMed]
  2. Zha, J.W.; Wang, Y.; Li, W.K. Electrical properties of polypropylene/styrene-ethylene-butylene-styrene block copolymer/MgO nanocomposites. IEEE Trans. Dielectr. Electr. Insul. 2017, 24, 1457–1464. [Google Scholar] [CrossRef]
  3. Wang, X.; Hao, J.Q.; Xiong, J.Z. Comparison and analysis of three pulse injection methods in the pulsed electroacoustic technique used for long cables. IEEE Electr. Insul. Mag. 2018, 34, 17–31. [Google Scholar] [CrossRef]
  4. Rehman, B.; Rehman, A.; Khan, W.A. Operation and Challenges of Multi-Infeed LCC–HVDC System: Commutation Failure, AC/DC Power Flow, and Voltage Stability. Appl. Sci. 2021, 11, 8637. [Google Scholar] [CrossRef]
  5. He, J.; Chen, G. Insulation materials for HVDC polymeric cables. IEEE Trans. Dielectr. Electr. Insul. 2017, 24, 1307. [Google Scholar] [CrossRef]
  6. Huang, X.; Zhang, J.; Jiang, P. Material progress toward recyclable insulation of power cables part 2: Polypropylene-based thermoplastic materials. IEEE Electr. Insul. Mag. 2019, 36, 8–18. [Google Scholar] [CrossRef]
  7. Adeniran, A.A.; Shakantu, W. The health and environmental impact of plastic waste disposal in South African Townships: A review. Int. J. Environ. Res. Public Health 2022, 19, 779. [Google Scholar] [CrossRef]
  8. Du, B.X.; Hou, Z.H.; Li, Z.L. Temperature dependent space charge and breakdown strength of PP/ULDPE/graphene nanocomposites for HVDC extruded cable insulation. IEEE Trans. Dielectr. Electr. Insul. 2019, 26, 876–884. [Google Scholar] [CrossRef]
  9. Zhou, Y.; Dang, B.; Wang, H. Polypropylene-based ternary nanocomposites for recyclable high-voltage direct-current cable insulation. Compos. Sci. Technol. 2018, 165, 168–174. [Google Scholar] [CrossRef]
  10. Yan, H.D.; Zhang, C.; Li, W.K. Effect of trap level density on breakdown strength and space charge distribution of polypropylene/low-density polyethylene composites. Polym. Compos. 2020, 41, 780–787. [Google Scholar] [CrossRef]
  11. Liang, Y.; Weng, L.; Zhang, W. Preparation and electrical properties of 4-allyloxy-2-hydroxybenzophenone grafted polypropylene for HVDC cables. J. Electron. Mater. 2021, 50, 6228–6236. [Google Scholar] [CrossRef]
  12. Wu, J.; Dang, B.; Hu, J. Comparison of Effects of Ethylene-Based and Propylene-Based Copolymer on Tailoring the Properties of Polypropylene. IEEE Access 2020, 8, 123507–123513. [Google Scholar] [CrossRef]
  13. Aumnate, C.; Rudolph, N.; Sarmadi, M. Recycling of polypropylene/polyethylene blends: Effect of chain structure on the crystallization behaviors. Polymers 2019, 11, 1456. [Google Scholar] [CrossRef] [PubMed] [Green Version]
  14. Hou, Z.H.; Du, B.X.; Li, Z.L. Effects of radical scavenger on space charge accumulation of PP/ULDPE composites for HVDC cable insulation. IEEE Trans. Dielectr. Electr. Insul. 2020, 27, 989–997. [Google Scholar] [CrossRef]
  15. Jiang, X.; Sima, W.; Peng, Q. Effect of thermal ageing on space charge characteristics in double-layered polyester film. IEEE Trans. Dielectr. Electr. Insul. 2016, 23, 3156–3164. [Google Scholar] [CrossRef]
  16. Tan, D.Q. The search for enhanced dielectric strength of polymer-based dielectrics: A focused review on polymer nanocomposites. J. Appl. Polym. Sci. 2020, 137, 49379. [Google Scholar] [CrossRef]
  17. Zadehnazari, A. Metal oxide/polymer nanocomposites: A review on recent advances in fabrication and applications. Polym.-Plast. Technol. Mater. 2023, 62, 655–700. [Google Scholar] [CrossRef]
  18. Zhang, L.; Khani, M.M.; Krentz, T.M. Suppression of space charge in crosslinked polyethylene filled with poly (stearyl methacrylate)-grafted SiO2 nanoparticles. Appl. Phys. Lett. 2017, 110, 132903. [Google Scholar] [CrossRef] [Green Version]
  19. Adhikari, C. Polymer nanoparticles-preparations, applications, and future insights: A concise review. Polym.-Plast. Technol. Mater. 2021, 60, 1996–2024. [Google Scholar] [CrossRef]
  20. Zhang, Q.; Zhang, Z.; Xu, N. Dielectric properties of P (VDF-TrFE-CTFE) composites filled with surface-coated TiO2 nanowires by SnO2 nanoparticles. Polymers 2020, 12, 85. [Google Scholar] [CrossRef] [Green Version]
  21. Zeng, J.; Yan, J.; Li, B.W. Improved breakdown strength and energy storage performances of PEI-based nanocomposite with core-shell structured PI@ BaTiO3 nanofillers. Ceram. Int. 2022, 48, 20526–20533. [Google Scholar] [CrossRef]
  22. Jain, S.; Goossens, H.; van Duin, M. Effect of in situ prepared silica nano-particles on non-isothermal crystallization of polypropylene. Polymer 2005, 46, 8805–8818. [Google Scholar] [CrossRef]
  23. Fuse, N.; Sato, H.; Ohki, Y. Effects of nanofiller loading on the molecular motion and carrier transport in polyamide. IEEE Trans. Dielectr. Electr. Insul. 2009, 16, 524–530. [Google Scholar] [CrossRef]
  24. Chi, X.H.; Cheng, L.; Liu, W.F. Dynamic mechanism of breakdown in polypropylene-based nano-dielectric. AIP Adv. 2019, 9, 015135. [Google Scholar] [CrossRef] [Green Version]
  25. Kon, H.; Suzuoki, Y.; Mizutani, T. Packet-like space charges and conduction current in polyethylene cable insulation. IEEE Trans. Dielectr. Electr. Insul. 1996, 3, 380–385. [Google Scholar] [CrossRef]
  26. Li, G.; Gu, Z.; Xing, Z. Space Charge and Trap Distributions and Charge Dynamic Migration Characteristics in Polypropylene under Strong Electric Field. ECS J. Solid State Sci. Technol. 2022, 11, 083003. [Google Scholar] [CrossRef]
  27. Gao, J.G.; Liu, H.S.; Lee, T.T. Effect of Hydrophilic/Hydrophobic Nanostructured TiO2 on Space Charge and Breakdown Properties of Polypropylene. Polymers 2022, 14, 2762. [Google Scholar] [CrossRef] [PubMed]
  28. Zha, J.W.; Wu, Y.H.; Wang, S.J. Improvement of space charge suppression of polypropylene for potential application in HVDC cables. IEEE Trans. Dielectr. Electr. Insul. 2016, 23, 2337–2343. [Google Scholar] [CrossRef]
  29. Andersen, A.; Dennison, J.R. Mixed Weibull distribution model of DC dielectric breakdowns with dual defect modes. In Proceedings of the 2015 IEEE Conference on Electrical Insulation and Dielectric Phenomena (CEIDP), Ann Arbor, MI, USA, 18–21 October 2015; pp. 570–573. [Google Scholar]
  30. Zhang, X.; Wang, M.; Gao, J. Crystallization morphology and space charge property of silica/low density polyethylene composites. AIP Adv. 2020, 10, 015043. [Google Scholar] [CrossRef] [Green Version]
  31. Zhou, Y.; Hu, J.; Dang, B. Titanium oxide nanoparticle increases shallow traps to suppress space charge accumulation in polypropylene dielectrics. RSC Adv. 2016, 6, 48720–48727. [Google Scholar] [CrossRef]
  32. Li, Z.; Cao, W.; Sheng, G. Experimental study on space charge and electrical strength of MgO nano-particles/polypropylene composite. IEEE Trans. Dielectr. Electr. Insul. 2016, 23, 1812–1819. [Google Scholar] [CrossRef]
  33. Krentz, T.; Khani, M.M.; Bell, M. Morphologically dependent alternating-current and direct-current breakdown strength in silica–polypropylene nanocomposites. J. Appl. Polym. Sci. 2017, 134, 44347. [Google Scholar] [CrossRef]
  34. Lau, K.Y.; Vaughan, A.S.; Chen, G. On the space charge and DC breakdown behavior of polyethylene/silica nanocomposites. IEEE Trans. Dielectr. Electr. Insul. 2014, 21, 340–351. [Google Scholar] [CrossRef]
  35. Jiang, H.; Gao, J.; Zhang, X. Composite micro-nanoarchitectonics of MMT-SiO2: Space charge characteristics under tensile state. Polymers 2021, 13, 4354. [Google Scholar] [CrossRef]
  36. Seiler, J.; Kindersberger, J. Insight into the interphase in polymer nanocomposites. IEEE Trans. Dielectr. Electr. Insul. 2014, 21, 537–547. [Google Scholar] [CrossRef]
  37. Gong, S.; Chen, Q.; Moll, J.F. Segmental dynamics of polymer melts with spherical nanoparticles. ACS Macro Lett. 2014, 3, 773–777. [Google Scholar] [CrossRef]
  38. Li, S.; Yin, G.; Chen, G. Short-term breakdown and long-term failure in nanodielectrics: A review. IEEE Trans. Dielectr. Electr. Insul. 2010, 17, 1523–1535. [Google Scholar] [CrossRef] [Green Version]
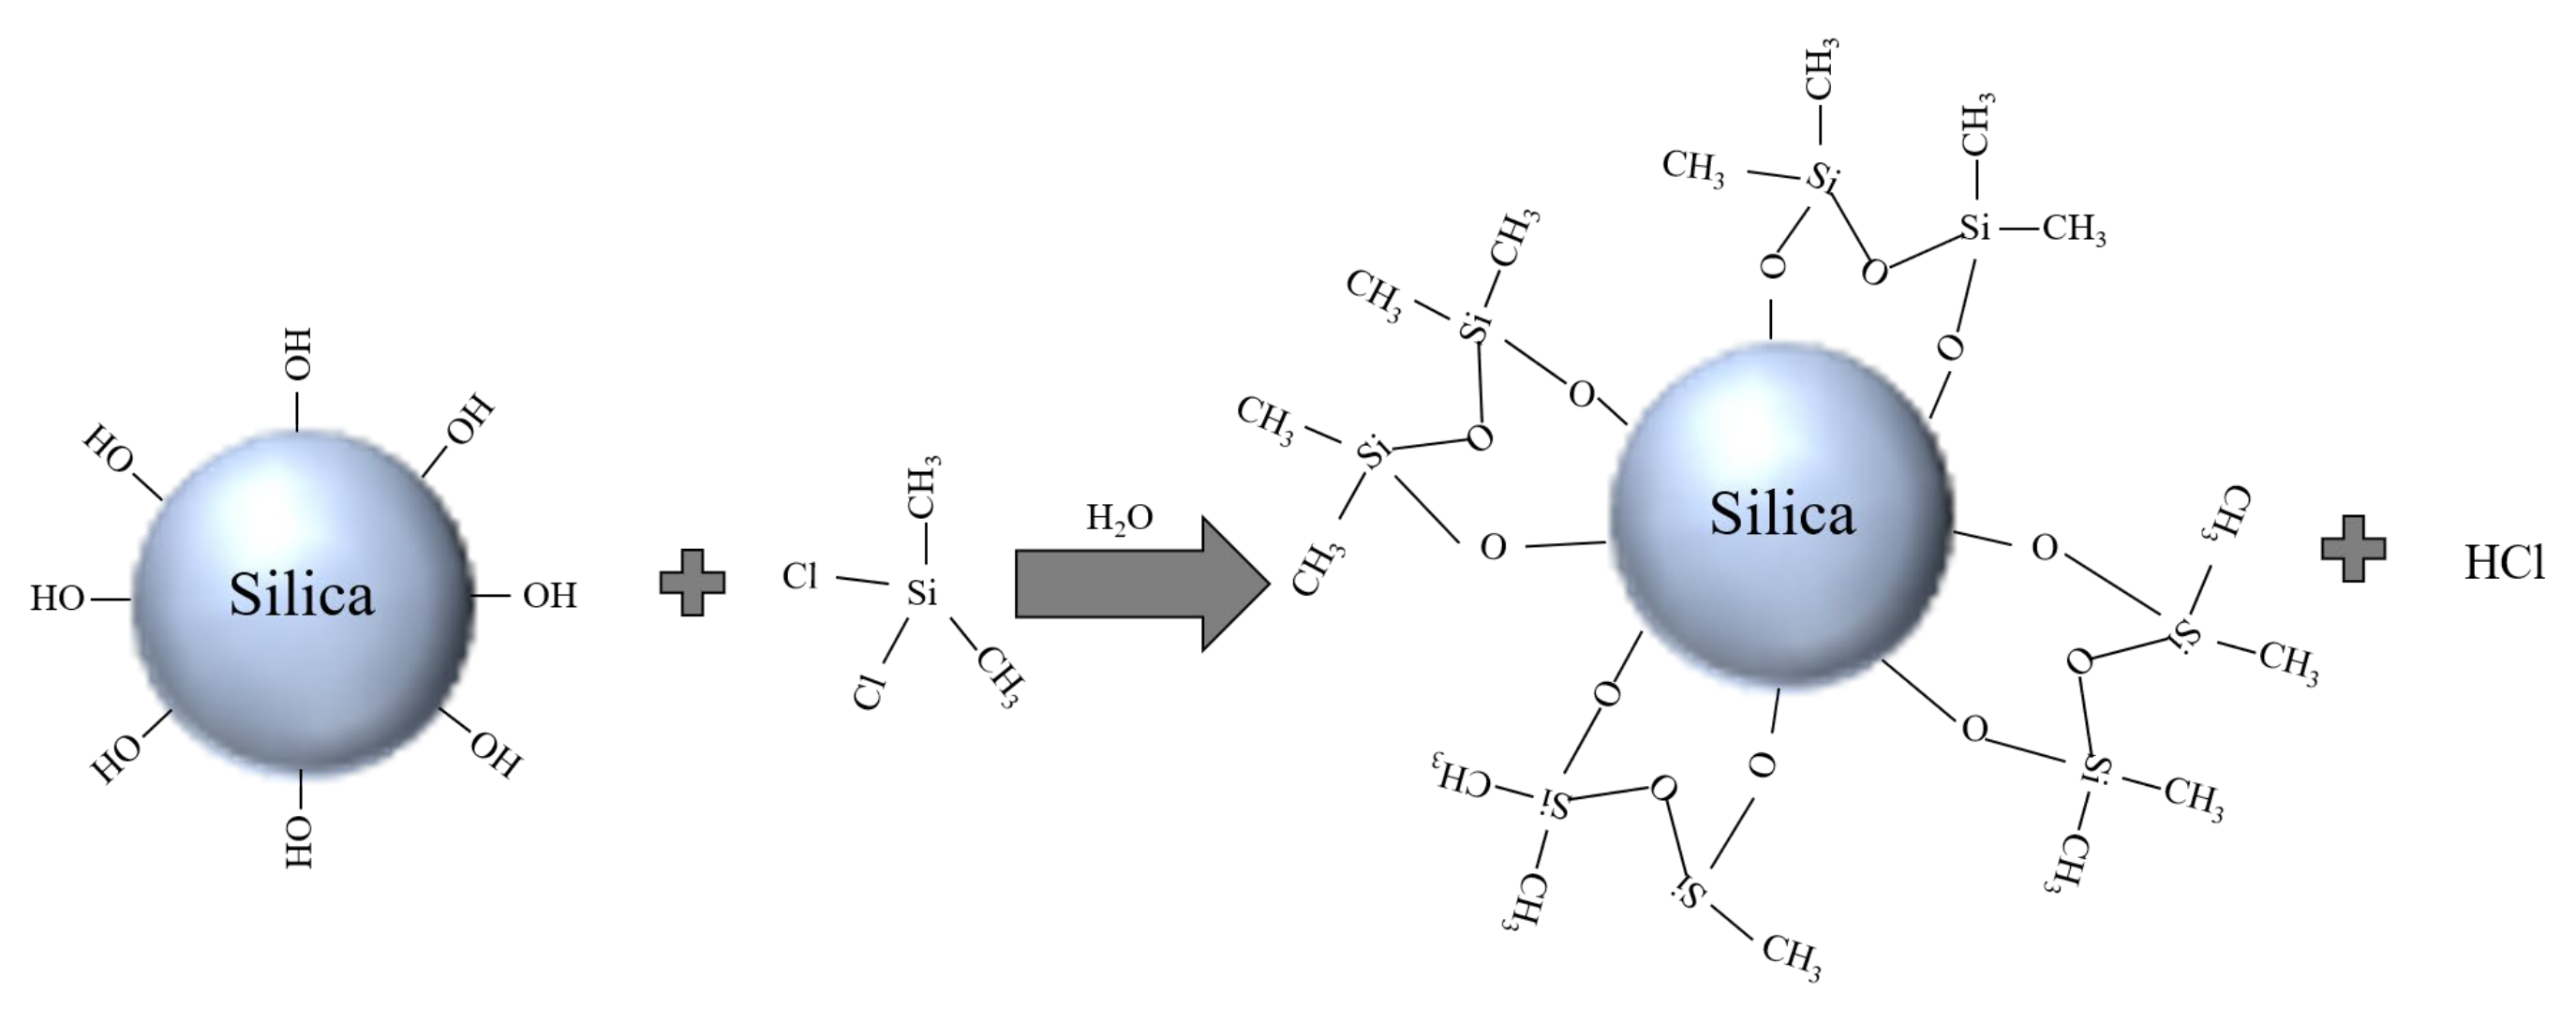
Figure 1. Schematic diagram of SiO2 surface treated with DDS.
Polymers 15 02826 g001
Figure 2. Schematic diagram of the experimental device of the space charge test system.
Polymers 15 02826 g002
Figure 3. Fourier infrared spectra of SiO2 R974 and SiO2 200.
Polymers 15 02826 g003
Figure 4. SEM images of PP and SiO2/PP composites: (a) 0.5 US, (b) 1.0 US, (c) 3.0 US, (d) 0.5 TS, (e) 1.0 TS, (f) 3.0 TS.
Polymers 15 02826 g004
Figure 5. Space charge distribution of SiO2/PP with different kinds of composites under an electric field: (a) PP, (b) 0.5 US, (c) 1.0 US, (d) 3.0 US, (e) 0.5 TS, (f) 1.0 TS, (g) 3.0 TS.
Polymers 15 02826 g005aPolymers 15 02826 g005b
Figure 6. Space charge distributions of PP and SiO2/PP composites in short connection: (a) PP, (b) 0.5 US, (c) 1.0 US, (d) 3.0 US, (e) 0.5 TS, (f) 1.0 TS, (g) 3.0 TS.
Polymers 15 02826 g006
Figure 7. The average volume charge density of space charge in PP and SiO2/PP composites after 1800 s of a short-circuit discharge.
Polymers 15 02826 g007
Figure 8. Volume resistivity of PP and SiO2/PP composites.
Polymers 15 02826 g008
Figure 9. Fitting results of Weibull distribution parameters.
Polymers 15 02826 g009
Figure 10. Schematic diagram of SiO2 limiting current carrier migration.
Polymers 15 02826 g010
Table 1. The mass ratio (%) of SiO2/PP composites.
SpecimenPP/wt%SiO2 200/wt%SiO2 R974/wt%
PP100.00.00.0
0.5 US99.50.50.0
1.0 US99.01.00.0
3.0 US97.03.00.0
0.5 TS99.50.00.5
1.0 TS99.00.01.0
3.0 TS97.00.03.0
Note: “US” stands for untreated SiO2, and “TS” stands for treated SiO2.
Table 2. DC breakdown field strength of different composites.
SpecimenDC Breakdown Field Strength Eb (V/m)Shape Parameter β
PP2.89 × 1084.95
0.5 US3.33 × 1089.83
1.0 US2.78 × 10812.01
3.0 US2.16 × 1089.76
0.5 TS3.41 × 10812.69
1.0 TS3.45 × 10813.50
3.0 TS2.82 × 1088.02
Disclaimer/Publisher’s Note: The statements, opinions and data contained in all publications are solely those of the individual author(s) and contributor(s) and not of MDPI and/or the editor(s). MDPI and/or the editor(s) disclaim responsibility for any injury to people or property resulting from any ideas, methods, instructions or products referred to in the content.