
Effects of Surface Morphology and Type of Cross-Linking of Chitosan-Pectin Microspheres on Their Degree of Swelling and Favipiravir Release Behavior


Abstract
:1. Introduction
2. Experimental
2.1. Materials and Methods
2.2. Preparation of Hydrogels
2.2.1. Extraction of Pectin
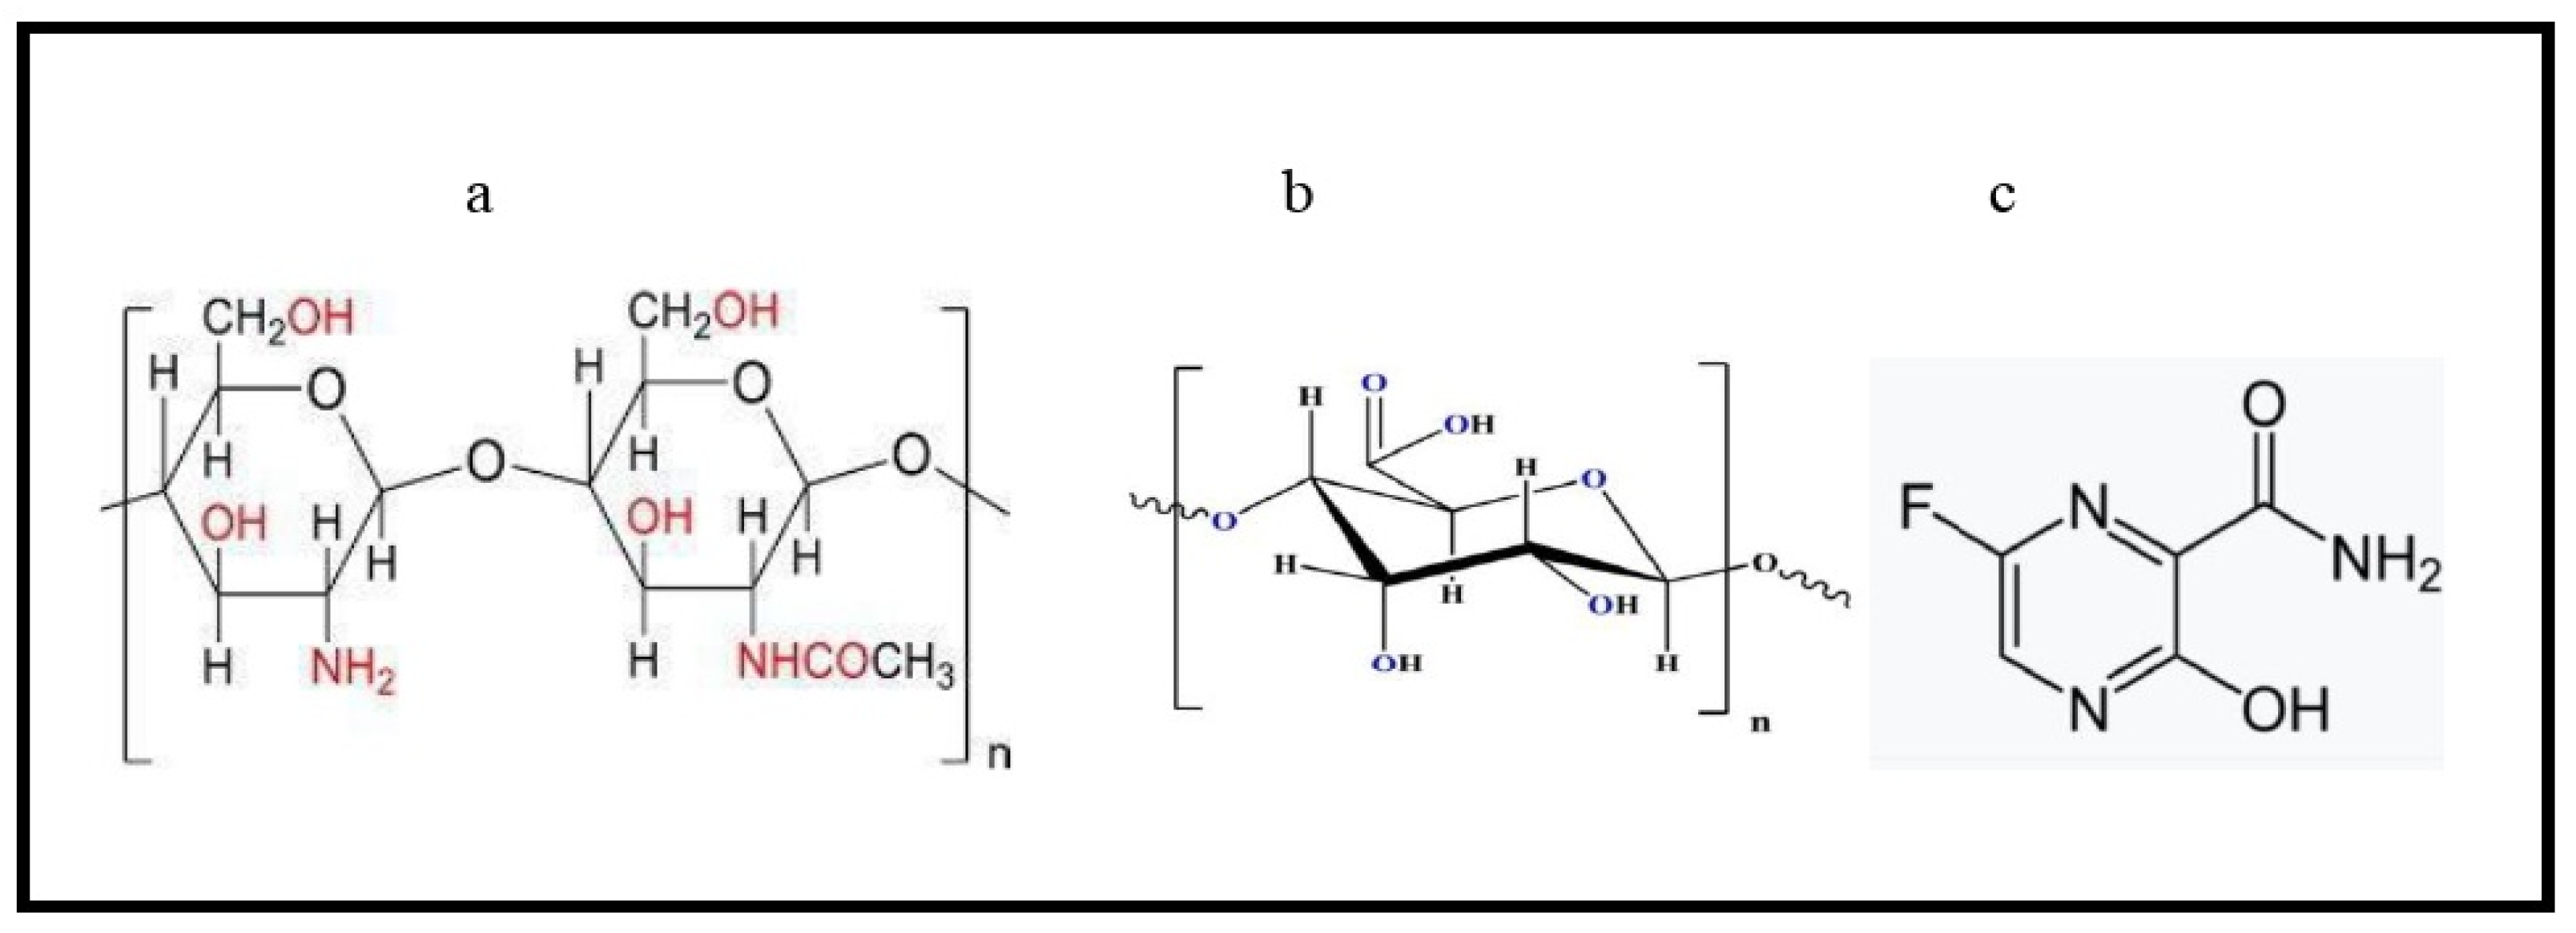
2.2.2. Preparation of Chitosan-Pectin Copolymer
2.3. Measurement of Size and Morphology of Different Microspheres
2.4. Degree of Swelling (DS) in Cross-Linked Microspheres
2.5. Loading of Favipiravir on Microspheres
2.6. Release of Favipiravir from Loaded Microspheres
3. Results and Discussion
3.1. Studies of the Prepared Hydrogels
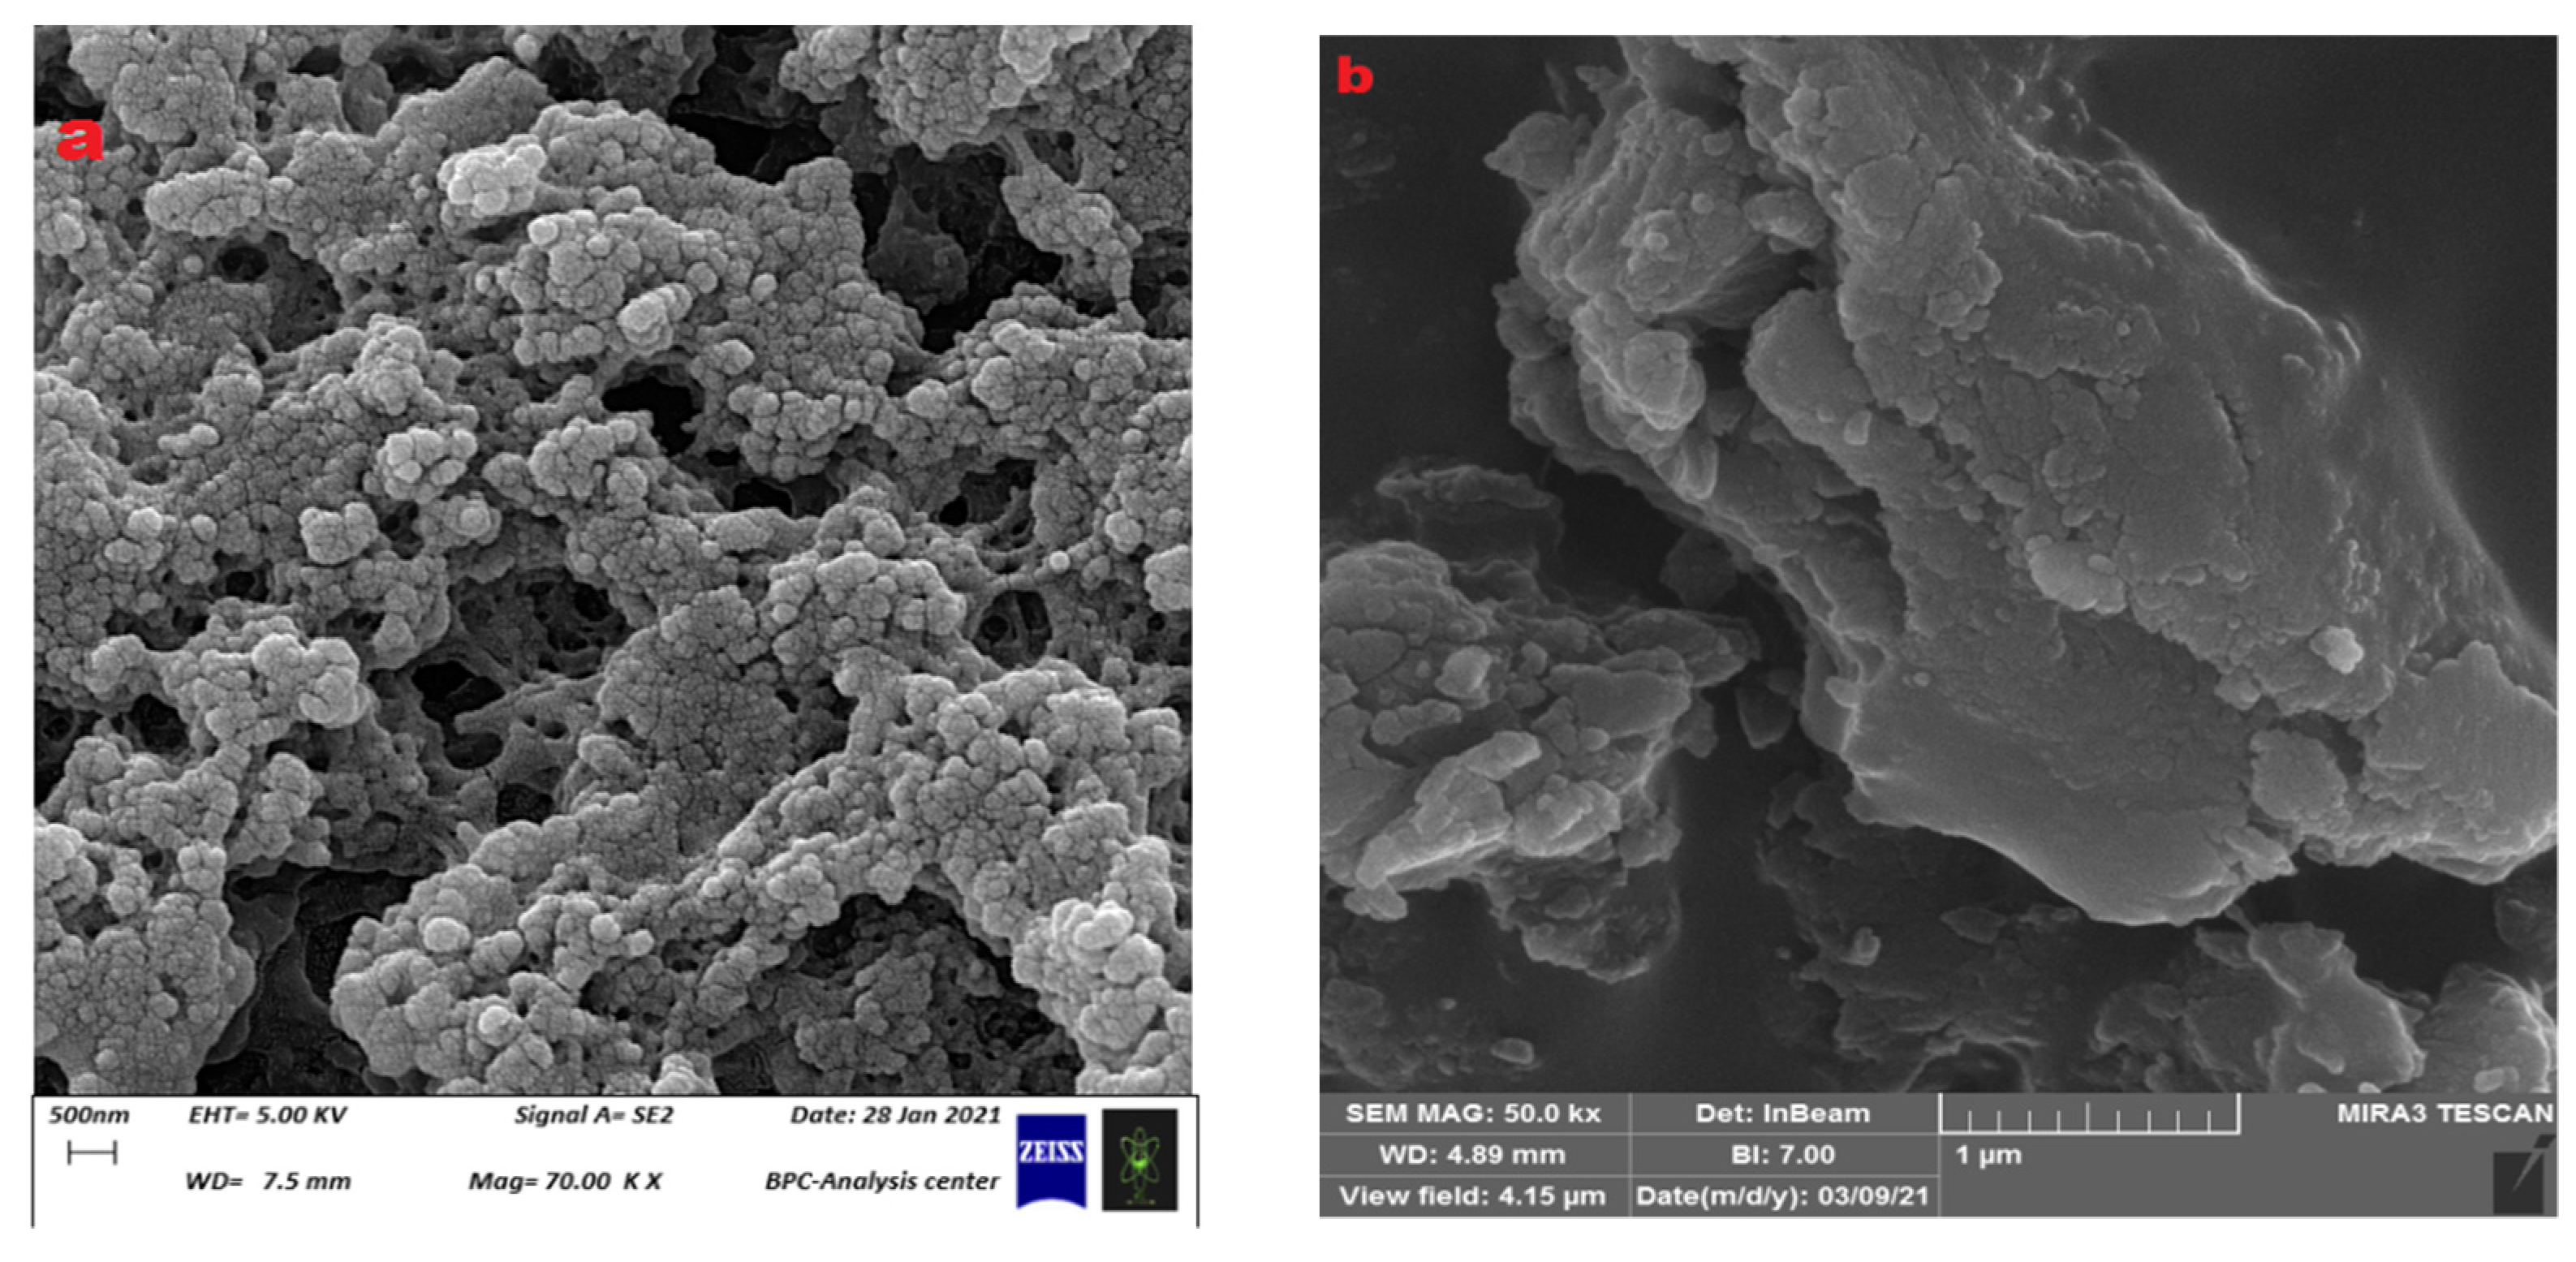
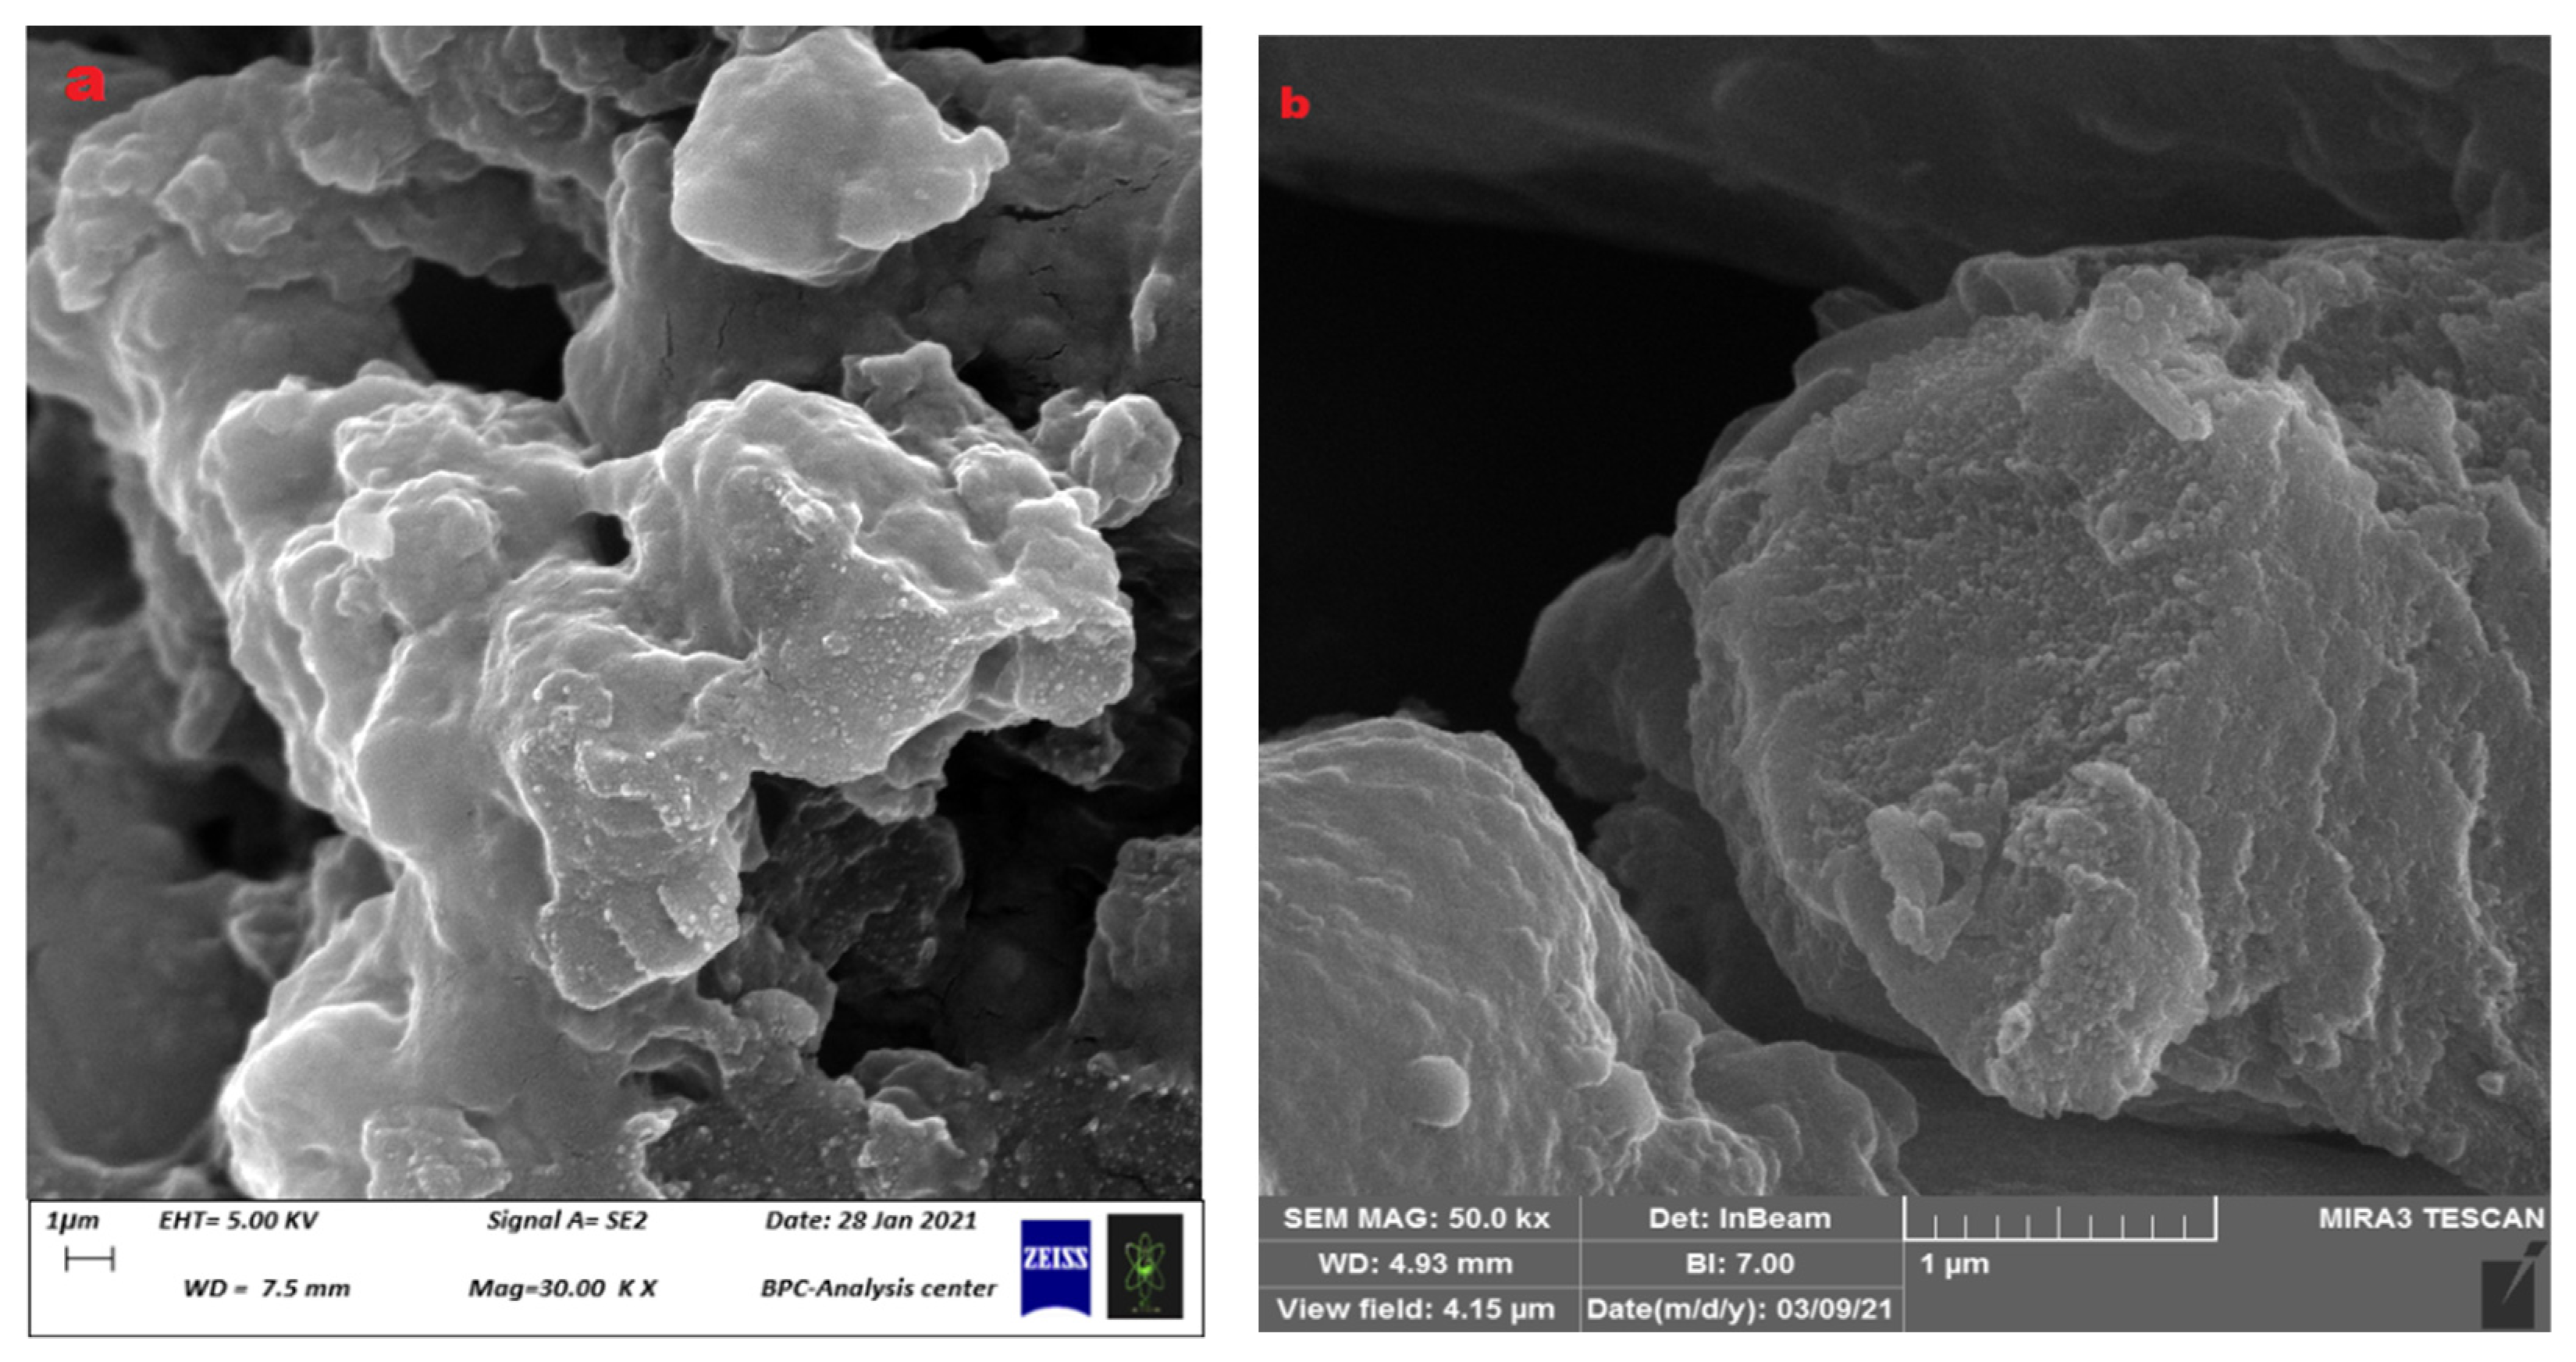
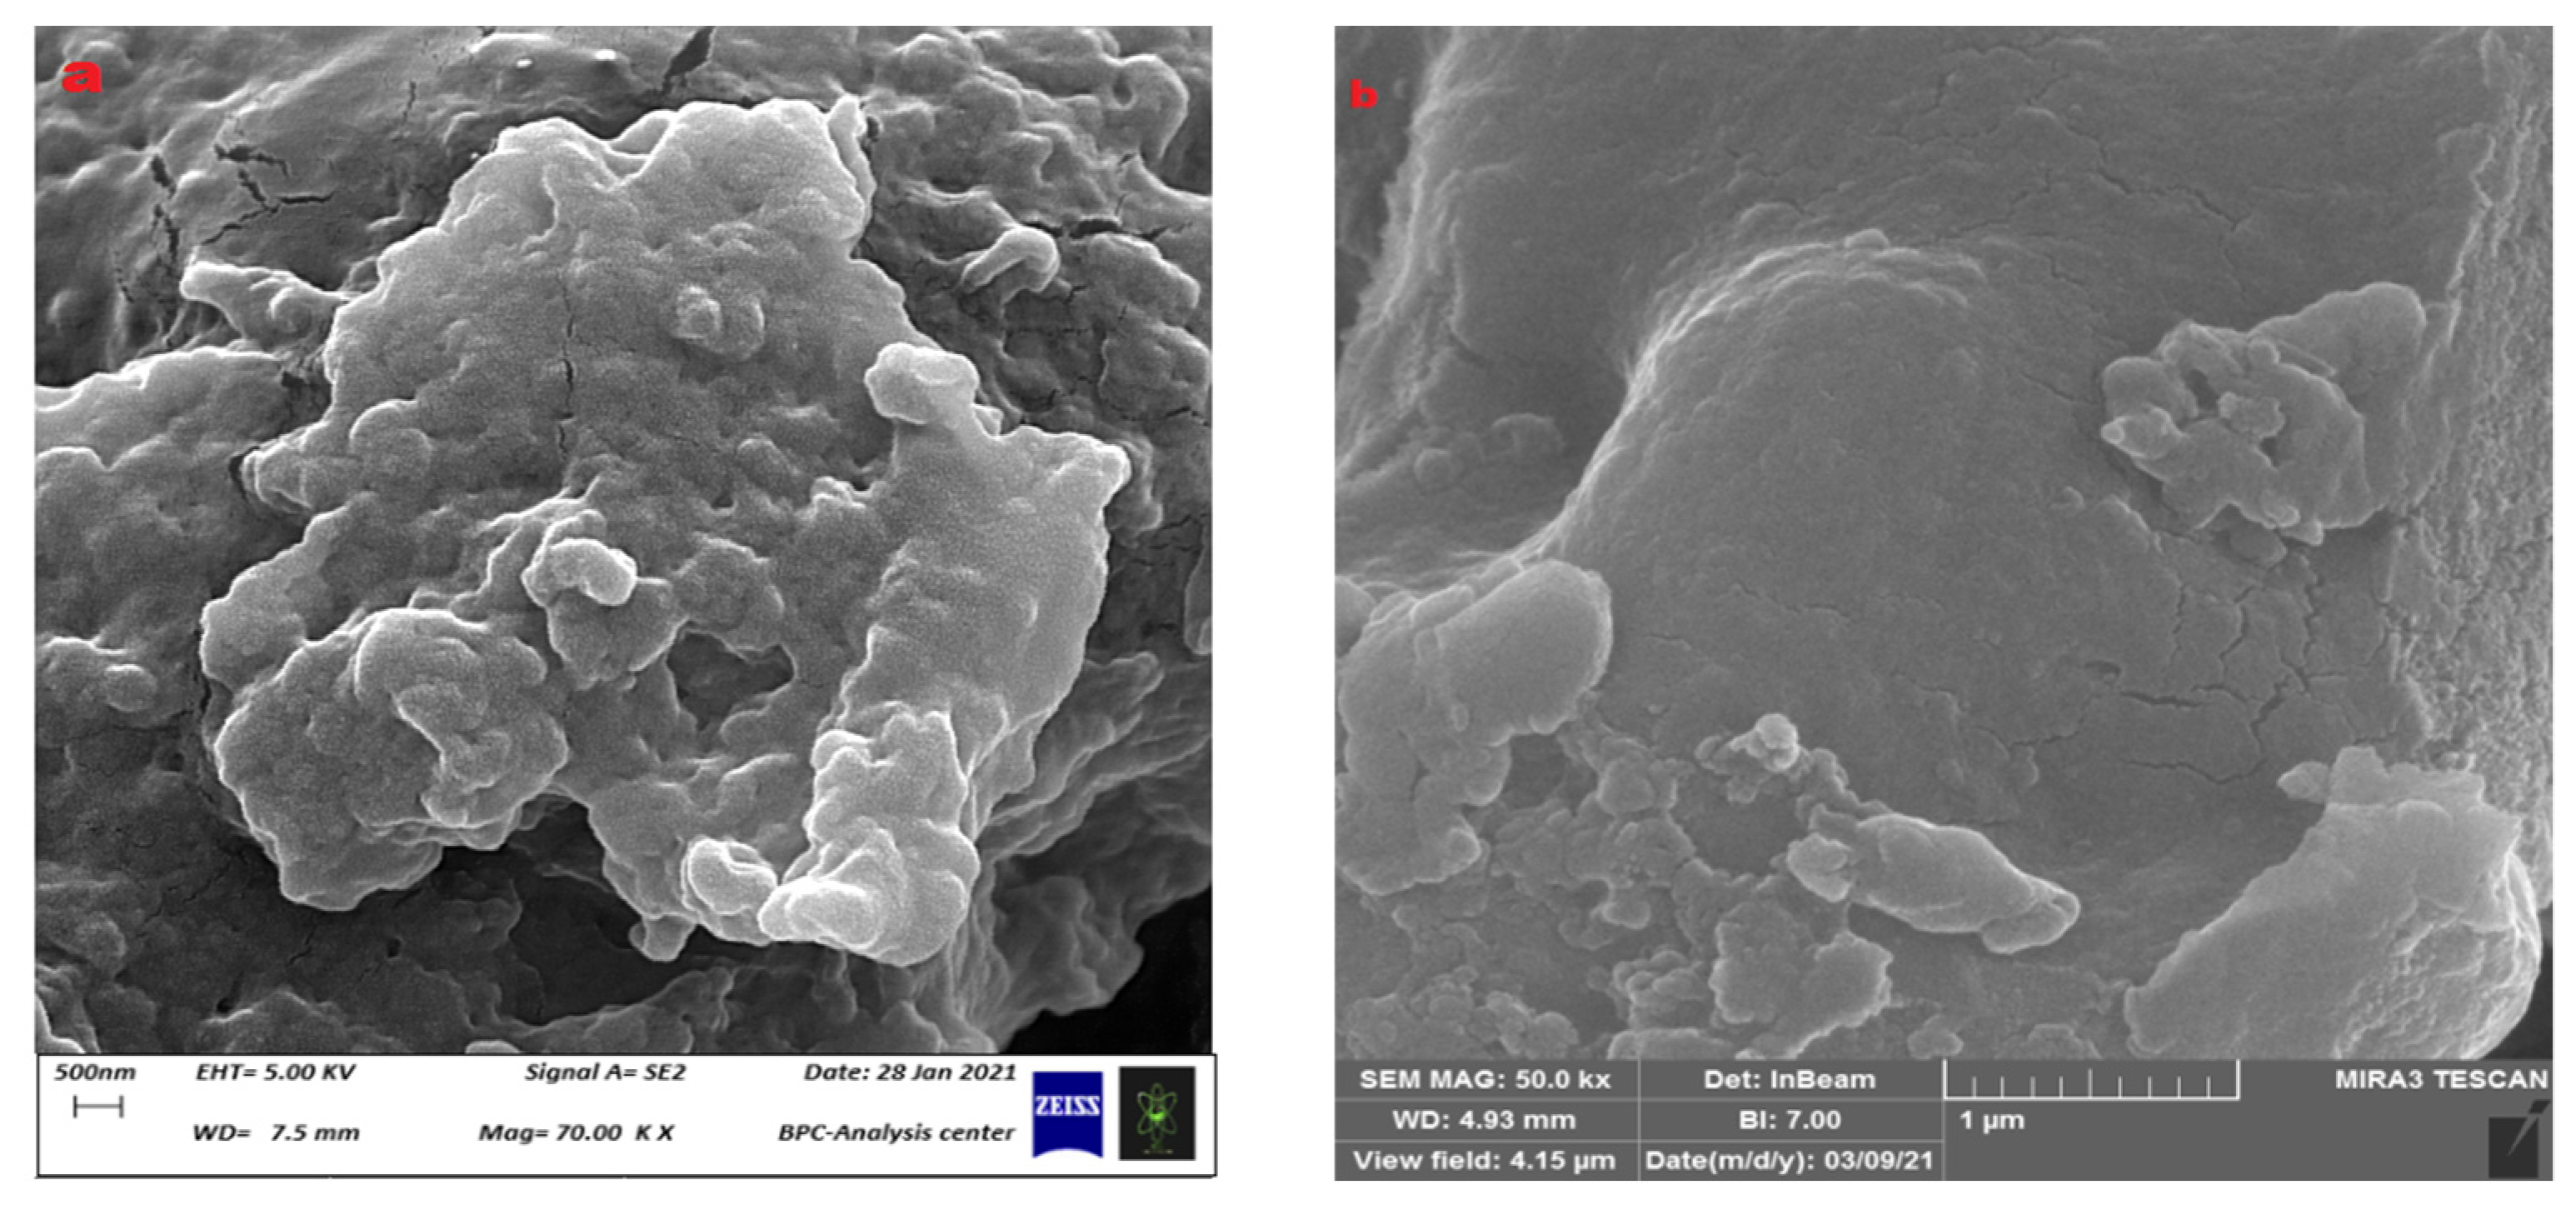
3.2. Surface Measurement of Microspheres and Their Physical Characteristics
3.3. Degree of Swelling
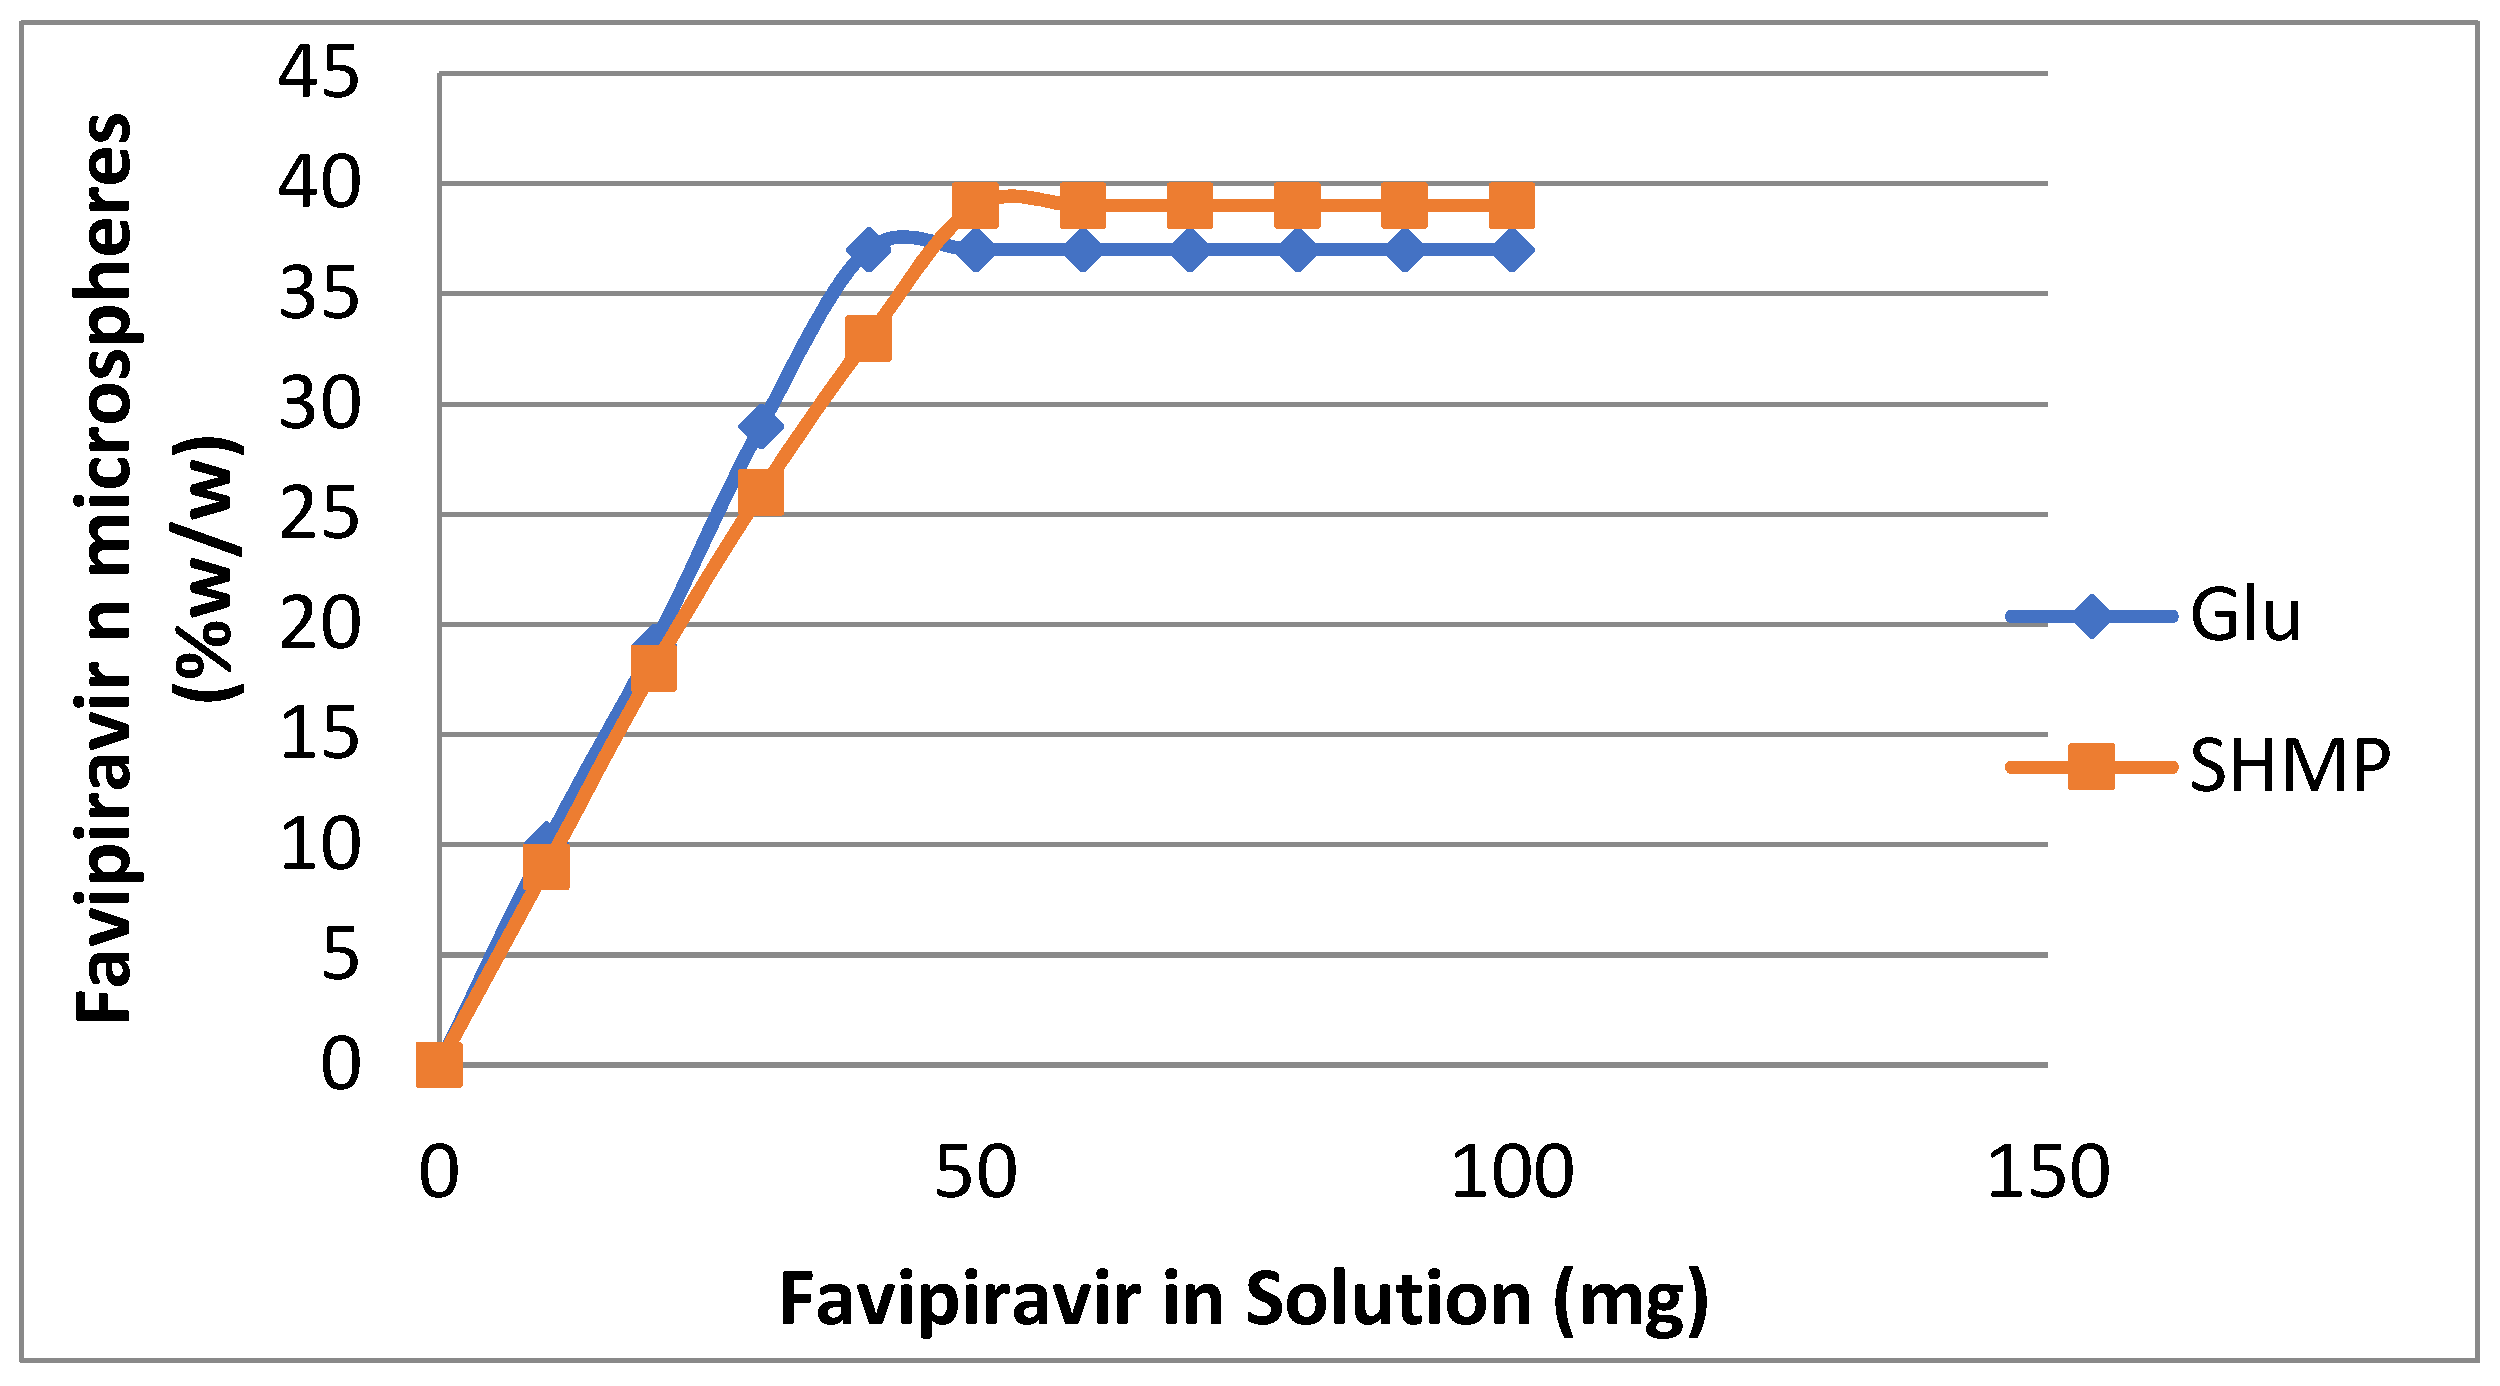
3.4. Loading of Favipiravir on Prepared Microspheres
3.5. Release of Favipiravir from Loaded Microspheres
4. Conclusions
Author Contributions
Funding
Institutional Review Board Statement
Conflicts of Interest
References
- Gutierrez-Alvarado, K.; Chacon-Cerdas, R.; Starbird-Perez, R. Pectin Microspheres: Synthesis Methods, Properties, and Their Multidisciplinary Applications. Chemistry 2022, 4, 121–136. [Google Scholar] [CrossRef]
- Noreen, A.; Nazli, Z.-I.-H.; Akram, J.; Rasul, I.; Mansha, A.; Yagoob, N.; Iqbal, R.; Tabasum, S.; Zuber, M.; Zia, K.-M. Pectins Functionalized Biomaterials; A new Viable Appreach for Biomedical Applications. Int. J. Biolog. Macromol. 2017, 1019, 254–272. [Google Scholar] [CrossRef] [PubMed]
- Yu, Y.; Shen, M.; Song, Q.; Xie, J. Biological Activities and Pharmaceutical Applications of Polysaccharide from Natural Resources. Carbohydr. Polym. 2018, 183, 91–101. [Google Scholar] [CrossRef] [PubMed]
- Peian, Z.; Haifeng, J.; Peijie, G.; Sadeghnezhad, E.; Qiangjan, P.; Tianyu, D.; Feng, L.; Huanchun, J.; Jinggui, F. Chitosan Induces Jasmonic Acid Production leading to Resistance of Ripened Fruit against Botrytis Cinerea Infection. Food Chem. 2021, 337, 124472. [Google Scholar] [CrossRef]
- Periyasamy, K.G.K.; Zuo, H.; He, S. Flexible Printed Circuit Board Magnetic Micromirror for Laser Marking/Engraving. J. Micromech. Microeng. 2019, 29, 085001. [Google Scholar] [CrossRef]
- Caykara, T.; Sande, M.G.; Azaia, N.; Rodrigues, L.R.; Silva, C.J. Exploring the Potential of Polyethylene terephthalate in the Design of Antibacterial Surfaces. Med. Microbiol. Immunol. 2019, 209, 363–372. [Google Scholar] [CrossRef]
- Adepu, S.; Ramakrishna, S. Controlled Drug Delivery Systems: Current Status and Future Directions. Molecules 2021, 26, 5905. [Google Scholar] [CrossRef]
- Fenton, O.S.; Olafson, K.N.; Pillai, P.S.; Mitchell, M.; Jis Langer, R. Advances in Biomaterials for Ding Delivery. Adv. Mater. 2018, 30, 1705328. [Google Scholar] [CrossRef]
- Yun, Y.H.; Lee, B.K.; Park, K. Controlled Drug Delivery: Historical Perspective for the Next Generation. J. Control. Release 2015, 219, 2–7. [Google Scholar] [CrossRef]
- Rashki, S.; Asgarpour, K.; Tarrahimofrad, H.; Hashemipour, M.; Ebrahimi, M.S.; Fathizadeh, H.; Khorshidi, A.; Khan, H.; Marzhoseyni, Z.; Salavati-Niasari, M.; et al. Chitosan-based Nanoparticles. against Bacterial Infections. Carbohyd. Polym. 2021, 251, 117108. [Google Scholar] [CrossRef]
- Zhang, Y.; Sun, T.; Jiang, C. Biomacromolecules as Carriers in Drug Delivery and Tissue Engineering. Acta Pharm. Sin. B 2018, 8, 34–50. [Google Scholar] [CrossRef]
- Zhou, Y.; Li, S.; Li, D.; Wang, S.; Zhao, W.; LV, Z.; Li, H.; Han, Y. Enzymatic preparation of chitooligosaccharides and their Anti-obesity Application. Biosci. Biotechnol. Biochem. 2020, 84, 1460–1466. [Google Scholar] [CrossRef] [PubMed]
- Abid, M.; Cheikhrouhou, S.; Renard, C.M.G.C.; Bureau, S.; Cuvelier, G.; Attia, H.; Ayadi, M.A. Characterization of pectin extracted from pomegranate peel and their gelling properties. Food Chem. 2017, 215, 318–325. [Google Scholar] [CrossRef] [PubMed]
- Burapapadh, K.; Takeuchi, H.; Sriamornsak, P. Development of Pectin Nanoparticles Through Mechanical Homogenization for Dissolution Enhancement of Itraconazole. Asian J. Pharm. Sci. 2016, 11, 365–375. [Google Scholar] [CrossRef]
- Shukla, S.; Verma, K.; Jain, D.; Verma, S. Pectin-based Colon-specific Drug Delivery. Chronicles Young Sci. 2011, 2, 83. [Google Scholar] [CrossRef]
- Furuta, Y.; Komeno, T.; Nakamura, T. Favipiravir (T705) Abroad Spectrum Inhibiter of Viral RNA Polymerase. Proc. Jpn. Acad. Sex. B 2017, 93, 449–463. [Google Scholar] [CrossRef]
- Bai, C.Q.; Mu, J.S.; Kargbo, D.; Song, Y.; Biniu, W.K.; Nie, W.M.; Kanu, A.; Liu, W.W.; Wang, Y.P.; Dafae, F.; et al. Clinical and Virological Characteristics of Ebola Virus Disease Patients Treated with Favipiravir (T-705)-Sierra Leone, 2014. Clin. Infect. Dis. 2016, 63, 1288–1294. [Google Scholar] [CrossRef]
- Josh, S.; Parkar, J.; Ansari, A.; Vora, A.; Talwar, D.; Tiwashar, M.; Patil, S.; Barkate, H. Role of Favipiravir in the Treatment of COVID-19. Inter. J. Infect. Dis. 2021, 102, 501–508. [Google Scholar] [CrossRef]
- Hamed, A.A.-R.; Elkhedir, A.E.E.; Mustafa, S.E. Effect of Soxhlet Method Extraction on Characterization of Pectin of Pumpkin Peels. J. Exp. Food Chem. 2017, 3, 1–4. [Google Scholar]
- Gupta, K.C.; Jabrail, F.H. Effects of Degree of Deacetylation and Cross-linking on Physical Characteristics, Swelling and Release Behavior of Chitosan Microspheres. Carbohyd. Polym. 2006, 66, 43–54. [Google Scholar] [CrossRef]
- Gupta, K.C.; Jabrail, F.H. Gluteraldehyde Cross- linked Chilosan Microspheres for Controlled Release of Centchroman. Carbohyd. Res. 2007, 34, 2244–2252. [Google Scholar] [CrossRef]
- Gupta, K.C.; Jabrail, F.H. Gluteraldehyde and Glyoxal Cross-linked Chitosan Microspheres for Controlled Delivery of Centchroman. Carbohyd. Res. 2006, 341, 744–756. [Google Scholar] [CrossRef]
- Hanze, L.J.; Koehl, N.J.; Jansen, R.; Holm, R.; Vertzoni, M.; Whitfield, P.D.; Griffin, B.T. Development and Evaluation of a Biorelevant Medium Simulating Porcine Gastrointestinal Fluids. Eur. J. Pharm. Biopharm. 2020, 154, 116–126. [Google Scholar] [CrossRef] [PubMed]
- Gupta, K.C.; Jubrail, F.H. Controlled-Release Formulations for Hydroxy Urea and Rifampicin Using Polyphosphate—Anion-Crosslinked Chitosan Microspheres. J. Appl. Polym. Sci. 2007, 104, 1942–1956. [Google Scholar] [CrossRef]
- Demir, D.; Ceylan, S.; Gokturk, D.; Bolgen, N. Extraction of Pectin from Albedo of Lemon Peels for Preparation of Tissue Engineering Scaffolds. Polym. Bull. 2021, 78, 2211–2226. [Google Scholar] [CrossRef]
- Koziel, A.; Skoda-Pomianek, K.; Gorniak, A.; Wikiera, A.; Cyprych, K.; Malik, M. Structural Determination of Pectin by Spectroscopy Methods. Coating 2022, 12, 546. [Google Scholar] [CrossRef]
- Duan, X.; Zhu, Y.; Shu, C.; Gao, J.; Liu, F.; Pan, S. Extraction of Pectin from Satsuma Mandarin Peel: A Comparison of High Hydrostatic Pressure and Conventional Extractions in Different Acids. Molecules 2022, 27, 3747. [Google Scholar] [CrossRef]
- Pasarin, D.; Ghizdareanu, A.L.; Teodorescu, F.; Rovinaru, C.; Banu, A. Characterization of Pectin Oligosaccharides Obtained from Citrus Peel Pectin. Ferment 2023, 9, 312. [Google Scholar] [CrossRef]
- Florez-Pardo, L.M.; Gonzalez-Cordoba, A.G.; Lopez-Galen, J.E. Characterization of Hemicellulose from Leaves and Tops of the CC 8475, CC 8592 and V7151 Varieties of Sugarcane (Saccharum officinarum L.). DYNA 2020, 86, 98–107. [Google Scholar] [CrossRef]
- Baum, A.; Dominial, M.; Vidal-Melgosa, S.; Willats, W.G.T.; Sonderguard, K.M. Prediction of Pectin Yield and Quality by FTIR and Carbohydrate Microarray Analysis. Food Bioprocess Proc. Technol. 2017, 10, 143–154. [Google Scholar] [CrossRef]
- Facchinatto, W.M.; Santos, D.M.; Fiamingo, A.; Barnardes-Filho, R.; Campana-Filho, S.P.; de Azevedo, E.R.; Colnago, L.A. Evaluation of Chitosan Crystallinity: A high Resolution Solid-state NMR Spectroscopy Approach. Carbohyd. Polym. 2020, 250, 116891. [Google Scholar] [CrossRef] [PubMed]
- Dalpasquale, G.; Delbem, A.C.B.; Passan, J.P.; Nunes, G.; Gorup, L.F.; Neto, F.N.S.; Camargo, E.; Danelon, M. Effect of the Addition of Nano-sized Hexametaphosphate to Fluoride Toothpastes on Tooth Demineralization: An In Vitro Study. Clin. Oral Investig. 2017, 21, 1821–1827. [Google Scholar] [CrossRef] [PubMed]
- Gupta, K.C.; Jabrail, F.H. Preparation and Characterization of Sodium Hexametaphosphate Cross-linked Chitosan Microspheres for Controlled and Sustained Delivery of Centchroman. Int. J. Biol. Macromol. 2006, 38, 272–283. [Google Scholar] [CrossRef] [PubMed]
- Domotor, O.; Enyedy, E.A. Evaluation of In Vitro Distribution and Plasma Protein Binding of Selected Antiviral Drugs (Favipiravir, Molnupiravir and Imatinib) against SARS-CoV-2. Int. J. Mol. Sci. 2023, 24, 2849. [Google Scholar] [CrossRef]


| FTIR Characteristic Functional Groups | ||||||||
|---|---|---|---|---|---|---|---|---|
| Sample | (O-H)str | (C=O)str | (C=O)str Amide-I | (N-H)str Amide-II | (-C=N-)str | (C=O)str symm. | (N-H)band | (p-o-p) |
| Wave Numbers v/cm−1 | ||||||||
| CS-co-PE/Glu | 3426 | 1717 | 1678 | 1555 | 1640 | 1381 | 1111 | …… |
| CS-co-PE/SHMP | 3460 | 1724 | 1647 | 1574 | 1622 | 1388 | 1157 | 1157 1069 |
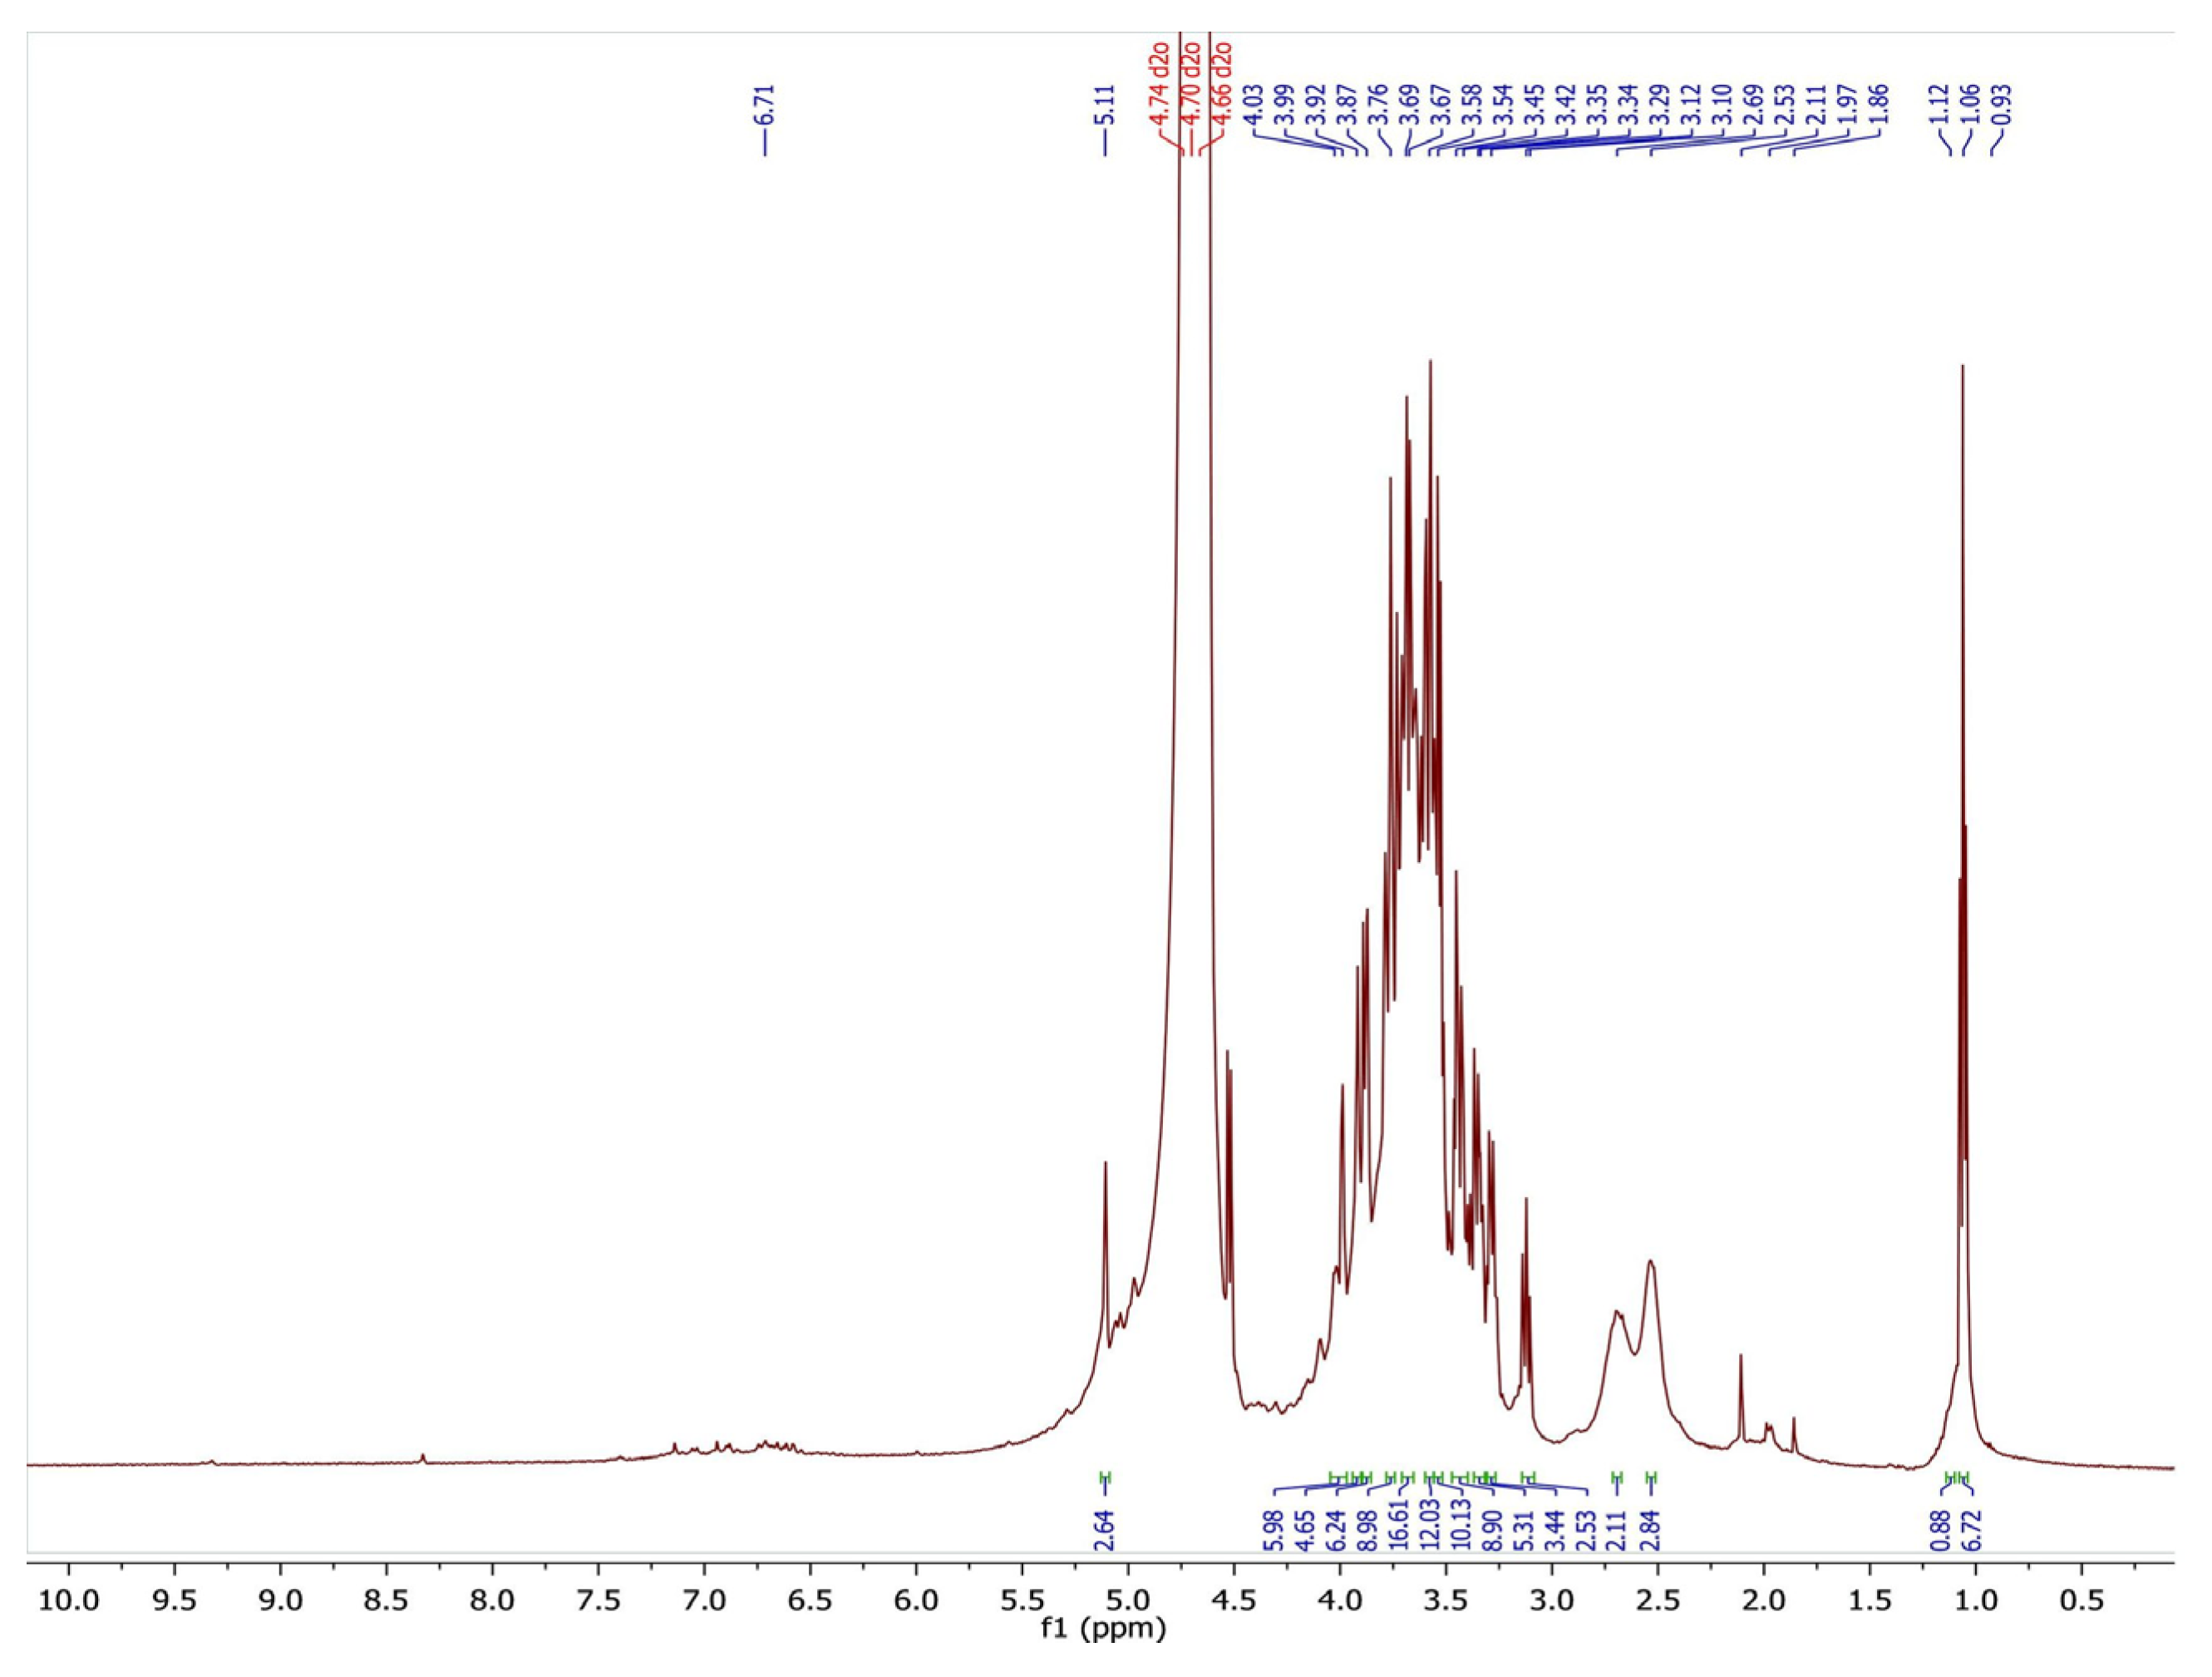
| Sample | Chemical Shift σ/ppm | Description of Proton |
|---|---|---|
| CS-co-PE/Glu | 1.0–1.7 | (CH2) groups of gluteraldehyde. |
| 1.04–1.1 | (CH3) groups of rhamnose. | |
| 1.84–1.96 | Acetyl groups of pectin. | |
| 3.72–3.8 | Methoxy group of pectin & D-glucopyranose of chitosan. | |
| 3.5–4.0 | Protons of glucopyranose ring in chitosan. | |
| 3.0–3.8 | Cross-linking of glucosamine groups with gluteraldehyde. |
| Sample | TGA Weight Loss (%) | DSC (w/g) | ||||
|---|---|---|---|---|---|---|
| IDT/°C | FDT/°C | Tmax/°C | Tcr/°C | Tg/°C | ||
| (CS-co-PE)/Glu | 2.0% 72 °C | 52% 382 °C | 32.0% 277 °C | 60.0% 450 °C | 42 °C | +389 J/g 240 °C |
| (CS-co-PE)/SHMP | 2.9% 92 °C | 46% 398 °C | 28.5% 290 °C | 56.8% 458 °C | 51 °C | +468 J/g 251 °C |
| Plot Type | Plot Data | CS-co-PE/Glu | CS-co-PE/SHMP |
|---|---|---|---|
| Adsorption Branch | |||
| BET Plot | Vm | 0.5184 [cm(STP)g−1] | 76.94 [cm3(STP)g−1] |
| as, BET | 2.2561 [m2g−1] | 334.88 [m2g−1] | |
| Total pore volume (P/Po = 0.990) | 0.0059719 [cm3g−1] | 0.9177 [cm3g−1] | |
| Mean pore diameter | 10.588 [nm] | 10.961 [nm] | |
| BJH Plote | Vp | 0.0070665 [cm3g−1] | 0.9339 [cm3g−1] |
| rp, peak (Area) | 1.21 [nm] | 4.61 [nm] | |
| ap | 5.0978 [m2g−1] | 420.24 [m2g−1] | |
| Microsphere Sample | Max. Loading Lmax (mg) | Release Solution pH | Burst Release (mg) | Controlled Release (mg) | Controlled Release Time (h) |
|---|---|---|---|---|---|
| CS-co-PE/Glu | 35 | 1.3 | 11.6 | 23.4 | 24 |
| 7.4 | 9.8 | 25.2 | 30 | ||
| 9.4 | 23.8 | 11.2 | 12 | ||
| CS-co-PE/SHMP | 37 | 1.3 | 19.2 | 17.8 | 18 |
| 7.4 | 10.4 | 26.6 | 36 | ||
| 9.4 | 20.9 | 16.1 | 18 |
Disclaimer/Publisher’s Note: The statements, opinions and data contained in all publications are solely those of the individual author(s) and contributor(s) and not of MDPI and/or the editor(s). MDPI and/or the editor(s) disclaim responsibility for any injury to people or property resulting from any ideas, methods, instructions or products referred to in the content. |
© 2023 by the authors. Licensee MDPI, Basel, Switzerland. This article is an open access article distributed under the terms and conditions of the Creative Commons Attribution (CC BY) license (https://creativecommons.org/licenses/by/4.0/).
Share and Cite
Hameed, A.R.; Majdoub, H.; Jabrail, F.H. Effects of Surface Morphology and Type of Cross-Linking of Chitosan-Pectin Microspheres on Their Degree of Swelling and Favipiravir Release Behavior. Polymers 2023, 15, 3173. https://doi.org/10.3390/polym15153173
Hameed AR, Majdoub H, Jabrail FH. Effects of Surface Morphology and Type of Cross-Linking of Chitosan-Pectin Microspheres on Their Degree of Swelling and Favipiravir Release Behavior. Polymers. 2023; 15(15):3173. https://doi.org/10.3390/polym15153173
Chicago/Turabian StyleHameed, Amer Rashid, Hatem Majdoub, and Fawzi Habeeb Jabrail. 2023. "Effects of Surface Morphology and Type of Cross-Linking of Chitosan-Pectin Microspheres on Their Degree of Swelling and Favipiravir Release Behavior" Polymers 15, no. 15: 3173. https://doi.org/10.3390/polym15153173