
Analysis of the Impact of Rubber Recyclate Addition to the Matrix on the Strength Properties of Epoxy–Glass Composites


Abstract
:
1. Introduction
2. Materials and Methods
- (4)
- Rubber recyclate from the recycling process of car tires with granulation of 0.5 mm to 3 mm [34].
Planning and Conditions of the Experiment
3. Results and Discussion
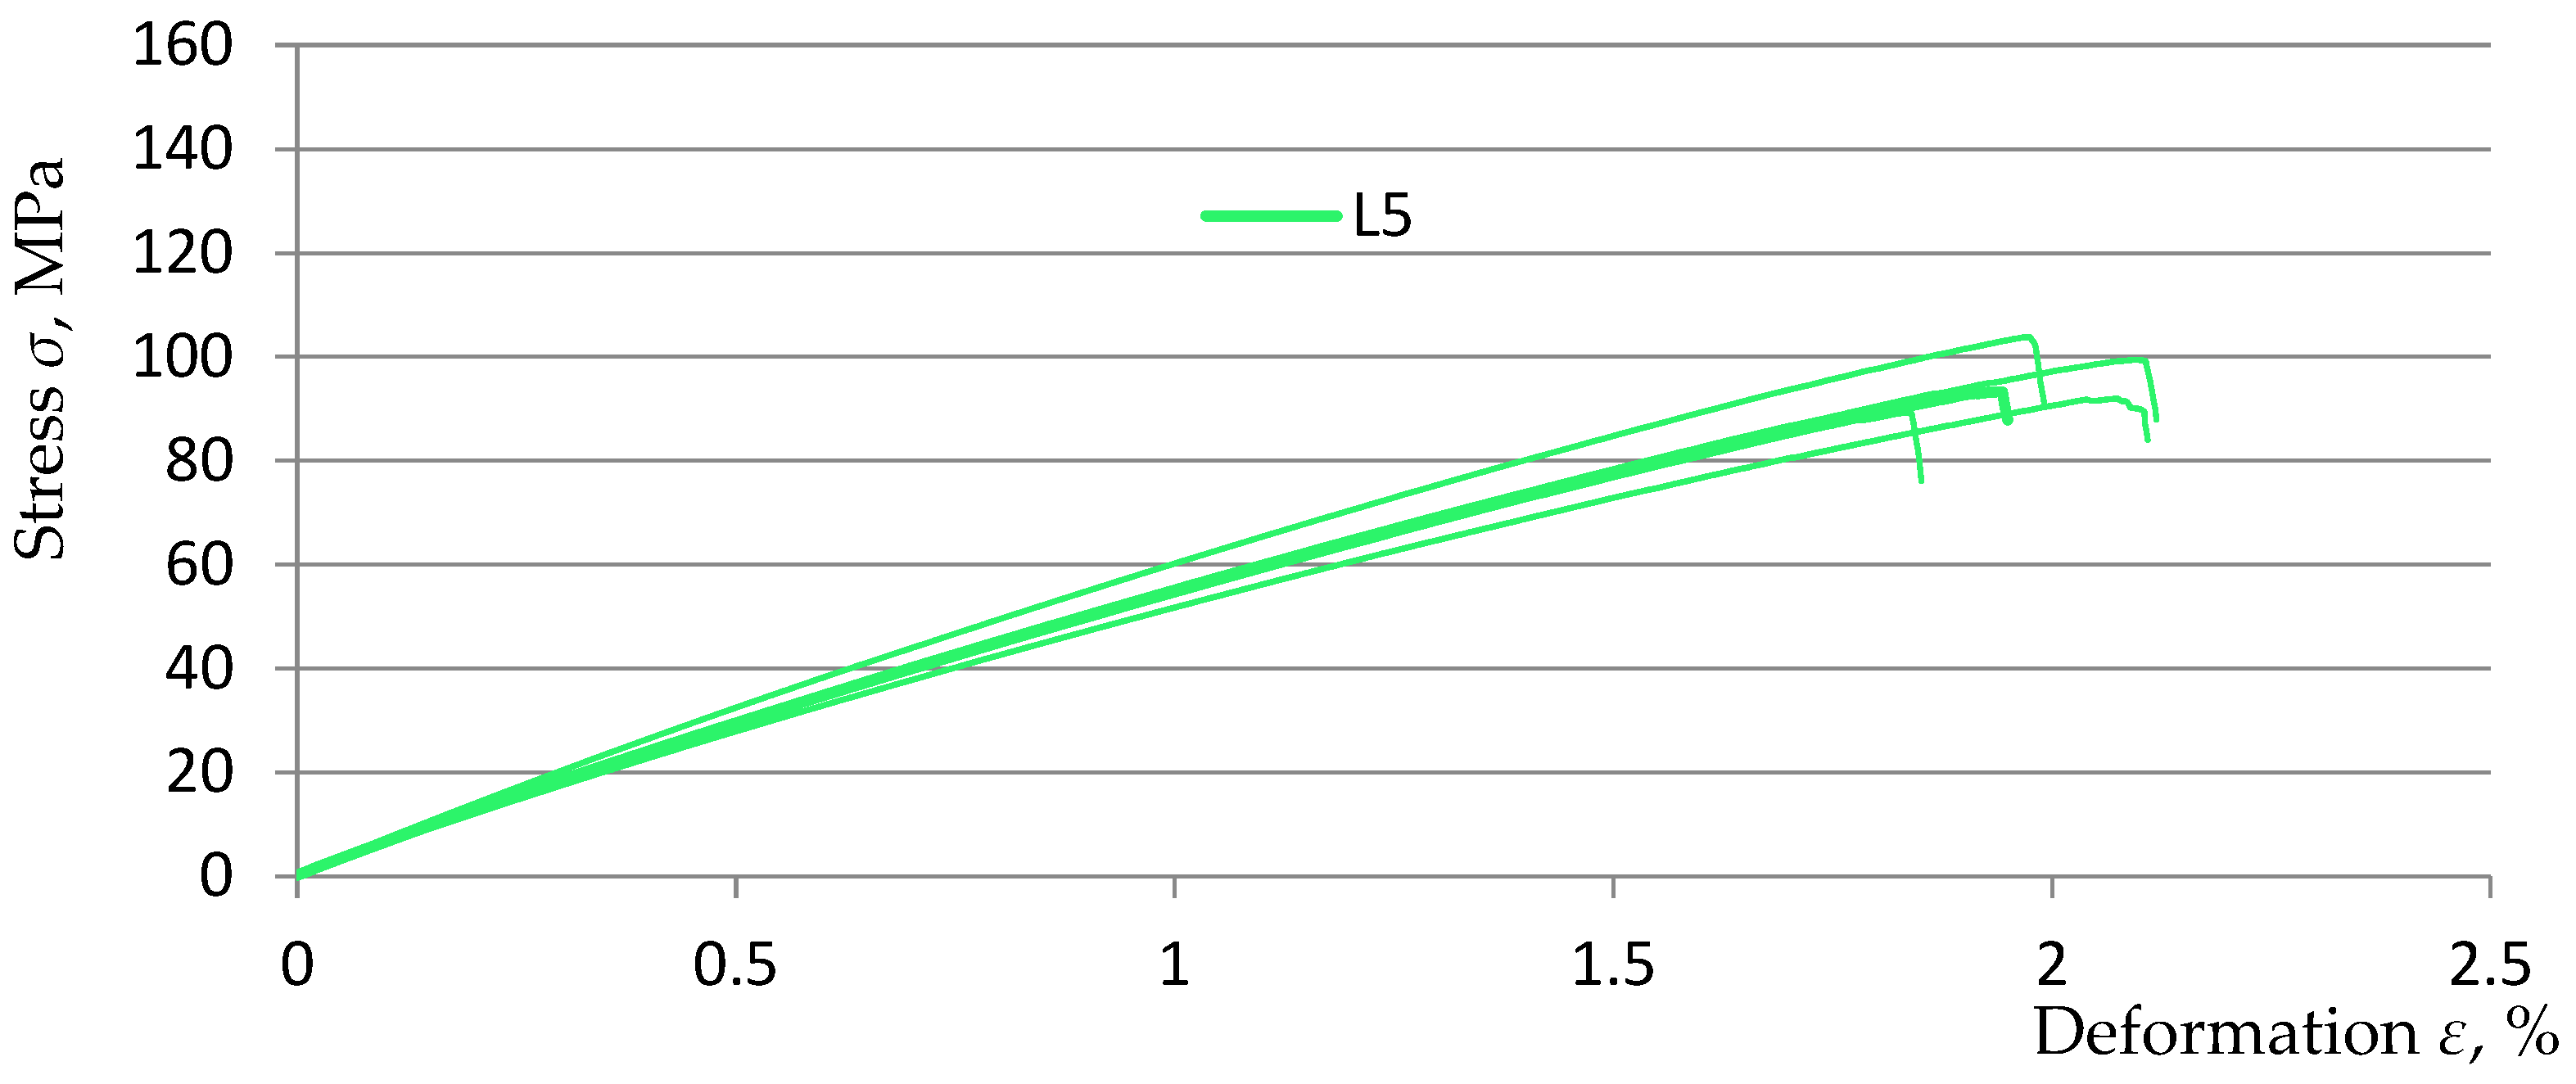
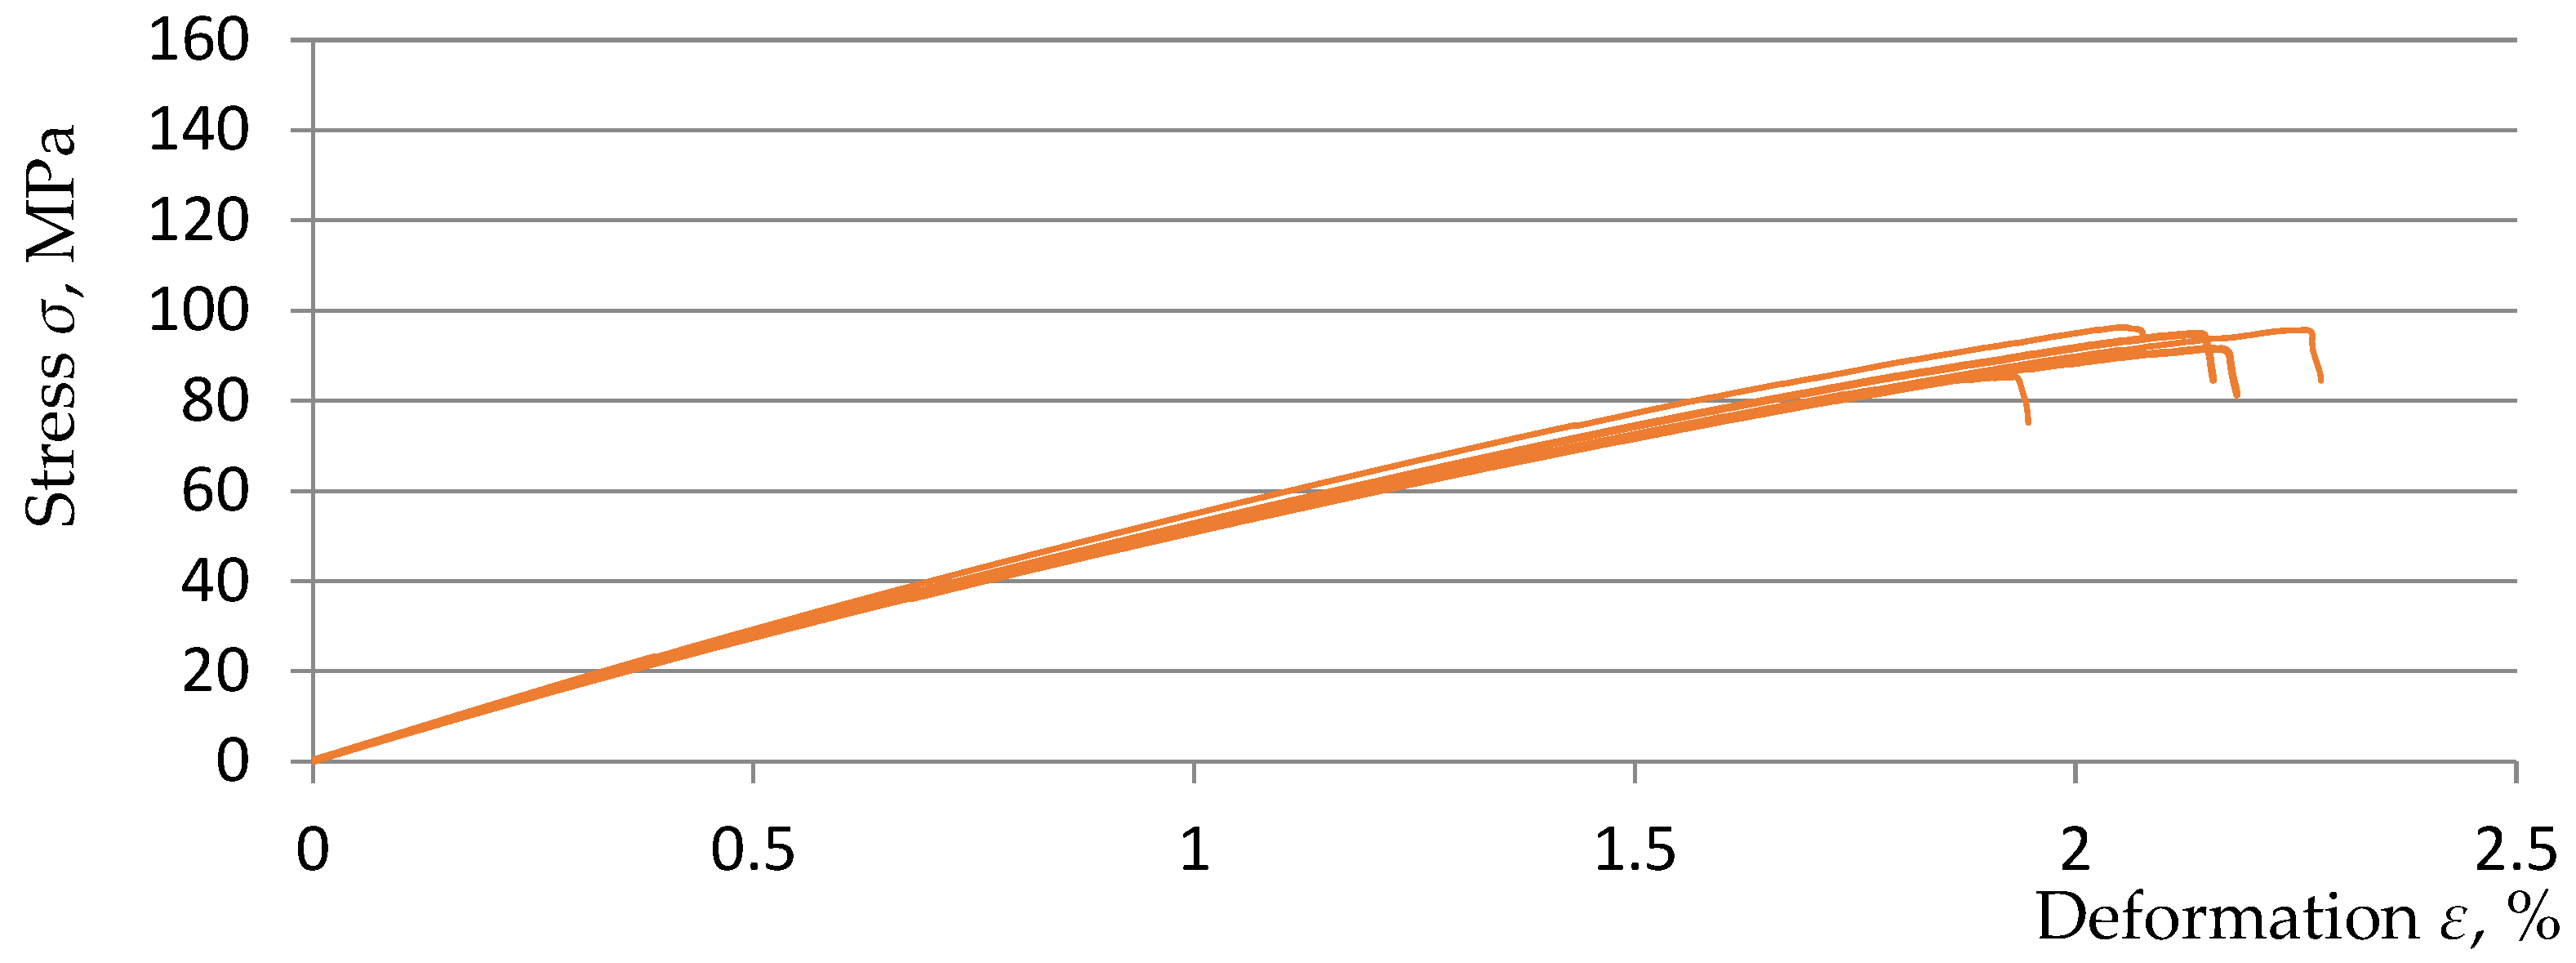
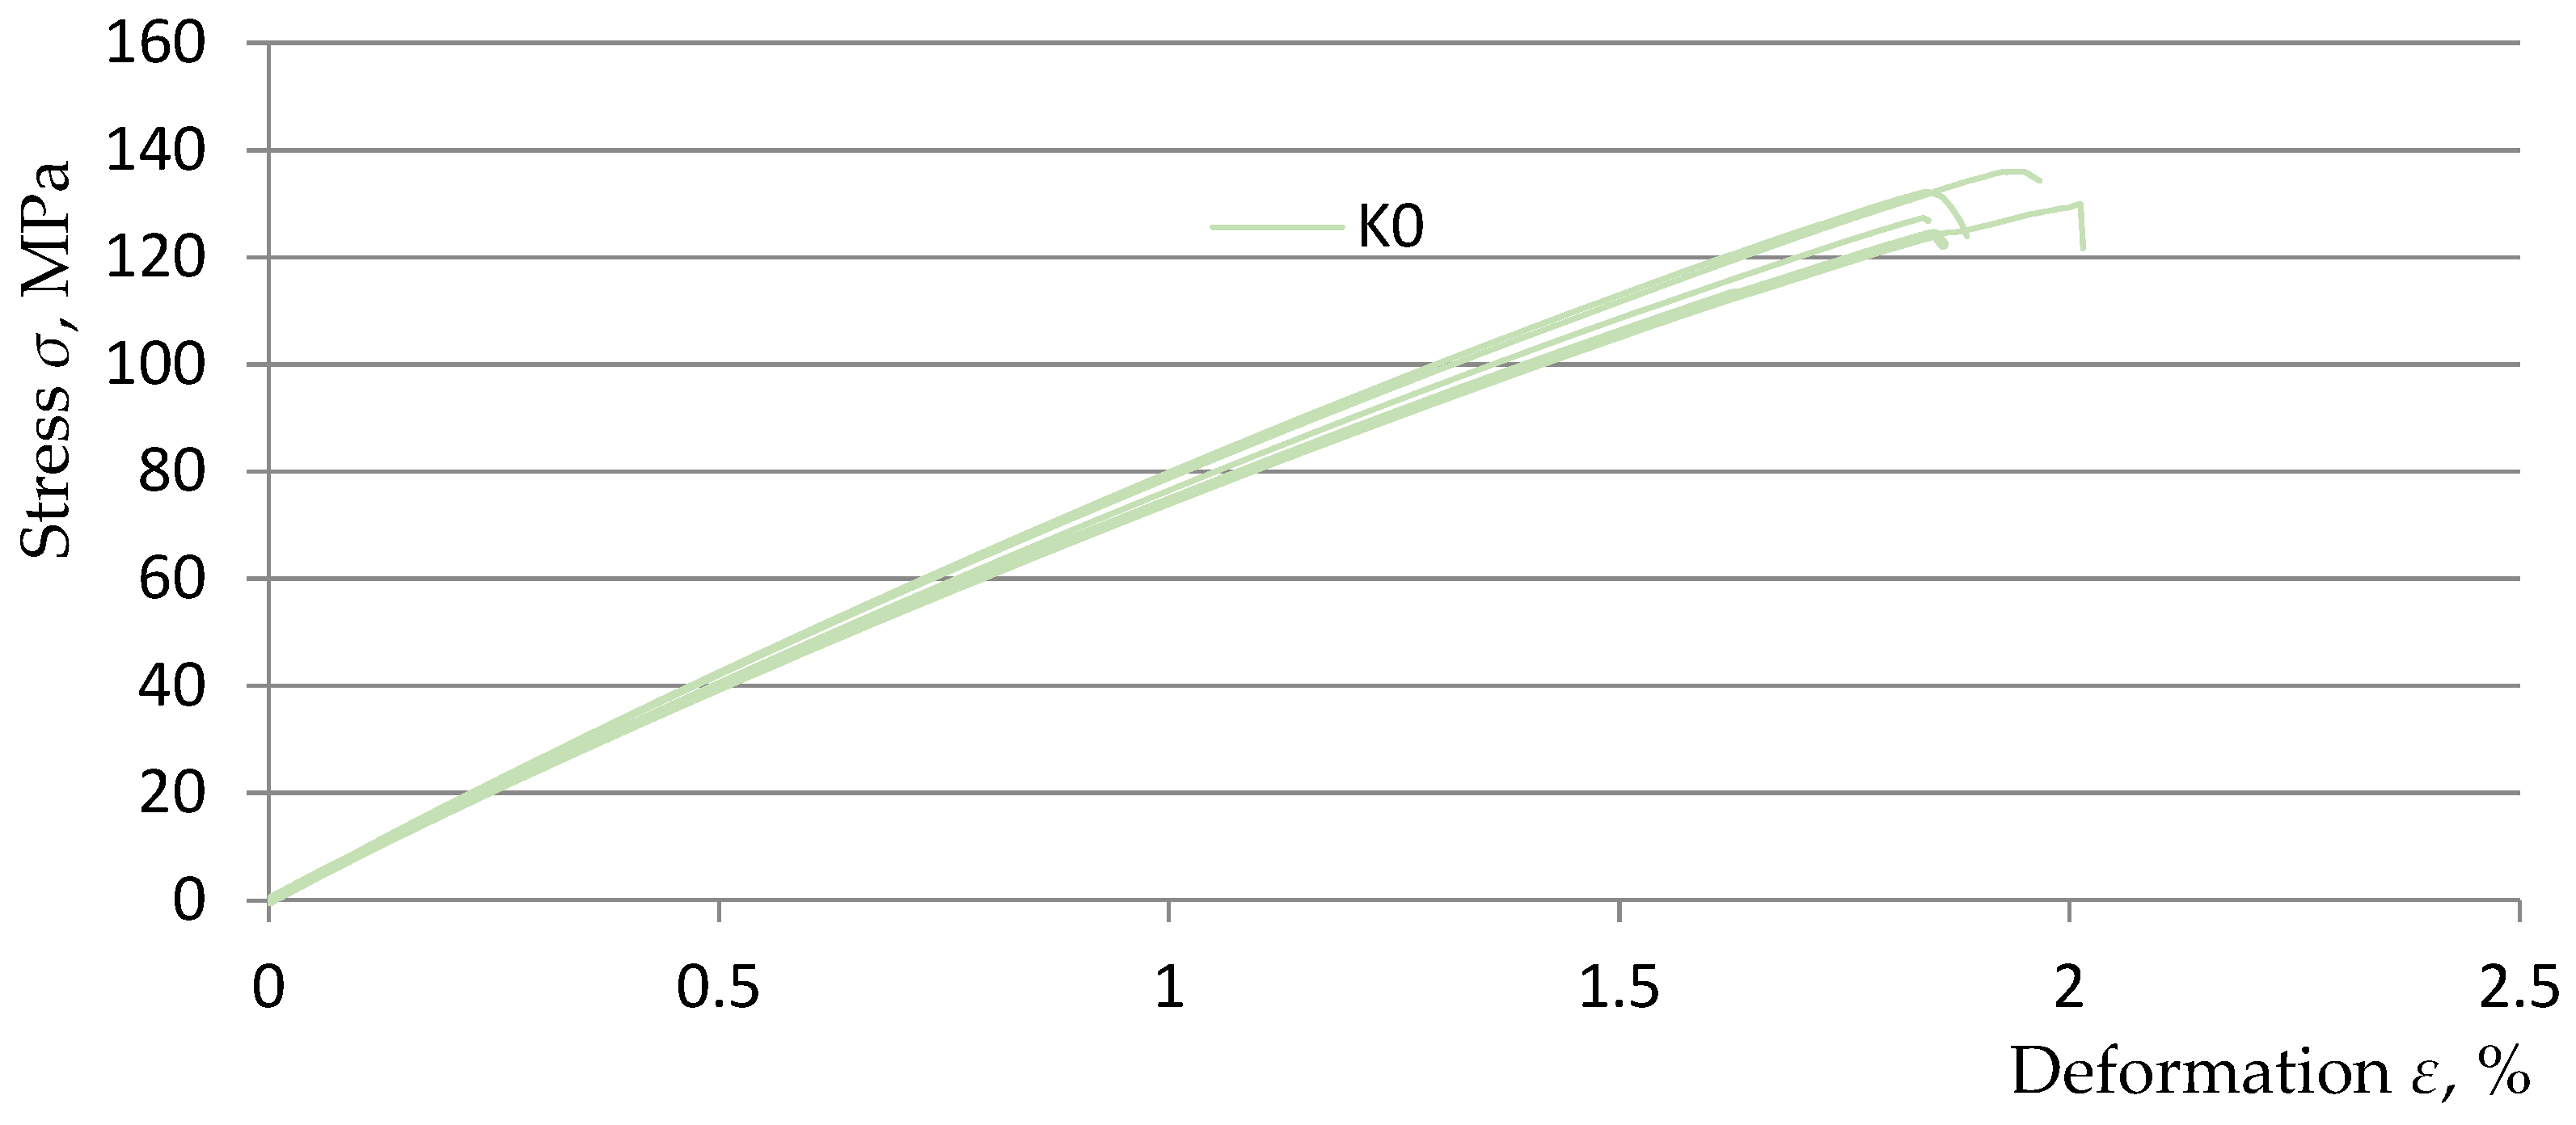
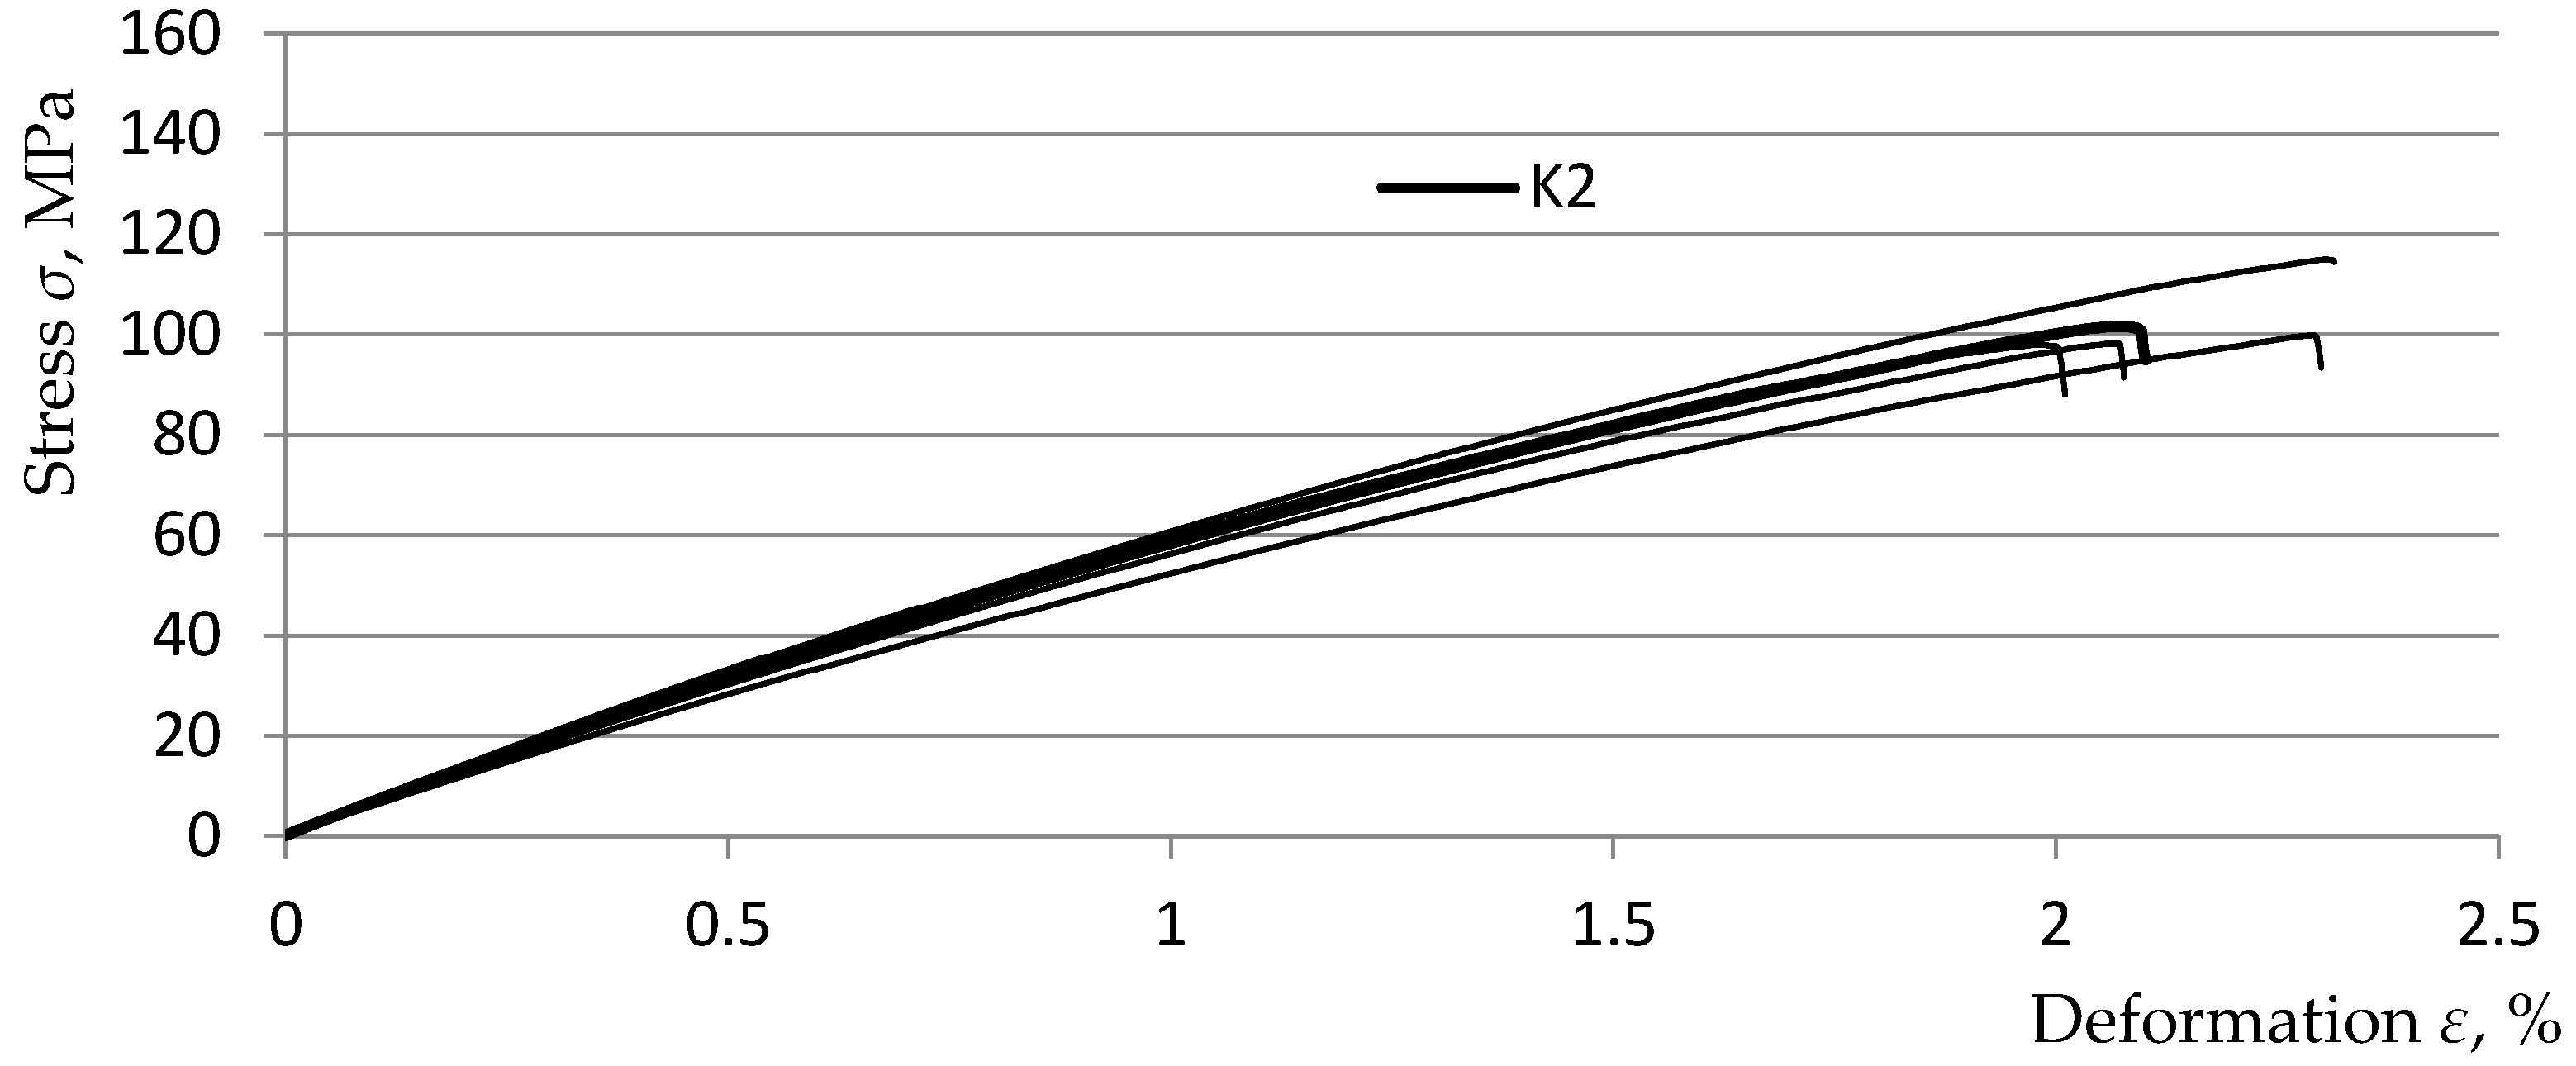
3.1. Test Results Obtained in a Static Tensile Test
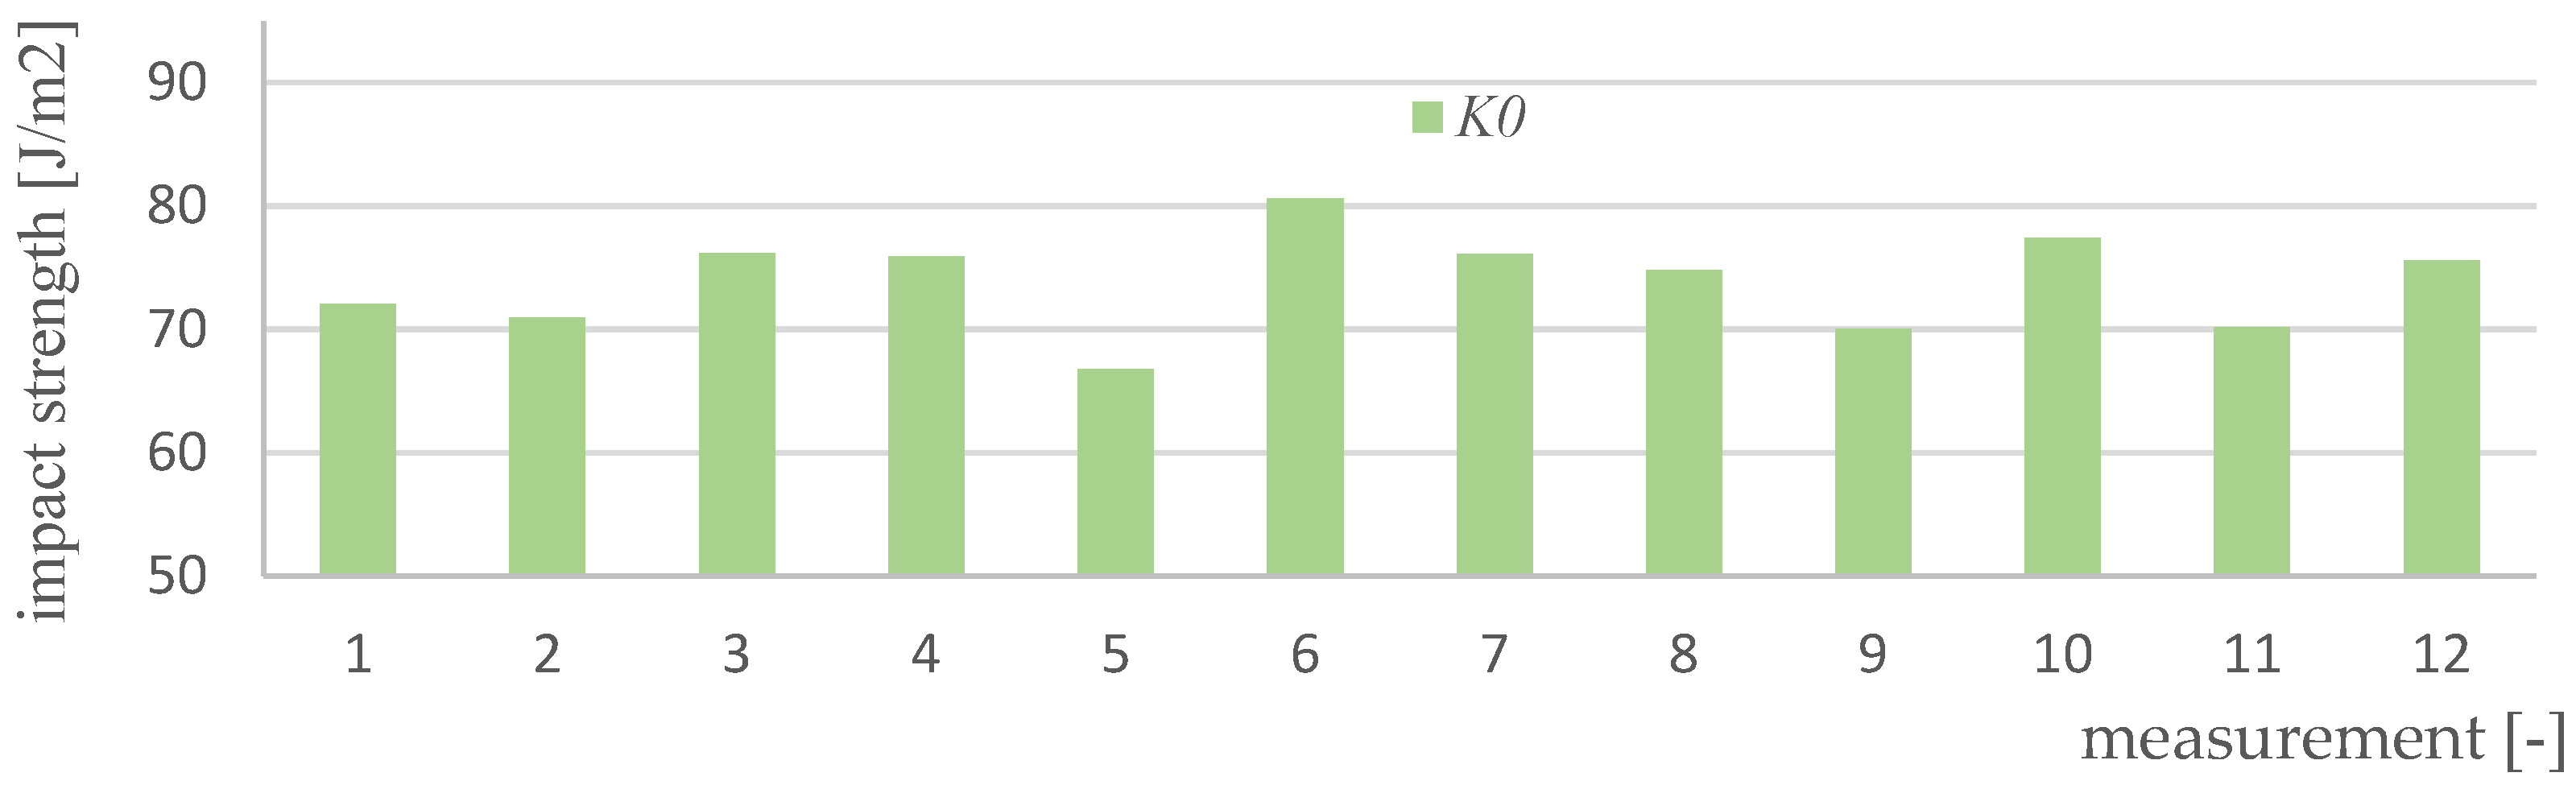
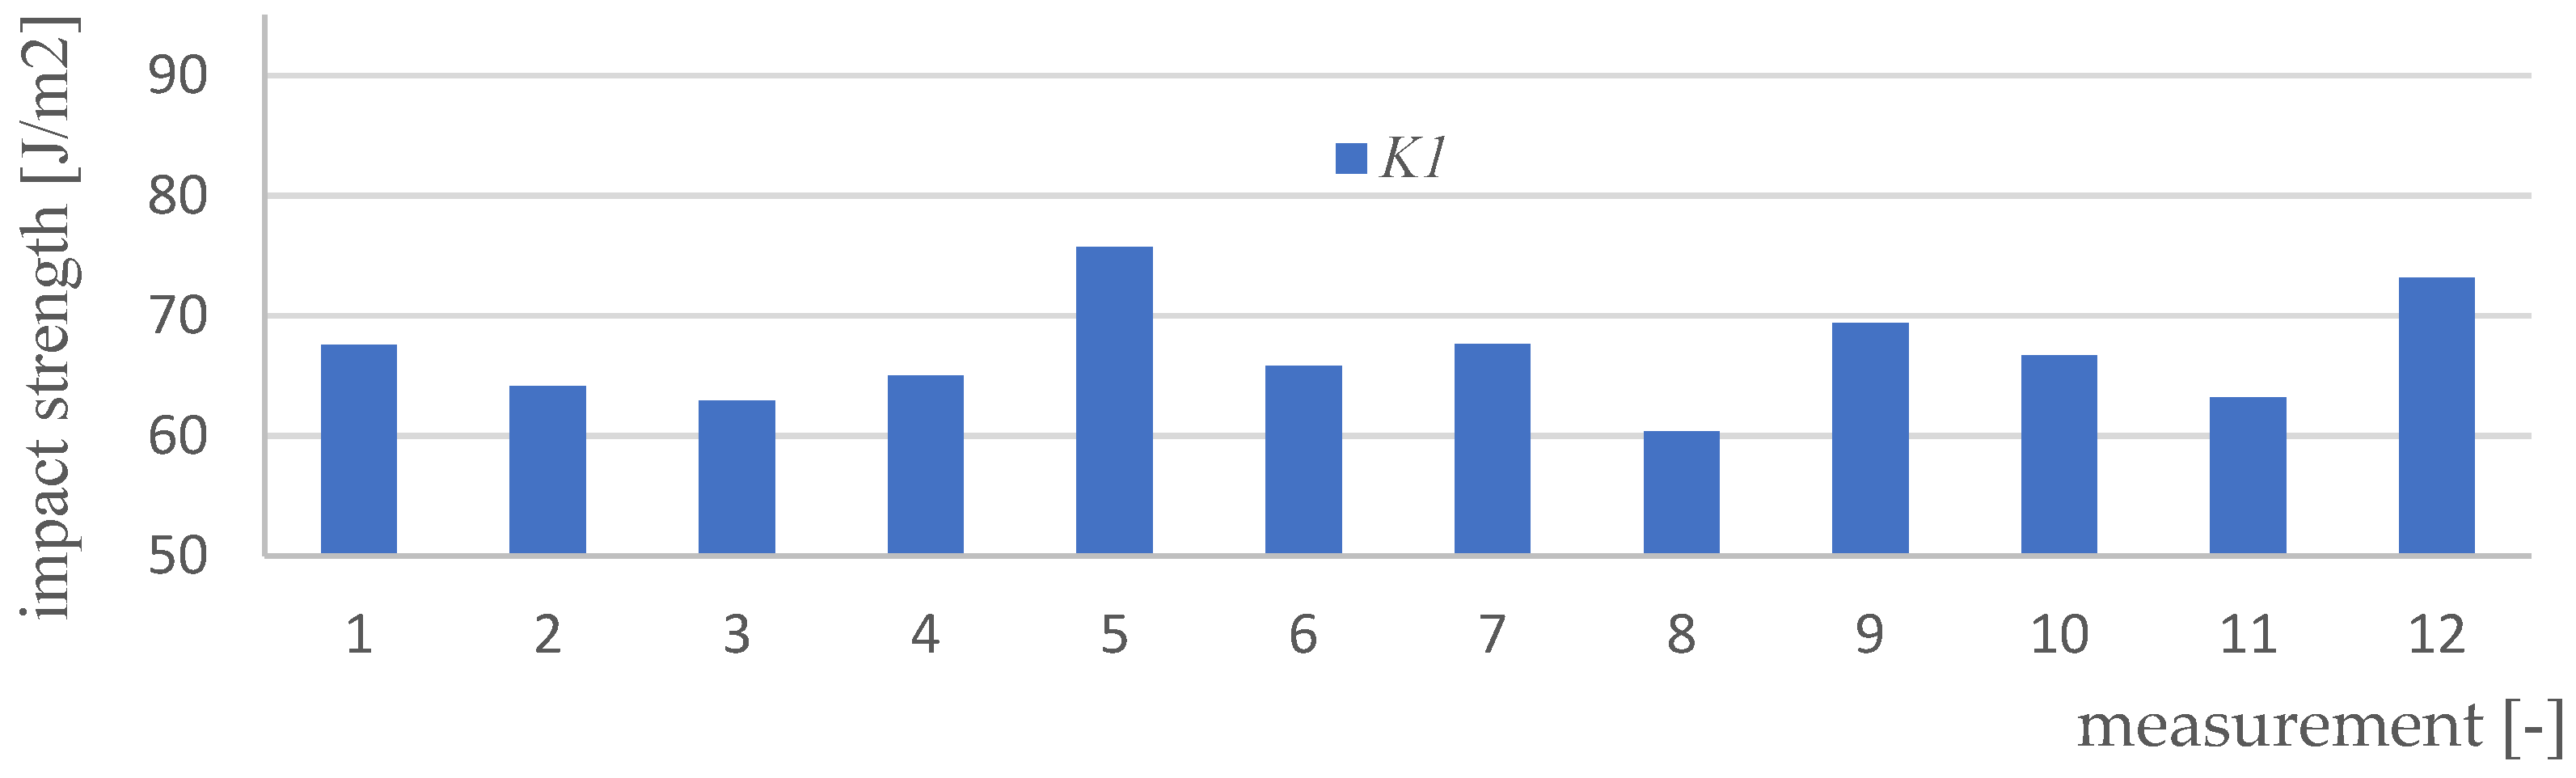
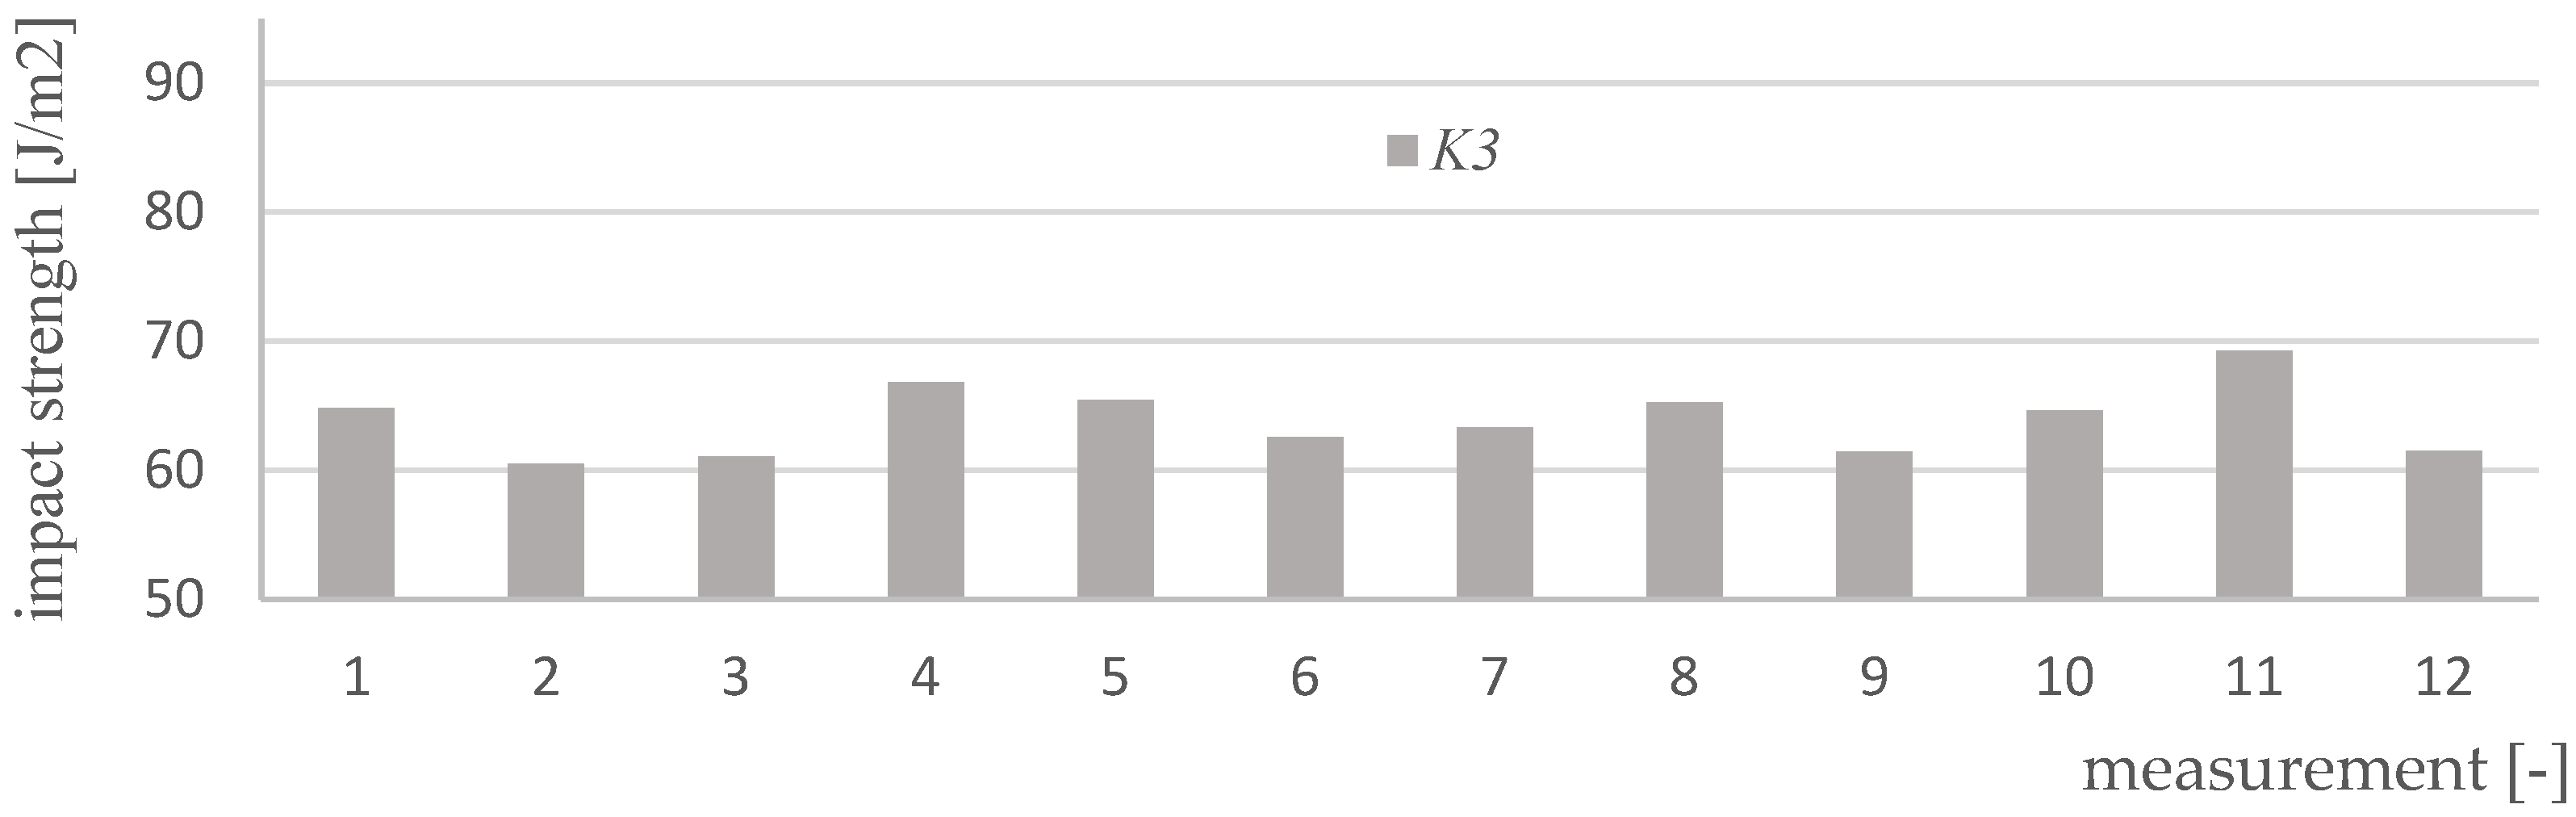
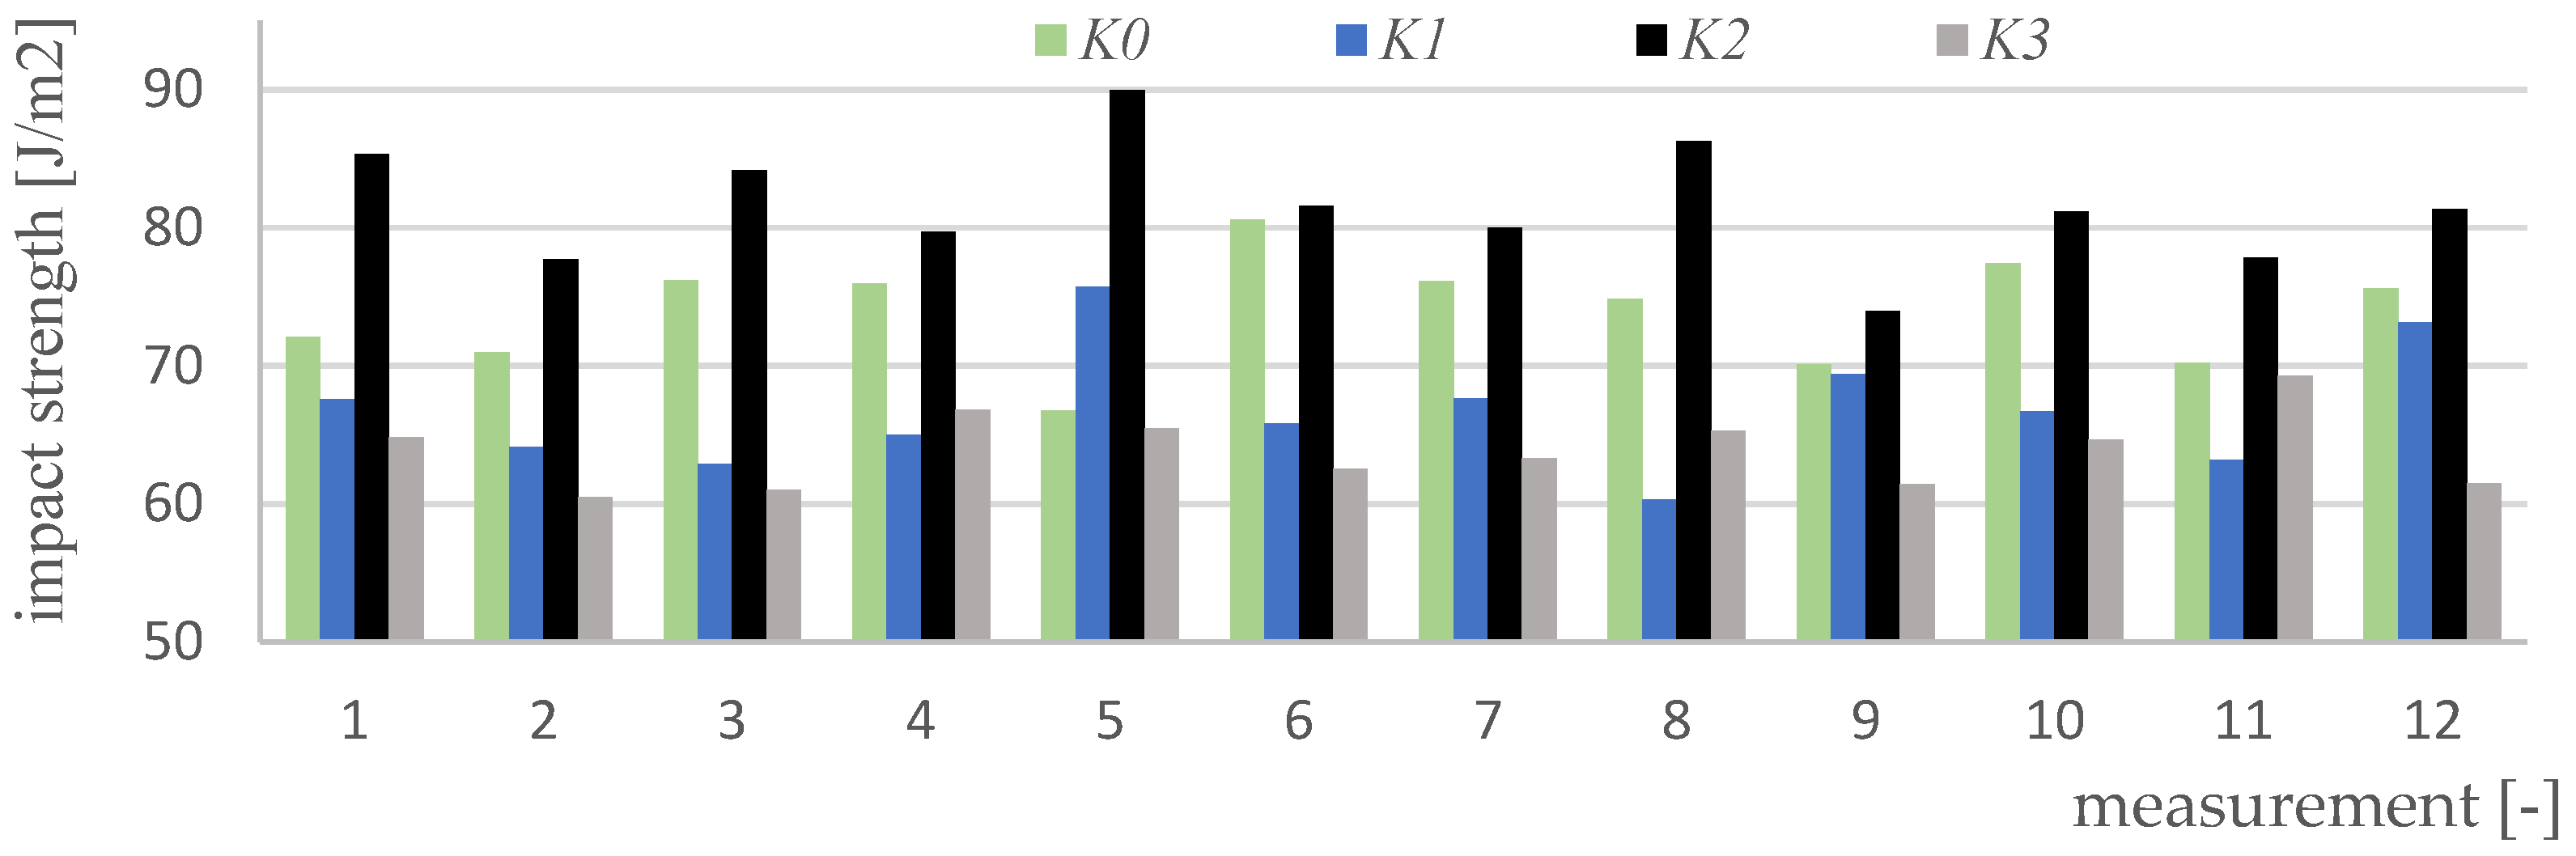
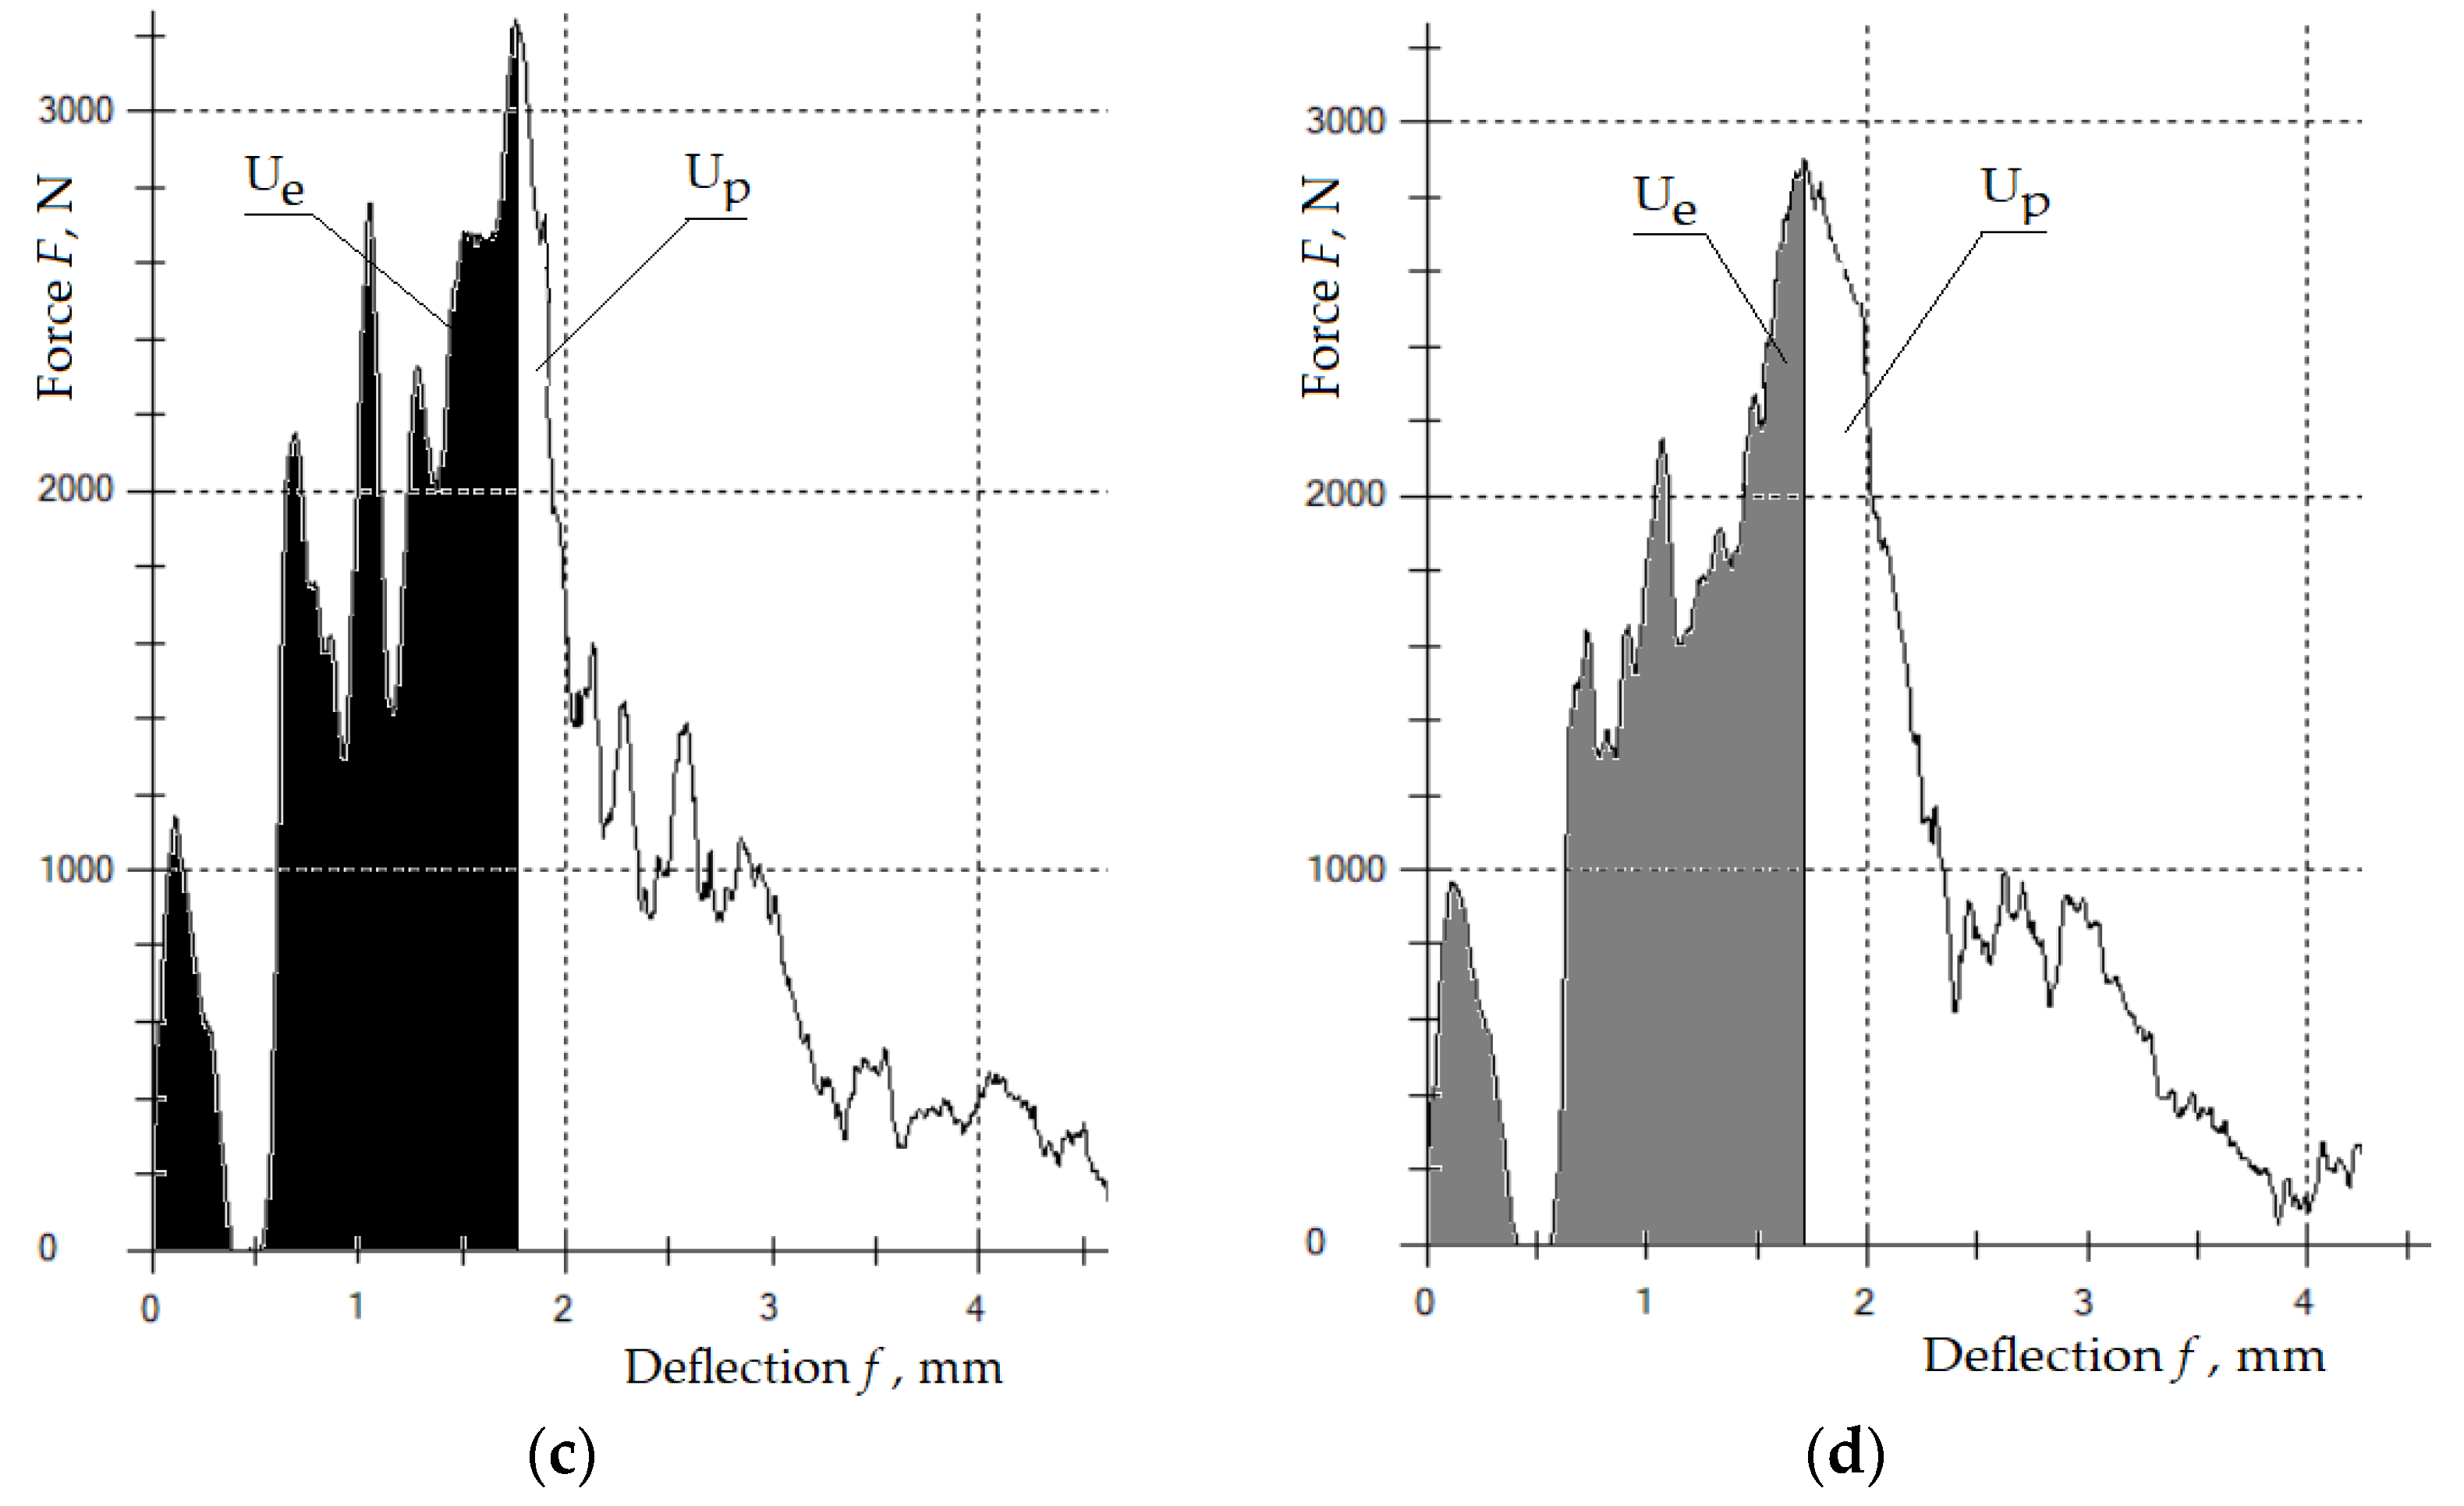
3.2. Test Results Obtained in the Impact Test
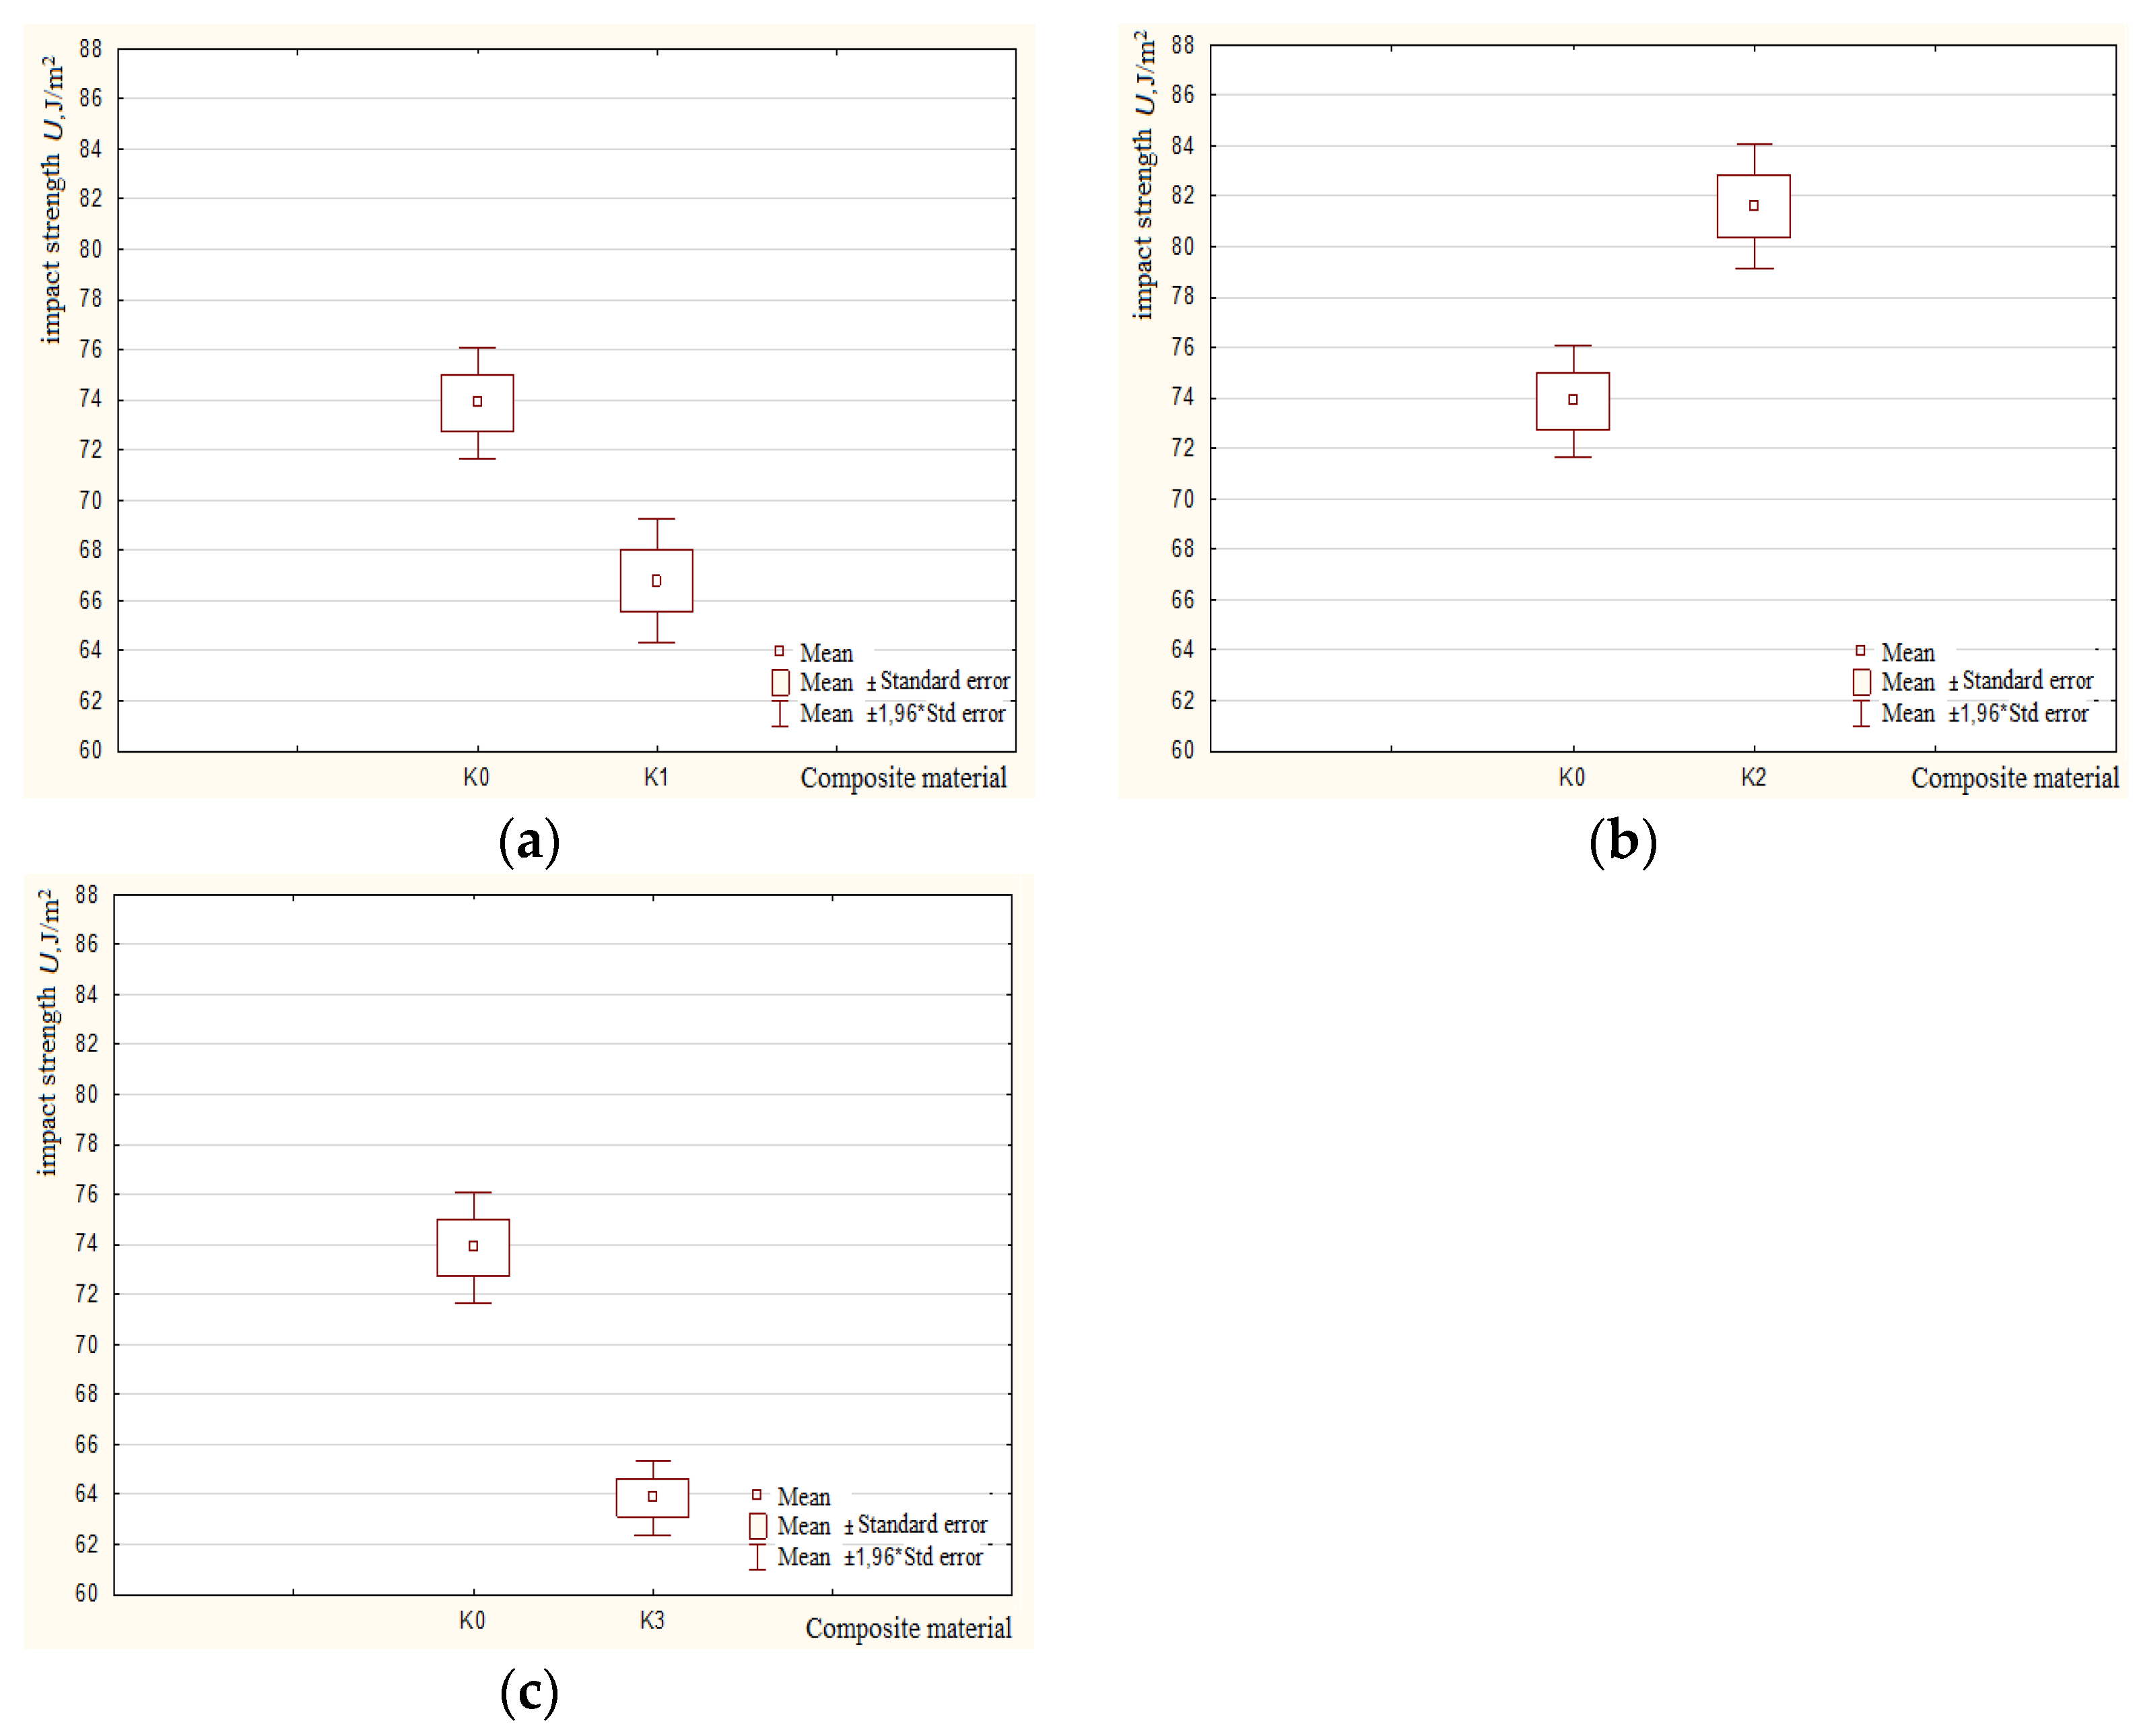
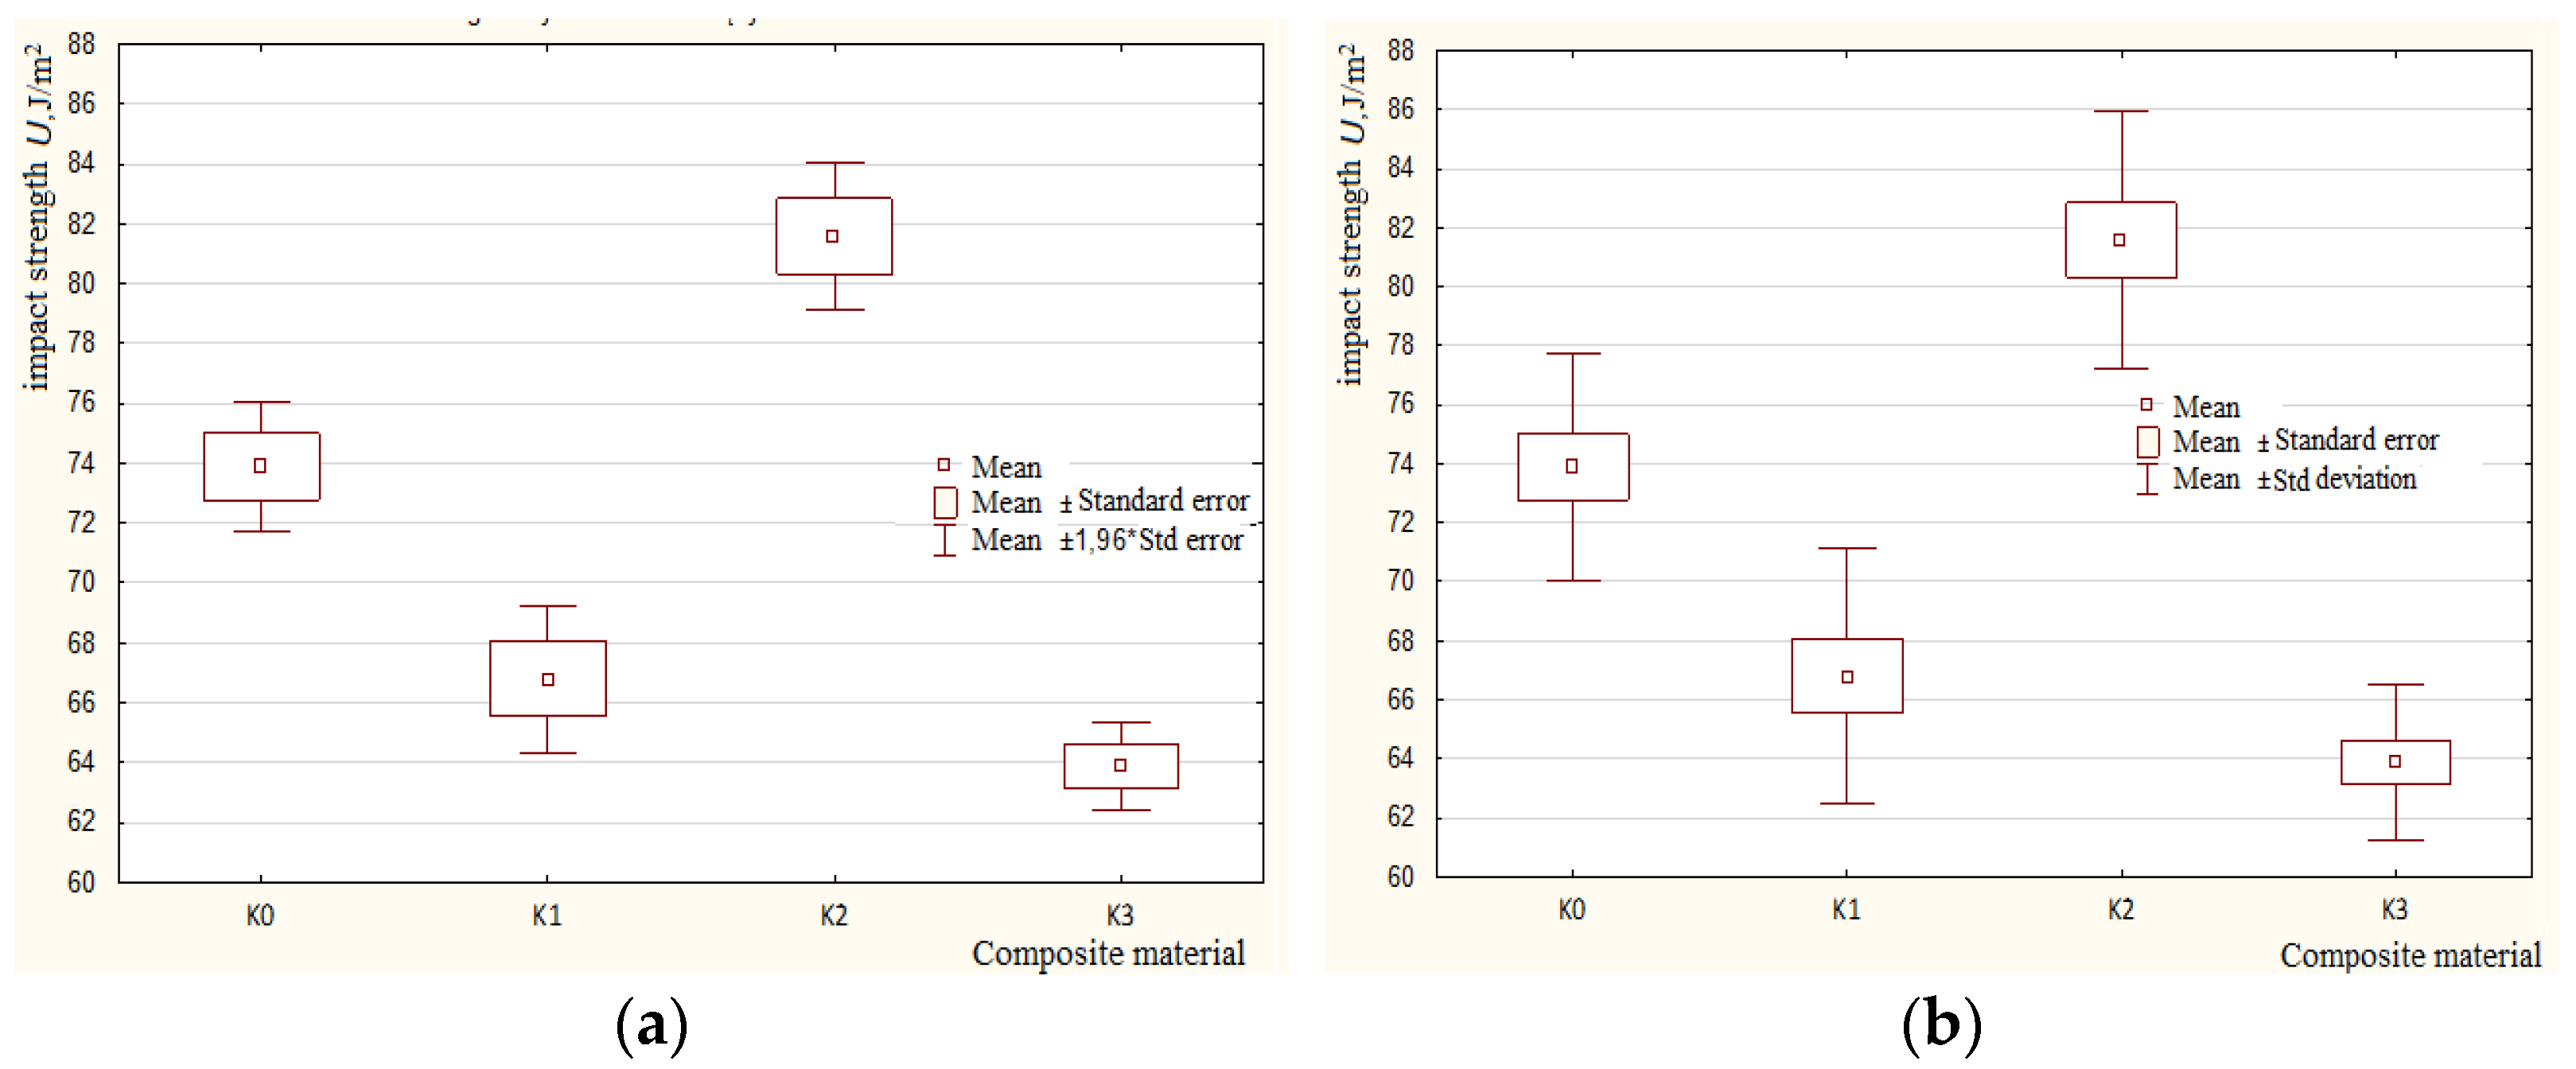
Statistical Analysis of the Obtained Results of Impact Strength Measurements
- Testing the normality of distributions with Shapiro–Wilk test
- Testing differences between pairs
- ANOVA difference testing
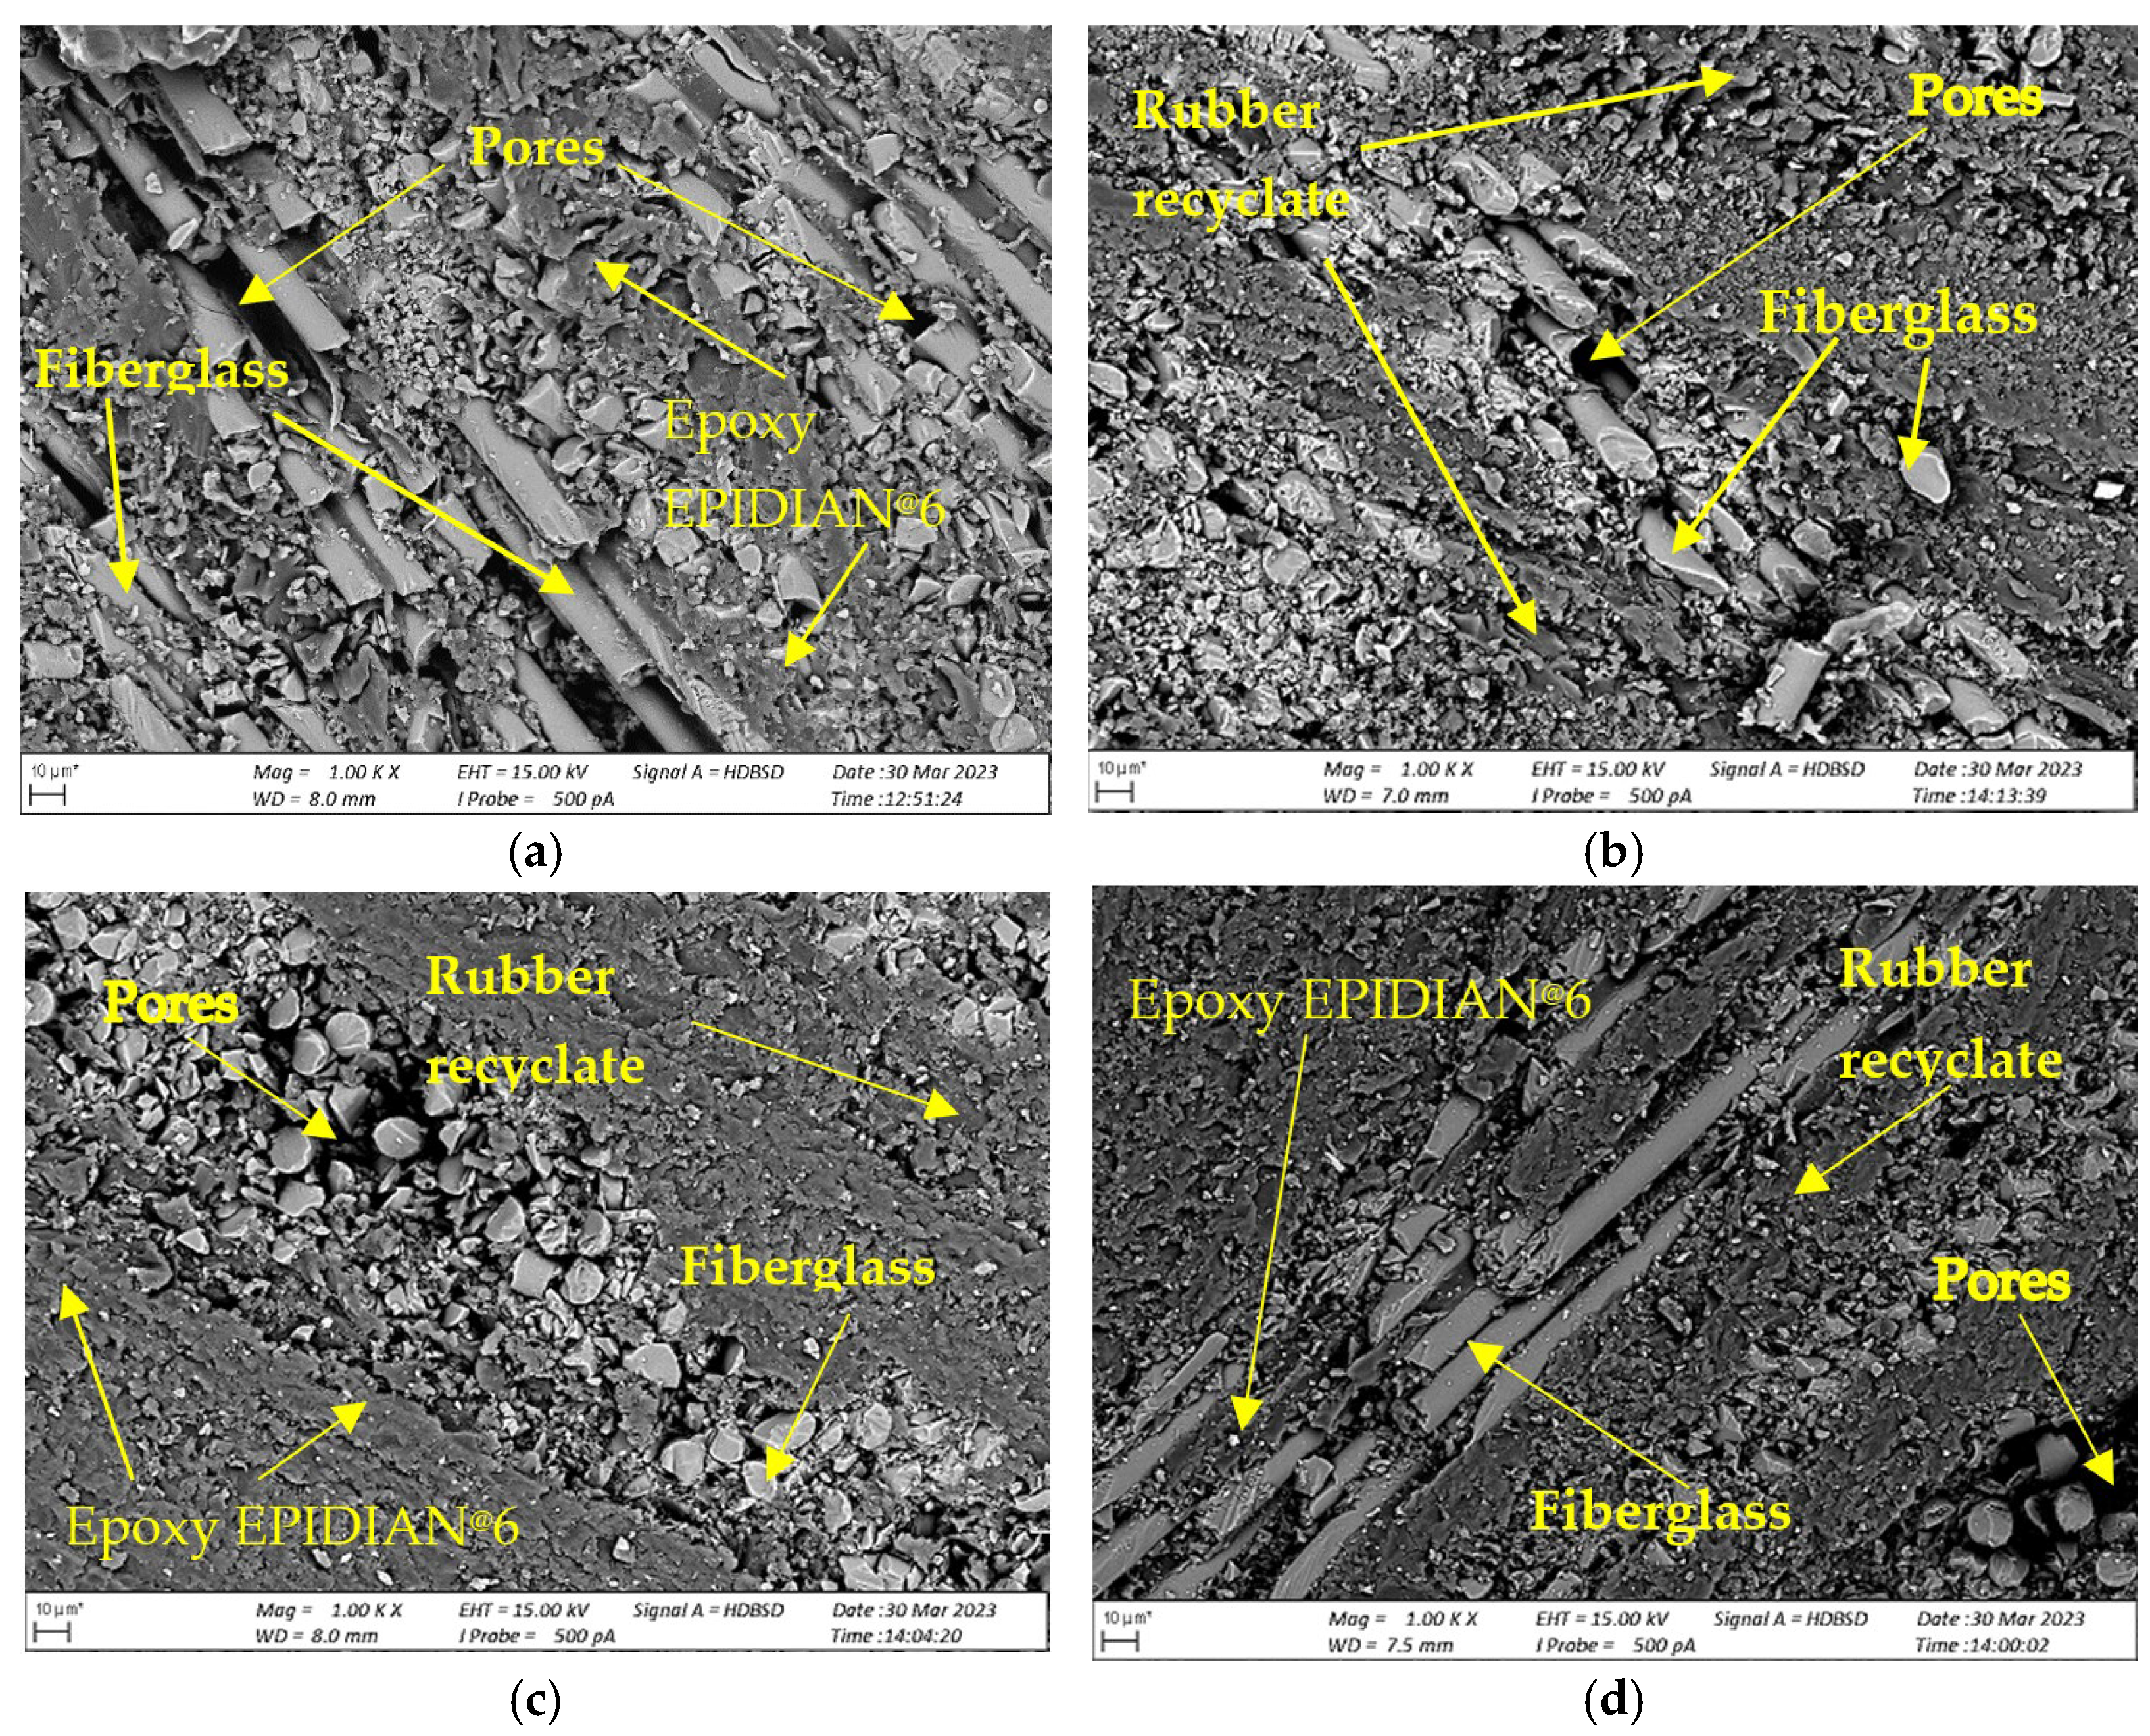
3.3. Measurements Using the SEM Electron Microscope
4. Conclusions
Author Contributions
Funding
Institutional Review Board Statement
Data Availability Statement
Conflicts of Interest
References
- Skrzyniarz, M. The life cycle of rubber waste on the example of used car tires. Mater. Manag. Logist. 2020, 9, 44–52. [Google Scholar]
- Olawińska-Wypych, J. Possibilities of thermal processing of rubber waste. Mater. Manag. Logist. 2021, 7, 33–41. [Google Scholar] [CrossRef]
- Meddah, A.; Laoubi, H.; Bederina, M. Effectiveness of using rubber waste as aggregates for improving thermal performance of plaster-based composites. Innov. Infrastruct. Solut. 2020, 5, 61. [Google Scholar] [CrossRef]
- Bala, A.; Gupta, S. Thermal resistivity, sound absorption and vibration damping of concrete composite doped with waste tire Rubber: A review. Constr. Build. Mater. 2021, 299, 123939. [Google Scholar] [CrossRef]
- Tian, X.; Zhuang, Q.; Han, S.; Li, S.; Liu, H.; Li, L.; Zhang, J.; Wang, C.; Bian, H. A novel approach of reapplication of carbon black recovered from waste tyre pyrolysis to rubber composites. J. Clean. Prod. 2021, 280, 124460. [Google Scholar] [CrossRef]
- Dębska, B.; Lichołai, L.; Miąsik, P. Assessment of the Applicability of Sustainable Epoxy Composites Containing Waste Rubber Aggregates in Buildings. Buildings 2019, 9, 31. [Google Scholar] [CrossRef] [Green Version]
- Zhang, Y.; Zhang, Z.; Wemyss, A.M.; Wan, C.; Liu, Y.; Song, P.; Wang, S. Effective thermal-oxidative reclamation of waste tire rubbers for producing high-performance rubber composites. ACS Sustain. Chem. Eng. 2020, 8, 9079–9087. [Google Scholar] [CrossRef]
- Khui, P.L.N.; Rahman, M.R.; Matin, M.M.; Bakri, M.K.B. Recycled rubber waste plastic and its composites. In Recycled Plastic Biocomposite; Elsevier: Amsterdam, The Netherlands, 2022; pp. 147–163. [Google Scholar]
- Chittella, H.; Yoon, L.W.; Ramarad, S.; Lai, Z.W. Rubber waste management: A review on methods, mechanism, and prospects. Polym. Degrad. Stab. 2021, 194, 109761. [Google Scholar] [CrossRef]
- Ghasemzadeh, Z.; Sadeghieh, A.; Shishebori, D. A stochastic multi-objective closed-loop global supply chain concerning waste management: A case study of the tire industry. Environ. Dev. Sustain. 2021, 23, 5794–5821. [Google Scholar] [CrossRef]
- Indraratna, B.; Qi, Y.; Ngo, T.N.; Rujikiatkamjorn, C.; Neville, T.; Ferreira, F.B.; Shahkolahi, A. Use of geogrids and recycled rubber in railroad infrastructure for enhanced performance. Geosciences 2019, 9, 30. [Google Scholar] [CrossRef] [Green Version]
- Alyousef, R.; Ahmad, W.; Ahmad, A.; Aslam, F.; Joyklad, P.; Alabduljabbar, H. Potential use of recycled plastic and rubber aggregate in cementitious materials for sustainable construction: A review. J. Clean. Prod. 2021, 329, 129736. [Google Scholar] [CrossRef]
- Abdelmonem, A.; El-Feky, M.; Nasr, E.-S.A.; Kohail, M. Performance of high strength concrete containing recycled rubber. Constr. Build. Mater. 2019, 227, 116660. [Google Scholar] [CrossRef]
- Bowles, A.; Fowler, G.; O’Sullivan, C.; Parker, K. Sustainable rubber recycling from waste tyres by waterjet: A novel mechanistic and practical analysis. Sustain. Mater. Technol. 2020, 25, e00173. [Google Scholar] [CrossRef]
- Han, I.S.; Park, C.; Jeon, H.; Ahn, S.; Lee, H.G.; Yoo, J.; Yoo, Y. Polypropylene/polyolefin elastomer composites with enhanced impact strength: The effect of rubber domain size on toughness. J. Polym. Res. 2023, 30, 224. [Google Scholar] [CrossRef]
- Candau, N.; Albiter, N.L.; Rulduà, M.M. High added value rubber composites and thermoplastic elastomers as strategies to recycle wastes rubber. In Proceedings of the 11th EEIGM International Conference on Advanced Materials Research, Barcelona, Spain, 16–17 June 2022; Abstracts. Polytechnic University of Catalonia: Barcelona, Spain, 2022. [Google Scholar]
- Qian, Z.; Peng, Z. Reinforcing styrene-butadiene rubber composites by constructing multiple interaction between rubber and silica. Polym. Compos. 2019, 40, 1740–1747. [Google Scholar] [CrossRef]
- Siddika, A.; Al Mamun, M.A.; Alyousef, R.; Amran, Y.M.; Aslani, F.; Alabduljabbar, H. Properties and utilizations of waste tire rubber in concrete: A review. Constr. Build. Mater. 2019, 224, 711–731. [Google Scholar] [CrossRef]
- Wang, R.; He, X.; Li, Y. Evaluation of microcracks in the interfacial transition zone of recycled rubber concrete. Struct. Concr. 2019, 20, 1684–1694. [Google Scholar] [CrossRef]
- Nuzaimah, M.; Sapuan, S.; Nadlene, R.; Jawaid, M. Sodium hydroxide treatment of waste rubber crumb and its effects on properties of unsaturated polyester composites. Appl. Sci. 2020, 10, 3913. [Google Scholar] [CrossRef]
- Formela, K. Sustainable development of waste tires recycling technologies–recent advances, challenges and future trends. Adv. Ind. Eng. Polym. Res. 2021, 4, 209–222. [Google Scholar] [CrossRef]
- Mancel, V.; Čabalová, I.; Krilek, J.; Réh, R.; Zachar, M.; Jurczyková, T. Fire Resistance Evaluation of New Wooden Composites Containing Waste Rubber from Automobiles. Polymers 2022, 14, 4465. [Google Scholar] [CrossRef]
- Khodadadi, A.; Liaghat, G.; Bahramian, A.R.; Ahmadi, H.; Anani, Y.; Asemani, S.; Razmkhah, O. High velocity impact behavior of Kevlar/rubber and Kevlar/epoxy composites: A comparative study. Compos. Struct. 2019, 216, 159–167. [Google Scholar] [CrossRef] [Green Version]
- Jeyapragash, R.; Srinivasan, V.; Sathiyamurthy, S. Mechanical properties of natural fiber/particulate reinforced epoxy composites–A review of the literature. Mater. Today Proc. 2020, 22, 1223–1227. [Google Scholar] [CrossRef]
- Matykiewicz, D. Hybrid epoxy composites with both powder and fiber filler: A review of mechanical and thermomechanical properties. Materials 2020, 13, 1802. [Google Scholar] [CrossRef] [PubMed] [Green Version]
- Movahedifar, E.; Vahabi, H.; Saeb, M.R.; Thomas, S. Flame retardant epoxy composites on the road of innovation: An analysis with flame retardancy index for future development. Molecules 2019, 24, 3964. [Google Scholar] [CrossRef] [PubMed] [Green Version]
- Ogbonna, V.; Popoola, A.; Popoola, O.; Adeosun, S. A review on corrosion, mechanical, and electrical properties of glass fibre-reinforced epoxy composites for high-voltage insulator core rod applications: Challenges and recommendations. Polym. Bull. 2022, 79, 6857–6884. [Google Scholar] [CrossRef]
- Żuk, D.; Abramczyk, N.; Panasiuk, K. Analysis of strength parameters at tension of epoxy-glass composites with rubber recyclate addition. J. KONBiN 2022, 52, 131–150. [Google Scholar] [CrossRef]
- Abramczyk, S.D.N.; Żuk, D.; Dyl, T. Statistical methods in the analysis of strength parameters of epoxy-glass composites modified with rubber recyclate. J. Achiev. Mater. Manuf. Eng. 2023, 117, 71–78. [Google Scholar] [CrossRef]
- Charchalis, A.; Kneć, M.; Żuk, D.; Abramczyk, N. Use of 3D Optical Techniques in the Analysis of the Effect of Adding Rubber Recyclate to the Matrix on Selected Strength Parameters of Epoxy–Glass Composites. Mech. Autom. J. 2023, 17, 333–346. [Google Scholar] [CrossRef]
- Abramczyk, N.; Żuk, D.; Panasiuk, K.; Dyl, T. Influence of the type of layered distribution of rubber recyclate as an additive modifying the mechanical properties of epoxy-glass composites. Arch. Mater. Sci. Eng. 2020, 118, 81–86. [Google Scholar] [CrossRef]
- EPIDIAN 6. Available online: https://www.zywicasklep.pl/epidian-reg-6-v-1-kg (accessed on 3 May 2023).
- Hardener Z-1. Available online: https://c-l.pl/hardener-z-1/ (accessed on 3 May 2023).
- Available online: https://orzelsa.com/wp-content/uploads/2020/10/Karta-techniczna-1-3-mm.pdf (accessed on 3 May 2023).


| Country | The Number of Residents, Million | Number of Cars/ 1000 Inhabitants | Tire Wear, Thousands of Tons/Year |
|---|---|---|---|
| France | 58 | 419 | 354 |
| Germany | 81 | 399 | 603 |
| Italy | 58 | 520 | 330 |
| Anglia | 58 | 379 | 378 |
| Spain | 39 | 321 | 202 |
| Sweden | 8.7 | 213 | 119 |
| Poland | 38.7 | 213 | 119 |
| Year | Tire Production, Thousands | Number of Tires Entered for the Polish Market, Thousands of Tons | Recycled Tires, Thousands of Tons |
|---|---|---|---|
| 2015 | 46.715 | 222.2 | 175.3 |
| 2016 | 47.284 | 244.7 | 192.0 |
| 2017 | 46.271 | 281.1 | 211.8 |
| Parameter | Unit | Value |
|---|---|---|
| Epoxy number | [Mol/100 g] | 0.510–0.540 |
| Density at 25 °C | [g/cm3] | 1.17 |
| Viscosity at 25 °C | [mPa s] | 1000–1500 |
| Gel time 100 g in 20 °C | [min] | 20 |
| Curing time in 20 °C | [days] | 7 |
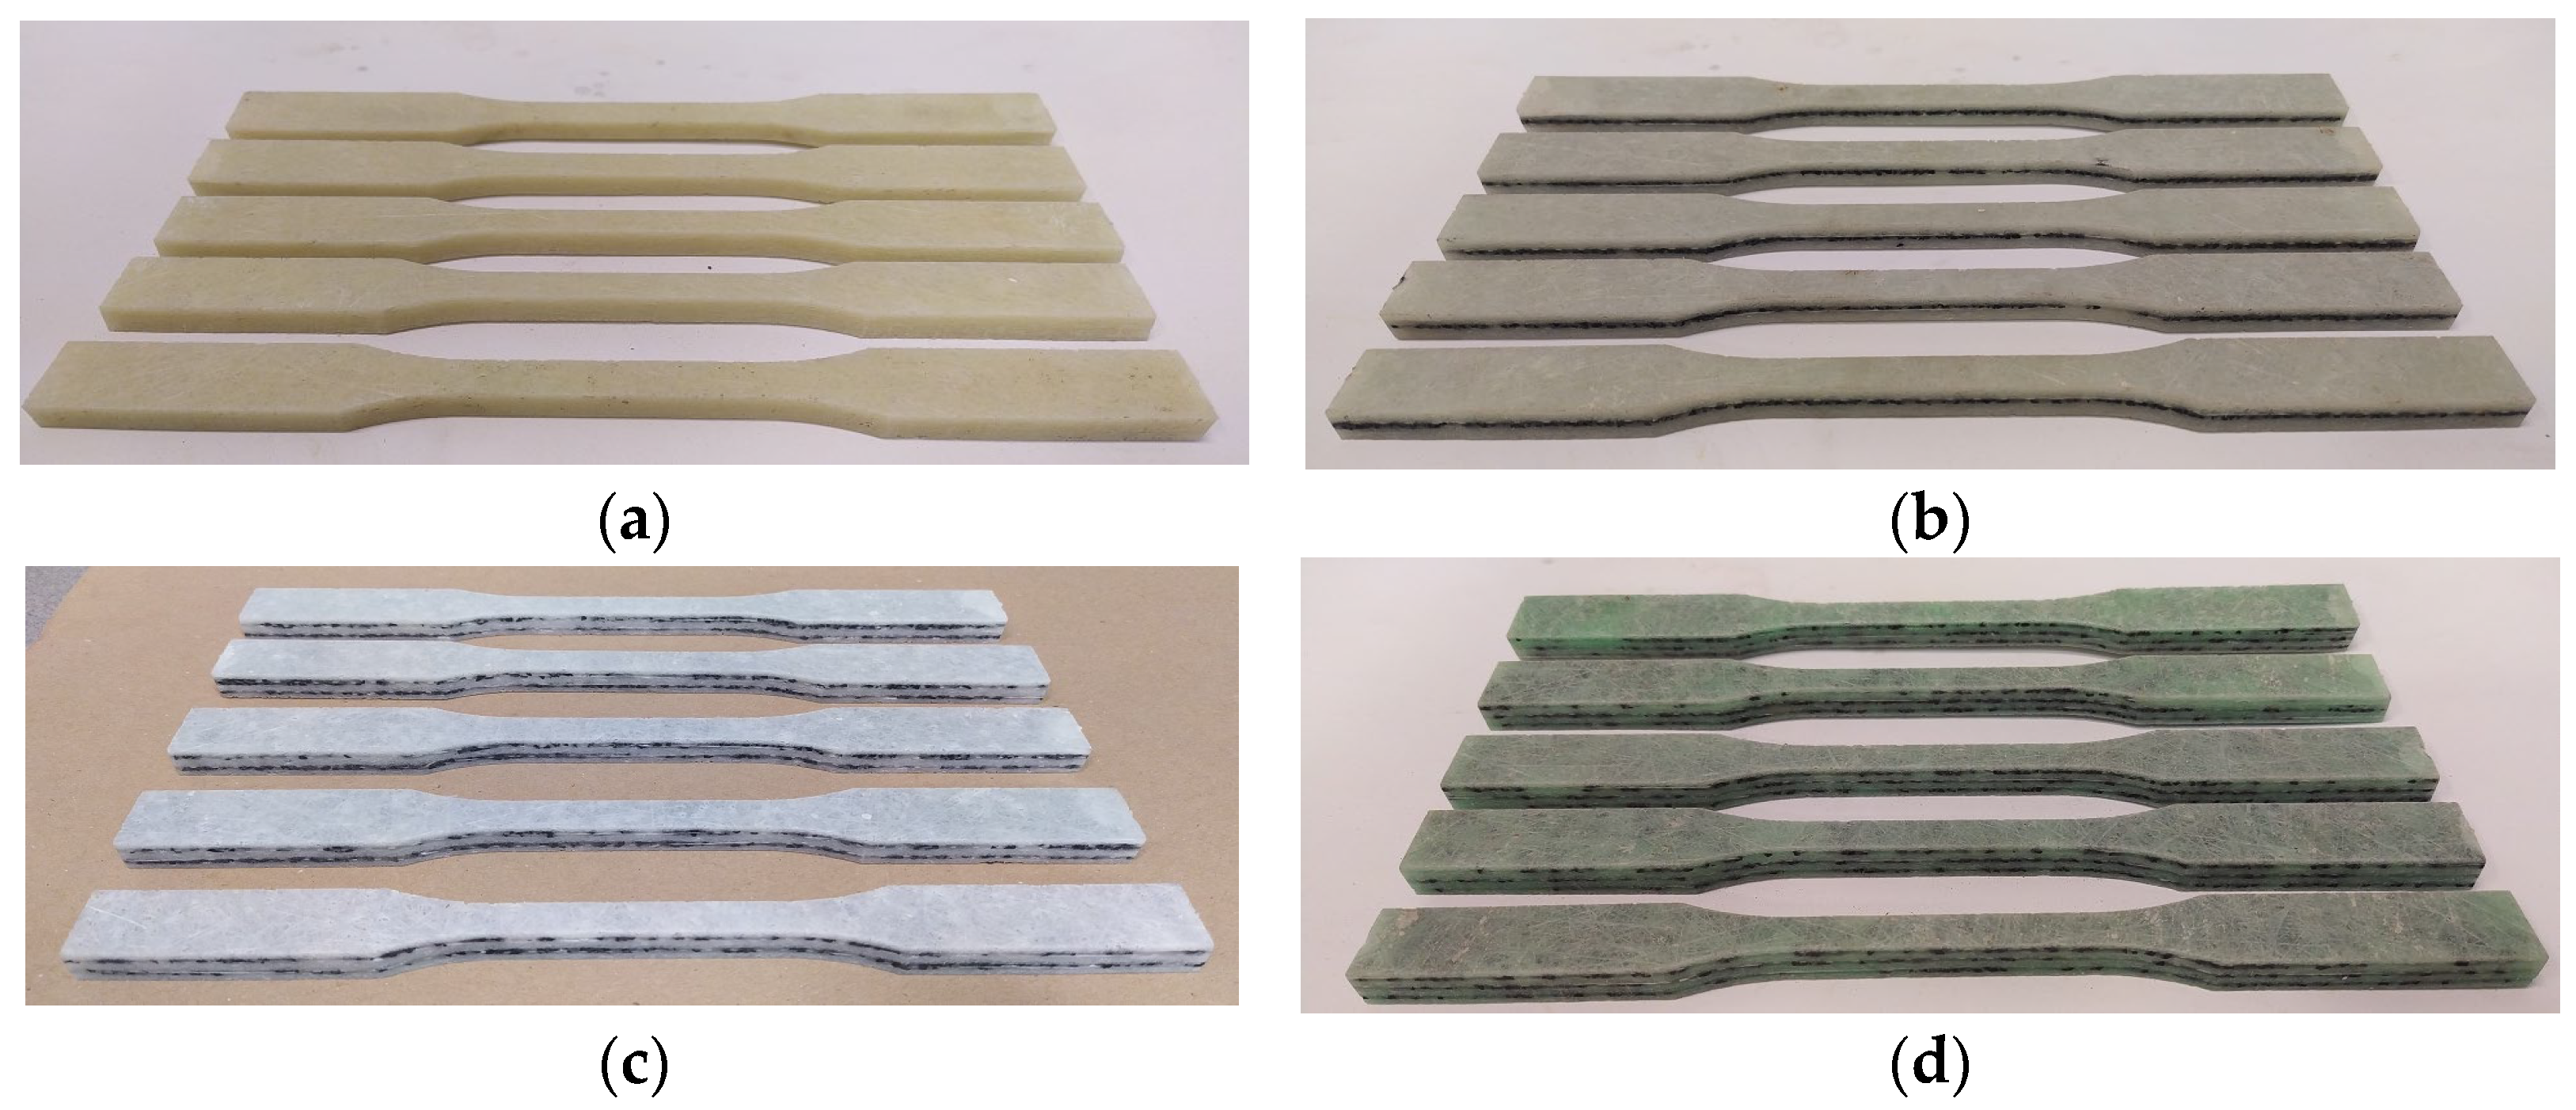
| Composite | Composition Description |
|---|---|
| K0 | 12 layers of glass mat soaked with epoxy resin, without the addition of rubber recyclate. |
| K1 | 12 layers of glass mat soaked with epoxy resin. Rubber recyclate is added to the composite in the amount of 5% of the total weight of the composite as 1 interlayer layer, between the 6th and 7th layer of the glass mat. |
| K2 | 12 layers of glass mat soaked with epoxy resin. Rubber recyclate is added to the composite in the amount of 5% of the total weight of the composite as 2 interlayer layers, between the 4th and 5th and the 8th and 9th layers of the glass mat. |
| K3 | 12 layers of glass mat soaked with epoxy resin. Rubber recyclate is added to the composite in the amount of 5% of the total weight of the composite as 3 interlayers, between the 3rd and 4th, 6th and 7th, and 9th and 10th layers of the glass mat. |
| Composite | Mat Layers | Resin Content, % | Glass Mat Content, % | Number of Layers of Rubber Recyclate | Recyclate Content, % |
|---|---|---|---|---|---|
| K0 | 12 | 60% | 40% | 0 | 0% |
| K1 | 12 | 60% | 35% | 1 | 5% |
| K2 | 12 | 60% | 35% | 2 | 5% |
| K3 | 12 | 60% | 35% | 3 | 5% |
| Material | σm [MPa] | ε [%] | E [MPa] |
|---|---|---|---|
| K0 | 136 | 1.95 | 8742 |
| K1 | 111 | 1.97 | 7965 |
| K2 | 110 | 2.30 | 6426 |
| K3 | 99 | 2.13 | 6185 |
| Material | σm [MPa] | ε [%] | E [MPa] |
|---|---|---|---|
| K1 | −18.4 | 1.0 | −8.9 |
| K2 | −19.1 | 17.9 | −26.5 |
| K3 | −27.2 | 9.2 | −29.2 |
| Material | K0 | K1 | K2 | K3 |
|---|---|---|---|---|
| Impact strength, U, J/m2 | 72 | 68 | 85 | 65 |
| 71 | 64 | 78 | 60 | |
| 76 | 63 | 84 | 61 | |
| 76 | 65 | 80 | 67 | |
| 67 | 76 | 90 | 65 | |
| 81 | 66 | 82 | 63 | |
| 76 | 68 | 80 | 63 | |
| 75 | 60 | 86 | 65 | |
| 70 | 69 | 74 | 61 | |
| 77 | 67 | 81 | 65 | |
| 70 | 63 | 78 | 69 | |
| 76 | 73 | 81 | 62 | |
| Mean | 74 | 67 | 82 | 64 |
| Composite/Parameter | FMAX [N] | f [mm] | W [J] | U [J/m2] |
|---|---|---|---|---|
| K0 | 2983 | 1.52 | 5.06 | 74 |
| K1 | 2774 | 1.85 | 4.82 | 67 |
| K2 | 3240 | 1.81 | 4.88 | 82 |
| K3 | 2889 | 1.67 | 5.56 | 64 |
| Sample Name | Value p |
|---|---|
| K0 | 0.730370 |
| K1 | 0.649216 |
| K2 | 0.986275 |
| K3 | 0.575654 |
| Pair of Variables | p-Value |
|---|---|
| K0&K1 | 0.004020 |
| K0&K2 | 0.000969 |
| K0&K3 | 0.000032 |
| Test NIR. P-Probabilities for Post Hoc Tests (2-Sided). | ||||
|---|---|---|---|---|
| Material | K0 | K1 | K2 | K3 |
| K0 | - | 0.000050 | 0.000014 | 0.000000 |
| K1 | 0.000050 | - | 0.000000 | 0.071445 |
| K2 | 0.000014 | 0.000000 | - | 0.000000 |
| K3 | 0.000000 | 0.071445 | 0.000000 | - |
Disclaimer/Publisher’s Note: The statements, opinions and data contained in all publications are solely those of the individual author(s) and contributor(s) and not of MDPI and/or the editor(s). MDPI and/or the editor(s) disclaim responsibility for any injury to people or property resulting from any ideas, methods, instructions or products referred to in the content. |
© 2023 by the authors. Licensee MDPI, Basel, Switzerland. This article is an open access article distributed under the terms and conditions of the Creative Commons Attribution (CC BY) license (https://creativecommons.org/licenses/by/4.0/).
Share and Cite
Żuk, D.; Abramczyk, N.; Charchalis, A. Analysis of the Impact of Rubber Recyclate Addition to the Matrix on the Strength Properties of Epoxy–Glass Composites. Polymers 2023, 15, 3374. https://doi.org/10.3390/polym15163374
Żuk D, Abramczyk N, Charchalis A. Analysis of the Impact of Rubber Recyclate Addition to the Matrix on the Strength Properties of Epoxy–Glass Composites. Polymers. 2023; 15(16):3374. https://doi.org/10.3390/polym15163374
Chicago/Turabian StyleŻuk, Daria, Norbert Abramczyk, and Adam Charchalis. 2023. "Analysis of the Impact of Rubber Recyclate Addition to the Matrix on the Strength Properties of Epoxy–Glass Composites" Polymers 15, no. 16: 3374. https://doi.org/10.3390/polym15163374