
Cohesion and Adhesion Performance of Tannin-Glyoxal Adhesives at Different Formulations and Hardener Types for Bonding Particleboard Made of Areca (Areca catechu) Leaf Sheath


 , , ,
, , ,  , ,
, ,  , ,
, ,
Abstract
:1. Introduction
2. Materials and Methods
2.1. Materials
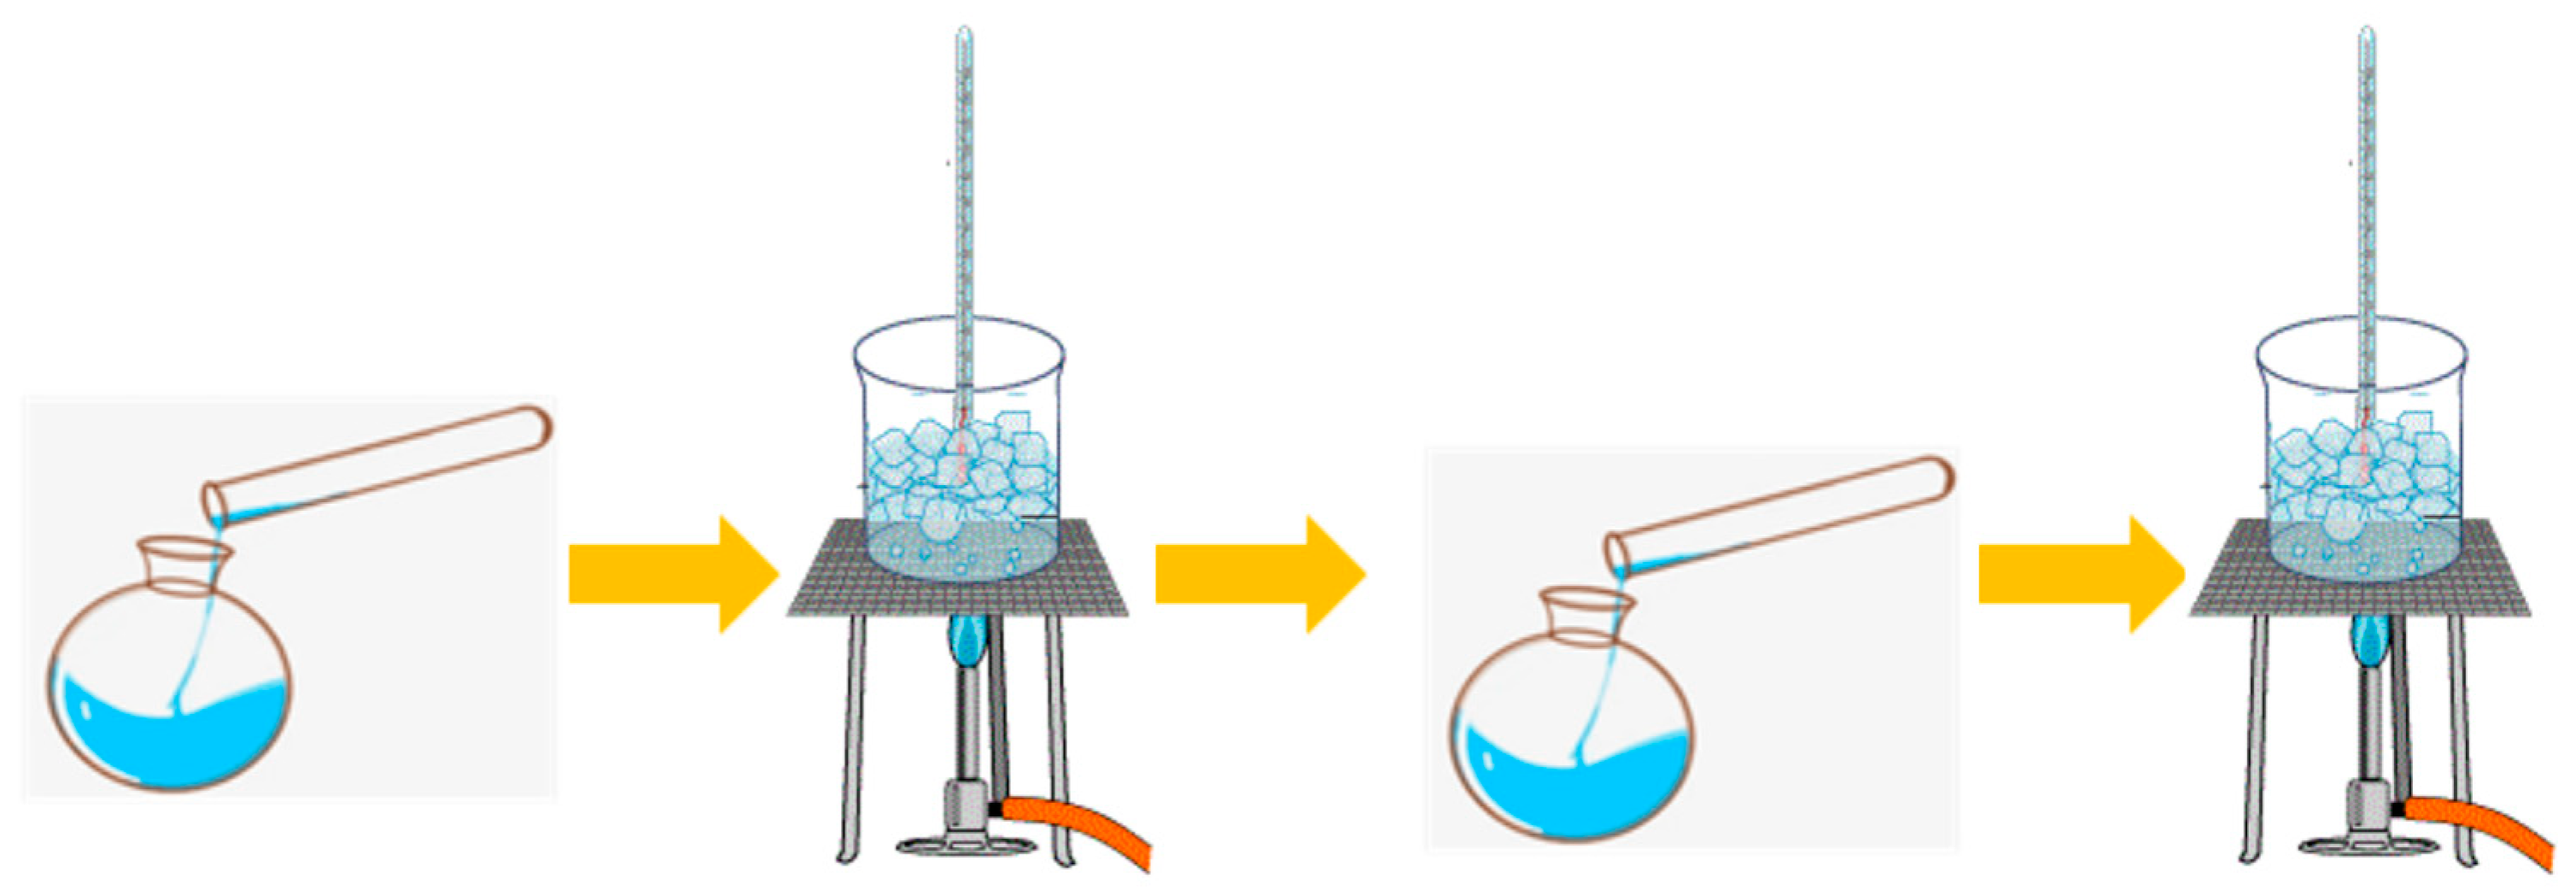
2.2. Preparation of Tannin Bark Extract
2.3. Manufacture of TG Adhesive
2.4. Characterization of TG Adhesive
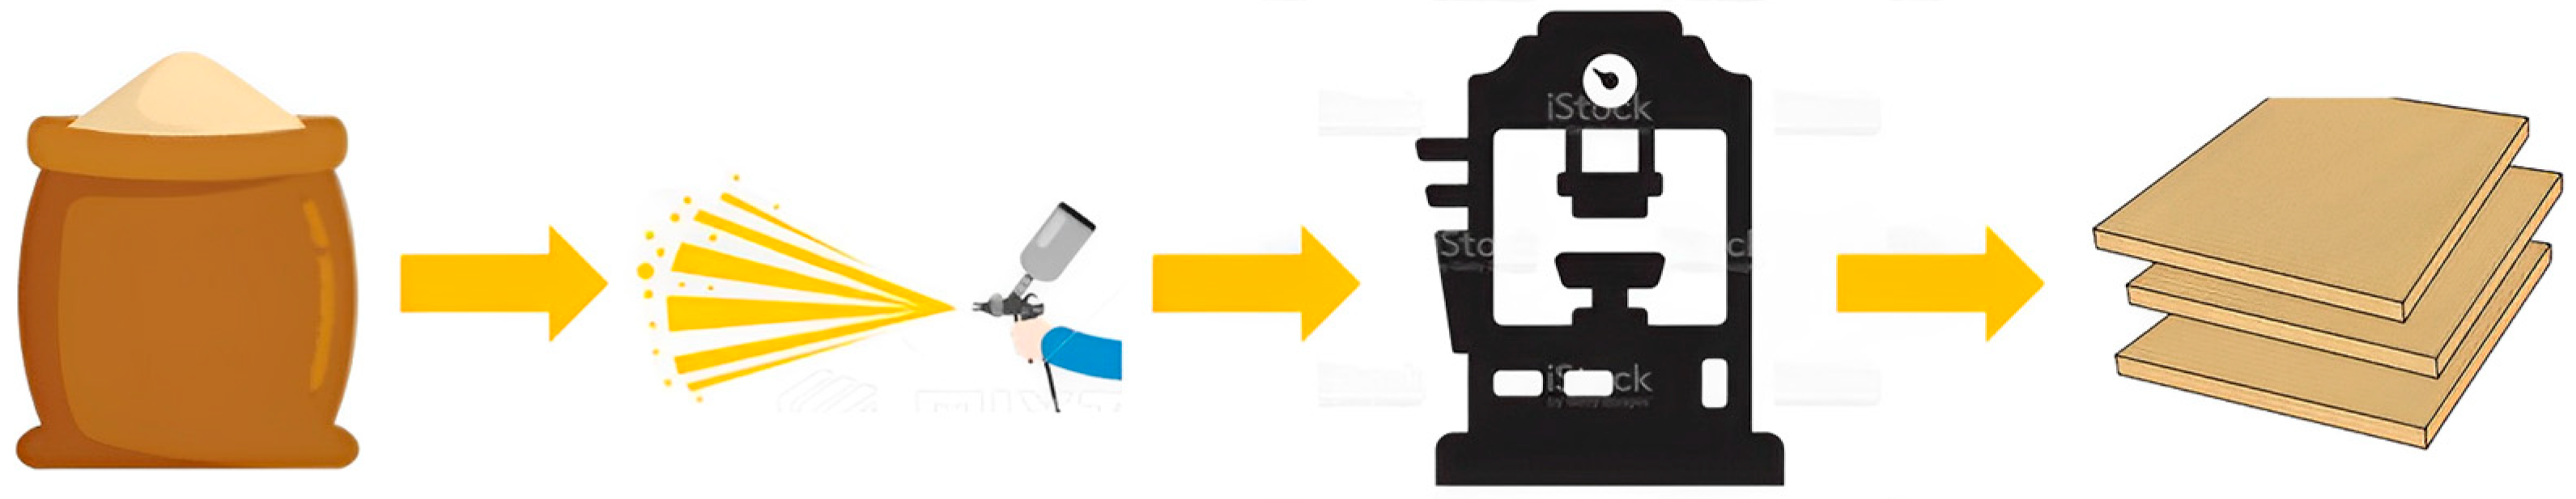
2.5. Particleboard Preparation and Its Properties
2.6. Statistical Analysis
3. Results and Discussion
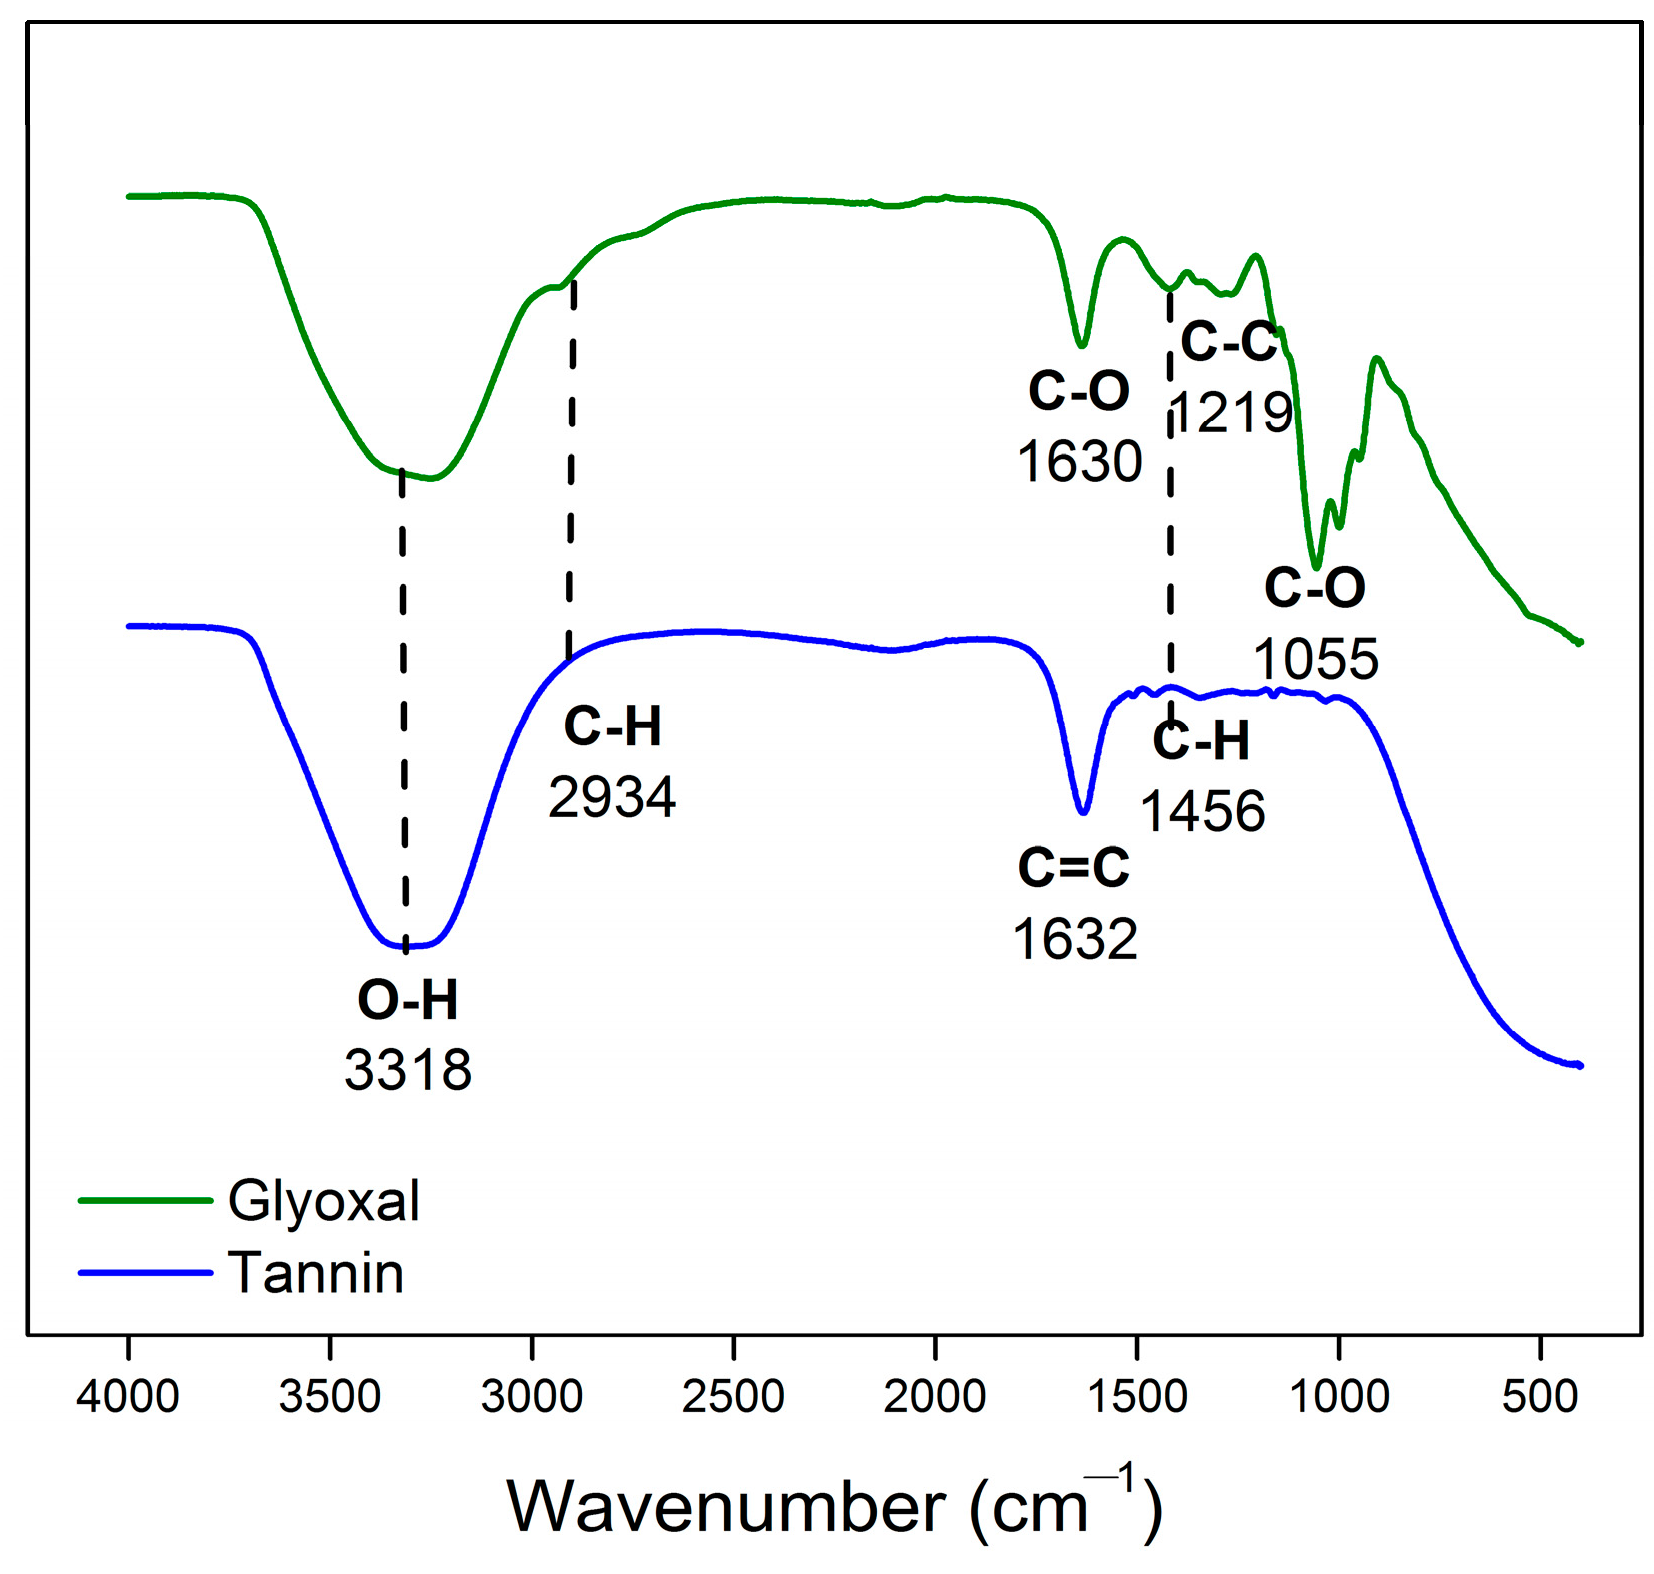
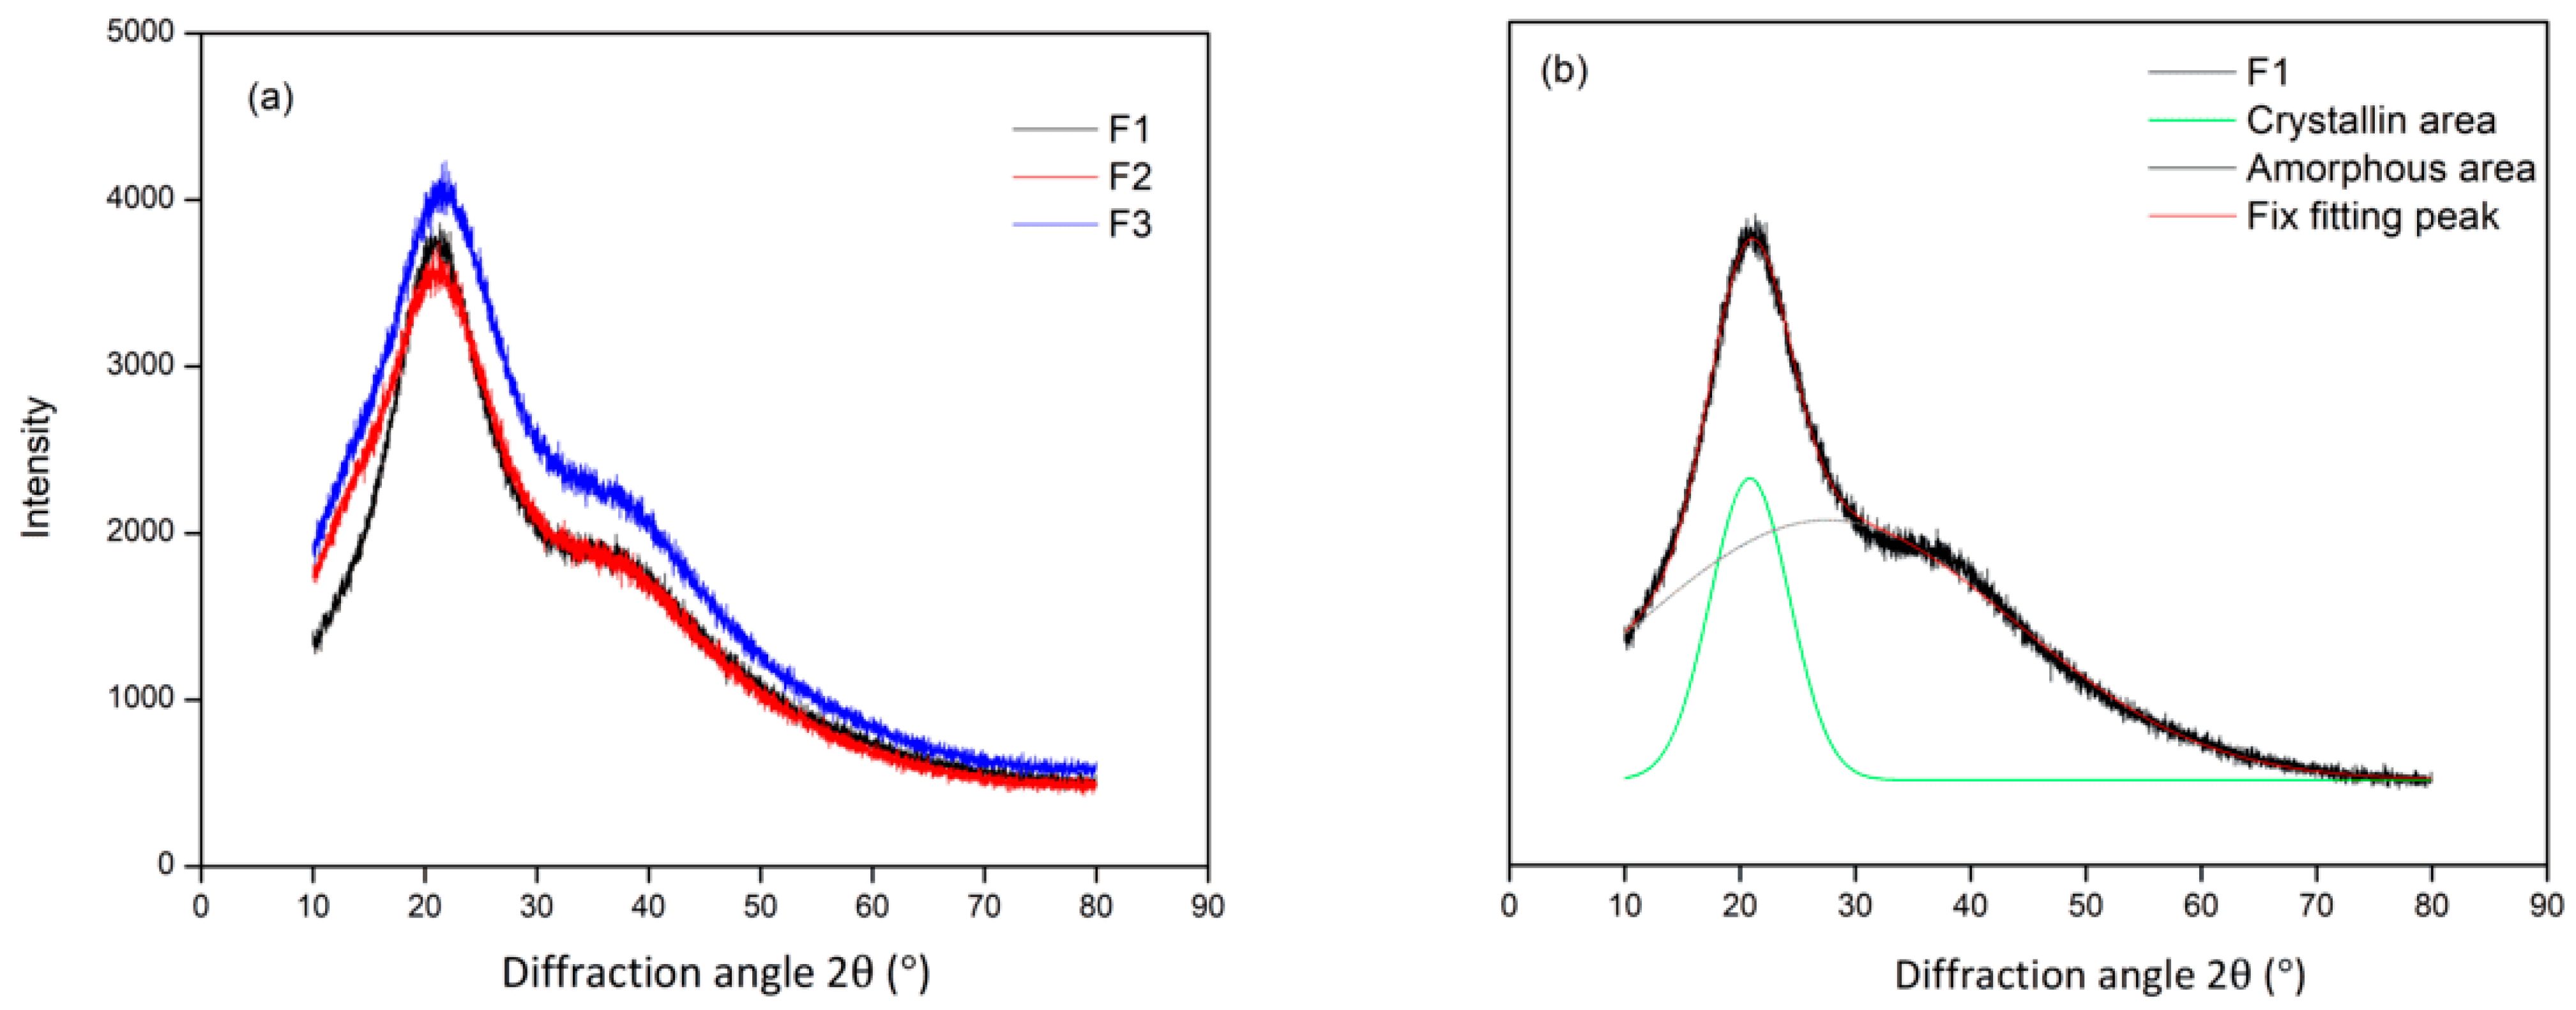
3.1. Characterization of Tannin Obtained from Acacia mangium Bark
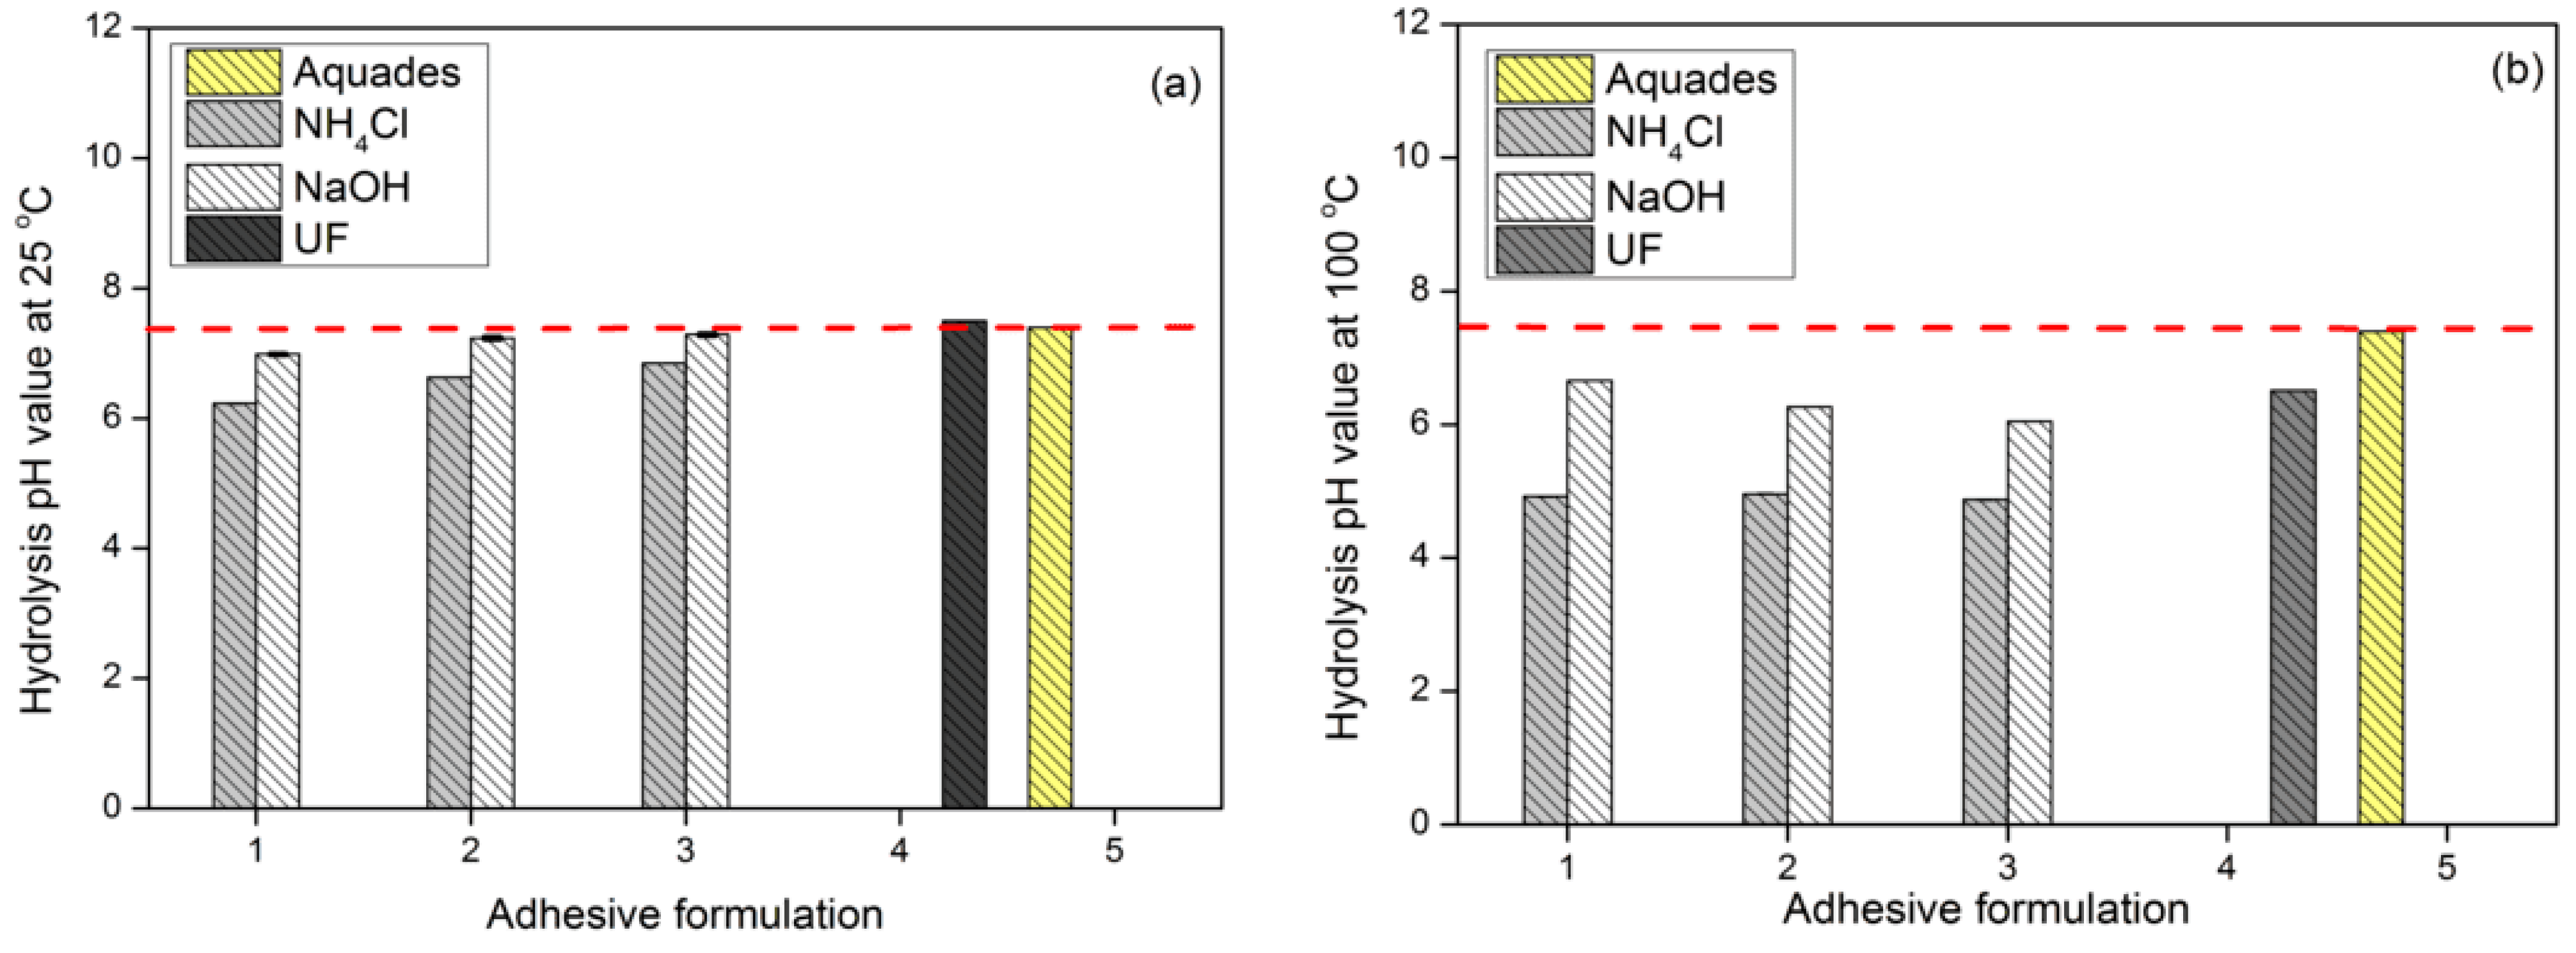
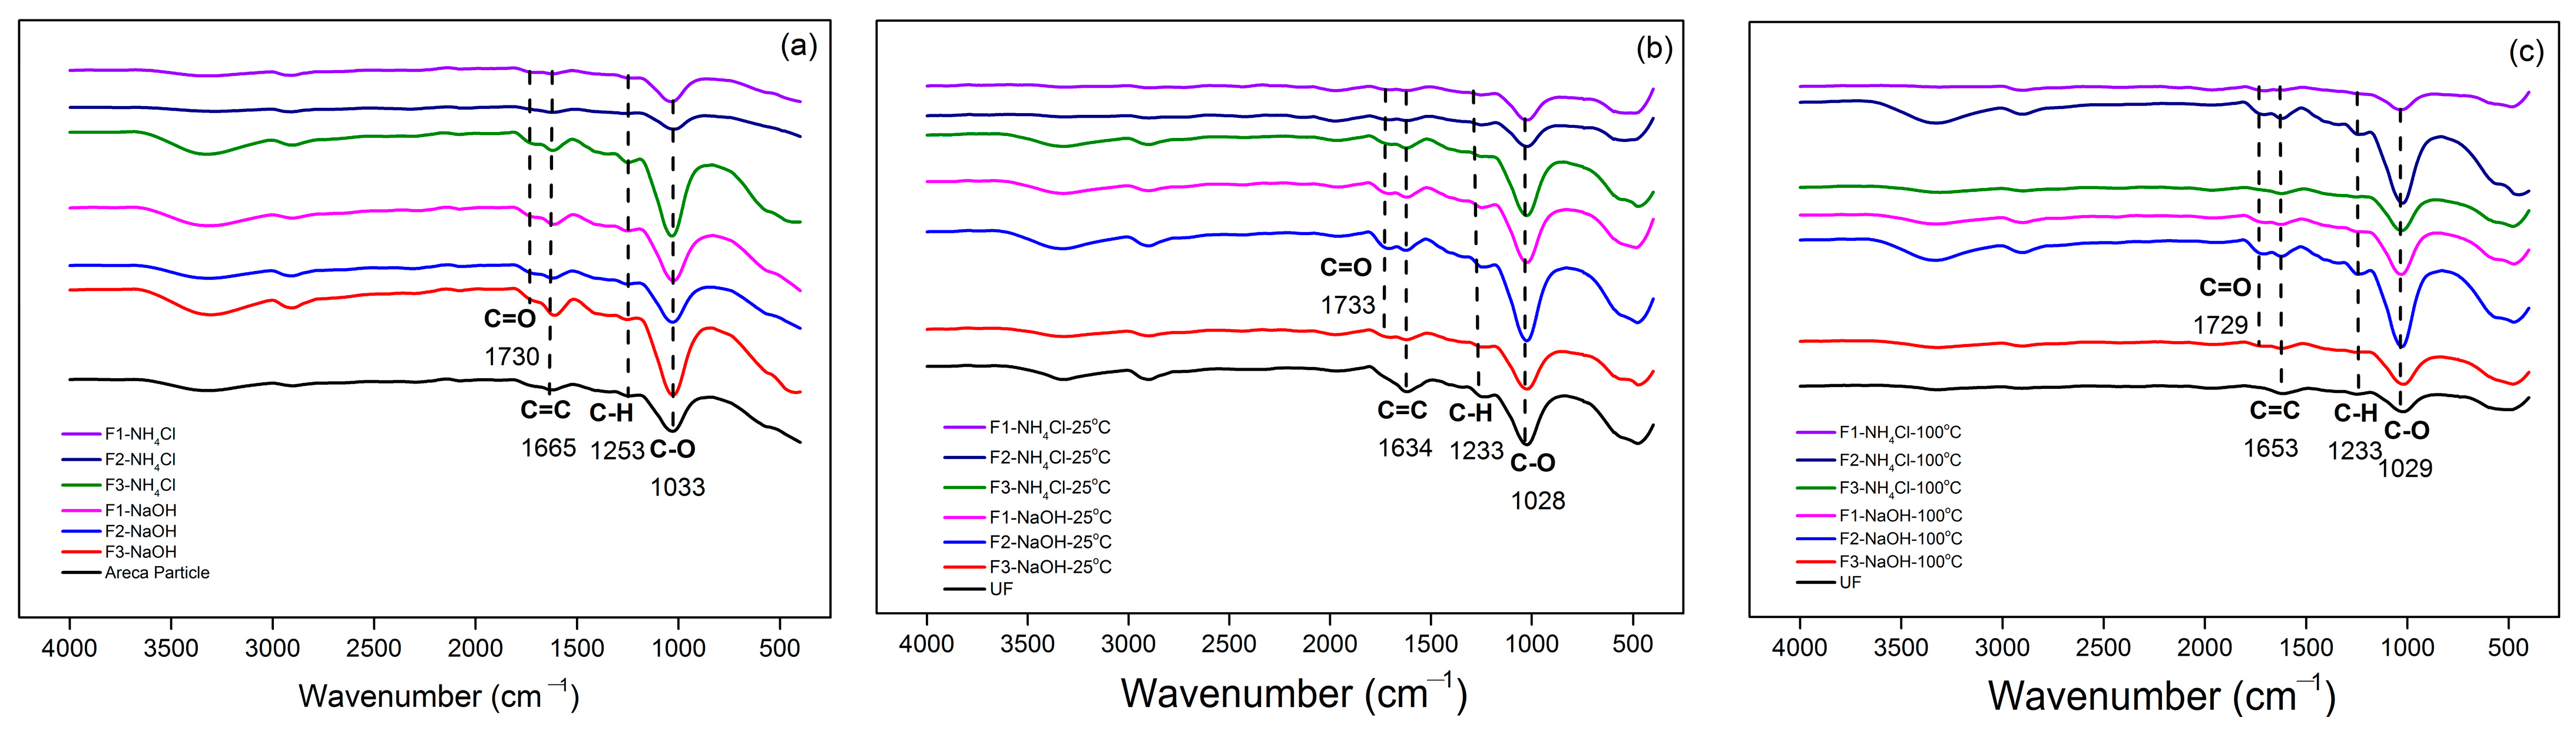
3.2. Physical Properties and Characteristics of TG Adhesive
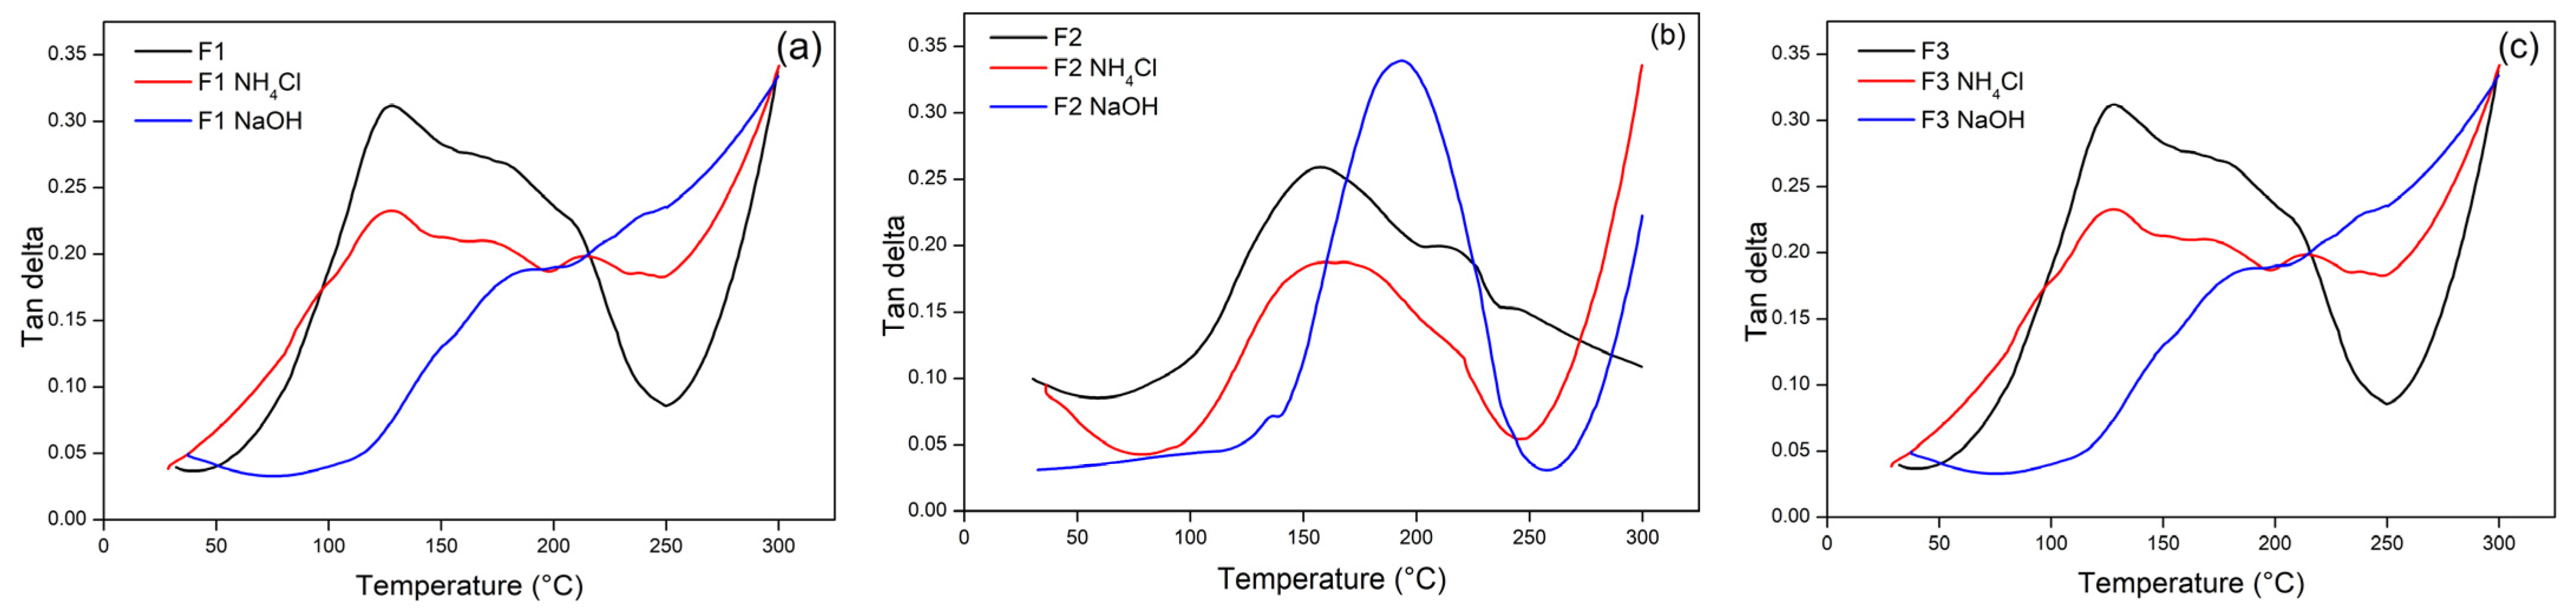
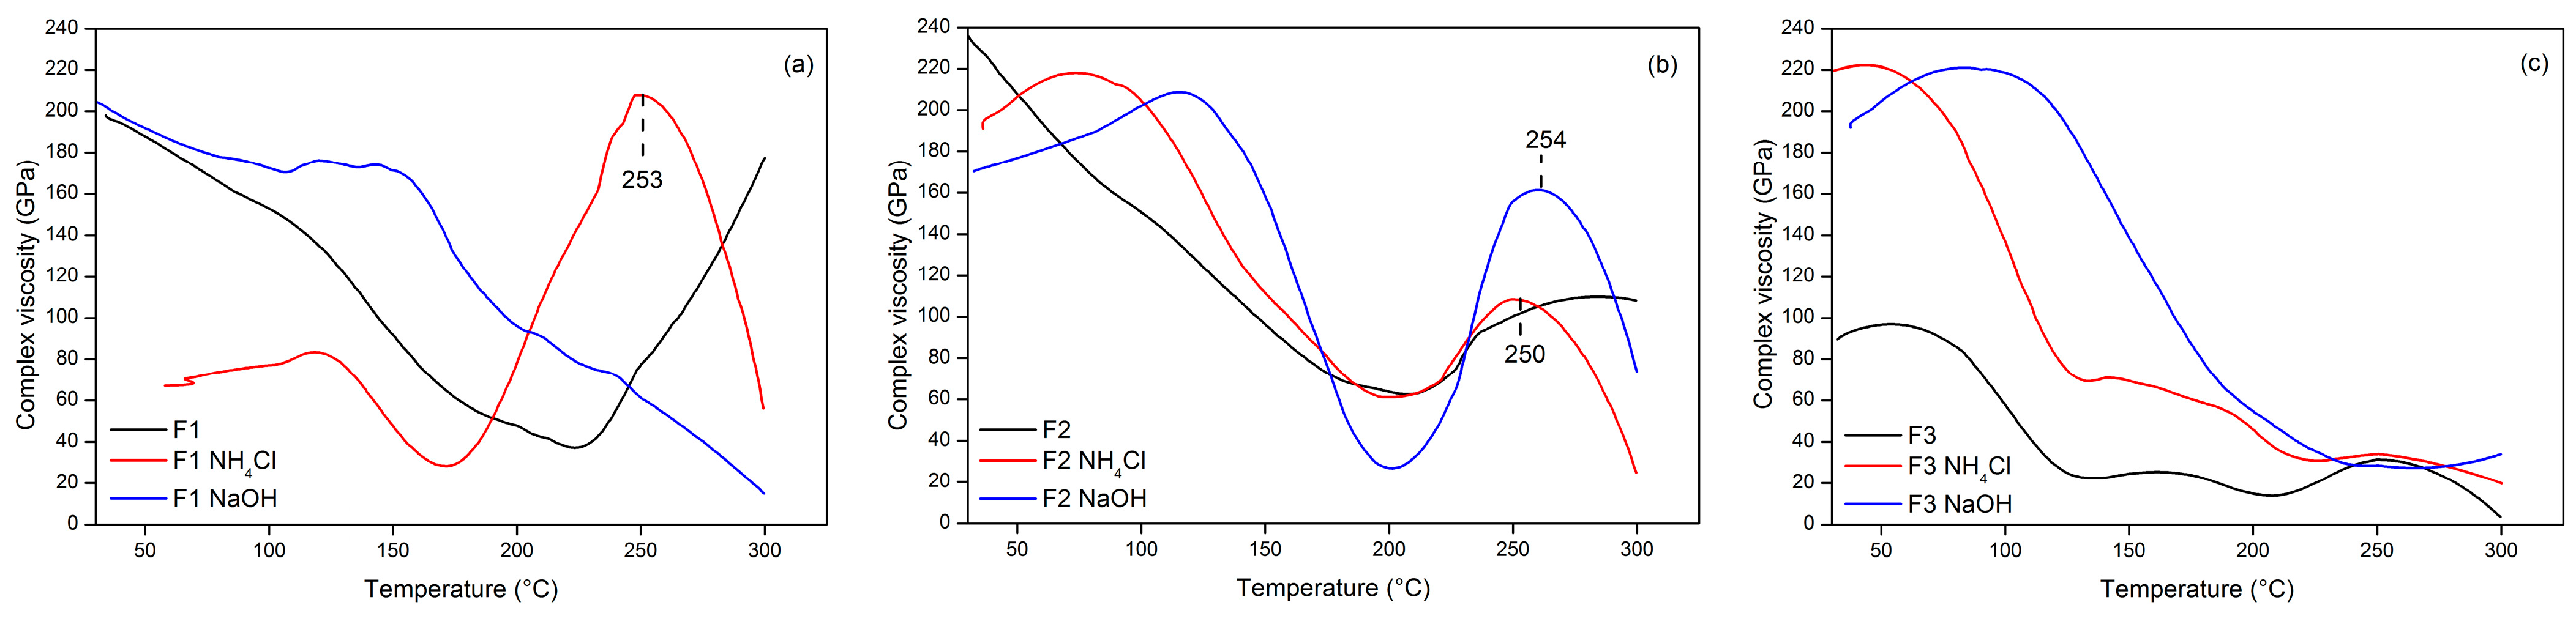
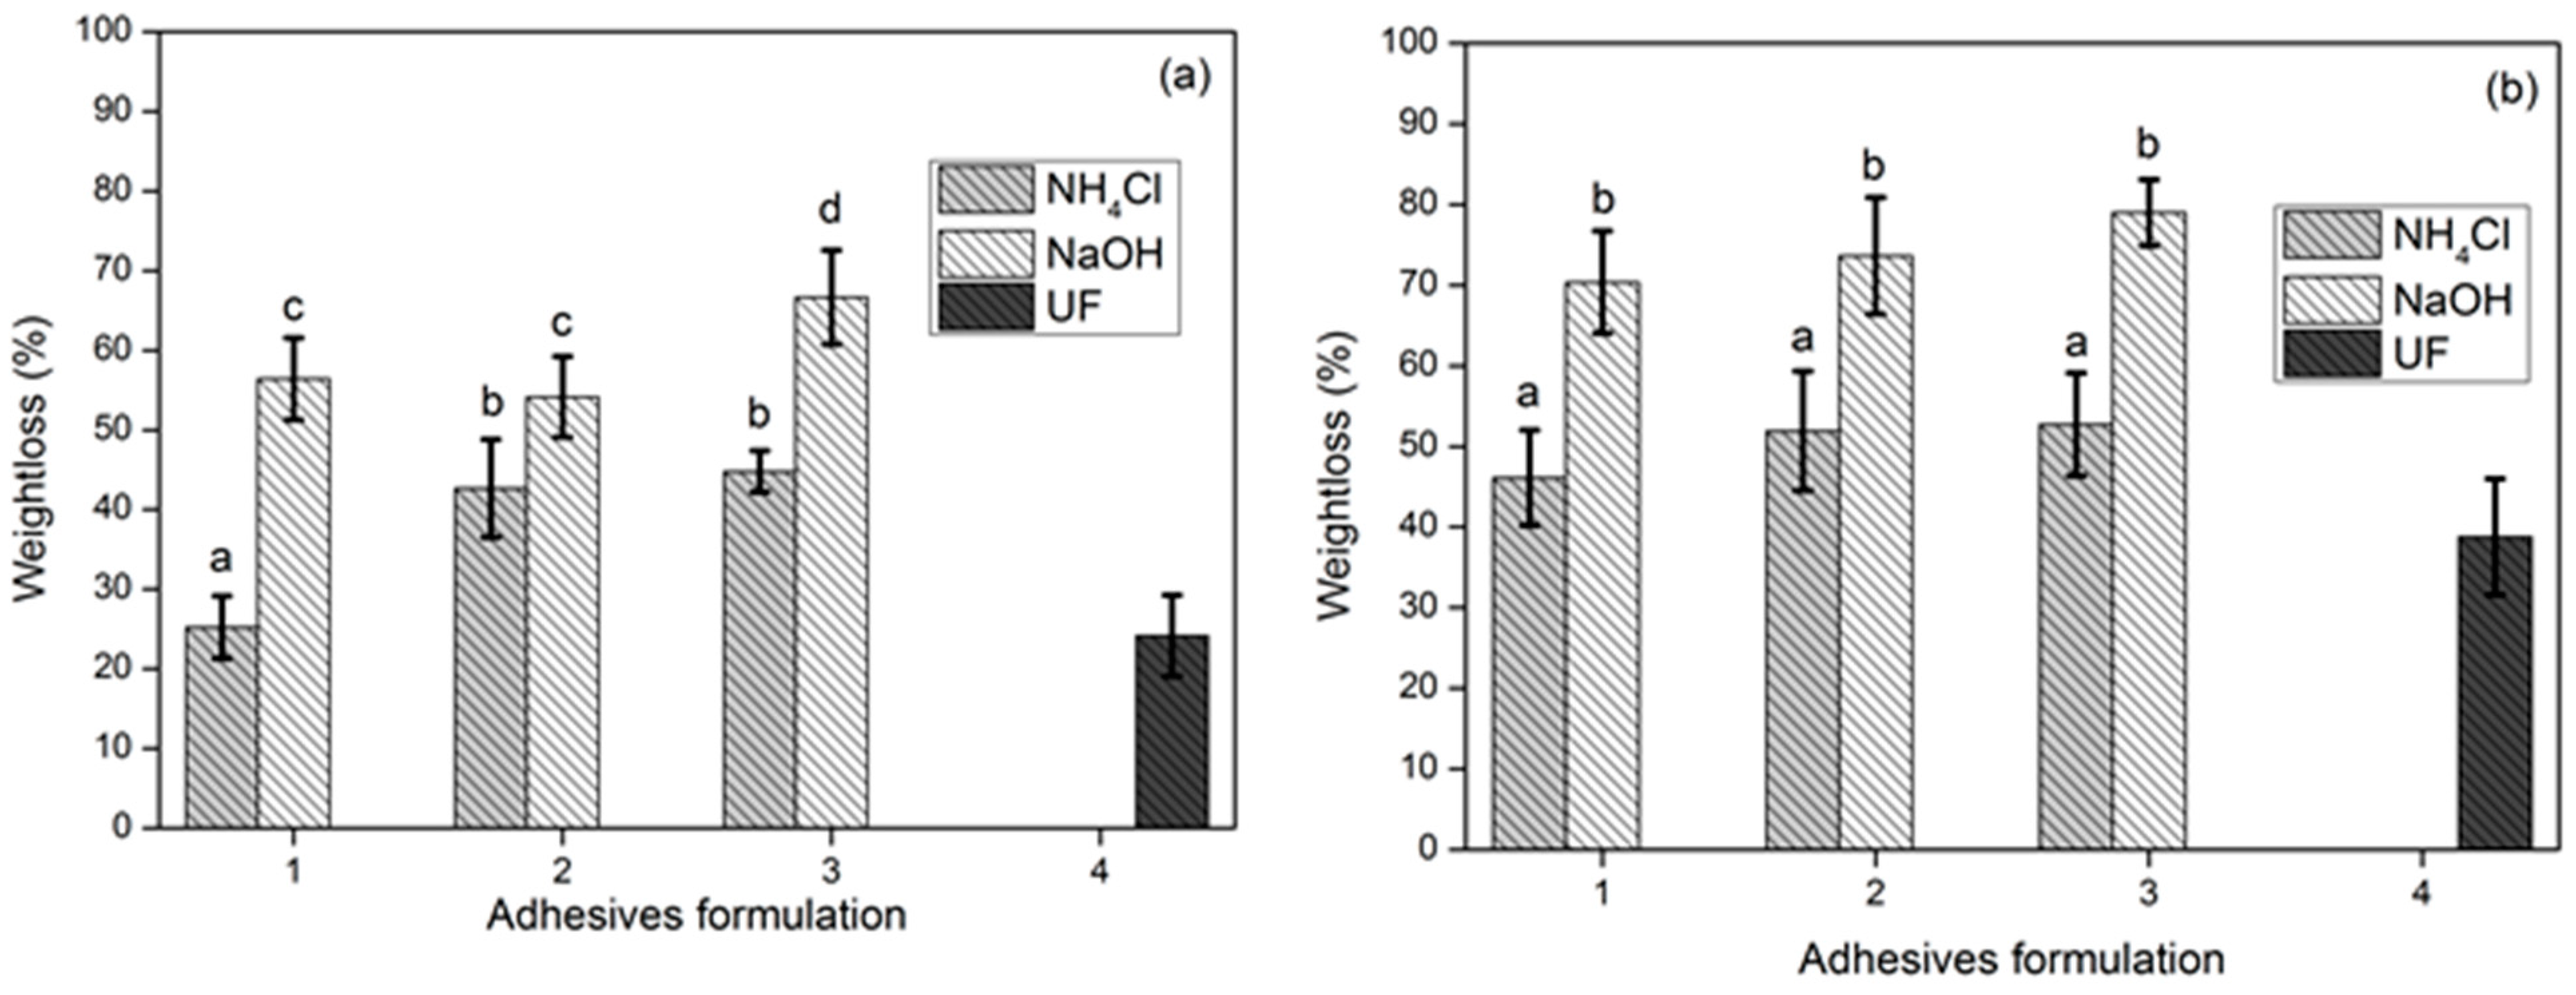
3.3. TG Adhesive Cohesion Properties
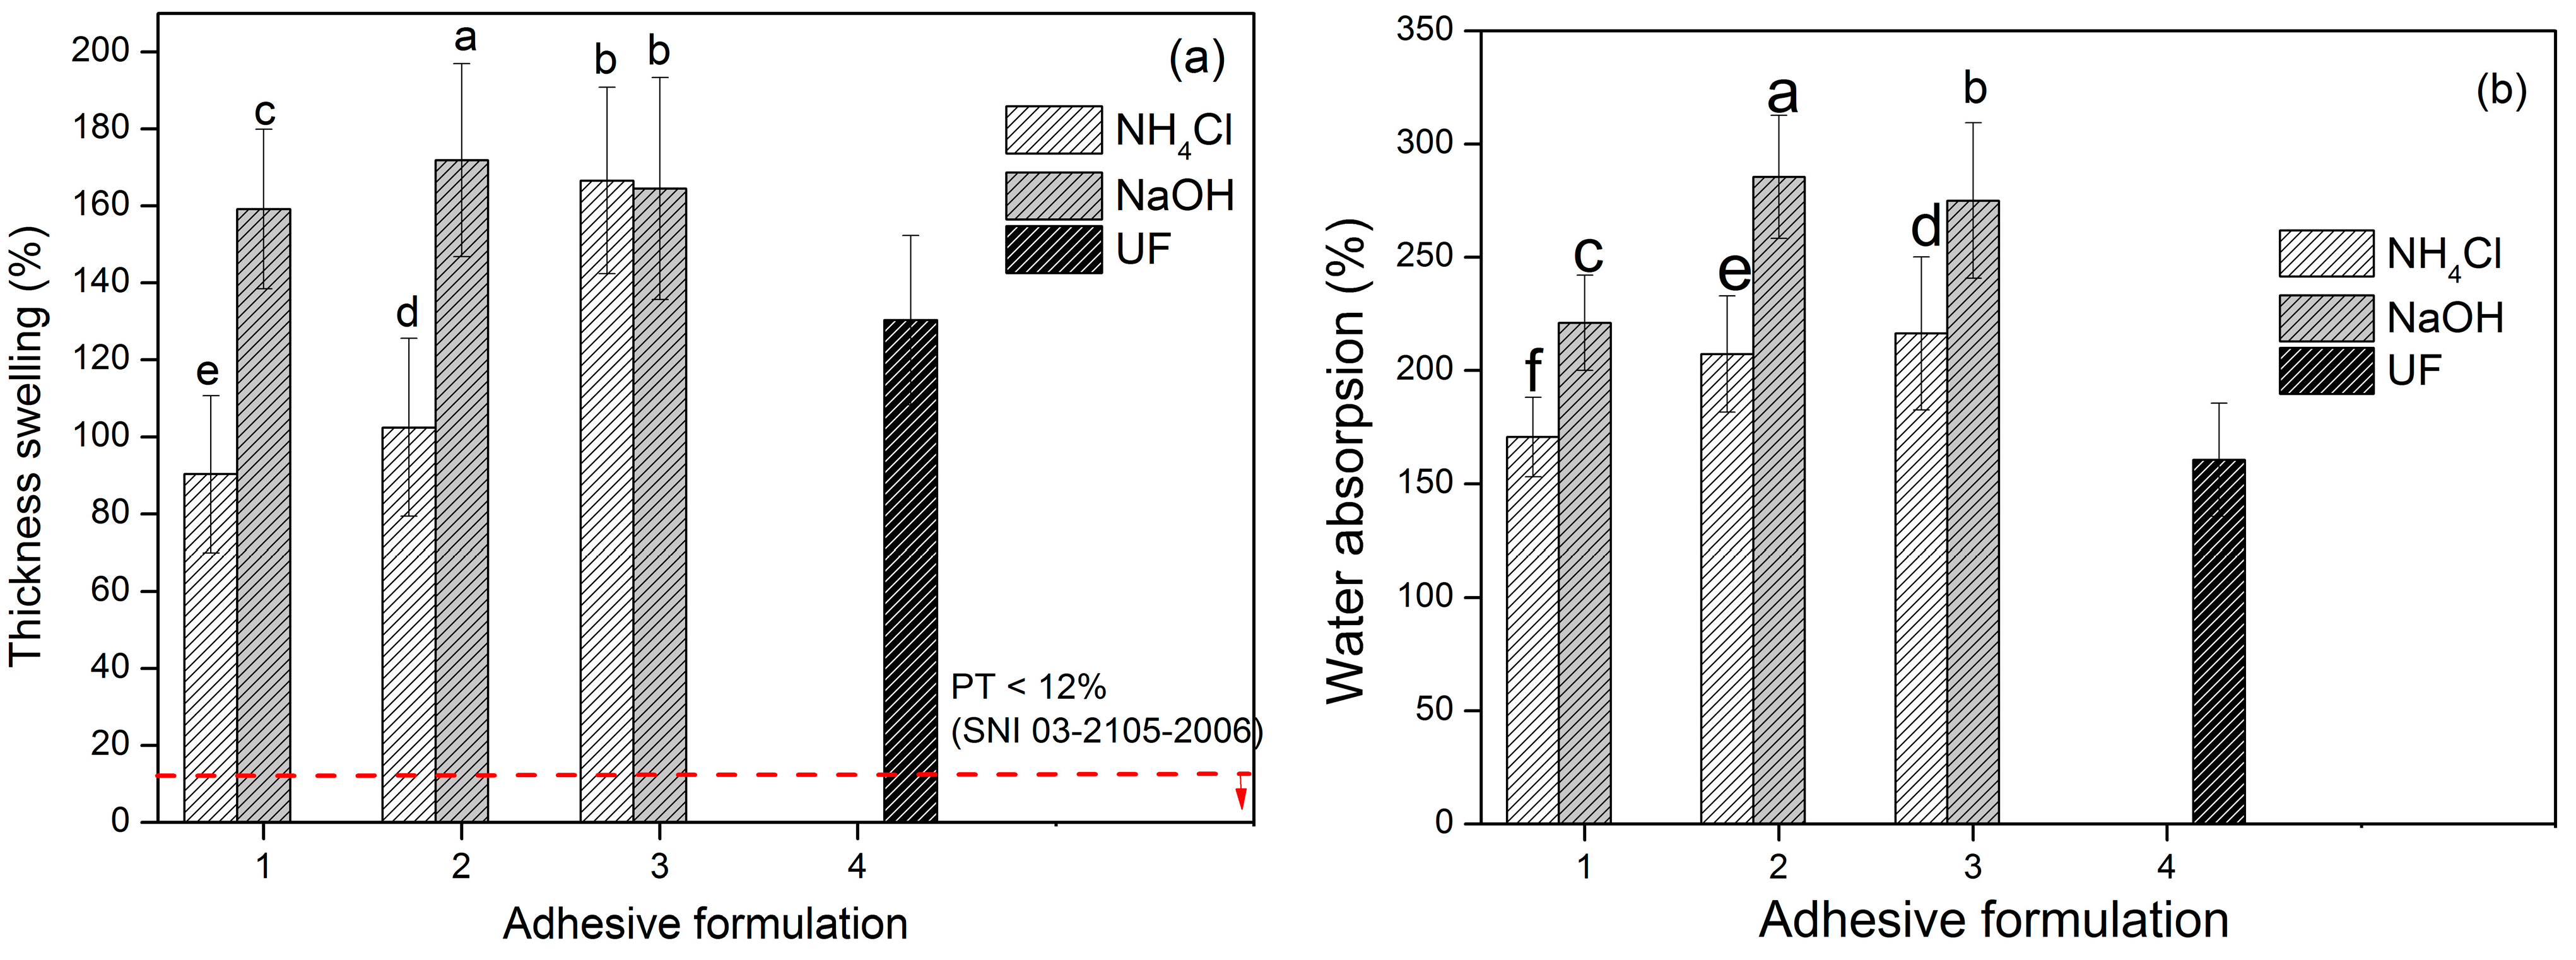
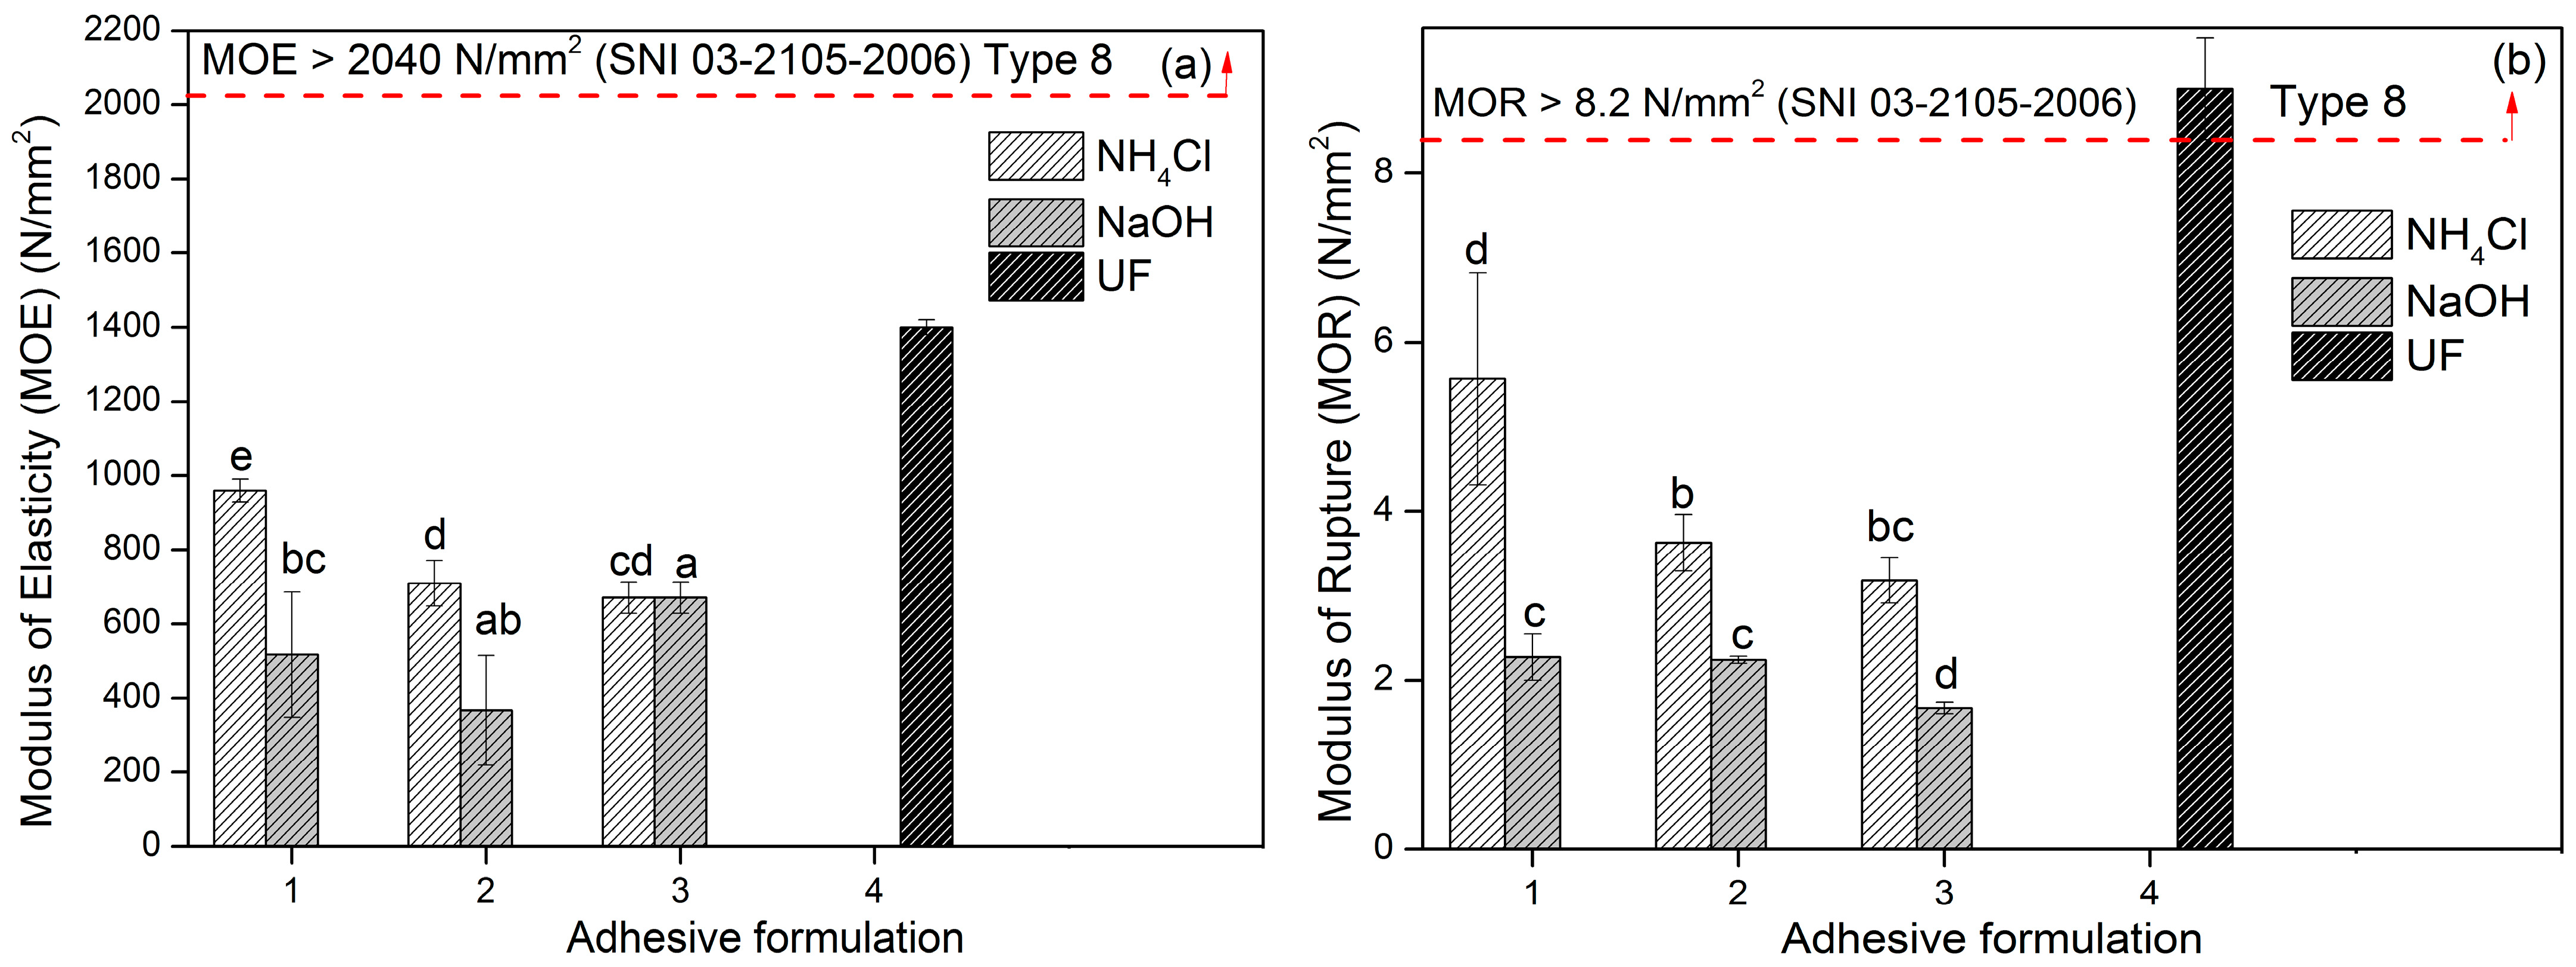
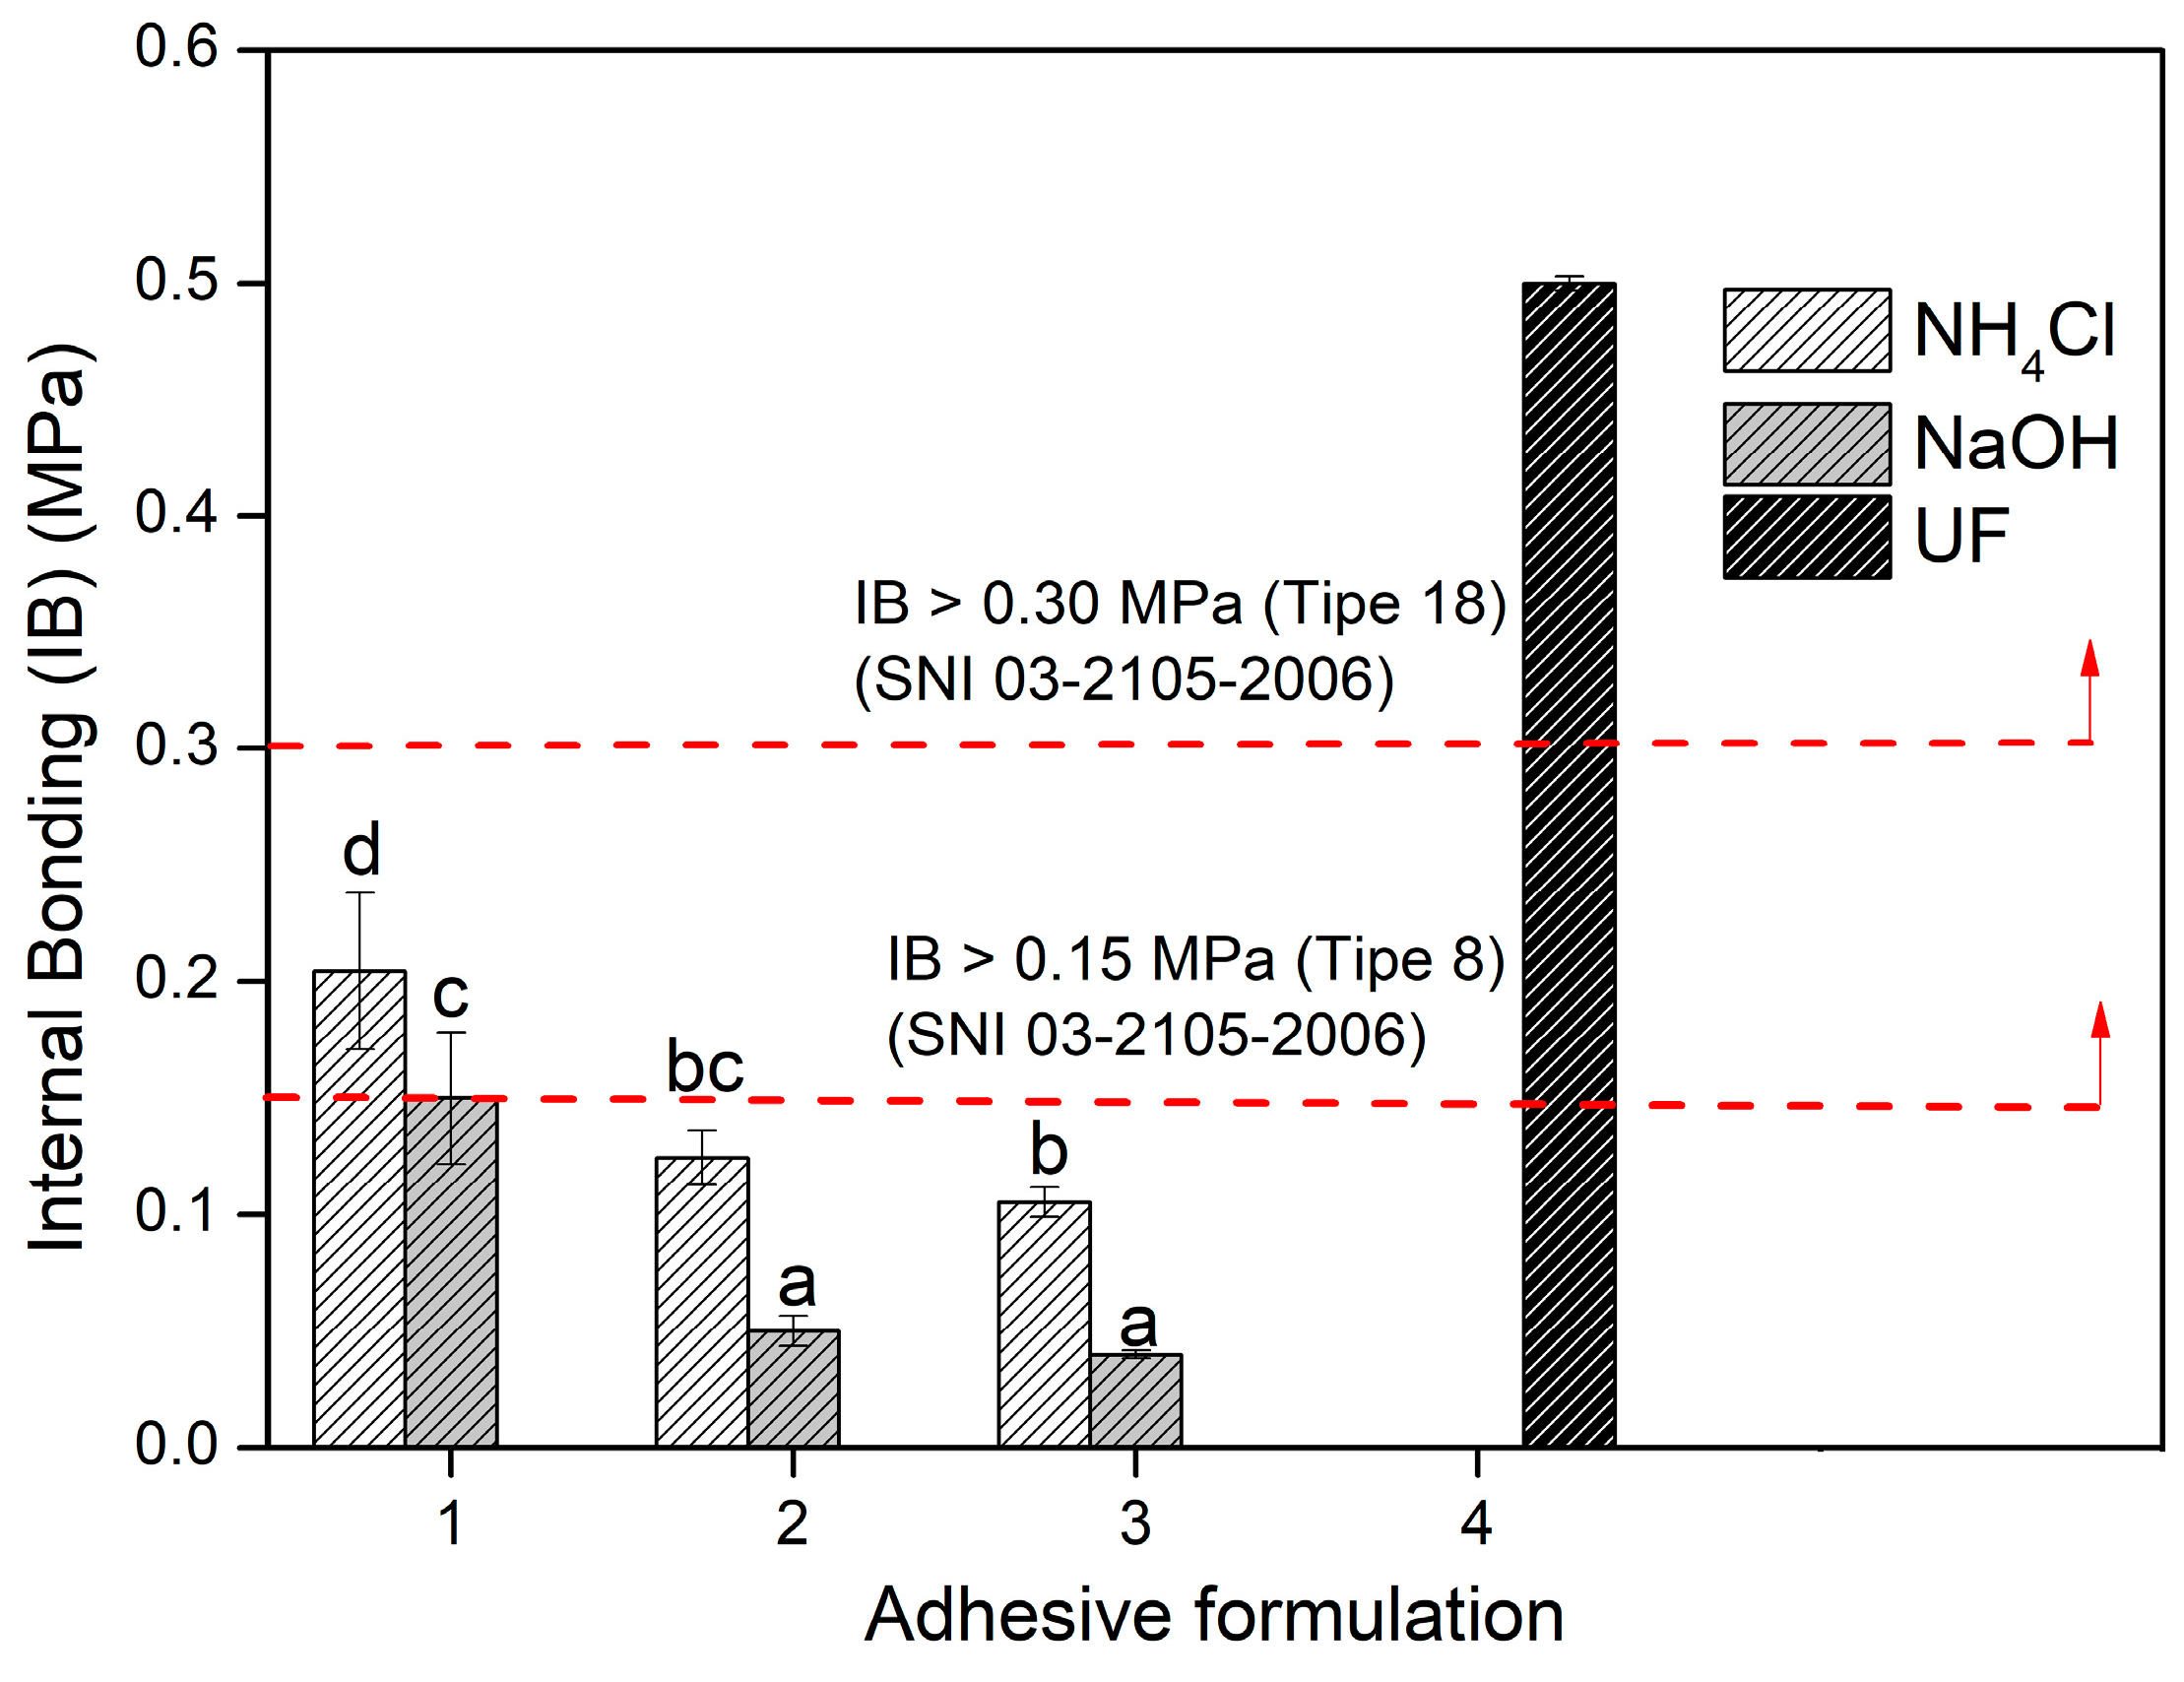
3.4. Adhesion Properties of TG Adhesive to Areca PB
4. Conclusions
Author Contributions
Funding
Institutional Review Board Statement
Informed Consent Statement
Data Availability Statement
Acknowledgments
Conflicts of Interest
References
- EPF. Types of Wood-Based Panels and Their Economic Impact/Particleboard. Available online: https://europanels.org/the-wood-based-panel-industry/types-of-wood-based-panels-economic-impact/particleboard/ (accessed on 4 January 2023).
- Farag, E.; Alshebani, M.; Elhrari, W.; Klash, A.; Shebani, A. Production of Particleboard Using Olive Stone Waste for Interior Design. J. Build. Eng. 2020, 29, 101119. [Google Scholar] [CrossRef]
- FAO. Forestry Production and Trade. Available online: https://www.fao.org/faostat/en/#data/FO/visualize (accessed on 10 October 2022).
- Ha, P. FAO Yearbook of Forest Products | Annuaire FAO des Produits Forestiers|Anuario FAO de Productos Forestales 2018; FAO: Rome, Italy, 2020; ISBN 9789251317174. [Google Scholar]
- Nurdin, H.; Hasanuddin; Waskito; Kurniawan, A. Particle Board Made from Areca Fiber with Tapioca Adhesive. J. Phys. Conf. Ser. 2020, 1594, 012031. [Google Scholar] [CrossRef]
- Sunny, G.; Rajan, T.P. Review on Areca Nut Fiber and Its Implementation in Sustainable Products Development. J. Nat. Fibers 2022, 19, 4747–4760. [Google Scholar] [CrossRef]
- Julie Chandra, C.S.; George, N.; Narayanankutty, S.K. Isolation and Characterization of Cellulose Nanofibrils from Arecanut Husk Fibre. Carbohydr. Polym. 2016, 142, 158–166. [Google Scholar] [CrossRef]
- Peng, Z.; Jiang, X.; Si, C.; Joao Cárdenas-Oscanoa, A.; Huang, C. Advances of Modified Lignin as Substitute to Develop Lignin-Based Phenol-Formaldehyde Resin Adhesives. ChemSusChem 2023, 16, e202300174. [Google Scholar] [CrossRef]
- Huang, C. Unlocking the Role of Lignin for Preparing the Lignin-Based Wood Adhesive: A Review. Ind. Crops Prod. 2022, 187, 115388. [Google Scholar] [CrossRef]
- Faria, D.L.; Scatolino, M.V.; de Oliveira, J.E.; Gonçalves, F.G.; Soriano, J.; de Paula Protásio, T.; Lelis, R.C.C.; de Carvalho, L.M.H.; Mendes, L.M.; Junior, J.B.G. Cardanol-Based Adhesive with Reduced Formaldehyde Emission to Produce Particleboards with Waste from Bean Crops. Environ. Sci. Pollut. Res. 2023, 30, 48270–48287. [Google Scholar] [CrossRef]
- Kristak, L.; Antov, P.; Bekhta, P.; Lubis, M.A.R.; Iswanto, A.H.; Reh, R.; Sedliacik, J.; Savov, V.; Taghiyari, H.R.; Papadopoulos, A.N.; et al. Recent Progress in Ultra-Low Formaldehyde Emitting Adhesive Systems and Formaldehyde Scavengers in Wood-Based Panels: A Review. Wood Mater. Sci. Eng. 2023, 18, 763–782. [Google Scholar] [CrossRef]
- Lubis, M.A.R.; Iswanto, A.H.; Hua, L.S.; Kristak, L.; Antov, P.; Putri, R.; Juliana, I.; Mardawati, E. Post-Modification of Ultra-Low Molar Ratio Urea-Formaldehyde Adhesive with Different Types and Levels of Organic Acid Hardener. IOP Conf. Ser. Earth Environ. Sci. 2022, 1115, 012037. [Google Scholar] [CrossRef]
- Liang, J.; Wu, J.; Xu, J. Low-Formaldehyde Emission Composite Particleboard Manufactured from Waste Chestnut Bur. J. Wood Sci. 2021, 67, 21. [Google Scholar] [CrossRef]
- Mian, S. Production of Low Formaldehyde Emission Particleboard by Using New Formulated Formaldehyde Based Resin. Eur. Int. J. Sci. Technol. 2009, 2, 255. [Google Scholar]
- Ghani, A.; Ashaari, Z.; Bawon, P.; Lee, S.H. Reducing Formaldehyde Emission of Urea Formaldehyde-Bonded Particleboard by Addition of Amines as Formaldehyde Scavenger. Build. Environ. 2018, 142, 188–194. [Google Scholar] [CrossRef]
- Wang, S.Y.; Yang, T.H.; Lin, L.T.; Lin, C.J.; Tsai, M.J. Properties of Low-Formaldehyde-Emission Particleboard Made from Recycled Wood-Waste Chips Sprayed with PMDI/PF Resin. Build. Environ. 2007, 42, 2472–2479. [Google Scholar] [CrossRef]
- Arbenz, A.; Avérous, L. Chemical Modification of Tannins to Elaborate Aromatic Biobased Macromolecular Architectures. Green Chem. 2015, 17, 2626–2646. [Google Scholar] [CrossRef]
- Lacoste, C.; Basso, M.C.; Pizzi, A.; Laborie, M.P.; Garcia, D.; Celzard, A. Bioresourced Pine Tannin/Furanic Foams with Glyoxal and Glutaraldehyde. Ind. Crops Prod. 2013, 45, 401–405. [Google Scholar] [CrossRef]
- Ramires, E.C.; Megiatto, J.D.; Gardrat, C.; Castellan, A.; Frollini, E. Biobased Composites from Glyoxal-Phenolic Resins and Sisal Fibers. Bioresour. Technol. 2010, 101, 1998–2006. [Google Scholar] [CrossRef]
- Hussin, H.; Alia Abdul, A.; Anwar, I.; Ibrahim, M.N.M.; Latif, N.H.A. Development and Characterization Novel Bio-Adhesive for Wood Using Kenaf Core (Hibiscus cannabinus) Lignin and Glyoxal. Int. J. Biol. Macromol. 2019, 122, 713–722. [Google Scholar] [CrossRef]
- Ballerini, A.; Despres, A.; Pizzi, A. Non-Toxic, Zero Emission Tannin-Glyoxal Adhesives for Wood Panels. Holz Als Roh-Und Werkst. 2005, 63, 477–478. [Google Scholar] [CrossRef]
- Mansouri, N.E.; Pizzi, A.; Salvadó, J. Lignin-Based Wood Panel Adhesives without Formaldehyde. Holz Als Roh-Und Werkst. 2007, 65, 65–70. [Google Scholar] [CrossRef]
- Konai, N.; Raidandi, D.; Pizzi, A.; Girods, P.; Lagel, M.C.; Kple, M. Thermogravimetric Analysis of Anningre Tannin Resin. Maderas Cienc. Y Tecnol. 2016, 18, 245–252. [Google Scholar] [CrossRef]
- Kriechbaum, K.; Bergström, L. Antioxidant and UV-Blocking Leather-Inspired Nanocellulose-Based Films with High Wet Strength. Biomacromolecules 2020, 21, 1720–1728. [Google Scholar] [CrossRef] [PubMed]
- Pizzi, A.P. Little Secrets for the Successful Industrial Use of Tannin Adhesives: A Review Little Secrets for the Successful Industrial Use of Tannin Adhesives: A Review. J. Renew. Mater. 2023, 11, 3403–3415. [Google Scholar] [CrossRef]
- Sutiawan, J.; Hadi, Y.S.; Nawawi, D.S.; Abdillah, I.B.; Zulfiana, D.; Lubis, M.A.R.; Nugroho, S.; Astuti, D.; Zhao, Z.; Handayani, M.; et al. The Properties of Particleboard Composites Made from Three Sorghum (Sorghum bicolor) Accessions Using Maleic Acid Adhesive. Chemosphere 2022, 290, 133163. [Google Scholar] [CrossRef] [PubMed]
- Syahfitri, A.; Hermawan, D.; Kusumah, S.S.; Ismadi; Lubis, M.A.R.; Widyaningrum, B.A.; Ismayati, M.; Amanda, P.; Ningrum, R.S.; Sutiawan, J. Conversion of Agro-Industrial Wastes of Sorghum Bagasse and Molasses into Lightweight Roof Tile Composite. Biomass Convers. Biorefinery 2022. [Google Scholar] [CrossRef]
- Moubarik, A.; Pizzi, A.; Allal, A.; Charrier, F.; Khoukh, A.; Charrier, B. Cornstarch-Mimosa Tannin-Urea Formaldehyde Resins as Adhesives in the Particleboard Production. Starch Staerke 2010, 62, 131–138. [Google Scholar] [CrossRef]
- Tondi, G. Tannin-Based Copolymer Resins: Synthesis and Characterization by Solid State 13C NMR and FT-IR Spectroscopy. Polymers 2017, 9, 223. [Google Scholar] [CrossRef] [PubMed]
- Xu, G.; Tian, H.; Xi, X.; Song, J.; Lei, H.; Du, G. Preparation and Characterization of Urea–Formaldehyde Adhesives Modified with Glyoxalated Tannin. Eur. J. Wood Wood Prod. 2022, 80, 1215–1223. [Google Scholar] [CrossRef]
- Siswanto, S.; Fadhila, W.U.H.; Abdillah, Y.R. Pemanfaatan Tanin Dari Kulit Kayu Bakau Sebagai Bahan Perekat Papan Partikel. JUMINTEN 2020, 1, 37–47. [Google Scholar] [CrossRef]
- Sutigno, P.; Santoso, A. Pengaruh Penambahan Urea Dan Melamin Pada Perekat Urea Formaldehida Terhadap Emisi Formaldehida Dan Keteguhan Rekat Tripleks Meranti. J. Penelit. Has. Hutan 1995, 13, 144–152. [Google Scholar] [CrossRef]
- BPS. Statistik Produksi Kehutanan 2021; Badan Pusat Statistik: Jakarta, Indonesia, 2022; ISBN 2580-1740.
- Wina, E.; Susana, I.W.R.; Tangendjaja, B. Biological Activity of Tannins from Acacia Mangium Bark Extracted by Different Solvents. Media Peternak. 2010, 33, 103–107. [Google Scholar] [CrossRef]
- Hafiz, N.L.M.; Tahir, P.M.D.; Hua, L.S.; Abidin, Z.Z.; Sabaruddin, F.A.; Yunus, N.M.; Abdullah, U.H.; Abdul Khalil, H.P.S. Curing and Thermal Properties of Co-Polymerized Tannin Phenol-Formaldehyde Resin for Bonding Wood Veneers. J. Mater. Res. Technol. 2020, 9, 6994–7001. [Google Scholar] [CrossRef]
- Mutiar, S.; Kasim, A.; Emriadi; Asben, A. Quality of Leather Using Vegetable Tannins Extract of Acacia mangium Bark from Waste of Industrial Plantation. IOP Conf. Ser. Earth Environ. Sci. 2019, 327, 012012. [Google Scholar] [CrossRef]
- Aristri, M.A.; Lubis, M.A.R.; Laksana, R.P.B.; Sari, R.K.; Iswanto, A.H.; Kristak, L.; Antov, P.; Pizzi, A. Thermal and Mechanical Performance of Ramie Fibers Modified with Polyurethane Resins Derived from Acacia Mangium Bark Tannin. J. Mater. Res. Technol. 2022, 18, 2413–2427. [Google Scholar] [CrossRef]
- SNI 03-2105-2006; Particleboard. BSN: Jakarta, Indonesia, 2006.
- Rita, W.S.; Suprapta, D.N.; Swantara, I.M.D. Antifungal Activity of Phenolic Compounds From Samanea Saman Leaves against Stem Rot Disease on Dragon Fruits Caused by Fusarium Solani. In Proceedings of the First Asian PGPR Indonesian Chapter International e-Conference 2021, Bali, Indonesia, 28 August 2021; pp. 621–635. [Google Scholar] [CrossRef]
- Aristri, M.A.; Sari, R.K.; Lubis, M.A.R.; Laksana, R.P.B.; Antov, P.; Iswanto, A.H.; Mardawati, E.; Lee, S.H.; Savov, V.; Kristak, L.; et al. Eco-Friendly Tannin-Based Non-Isocyanate Polyurethane Resins for the Modification of Ramie (Boehmeria nivea L.) Fibers. Polymers 2023, 15, 1492. [Google Scholar] [CrossRef]
- Hoong, Y.B.; Paridah, M.T.; Luqman, C.A.; Koh, M.P.; Loh, Y.F. Fortification of Sulfited Tannin from the Bark of Acacia Mangium with Phenol-Formaldehyde for Use as Plywood Adhesive. Ind. Crops Prod. 2009, 30, 416–421. [Google Scholar] [CrossRef]
- Pari, R.; Santoso, A. Keteguhan Rekat Dan Emisi Formaldehida Papan Lamina Rotan Menggunakan Perekat Tanin Formaldehida. J. Penelit. Has. Hutan 2019, 37, 33–41. [Google Scholar] [CrossRef]
- Sari, R.A.L.; Lubis, M.A.R.; Sari, R.K.; Kristak, L.; Iswanto, A.H.; Mardawati, E.; Fatriasari, W.; Lee, S.H.; Reh, R.; Sedliacik, J.; et al. Properties of Plywood Bonded with Formaldehyde-Free Adhesive Based on Poly(Vinyl Alcohol)–Tannin–Hexamine at Different Formulations and Cold-Pressing Times. J. Compos. Sci. 2023, 7, 113. [Google Scholar] [CrossRef]
- Dongbin, F.; Jianzhang, L.; An, M. Curing Characteristics of Low Molar Ratio Urea-Formaldehyde Resins. J. Adhes. Interface 2006, 7, 45–52. [Google Scholar]
- Arasaretnam, S.; Venujah, K. Modification of Tannin Extracted from the Bark of Acacia auriculiformis for the Antibacterial Activity and Application of Metal Adsorption. Ruhuna J. Sci. 2017, 8, 90. [Google Scholar] [CrossRef]
- Sunija, A.J.; Ilango, S.S.; Kumar, K.P.V. Synthesis and Characterization of Bio-Based Polyurethane from Benzoylated Cashewnut Husk Tannins. Bull. Mater. Sci. 2014, 37, 735–741. [Google Scholar] [CrossRef]
- Pichelin, F.; Nakatani, M.; Pizzi, A.; Wieland, S. Structural Beams from Thick Wood Panels Bonded Industrially with Formaldehyde-Free Tannin Adhesives. For. Prod. J. 2006, 56, 31. [Google Scholar]
- Ruhendi, S.; Koroh, D.N.; Syamani, F.A.; Yanti, H.; Nurhaida, S.S.; Sucipto, T. Analisis Perekatan Kayu; IPB Press: Bogor, Indonesia, 2007; ISBN 9789799337481. [Google Scholar]
- Lubis, M.A.R.; Park, B.D. Influence of Initial Molar Ratios on the Performance of Low Molar Ratio Urea-Formaldehyde Resin Adhesives 1. J. Korean Wood Sci. Technol. 2020, 48, 136–153. [Google Scholar] [CrossRef]
- Ou, X.; Zou, X.; Liu, Q.; Li, L.; Li, S.; Cui, Y.; Zhou, Y.; Yan, F. Recyclable, Fire-Resistant, Superstrong, and Reversible Ionic Polyurea-Based Adhesives. Chem. Mater. 2023, 35, 1218–1228. [Google Scholar] [CrossRef]
- Basak, S.; Raja, A.S.M.; Saxena, S.; Patil, P.G. Tannin Based Polyphenolic Bio-Macromolecules: Creating a New Era towards Sustainable Flame Retardancy of Polymers. Polym. Degrad. Stab. 2021, 189, 109603. [Google Scholar] [CrossRef]
- Kumar, A.; Kumar, A.; Rai, A. Rheological Behaviour of Nano Fl Uids: A Review. Renew. Sustain. Energy Rev. 2016, 53, 779–791. [Google Scholar]
- Hosseini, S.F.; Ghaderi, J.; Gómez-Guillén, M.C. Trans-Cinnamaldehyde-Doped Quadripartite Biopolymeric Films: Rheological Behavior of Film-Forming Solutions and Biofunctional Performance of Films. Food Hydrocoll. 2021, 112, 106339. [Google Scholar] [CrossRef]
- Yang, Q.; Dou, F.; Liang, B.; Shen, Q. Studies of Cross-Linking Reaction on Chitosan Fiber with Glyoxal. Carbohydr. Polym. 2005, 59, 205–210. [Google Scholar] [CrossRef]
- Jesuarockiam, N.; Jawaid, M.; Zainudin, E.S.; Hameed Sultan, M.T.; Yahaya, R. Enhanced Thermal and Dynamic Mechanical Properties of Synthetic/Natural Hybrid Composites with Graphene Nanoplateletes. Polymers 2019, 11, 85. [Google Scholar] [CrossRef] [PubMed]
- Goriparthi, B.K.; Suman, K.N.S.; Nalluri, M.R. Processing and Characterization of Jute Fiber Reinforced Hybrid Biocomposites Based on Polylactide/Polycaprolactone Blends. Polym. Compos. 2012, 33, 237–244. [Google Scholar] [CrossRef]
- Lubis, M.A.R.; Labib, A.; Sudarmanto; Akbar, F.; Nuryawan, A.; Antov, P.; Kristak, L.; Papadopoulos, A.N. Influence of Lignin Content and Pressing Time on Plywood Properties Bonded with Cold-Setting Adhesive Based on Poly (Vinyl alcohol), Lignin, and Hexamine. Polymers 2022, 14, 2111. [Google Scholar] [CrossRef]
- Rashid, B.; Leman, Z.; Jawaid, M.; Ghazali, M.J.J.; Ishak, M.R.R. Dynamic Mechanical Analysis of Treated and Untreated. Bioresources 2017, 12, 3448–3462. [Google Scholar]
- Jawaid, M.; Abdul Khalil, H.P.S.; Hassan, A.; Dungani, R.; Hadiyane, A. Effect of Jute Fibre Loading on Tensile and Dynamic Mechanical Properties of Oil Palm Epoxy Composites. Compos. Part B Eng. 2013, 45, 619–624. [Google Scholar] [CrossRef]
- Asim, M.; Jawaid, M.; Nasir, M.; Saba, N. Effect of Fiber Loadings and Treatment on Dynamic Mechanical, Thermal and Flammability Properties of Pineapple Leaf Fiber and Kenaf Phenolic Composites. J. Renew. Mater. 2018, 6, 383–393. [Google Scholar] [CrossRef]
- Liao, J.; Brosse, N.; Hoppe, S.; Du, G.; Zhou, X.; Pizzi, A. One-Step Compatibilization of Poly(Lactic Acid) and Tannin via Reactive Extrusion. Mater. Des. 2020, 191, 108603. [Google Scholar] [CrossRef]
- Si, S.; Zheng, X.; Li, X. Effect of Carbonization Treatment on the Physicochemical Properties of Bamboo Particleboard. Constr. Build. Mater. 2022, 344, 128204. [Google Scholar] [CrossRef]


| Formulation (T:G) | Tannin (g) | Glyoxal (g) | Total |
|---|---|---|---|
| F1 (1:2) | 40 | 80 | 120 |
| F2 (1:1) | 60 | 60 | 120 |
| F3 (2:1) | 80 | 40 | 120 |
| Composition | F1 | F2 | F3 |
|---|---|---|---|
| Adhesive (g) | 123.08 | 127.42 | 158.81 |
| Hardener (g) | 0.74 | 0.76 | 0.95 |
| Wax (g) | 6.45 | 6.45 | 6.45 |
| Particle (g) | 644.63 | 644.63 | 644.63 |
| Parameters | Value | References |
|---|---|---|
| Yield (%) | 23.22 ± 0.95 | 26.43 [40] |
| Moisture content (%) | 6.96 ± 0.37 | 5.47 [40] |
| Solids content (%) | 91.36 ± 0.74 | 93.46 [40] |
| Stiasny number | 73.17 ± 0.74 | 79.09 [41] |
| Formulation | Solid Content (%) | Specific Gravity | Viscosity (mPa.s) | Gelation Time (min) | ||||
|---|---|---|---|---|---|---|---|---|
| NH | NH4Cl | NaOH | NH | NH4Cl | NaOH | |||
| F1 | 48.75 ± 3.27 b | 1.38 ± 0.01 c | 32.86 ± 0.09 i | 27.39 ± 0.11 h | 10.59 ± 0.12 e | 66.60 ± 1.34 g | 20.20 ± 1.15 b | 61.63 ± 0.75 f |
| F2 | 47.09 ± 0.86 b | 1.35 ± 0.01 b | 23.77 ± 0.14 g | 21.35 ± 0.09 f | 8.54 ± 0.11 c | 37.16 ± 0.85 e | 18.67 ± 1.05 a | 45.23 ± 1.64 d |
| F3 | 37.78 ± 0.43 a | 1.31 ± 0.00 a | 10.34 ± 0.07 d | 9.89 ± 0.07 b | 0.27 ± 0.15 a | 82.16 ± 1.20 i | 26.26 ± 0.83 c | 78.83 ± 0.84 h |
| Hydrolysis | F1 NH4Cl | F2 NH4Cl | F3 NH4Cl | F1 NaOH | F2 NaOH | F3 NaOH | UF |
|---|---|---|---|---|---|---|---|
| Before |  |  | 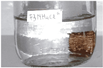 |  |  |  |  |
| After |  |  | 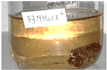 | 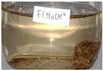 |  |  |  |
| Hydrolysis | F1 NH4Cl | F2 NH4Cl | F3 NH4Cl | F1 NaOH | F2 NaOH | F3 NaOH | UF |
|---|---|---|---|---|---|---|---|
| Before |  |  |  |  |  |  |  |
| After |  |  |  |  |  |  |  |
Disclaimer/Publisher’s Note: The statements, opinions and data contained in all publications are solely those of the individual author(s) and contributor(s) and not of MDPI and/or the editor(s). MDPI and/or the editor(s) disclaim responsibility for any injury to people or property resulting from any ideas, methods, instructions or products referred to in the content. |
© 2023 by the authors. Licensee MDPI, Basel, Switzerland. This article is an open access article distributed under the terms and conditions of the Creative Commons Attribution (CC BY) license (https://creativecommons.org/licenses/by/4.0/).
Share and Cite
Anggini, A.W.; Lubis, M.A.R.; Sari, R.K.; Papadopoulos, A.N.; Antov, P.; Iswanto, A.H.; Lee, S.H.; Mardawati, E.; Kristak, L.; Juliana, I. Cohesion and Adhesion Performance of Tannin-Glyoxal Adhesives at Different Formulations and Hardener Types for Bonding Particleboard Made of Areca (Areca catechu) Leaf Sheath. Polymers 2023, 15, 3425. https://doi.org/10.3390/polym15163425
Anggini AW, Lubis MAR, Sari RK, Papadopoulos AN, Antov P, Iswanto AH, Lee SH, Mardawati E, Kristak L, Juliana I. Cohesion and Adhesion Performance of Tannin-Glyoxal Adhesives at Different Formulations and Hardener Types for Bonding Particleboard Made of Areca (Areca catechu) Leaf Sheath. Polymers. 2023; 15(16):3425. https://doi.org/10.3390/polym15163425
Chicago/Turabian StyleAnggini, Awanda Wira, Muhammad Adly Rahandi Lubis, Rita Kartika Sari, Antonios N. Papadopoulos, Petar Antov, Apri Heri Iswanto, Seng Hua Lee, Efri Mardawati, Lubos Kristak, and Ika Juliana. 2023. "Cohesion and Adhesion Performance of Tannin-Glyoxal Adhesives at Different Formulations and Hardener Types for Bonding Particleboard Made of Areca (Areca catechu) Leaf Sheath" Polymers 15, no. 16: 3425. https://doi.org/10.3390/polym15163425