
Rapid Crystallization and Fluorescence of Poly(ethylene terephthalate) Using Graphene Quantum Dots as Nucleating Agents

 , ,
, ,
Abstract
:1. Introduction
2. Experiments
2.1. Materials
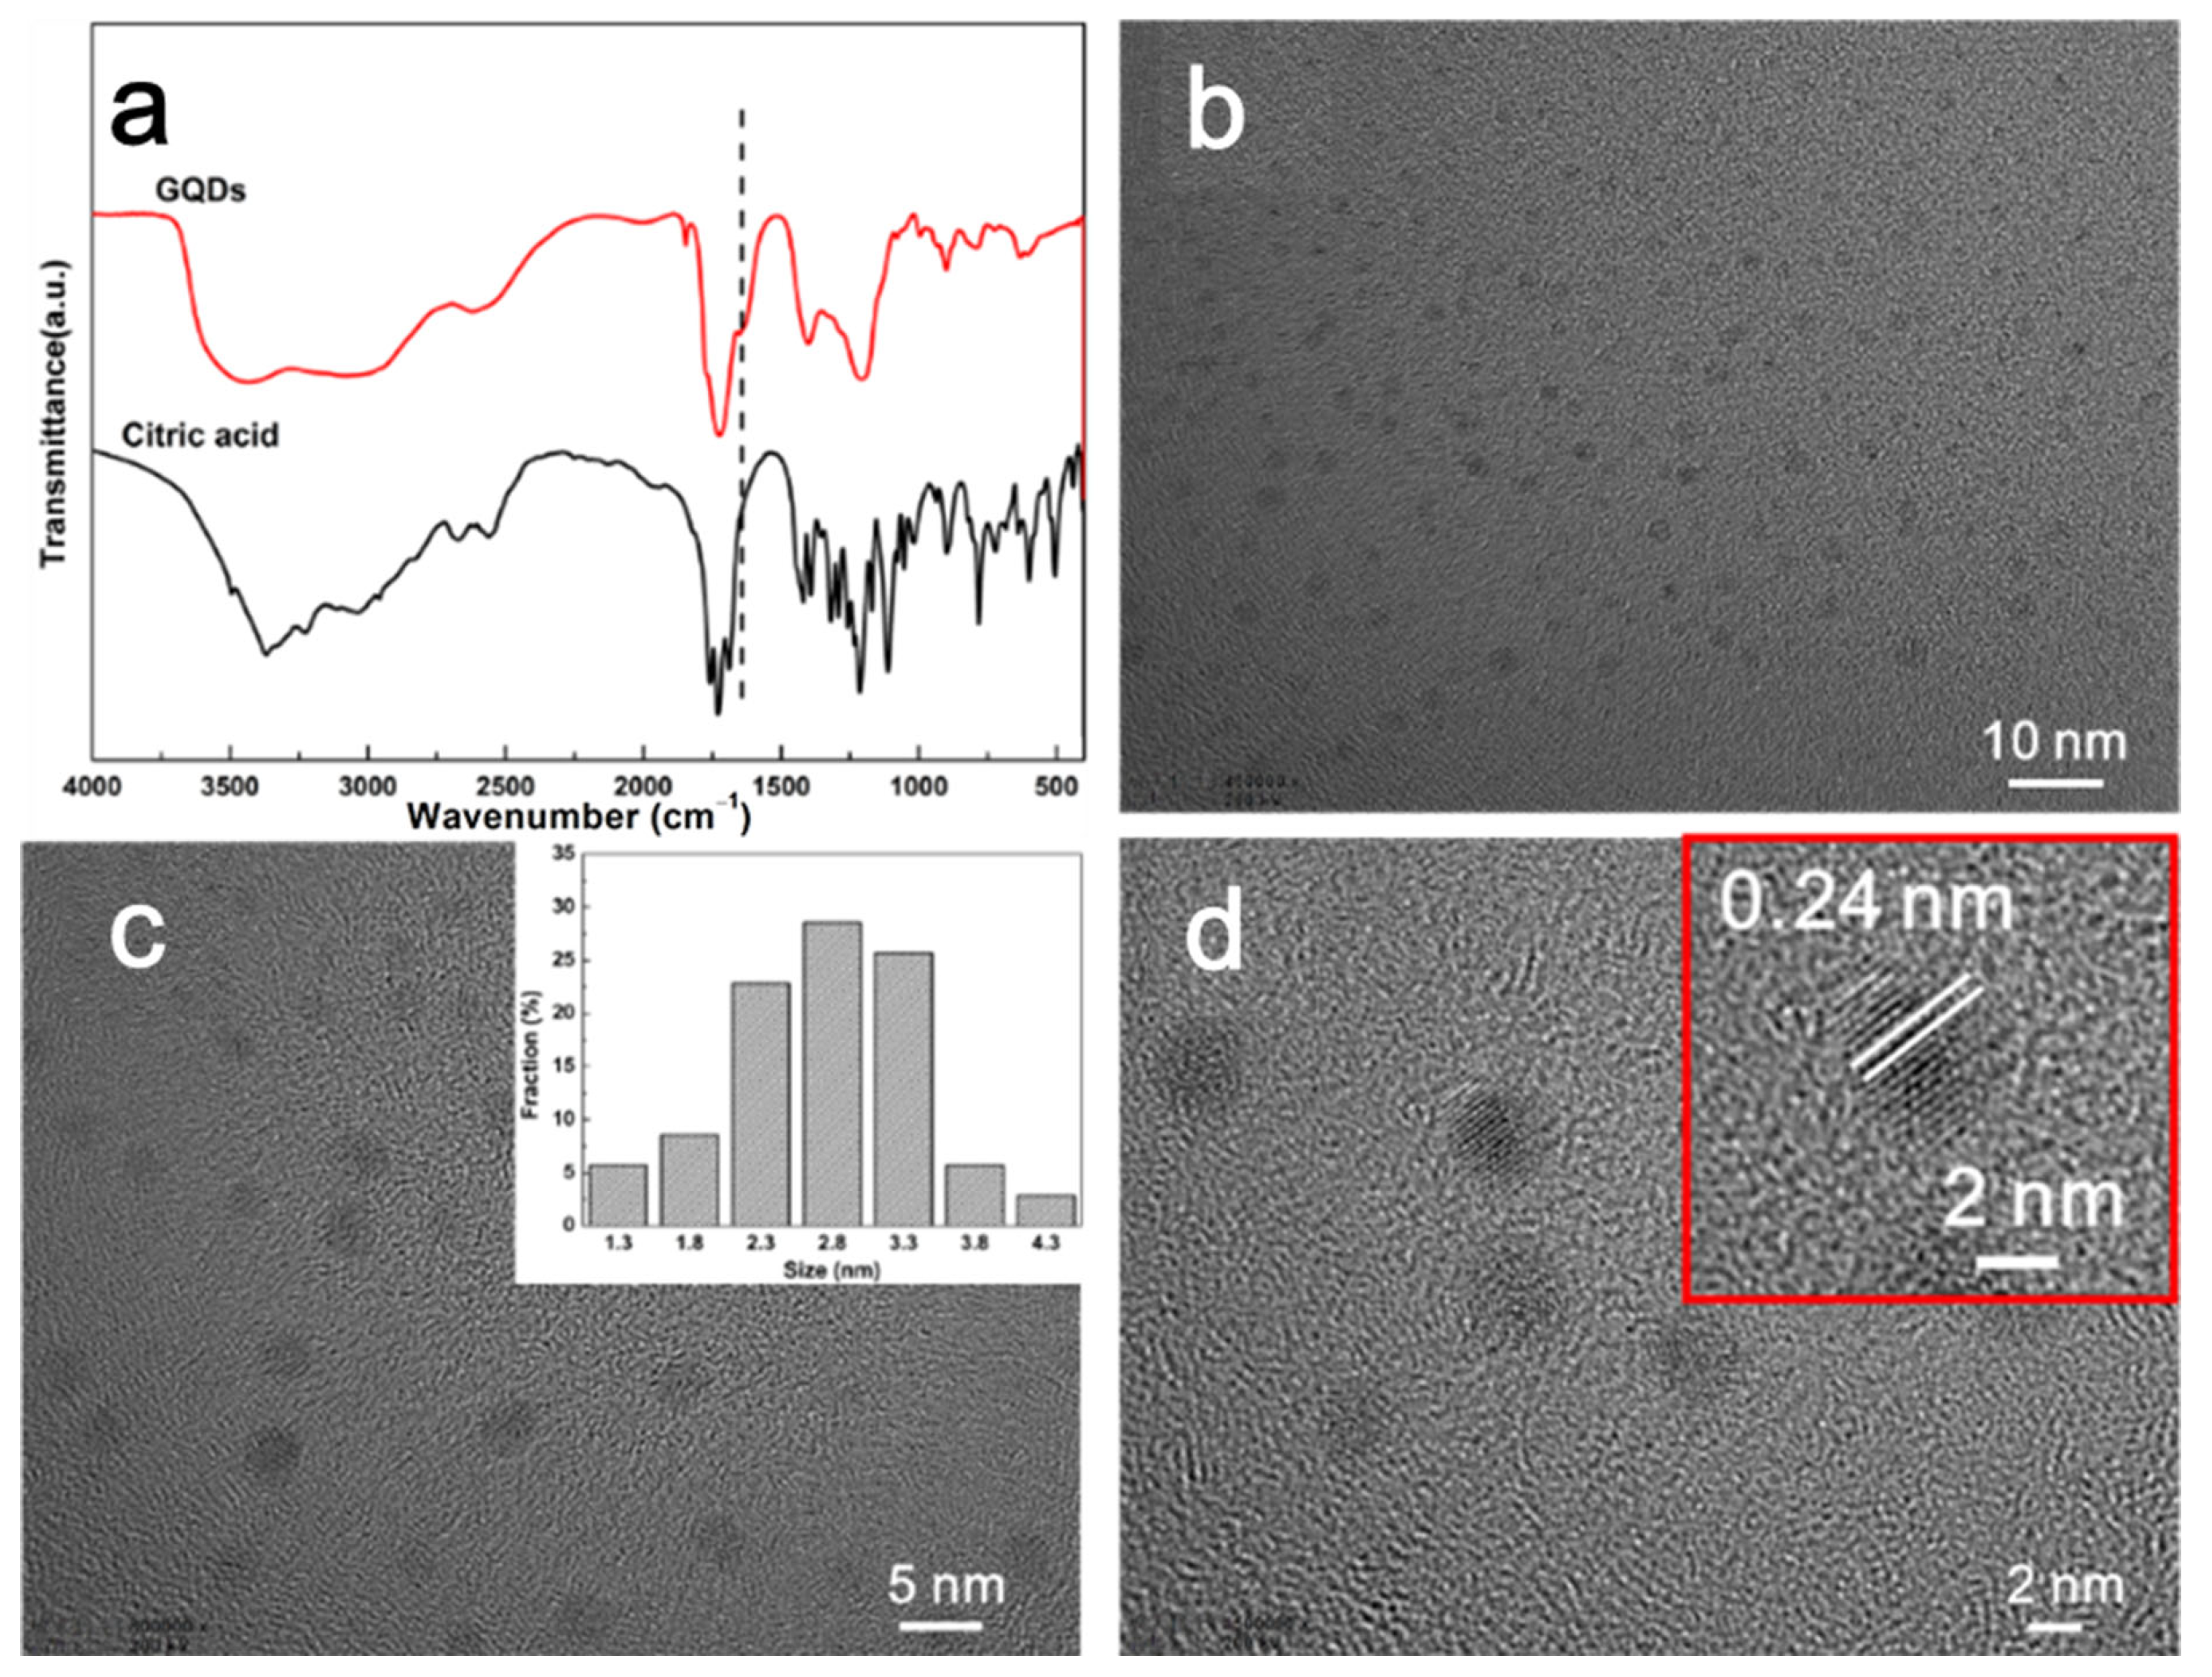
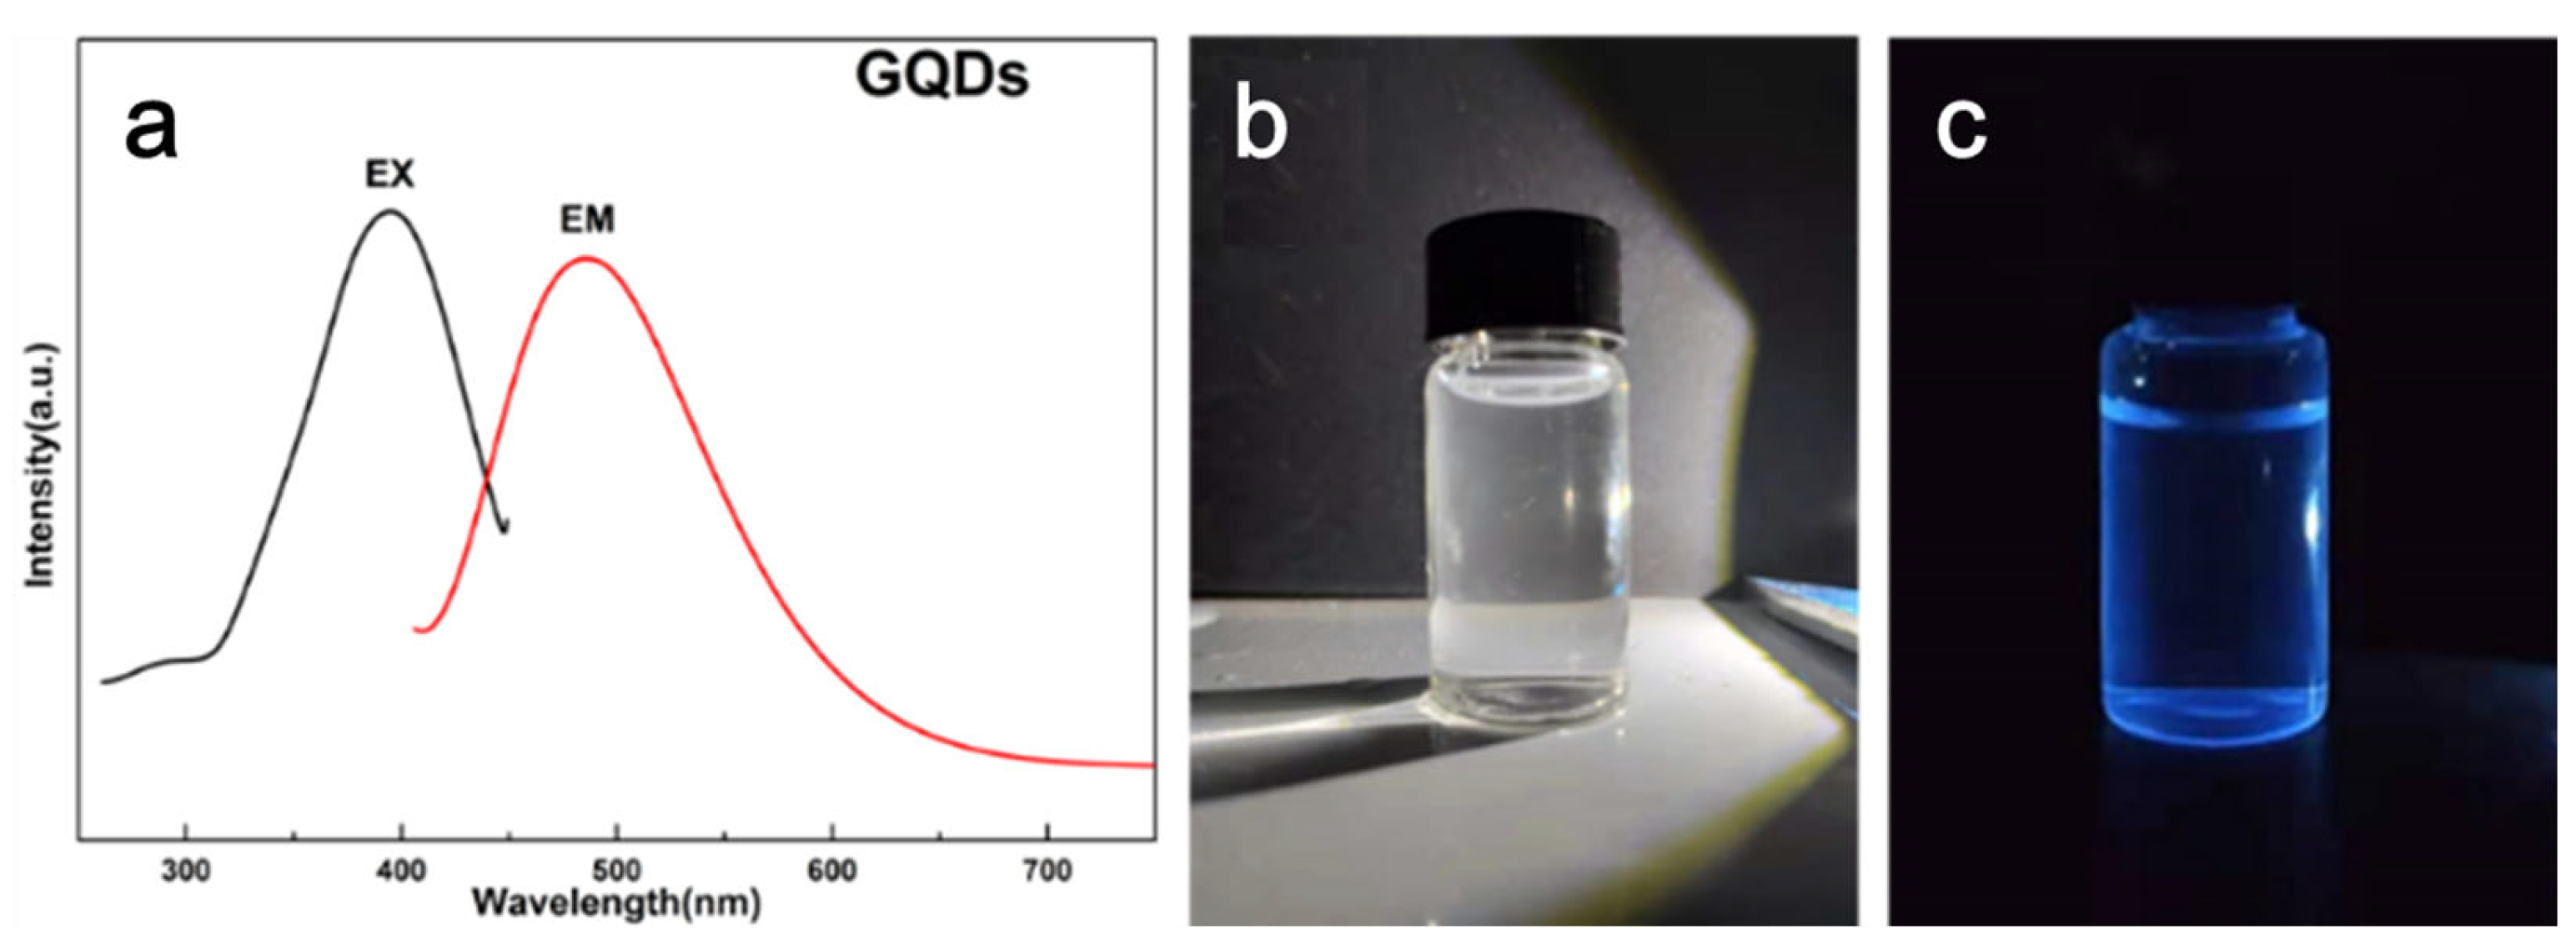
2.2. Preparation of Graphene Quantum Dots (GQDs)
2.3. Preparation of PET/GQDs Nanocomposites and PET/GQDs Nanocomposite Films
2.4. Characterization
3. Results and Discussion
4. Conclusions
Supplementary Materials
Author Contributions
Funding
Institutional Review Board Statement
Data Availability Statement
Conflicts of Interest
References
- Wang, S.; Wen, B. Effect of functional filler morphology on the crystallization behavior and thermal conductivity of PET resin: A comparative study of three different shapes of BN as heterogeneous nucleating agents. Compos. Sci. Technol. 2022, 222, 109346. [Google Scholar] [CrossRef]
- Tsou, C.H.; Ma, Z.L.; Yang, T.; De Guzman, M.R.; Chen, S.; Wu, C.S.; Hu, X.-F.; Huang, X.; Sun, Y.-L.; Gao, C.; et al. Reinforced distiller’s grains as bio-fillers in environment-friendly poly(ethylene terephthalate) composites. Polym. Bull. 2022, 80, 6137–6158. [Google Scholar] [CrossRef]
- Ma, W.; Liu, P.; Xu, D.; Wang, Q. High-strength and antistatic PET/CNTs bead foams prepared by scCO2 foaming and microwave sintering. Polym. Adv. Technol. 2022, 33, 2211–2220. [Google Scholar] [CrossRef]
- Li, X.; Fang, S.G. Preparation and property analysis of kaolin/melamine cyanurate/aluminum diethylphosphinate/recycled PET composites. J. Appl. Polym. Sci. 2023, 140, e53598. [Google Scholar] [CrossRef]
- Li, B.; Zhu, Y.; Wang, X.; Xu, H.; Zhong, Y.; Zhang, L.; Ma, Y.; Sui, X.; Wang, B.; Feng, X.; et al. Synthesis and application of poly (cyclotriphosphazene-resveratrol) microspheres for enhancing flame retardancy of poly (ethylene terephthalate). Polym. Adv. Technol. 2022, 33, 658–671. [Google Scholar] [CrossRef]
- Zhang, W.; Zhang, H.; Yang, L.; Tang, Y.; Tang, P. Enhanced crystallization and properties of poly(ethylene terephthalate) nanocomposites with zeolites from 3D to 2D topologies. J. Ind. Eng. Chem. 2022, 109, 510–520. [Google Scholar] [CrossRef]
- Yin, Y.; Jiang, B.; Meng, L. Research on synthesis and thermal properties of poly(ethylene terephthalate) sulfonate group containing ionomer. J. Appl. Polym. Sci. 2021, 138, 49966. [Google Scholar] [CrossRef]
- Gaonkar, A.A.; Murudkar, V.V.; Deshpande, V.D. Comparison of crystallization kinetics of polyethylene terephthalate (PET) and reorganized PET. Thermochim. Acta 2020, 683, 178472. [Google Scholar] [CrossRef]
- Tian, Y.; Cen, H.; Zheng, X.; Zeng, Z.; Xu, W.; Hu, T.; Gong, X.; Hu, C.; Wu, C. Enhancing the crystallinity and heat resistance of poly(ethylene terephthalate) using ZnCl2-ionized polyamide-66 as a heterogeneous nucleator. J. Appl. Polym. Sci. 2023, 140, e53358. [Google Scholar] [CrossRef]
- Zhang, Y.; Wang, Y.; Li, H.; Gong, X.; Liu, J.; Huang, L.; Wang, W.; Wang, Y.; Zhao, Z.; Belfiore, L.A.; et al. Fluorescent SiO2@Tb3+(PET-TEG)3Phen hybrids as nucleating additive for enhancement of crystallinity of PET. Polymers 2020, 12, 568. [Google Scholar] [CrossRef] [PubMed]
- Hao, T.; Wang, Y.; Zhang, M.; Liu, Z.; Liu, J.; Huang, L.; Li, J.; Peng, Y.; Tang, J. The addition of GO-SiO2 to synthesis polyethylene terephthalate composite with enhanced crystalline and mechanical properties. J. Mater. Res. Technol. 2022, 18, 1746–1753. [Google Scholar] [CrossRef]
- Gao, W.; Li, Y.; Zhao, J.; Tang, W.; Zhang, Z.; Wang, J.; Wu, Z.; Li, M. Nucleation and thermal stability enhancements in poly(ethylene terephthalate) composites influenced by graphene oxide. J. Therm. Anal. Calorim. 2023, 148, 2401–2415. [Google Scholar] [CrossRef]
- Wang, Y.; Wang, Z.; Zhu, J.; Li, H.; Zhang, Z.; Yu, X. A comparative study on the reinforcement effect of polyethylene terephthalate composites by inclusion of two types of functionalized graphene. Colloid Polym. Sci. 2021, 299, 1853–1861. [Google Scholar] [CrossRef]
- Li, J.; Li, B.; Huang, S.; Luo, S.; He, S.; Gao, C.; Liu, S. Epoxy chain extender grafted pyrophyllite/poly(ethylene terephthalate) composites with enhanced crystallinity and mechanical properties. Polym. Compos. 2022, 43, 6404–6415. [Google Scholar] [CrossRef]
- Durmus, A.; Ercan, N.; Soyubol, G.; Deligöz, H.; Kaşgöz, A. Nonisothermal crystallization kinetics of poly(ethylene terephthalate)/clay nanocomposites prepared by melt processing. Polym. Compos. 2010, 31, 1056–1066. [Google Scholar] [CrossRef]
- Gong, X.; Pan, L.; Tang, C.Y.; Chen, L.; Hao, Z.; Law, W.-C.; Wang, X.; Tsui, C.P.; Wu, C. Preparation, optical and thermal properties of CdSe-ZnS/poly(lactic acid) (PLA) nanocomposites. Compos. Part B Eng. 2014, 66, 494–499. [Google Scholar] [CrossRef]
- Yin, Y.; Meng, L. Improve the compatibility and crystallization ability of polyhedral oligomeric silsesquioxanes and poly (ethylene terephthalate) by using transesterification method. J. Appl. Polym. Sci. 2022, 139, 51779. [Google Scholar] [CrossRef]
- Zhang, X.; Zhao, S.; Mohamed, M.G.; Kuo, S.-W.; Xin, Z. Crystallization behaviors of poly(ethylene terephthalate) (PET) with monosilane isobutyl-polyhedral oligomeric silsesquioxanes (POSS). J. Mater. Sci. 2020, 55, 14642–14655. [Google Scholar] [CrossRef]
- Qu, D.; Cai, J.; Huang, F.; Zhang, J.; Zuo, H.; Sun, S.; Liu, J.; Bai, Y. High-Performance Optical PET Analysis via Non-Isothermal Crystallization Kinetics. Polymers 2022, 14, 3044. [Google Scholar] [CrossRef] [PubMed]
- Dong, S.; Jia, Y.; Xu, X.; Luo, J.; Han, J.; Sun, X. Crystallization and properties of poly(ethylene terephthalate)/layered double hydroxide nanocomposites. J. Colloid Interface Sci. 2019, 539, 54–64. [Google Scholar] [CrossRef] [PubMed]
- Yin, Y.; Wang, Y.; Meng, L. UIO-66 as nucleating agent on the crystallization behavior and properties of poly (ethylene terephthalate). Polymers 2021, 13, 2266. [Google Scholar] [CrossRef] [PubMed]
- Dominici, F.; Sarasini, F.; Luzi, F.; Torre, L.; Puglia, D. Thermomechanical and Morphological Properties of Poly(ethylene terephthalate)/Anhydrous Calcium Terephthalate Nanocomposites. Polymers 2020, 12, 276. [Google Scholar] [CrossRef]
- Lung, Q.N.D.; Chu, R.J.; Kim, Y.; Laryn, T.; Madarang, M.A.; Kovalchuk, O. Graphene/III-V Quantum Dot Mixed-Dimensional Heterostructure for Enhanced Radiative Recombinations via Hole Carrier Transfer. Nano Lett. 2023, 23, 3344–3351. [Google Scholar] [CrossRef] [PubMed]
- Wang, R.N.; Sun, R.F.; Zhong, T.H.; Chi, Y.W. Fabrication of a Dispersible Large-sized Graphene Quantum Dot Assemblies from Graphene Oxide and Its Electrogenerated Chemiluminescence Behaviors. Chem. J. Chin. Univ. Chin. 2022, 43, 20220161. [Google Scholar] [CrossRef]
- Al-Azmi, A.; Keshipour, S. New bidental sulfur-doped graphene quantum dots modified with gold as a catalyst for hydrogen generation. J. Colloid Interface Sci. 2022, 612, 701–709. [Google Scholar] [CrossRef] [PubMed]
- Dong, Y.; Shao, J.; Chen, C.; Li, H.; Wang, R.; Chi, Y.; Lin, X.; Chen, G. Blue luminescent graphene quantum dots and graphene oxide prepared by tuning the carbonization degree of citric acid. Carbon 2012, 50, 4738–4743. [Google Scholar] [CrossRef]
- Chen, W.; Lv, G.; Hu, W.; Li, D.; Chen, S.; Dai, Z. Synthesis and applications of graphene quantum dots: A review. Nanotechnol. Rev. 2018, 7, 157–185. [Google Scholar] [CrossRef]
- Wang, Y.; Wang, Y.; Zhang, M.; Liu, J.; Huang, L.; Wang, Y.; Hao, T.; Li, J.; Tang, J. Preparation of QDs@SiO2-PEG-LMPET and its influence on crystallization and luminescence of polyethylene terephthalate. Nanotechnology 2021, 32, 225706. [Google Scholar] [CrossRef] [PubMed]
- Wang, C.; Li, C.; Zhen, W.; Zhao, L.; Wang, S.; Huang, S. Preparation, Crystallization Behavior, Simultaneous Spectroscopic and Rheological Characterization of Polyphenylene Sulfide/Graphene Quantum Dots Nanocomposites. Macromol. Chem. Phys. 2022, 223, 2200149. [Google Scholar] [CrossRef]
- Gong, X.; Pan, L.; Tang, C.Y.; Chen, L.; Li, C.; Wu, C.; Law, W.-C.; Wang, X.; Tsui, C.P.; Xie, X. Investigating the crystallization behavior of poly(lactic acid) using CdSe/ZnS quantum dots as heterogeneous nucleating agents. Compos. Part B Eng. 2016, 91, 103–110. [Google Scholar] [CrossRef]
- Monti, M.; Scrivani, M.T.; Kociolek, I.; Larsen, Å.G.; Olafsen, K.; Lambertini, V. Enhanced impact strength of recycled PET/glass fiber composites. Polymers 2021, 13, 1471. [Google Scholar] [CrossRef] [PubMed]
- Kir, S.; Dehri, I.; Onal, Y.; Esen, R.; Basar, C.A. The investigation of structural alteration of raw materials used to attain graphene quantum dots in different prolysis conditions. Surf. Interfaces 2022, 29, 101679. [Google Scholar] [CrossRef]
- Kaur, A.; Pandey, K.; Kaur, R.; Vashishat, N.; Kaur, M. nanocomposites of carbon quantum dots and graphene quantum dots: Environmental applications as sensors. Chemosensors 2022, 10, 367. [Google Scholar]
- Durodola, S.S.; ·Adekunle, A.S.; Olasunkanmi, L.O.; Oyekunle, J.A.O.; Ore, O.T.; Oluwafemi, S.O. A review on graphene quantum dots for electrochemical detection of emerging pollutants. J. Fluoresc. 2022, 32, 2223–2236. [Google Scholar] [CrossRef]
- Shen, L.; Zhou, S.; Huang, F.; Zhou, H.; Zhang, H.; Wang, S.; Zhou, S. Nitrogen-doped graphene quantum dots synthesized by femtosecond laser ablation in liquid from laser induced graphene. Nanotechnology 2022, 33, 115602. [Google Scholar] [CrossRef]
- Yue, C.; Zhao, L.; Guan, L.; Zhang, X.; Qu, C.; Wang, D.; Weng, L. Vitrimeric silicone composite with high thermal conductivity and high repairing efficiency as thermal interface materials. J. Colloid Interface Sci. 2022, 620, 273–283. [Google Scholar] [CrossRef]
- Ravi, T.M.S.; Naveen, K.; Vishvanathperumal, S.; Navaneethakrishnanet, V. Modeling tensile modulus of nanoclay-filled ethylene–propylene–diene monomer/styrene–butadiene rubber using composite theories. J. Rubber Res. 2021, 24, 847–856. [Google Scholar] [CrossRef]
- Vyazovkin, S. Jeziorny method should be avoided in avrami analysis of nonisothermal crystallization. Polymers 2023, 15, 197. [Google Scholar] [CrossRef] [PubMed]
- Vyazovkin, S.; Sbirrazzuoli, N. Isoconversional approach to evaluating the Hoffman–Lauritzen parameters (U* and Kg) from the overall rates of nonisothermal crystallization. Macromol. Rapid Commun. 2010, 25, 733–738. [Google Scholar] [CrossRef]
- Farjas, J.; López-Olmedo, J.P.; Roural, P. Model-free isoconversional method applied to polymer crystallization governed by the Hoffman-Lauritzen kinetics. Polymer 2017, 120, 111–118. [Google Scholar] [CrossRef]
- Papageorgiou, G.; Karandrea, E.; Giliopoulos, D.; Papageorgiou, D.; Ladavos, A.; Katerinopoulou, A.; Achilias, D.S.; Triantafyllidis, K.S.; Bikiaris, D.N. Effect of clay structure and type of organomodifier on the thermal properties of poly(ethylene terephthalate) based nanocomposites. Thermochim. Acta 2014, 576, 84–96. [Google Scholar] [CrossRef]
- Raka, K.; Sorrentino, A.; Bogoeva-Gaceva, A. Isothermal crystallization kinetics of polypropylene latex-based nanocomposites with organo-modified clay. J. Polym. Sci. Part B Polym. Phys. 2010, 48, 1927–1938. [Google Scholar] [CrossRef]
- Cai, J.; Liu, M.; Wang, L.; Yao, K.; Li, S.; Xiong, H. Isothermal crystallization kinetics of thermoplastic starch/poly(lactic acid) composites. Carbohydr. Polym. 2011, 86, 941–947. [Google Scholar] [CrossRef]


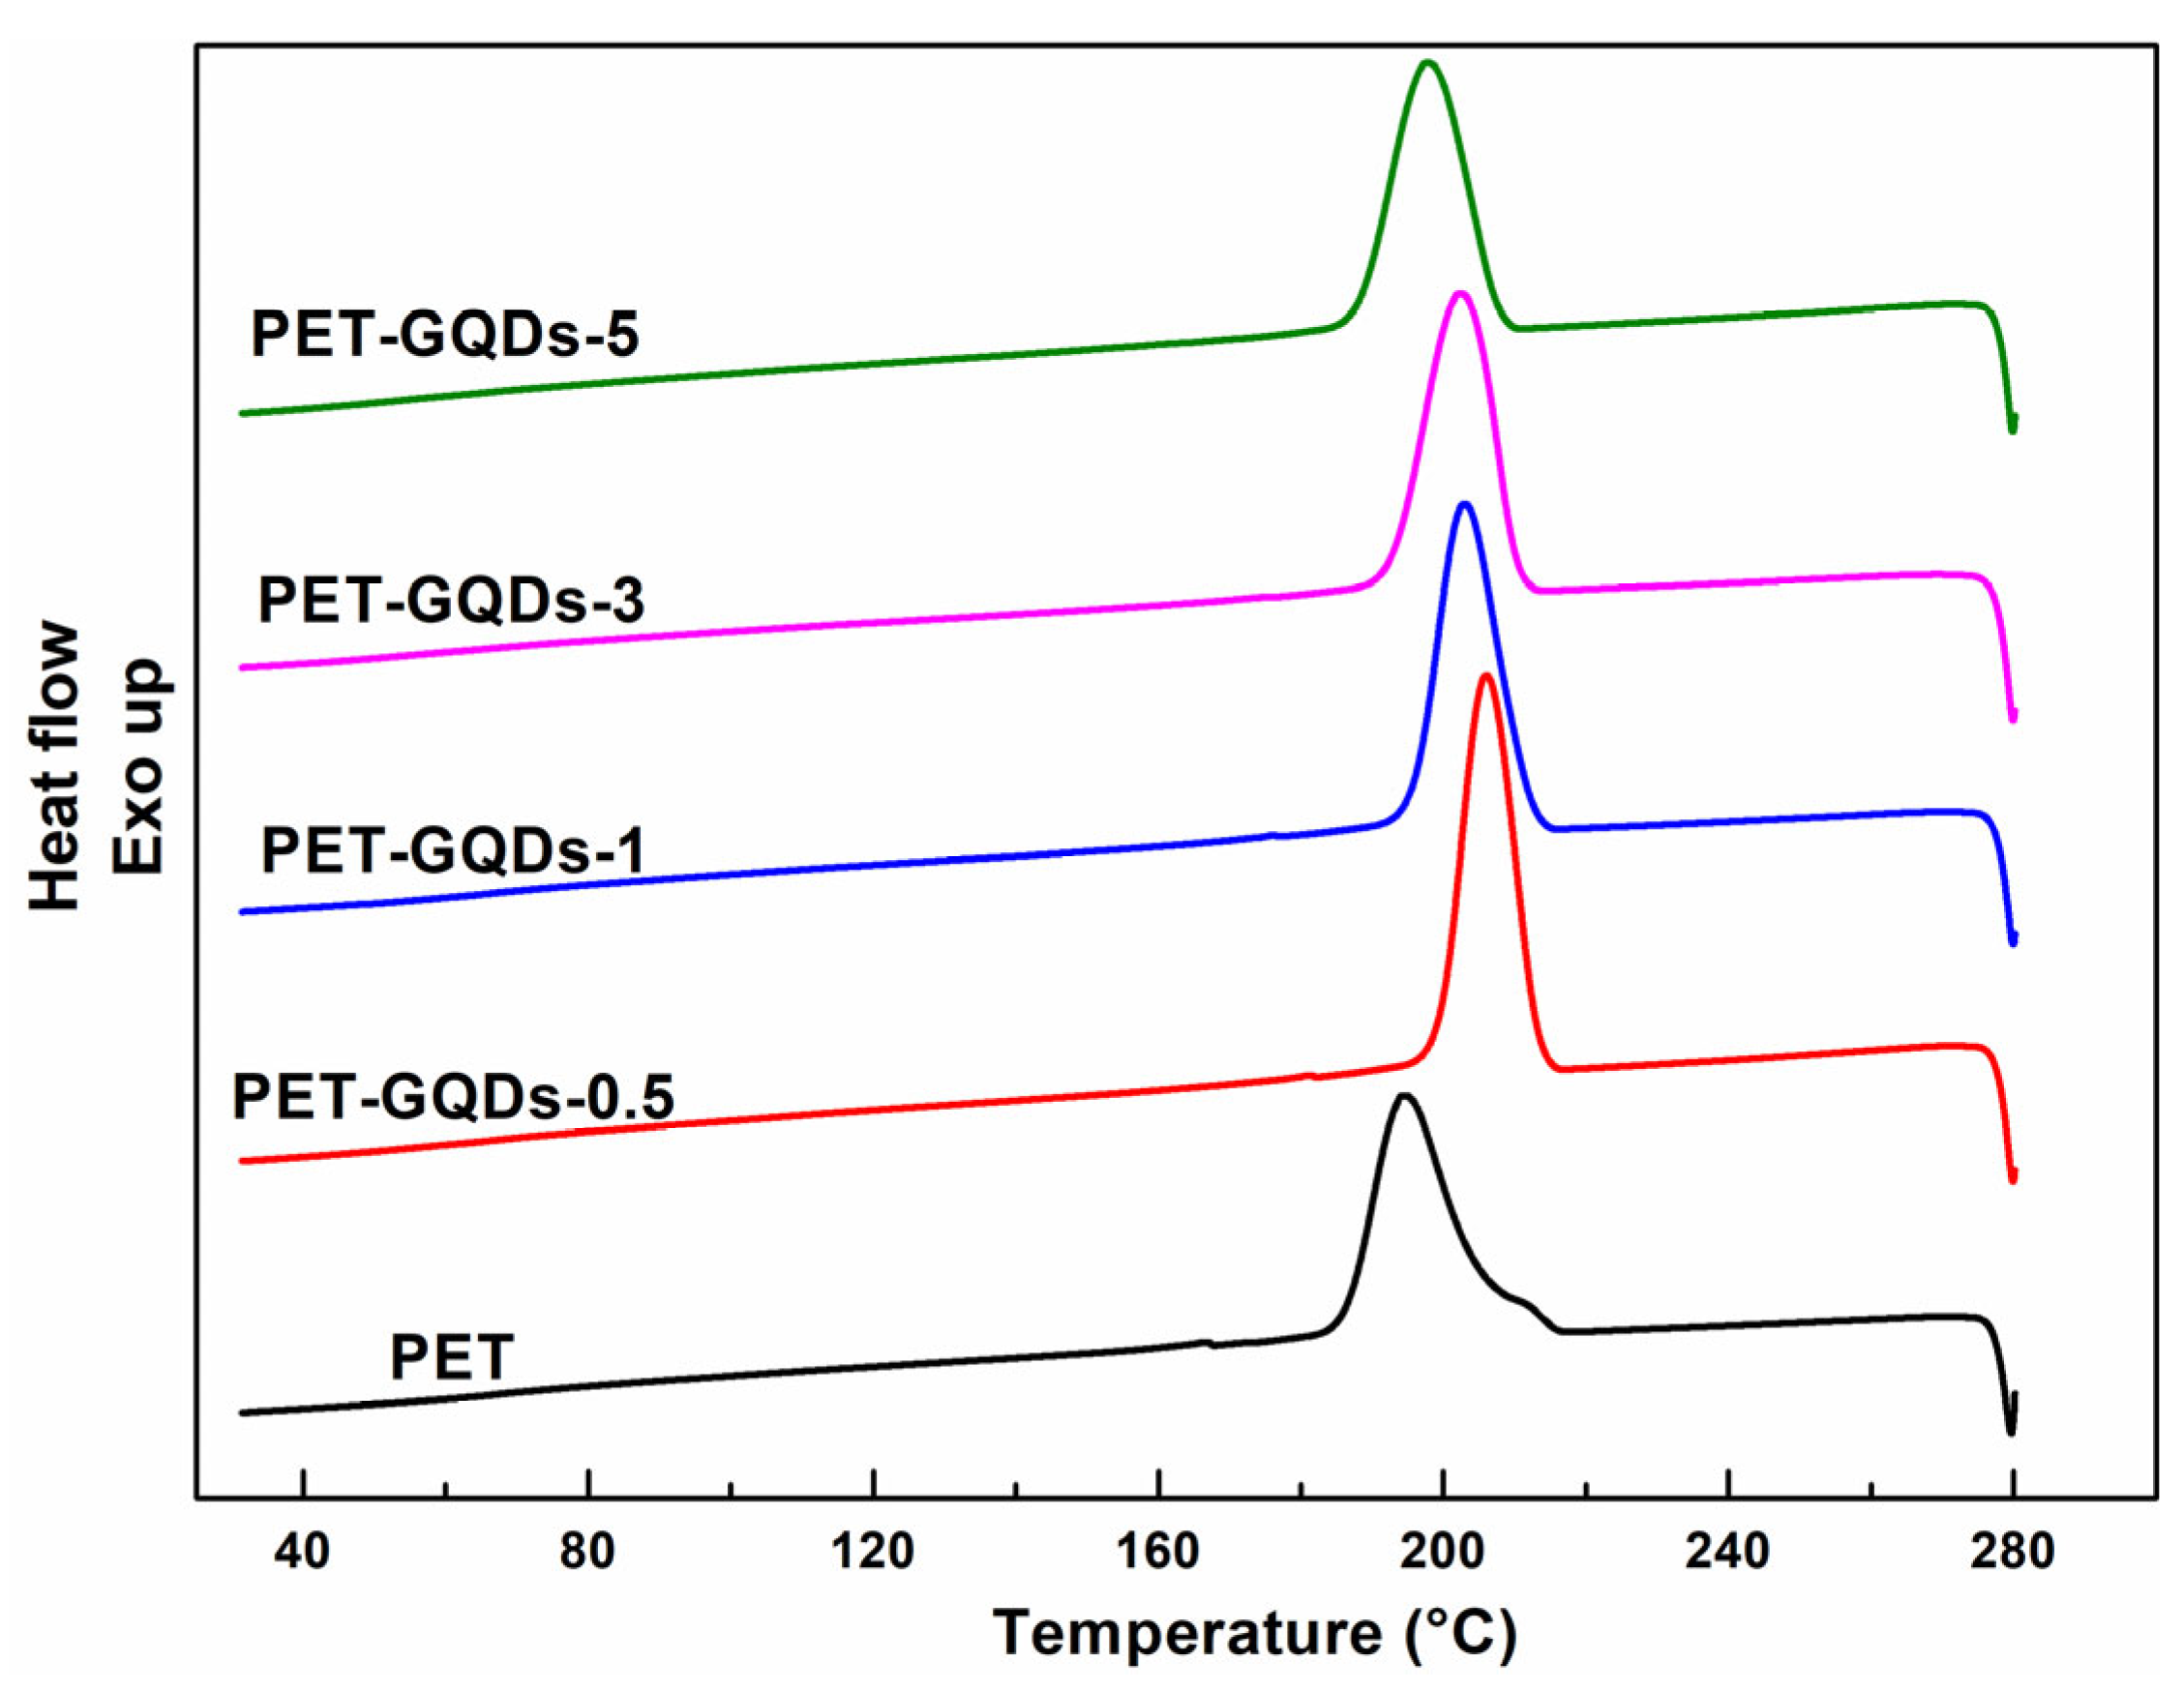
| Sample | Cooling after 1st Heating | |
|---|---|---|
| Tc (°C) | ΔHc (J/g) | |
| PET | 194.3 ± 0.2 | 52.1 ± 0.4 |
| PET-GQDs-0.5 | 206.0 ± 0.1 | 52.3 ± 0.3 |
| PET-GQDs-1 | 202.9 ± 0.1 | 51.9 ± 0.5 |
| PET-GQDs-3 | 202.2 ± 0.2 | 51.4 ± 0.1 |
| PET-GQDs-5 | 197.7 ± 0.3 | 50.4 ± 0.3 |
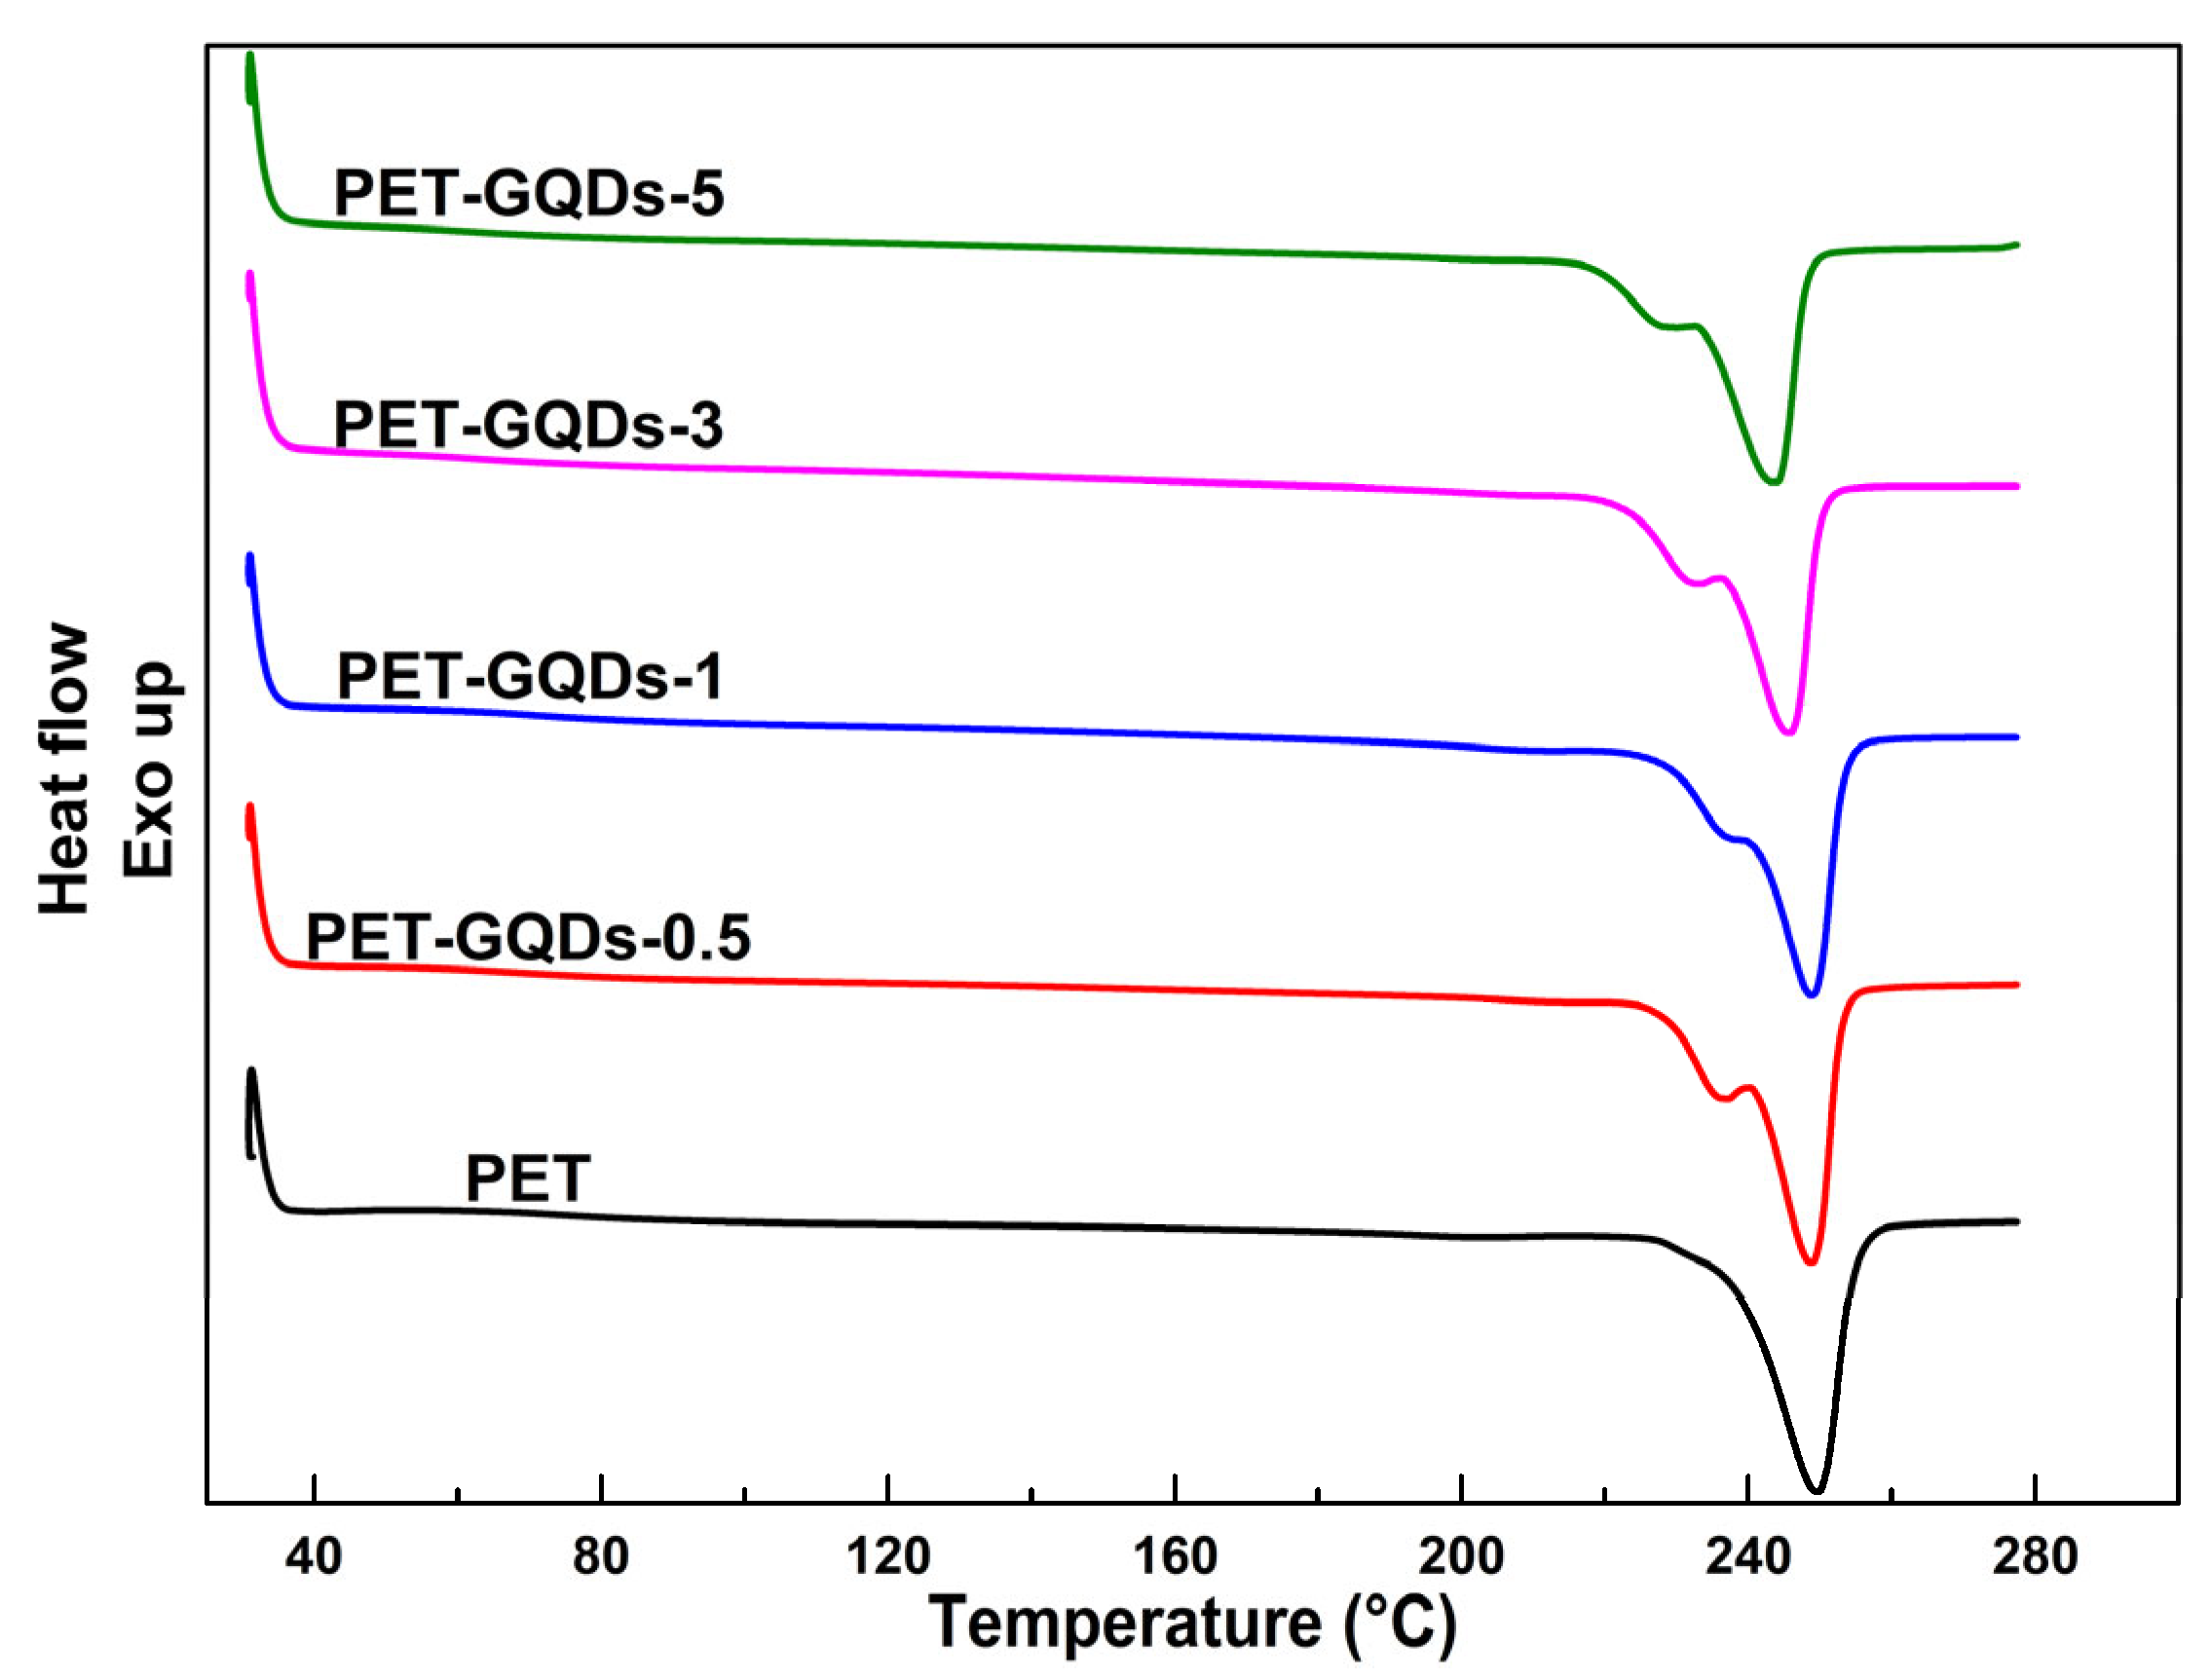
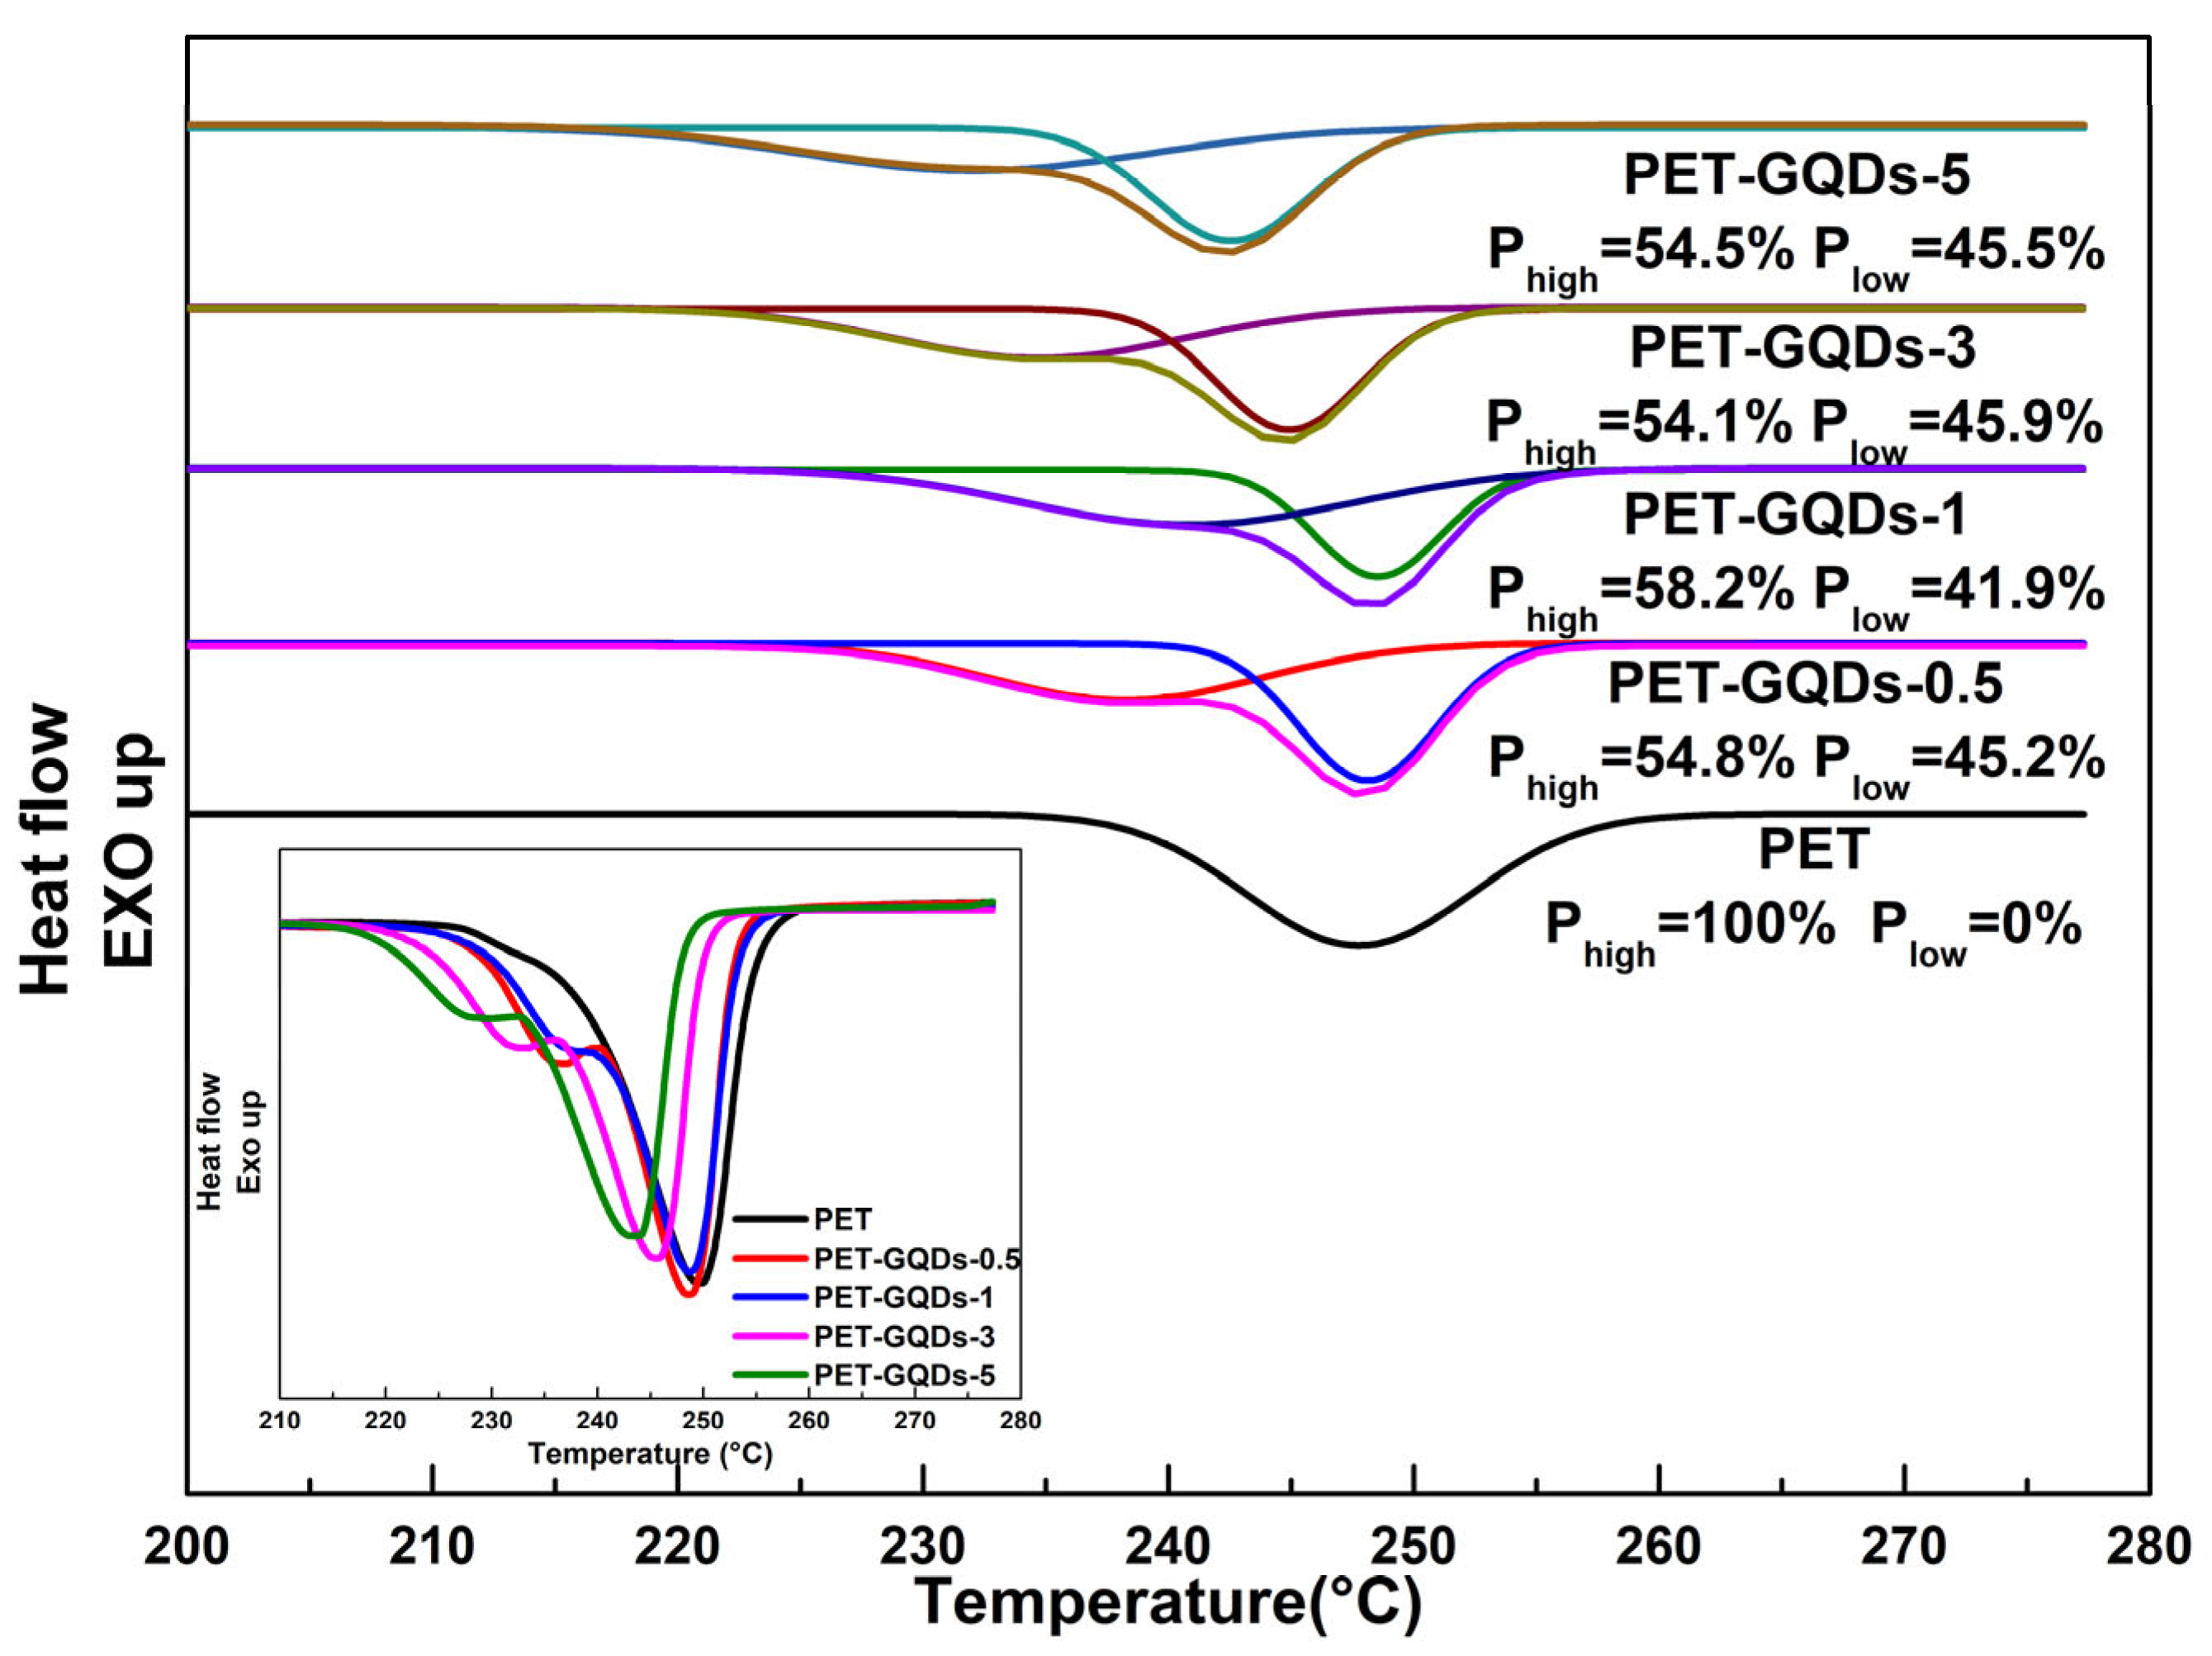
| Sample | Tm1 (°C) | Tm2 (°C) | ΔHm (J/g) | Xc (%) |
|---|---|---|---|---|
| PET | - | 249.7 ± 0.2 | 46.8 ± 0.4 | 33.4 ± 0.1 |
| PET-GQDs-0.5 | 236.9 ± 0.2 | 248.7 ± 0.1 | 50.0 ± 0.6 | 35.9 ± 0.1 |
| PET-GQDs-1 | 238.2 ± 0.2 | 248.8 ± 0.4 | 47.1 ± 0.5 | 34.0 ± 0.2 |
| PET-GQDs-3 | 233.0 ± 0.3 | 245.7 ± 0.4 | 48.4 ± 0.2 | 35.6 ± 0.2 |
| PET-GQDs-5 | 230.0 ± 0.4 | 243.7 ± 0.2 | 47.5 ± 0.5 | 35.7 ± 0.3 |
| Sample | T5% (°C) | T10% (°C) | Tmax (°C) | Residue (%) |
|---|---|---|---|---|
| PET | 405.2 ± 0.3 | 414.6 ± 0.4 | 446.2 ± 0.4 | 13.2 ± 0.1 |
| PET-GQDs-0.5 | 410.1 ± 0.4 | 421.8 ± 0.2 | 453.4 ± 0.5 | 10.4 ± 0.2 |
| PET-GQDs-1 | 407.6 ± 0.2 | 420.5 ± 0.5 | 452.5 ± 0.4 | 12.8 ± 0.2 |
| PET-GQDs-3 | 397.8 ± 0.5 | 417.1 ± 0.2 | 454.0 ± 0.3 | 9.9 ± 0.4 |
| PET-GQDs-5 | 382.6 ± 0.2 | 414.5 ± 0.4 | 453.3 ± 0.2 | 10.1 ± 0.3 |
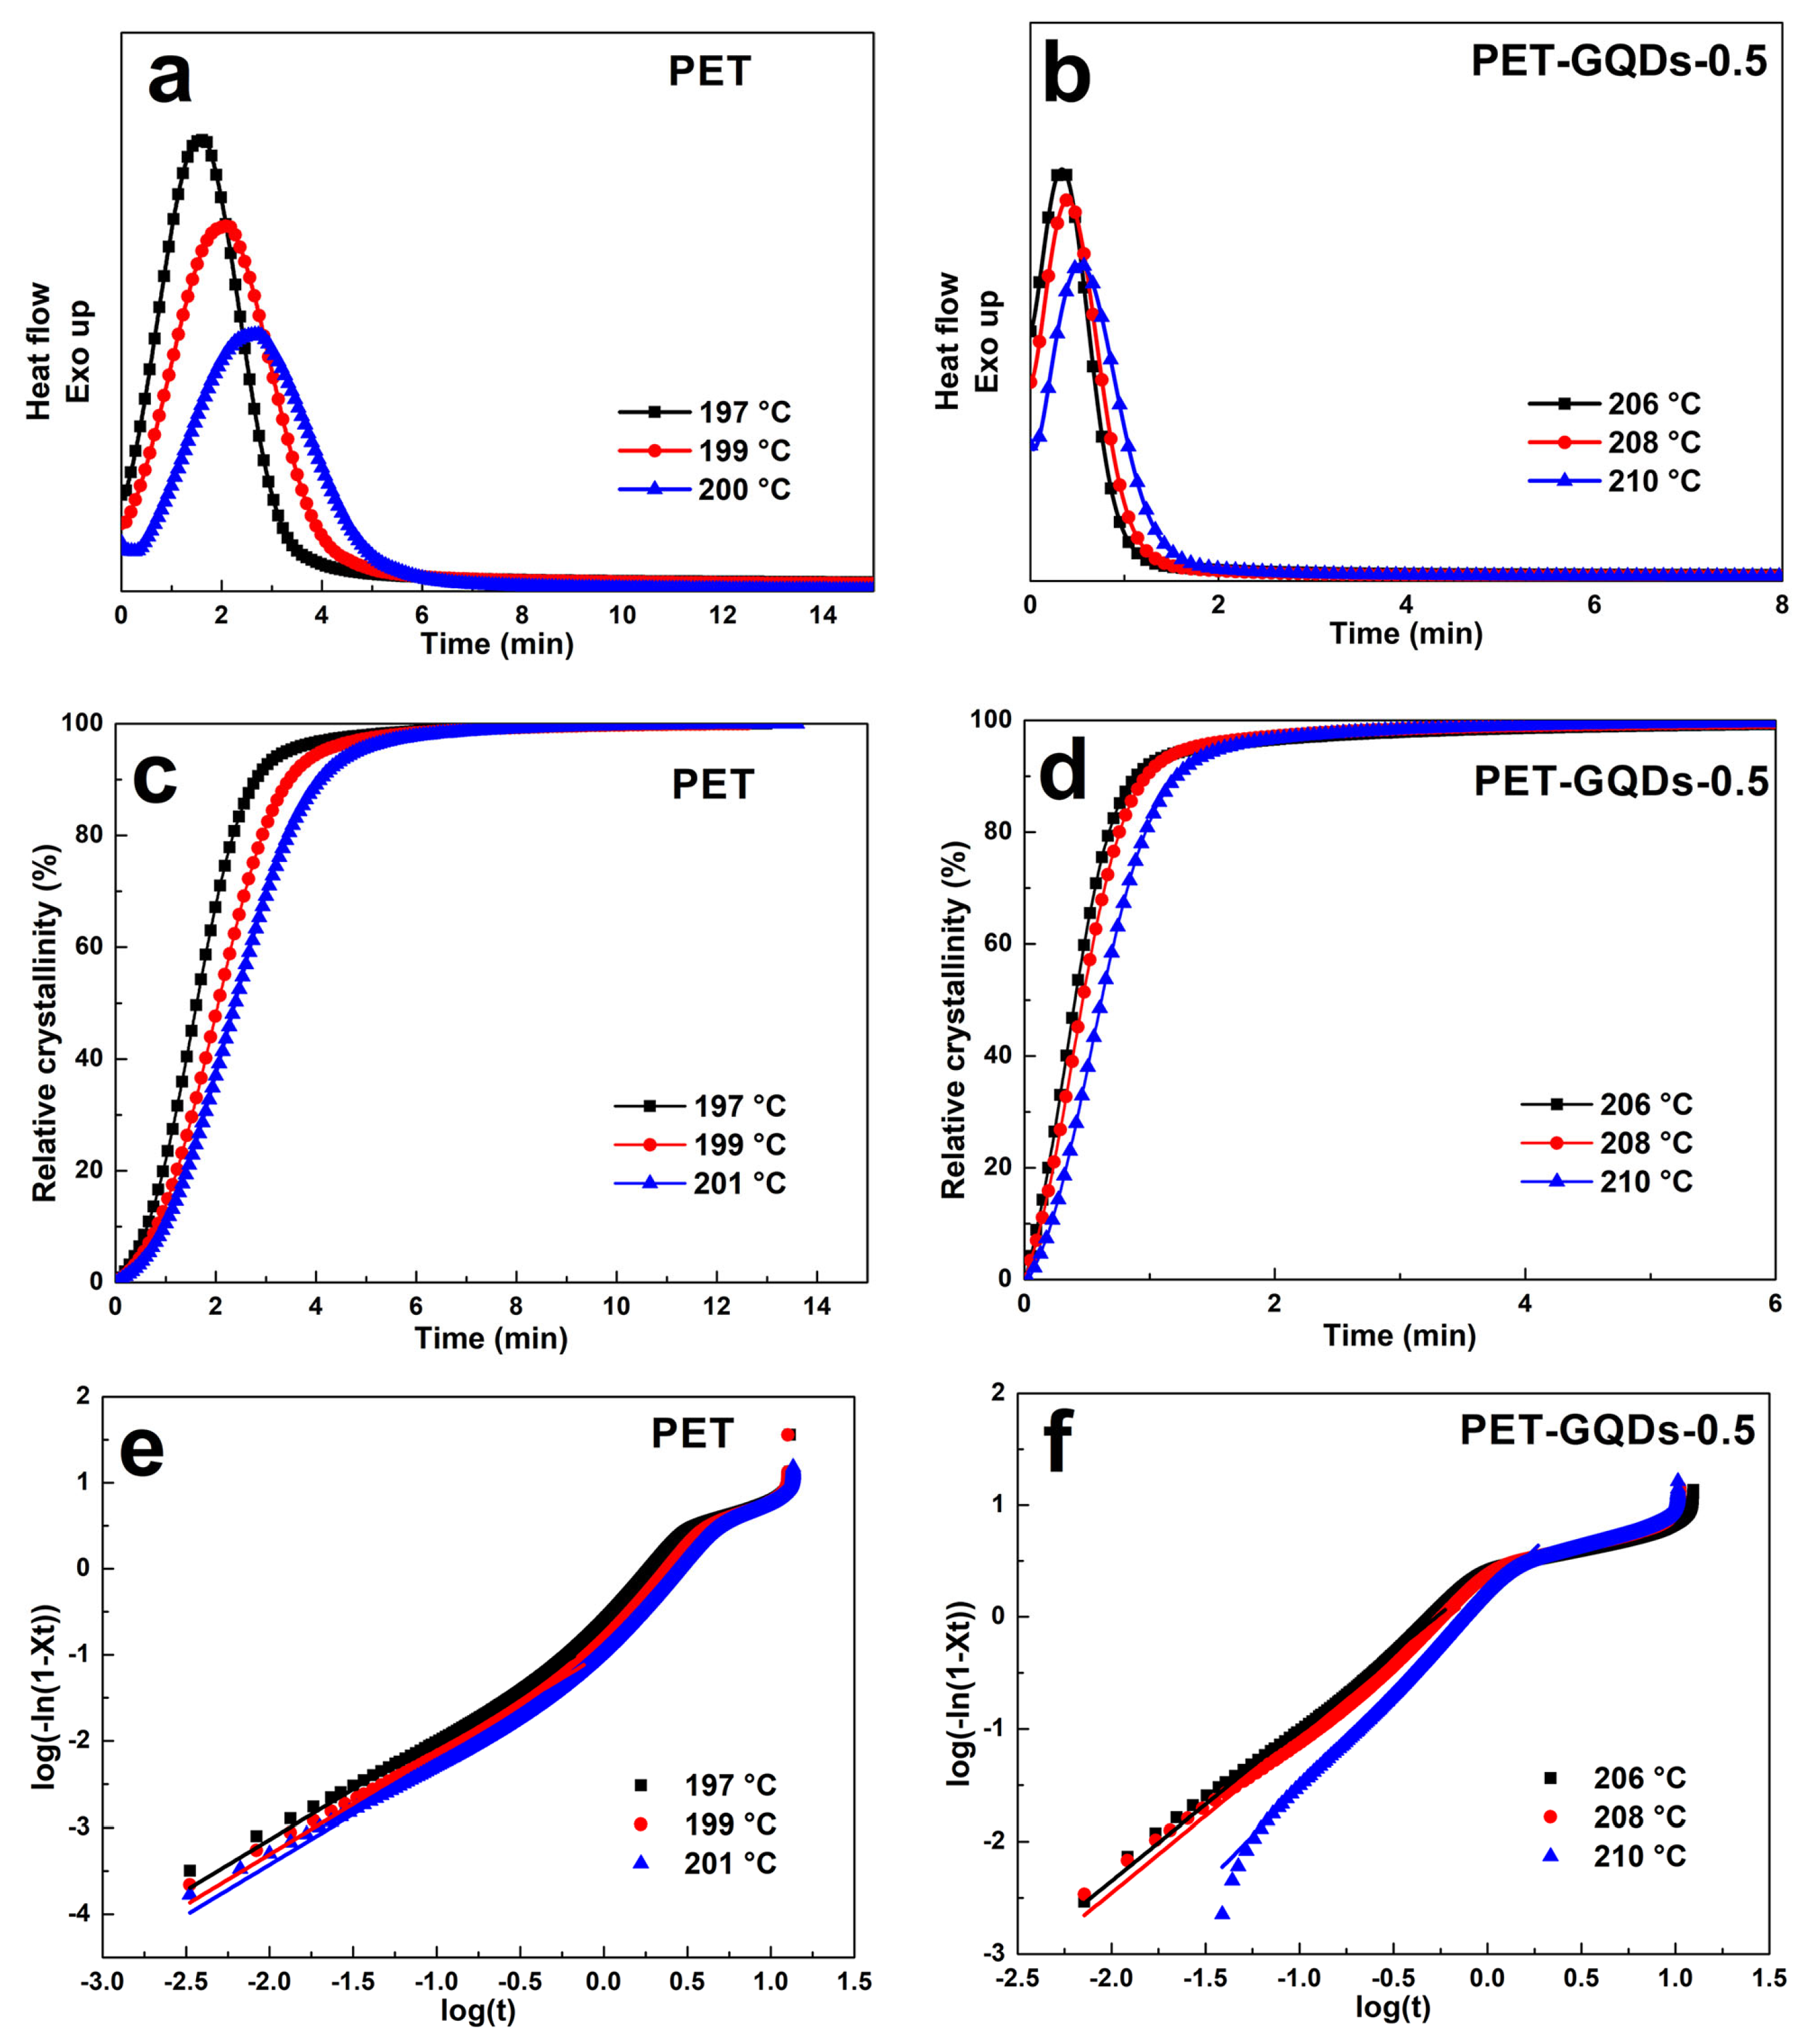
| Samples | T (°C) | n | K (min–1) |
|---|---|---|---|
| PET | 197 | 1.16 ± 0.01 | 0.15 ± 0.02 |
| 199 | 1.15 ± 0.02 | 0.10 ± 0.01 | |
| 201 | 1.16 ± 0.01 | 0.08 ± 0.01 | |
| PET-GQDs-0.5 | 206 | 1.35 ± 0.01 | 2.34 ± 0.03 |
| 208 | 1.37 ± 0.02 | 1.93 ± 0.01 | |
| 210 | 1.70 ± 0.03 | 1.50 ± 0.01 |
Disclaimer/Publisher’s Note: The statements, opinions and data contained in all publications are solely those of the individual author(s) and contributor(s) and not of MDPI and/or the editor(s). MDPI and/or the editor(s) disclaim responsibility for any injury to people or property resulting from any ideas, methods, instructions or products referred to in the content. |
© 2023 by the authors. Licensee MDPI, Basel, Switzerland. This article is an open access article distributed under the terms and conditions of the Creative Commons Attribution (CC BY) license (https://creativecommons.org/licenses/by/4.0/).
Share and Cite
Zhao, L.; Yin, Y.; Xiao, W.; Li, H.; Feng, H.; Wang, D.; Qu, C. Rapid Crystallization and Fluorescence of Poly(ethylene terephthalate) Using Graphene Quantum Dots as Nucleating Agents. Polymers 2023, 15, 3506. https://doi.org/10.3390/polym15173506
Zhao L, Yin Y, Xiao W, Li H, Feng H, Wang D, Qu C. Rapid Crystallization and Fluorescence of Poly(ethylene terephthalate) Using Graphene Quantum Dots as Nucleating Agents. Polymers. 2023; 15(17):3506. https://doi.org/10.3390/polym15173506
Chicago/Turabian StyleZhao, Liwei, Yue Yin, Wanbao Xiao, Hongfeng Li, Hao Feng, Dezhi Wang, and Chunyan Qu. 2023. "Rapid Crystallization and Fluorescence of Poly(ethylene terephthalate) Using Graphene Quantum Dots as Nucleating Agents" Polymers 15, no. 17: 3506. https://doi.org/10.3390/polym15173506
APA StyleZhao, L., Yin, Y., Xiao, W., Li, H., Feng, H., Wang, D., & Qu, C. (2023). Rapid Crystallization and Fluorescence of Poly(ethylene terephthalate) Using Graphene Quantum Dots as Nucleating Agents. Polymers, 15(17), 3506. https://doi.org/10.3390/polym15173506