
Synthesis and Characterization of 𝒌-Carrageenan/PVA Nanocomposite Hydrogels in Combination with MgZnO Nanoparticles to Evaluate the Catechin Release


Abstract
:1. Introduction
2. Materials and Methods
2.1. 𝑘-Carrageenan/PVA Composite Production
2.2. Measurements
2.3. Microstructure Studies
2.4. Texture Analysis
2.5. Catechin Encapsulation
2.6. Study of Entrapment Efficiency and Drug Loading of the Nanocomposites
2.7. Release Studies in Phosphate-Buffered Saline (PBS) Buffer
2.8. Cell Toxicity Studies
2.9. Statistical Analysis
3. Results
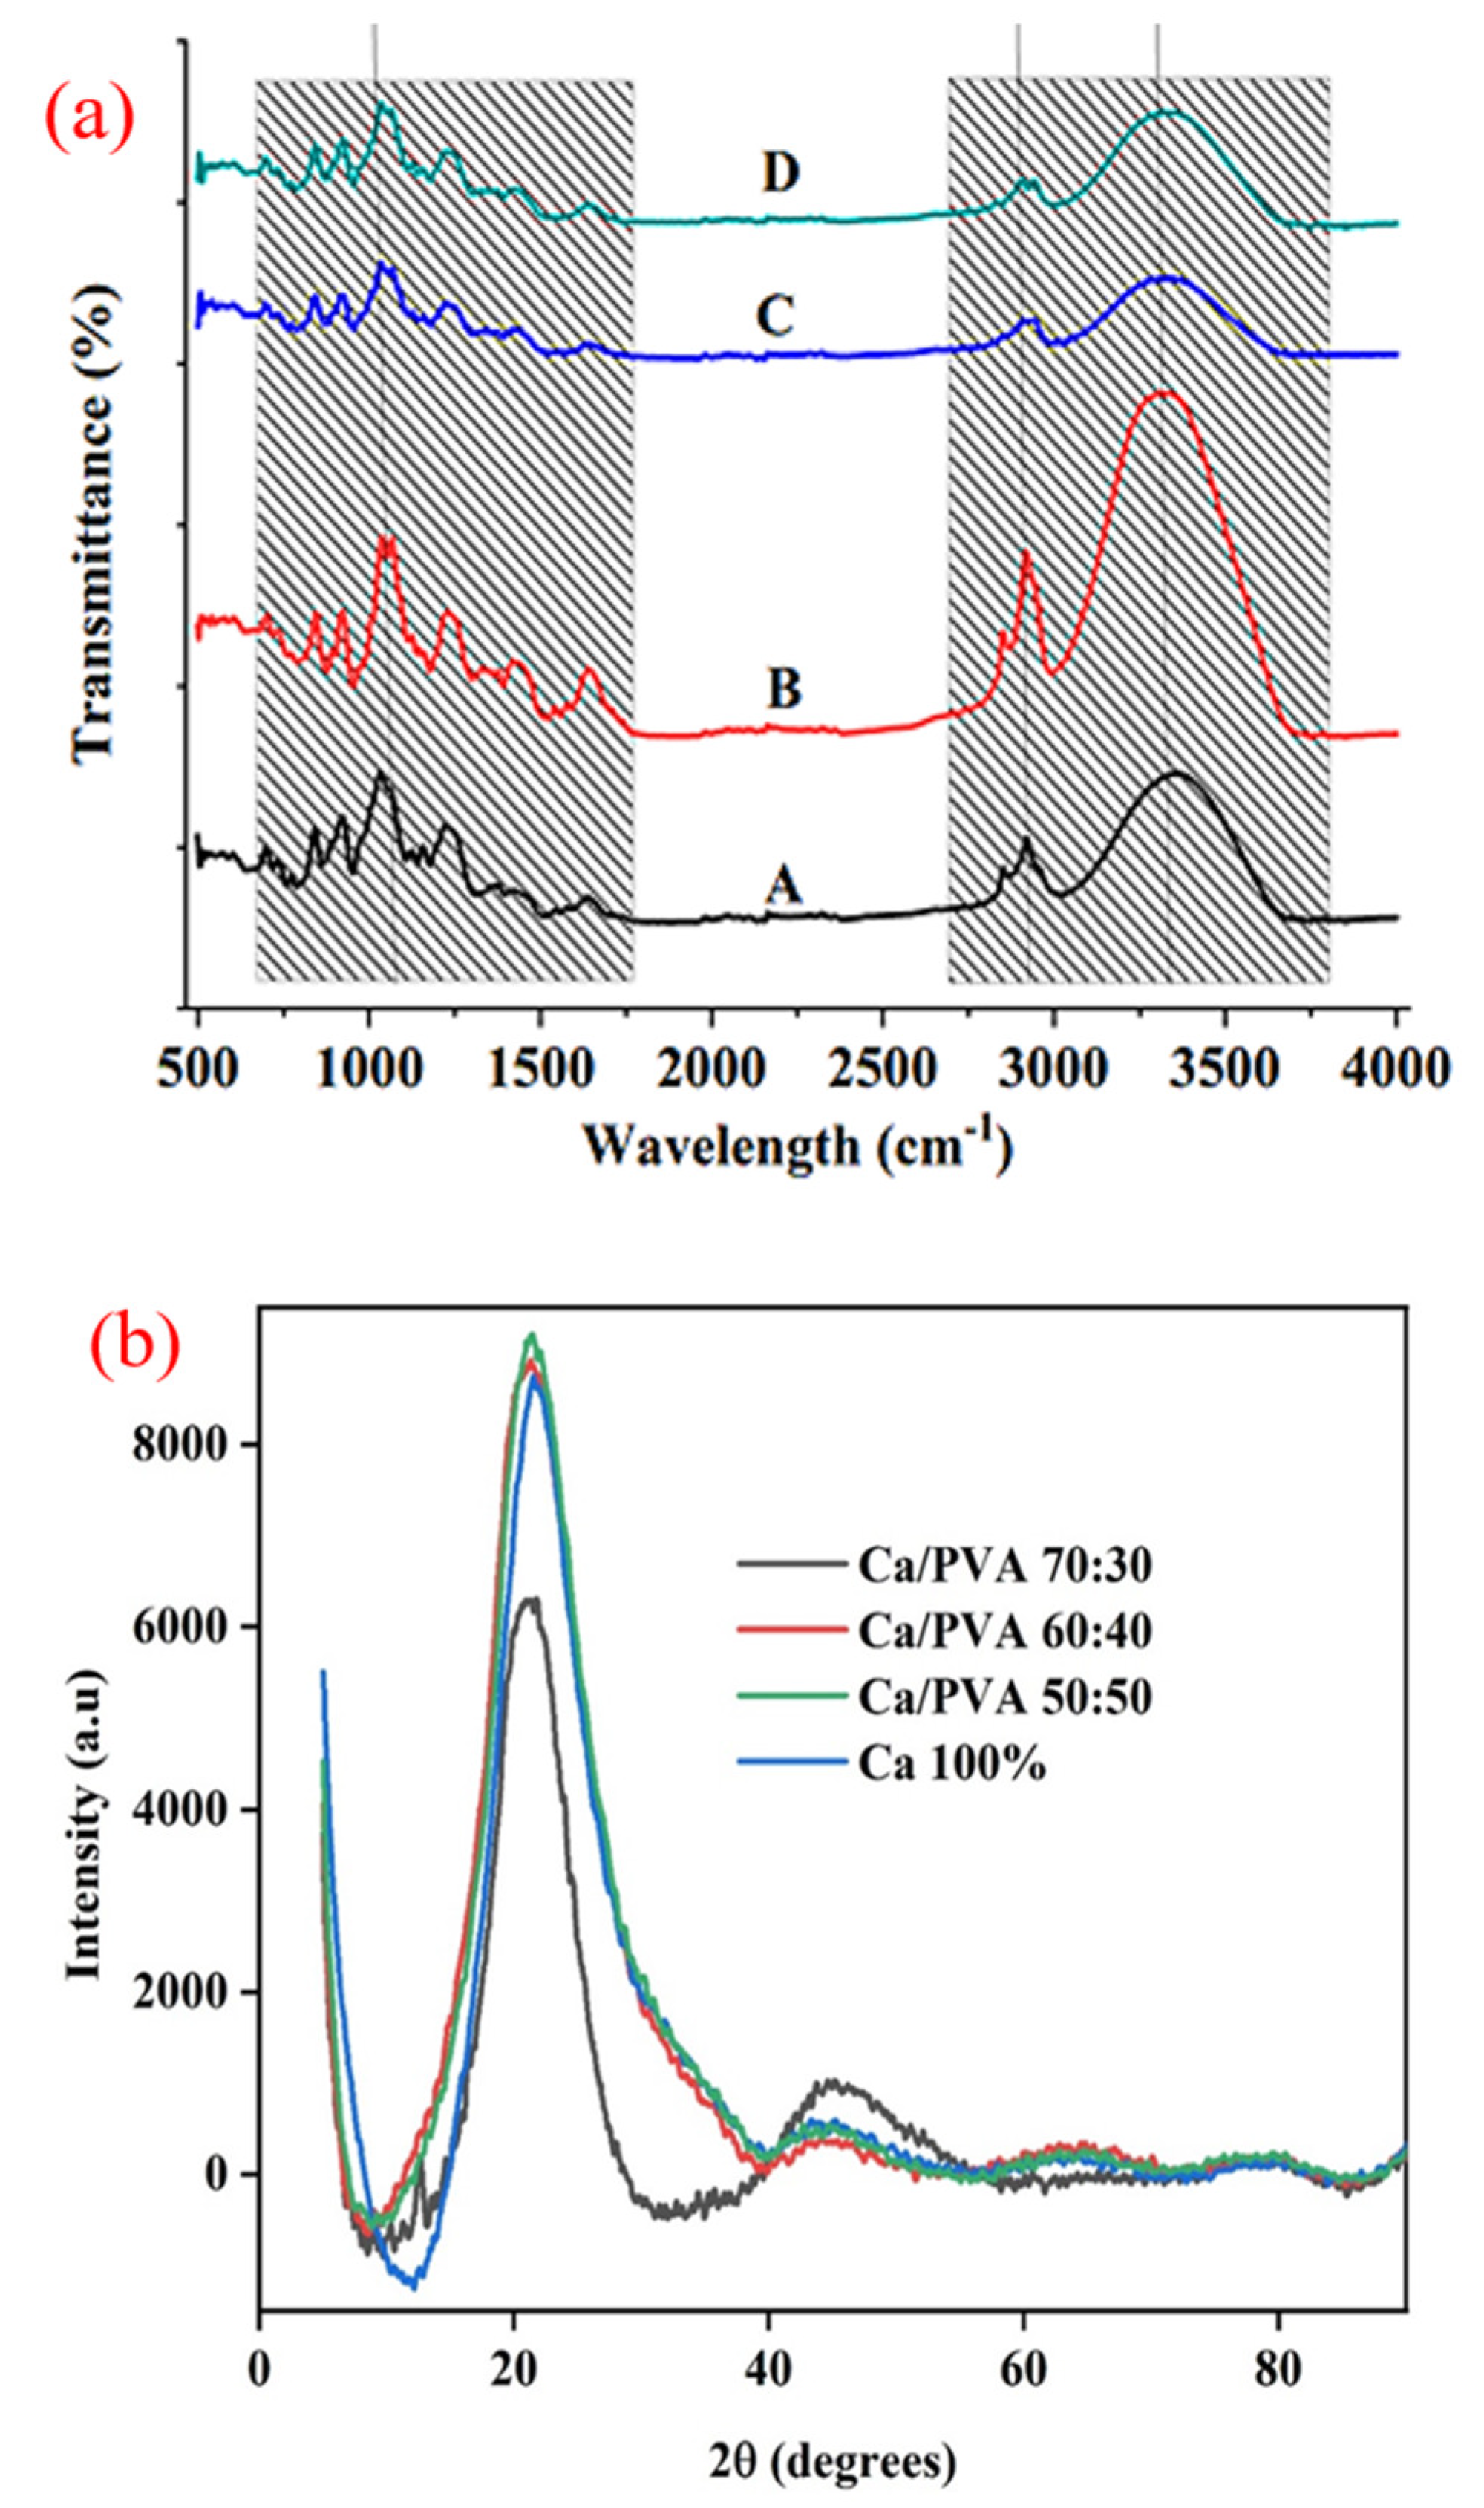
3.1. FTIR and XRD
3.2. TGA
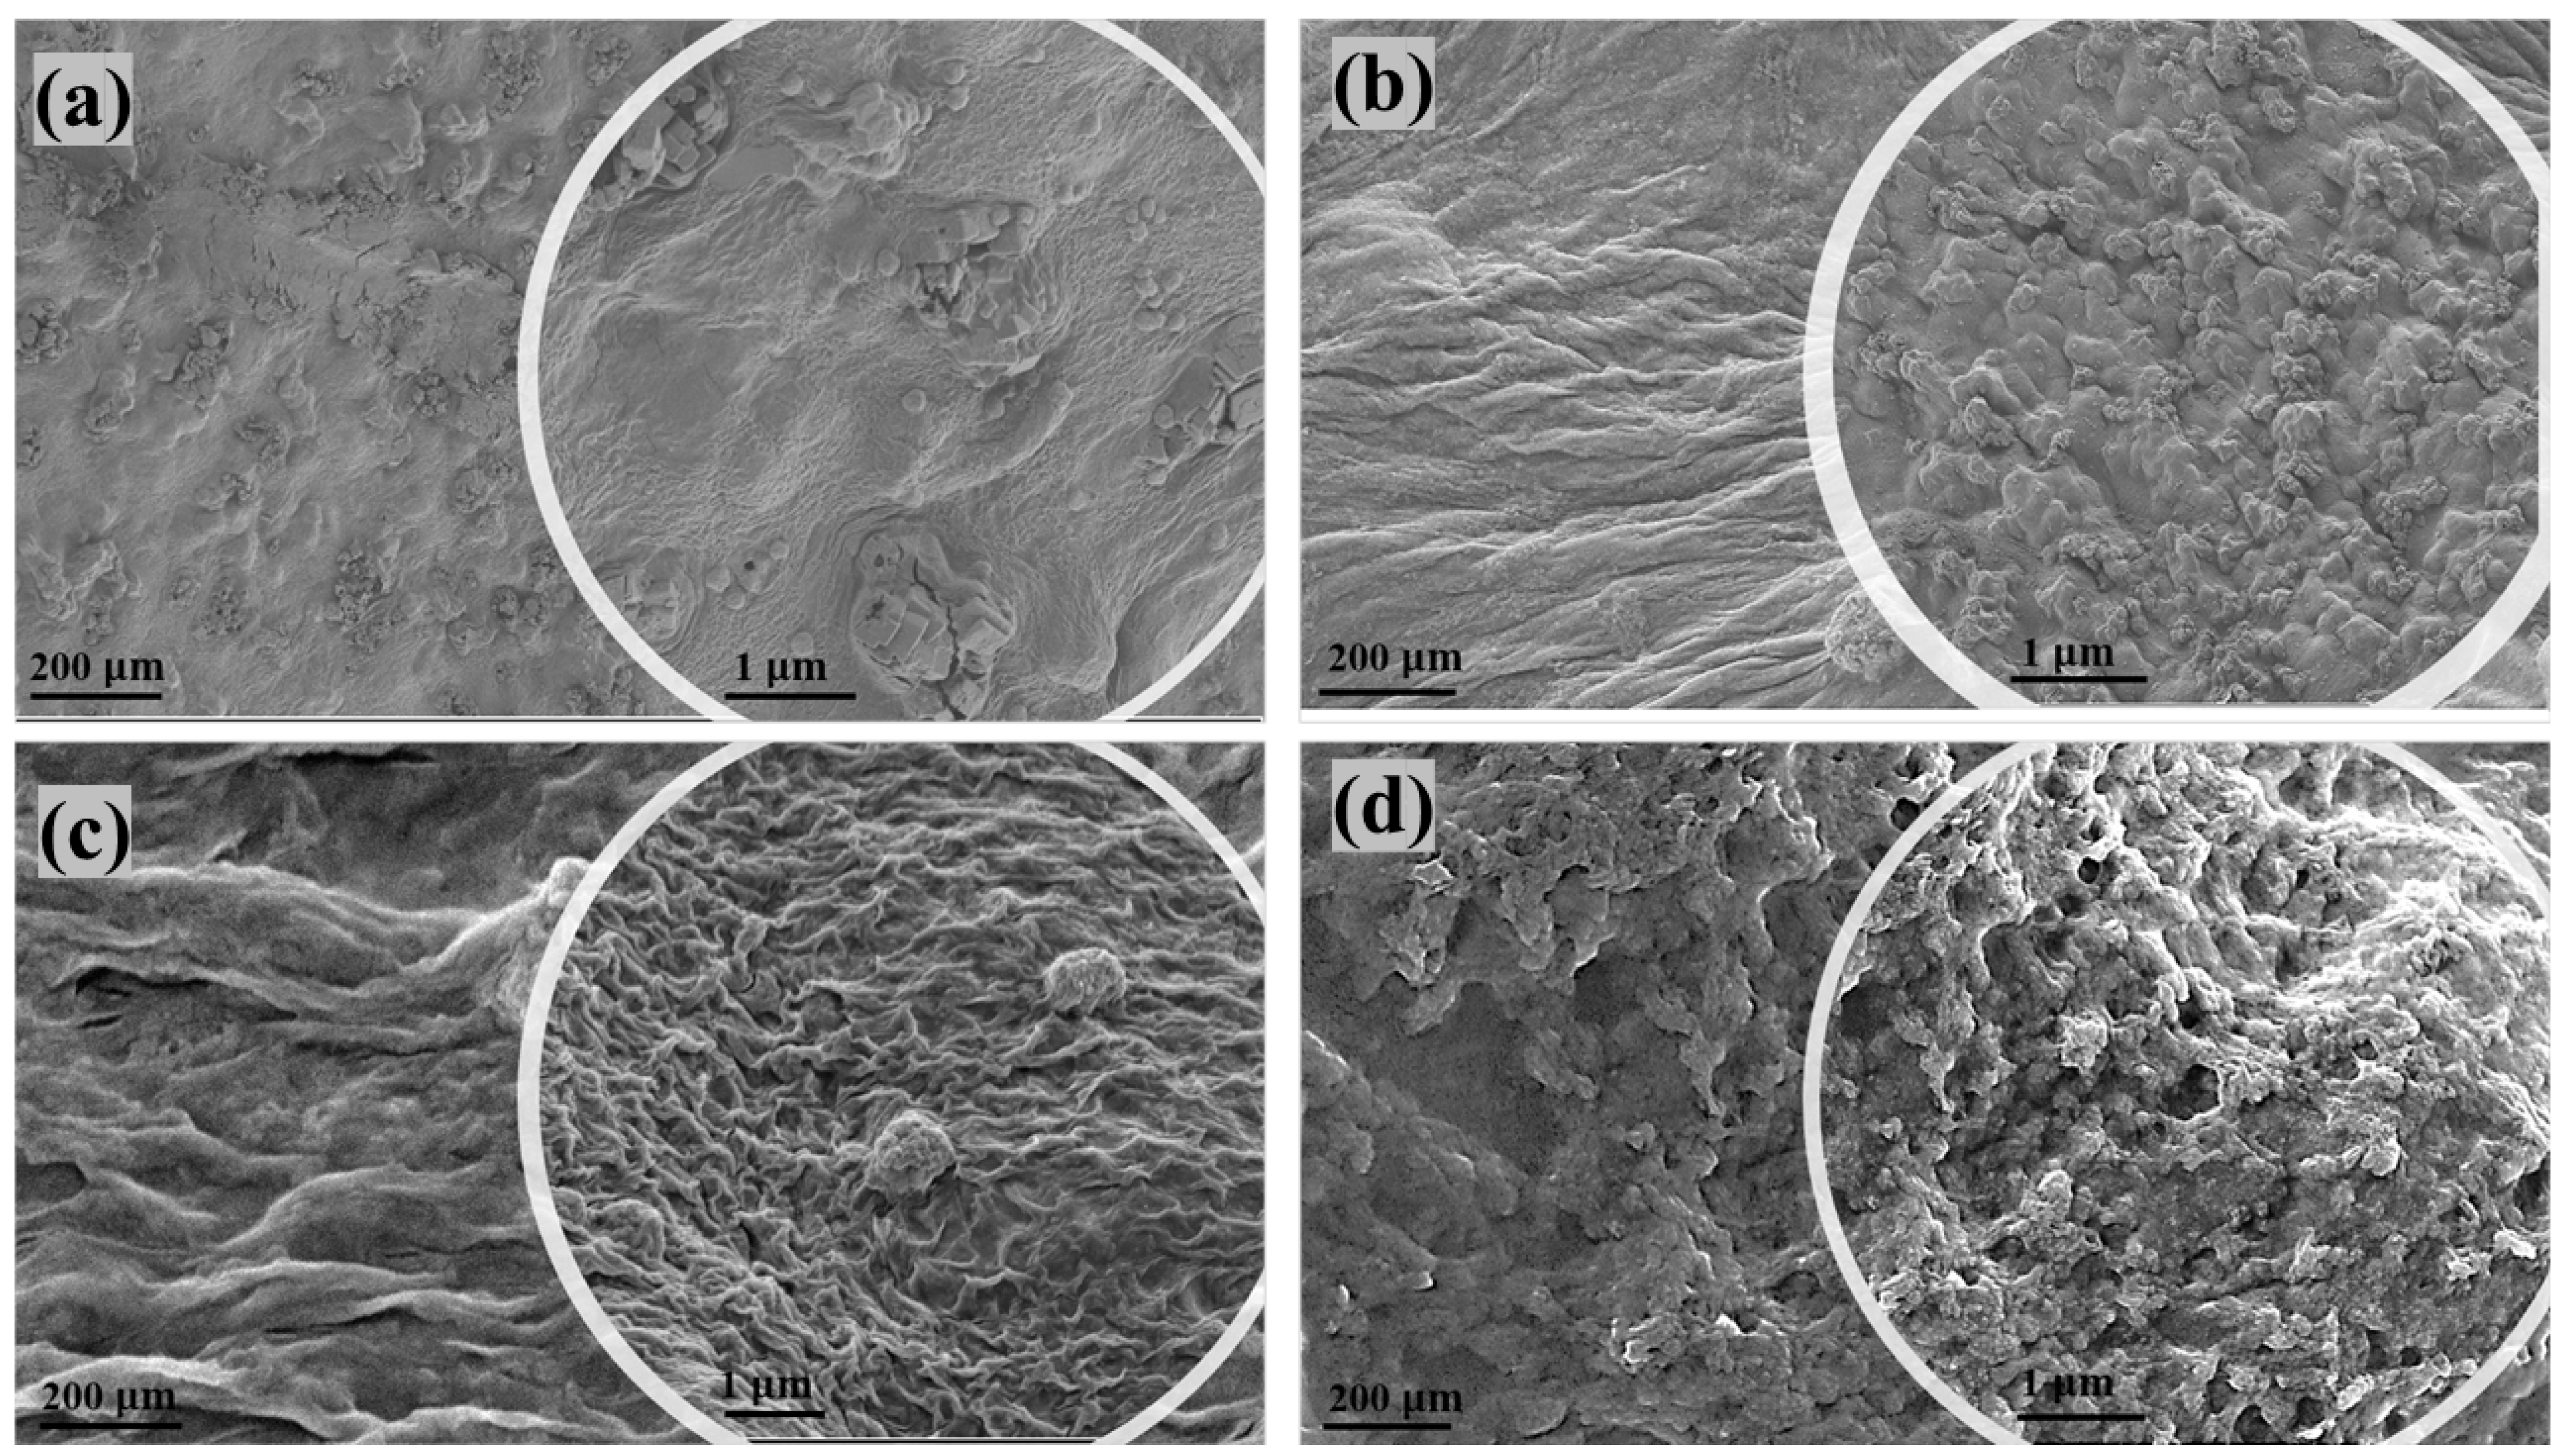
3.3. SEM of Nanocomposites
3.4. Texture Analysis of Nanocomposites
3.5. Drug Loading Capacity of Nanocomposites
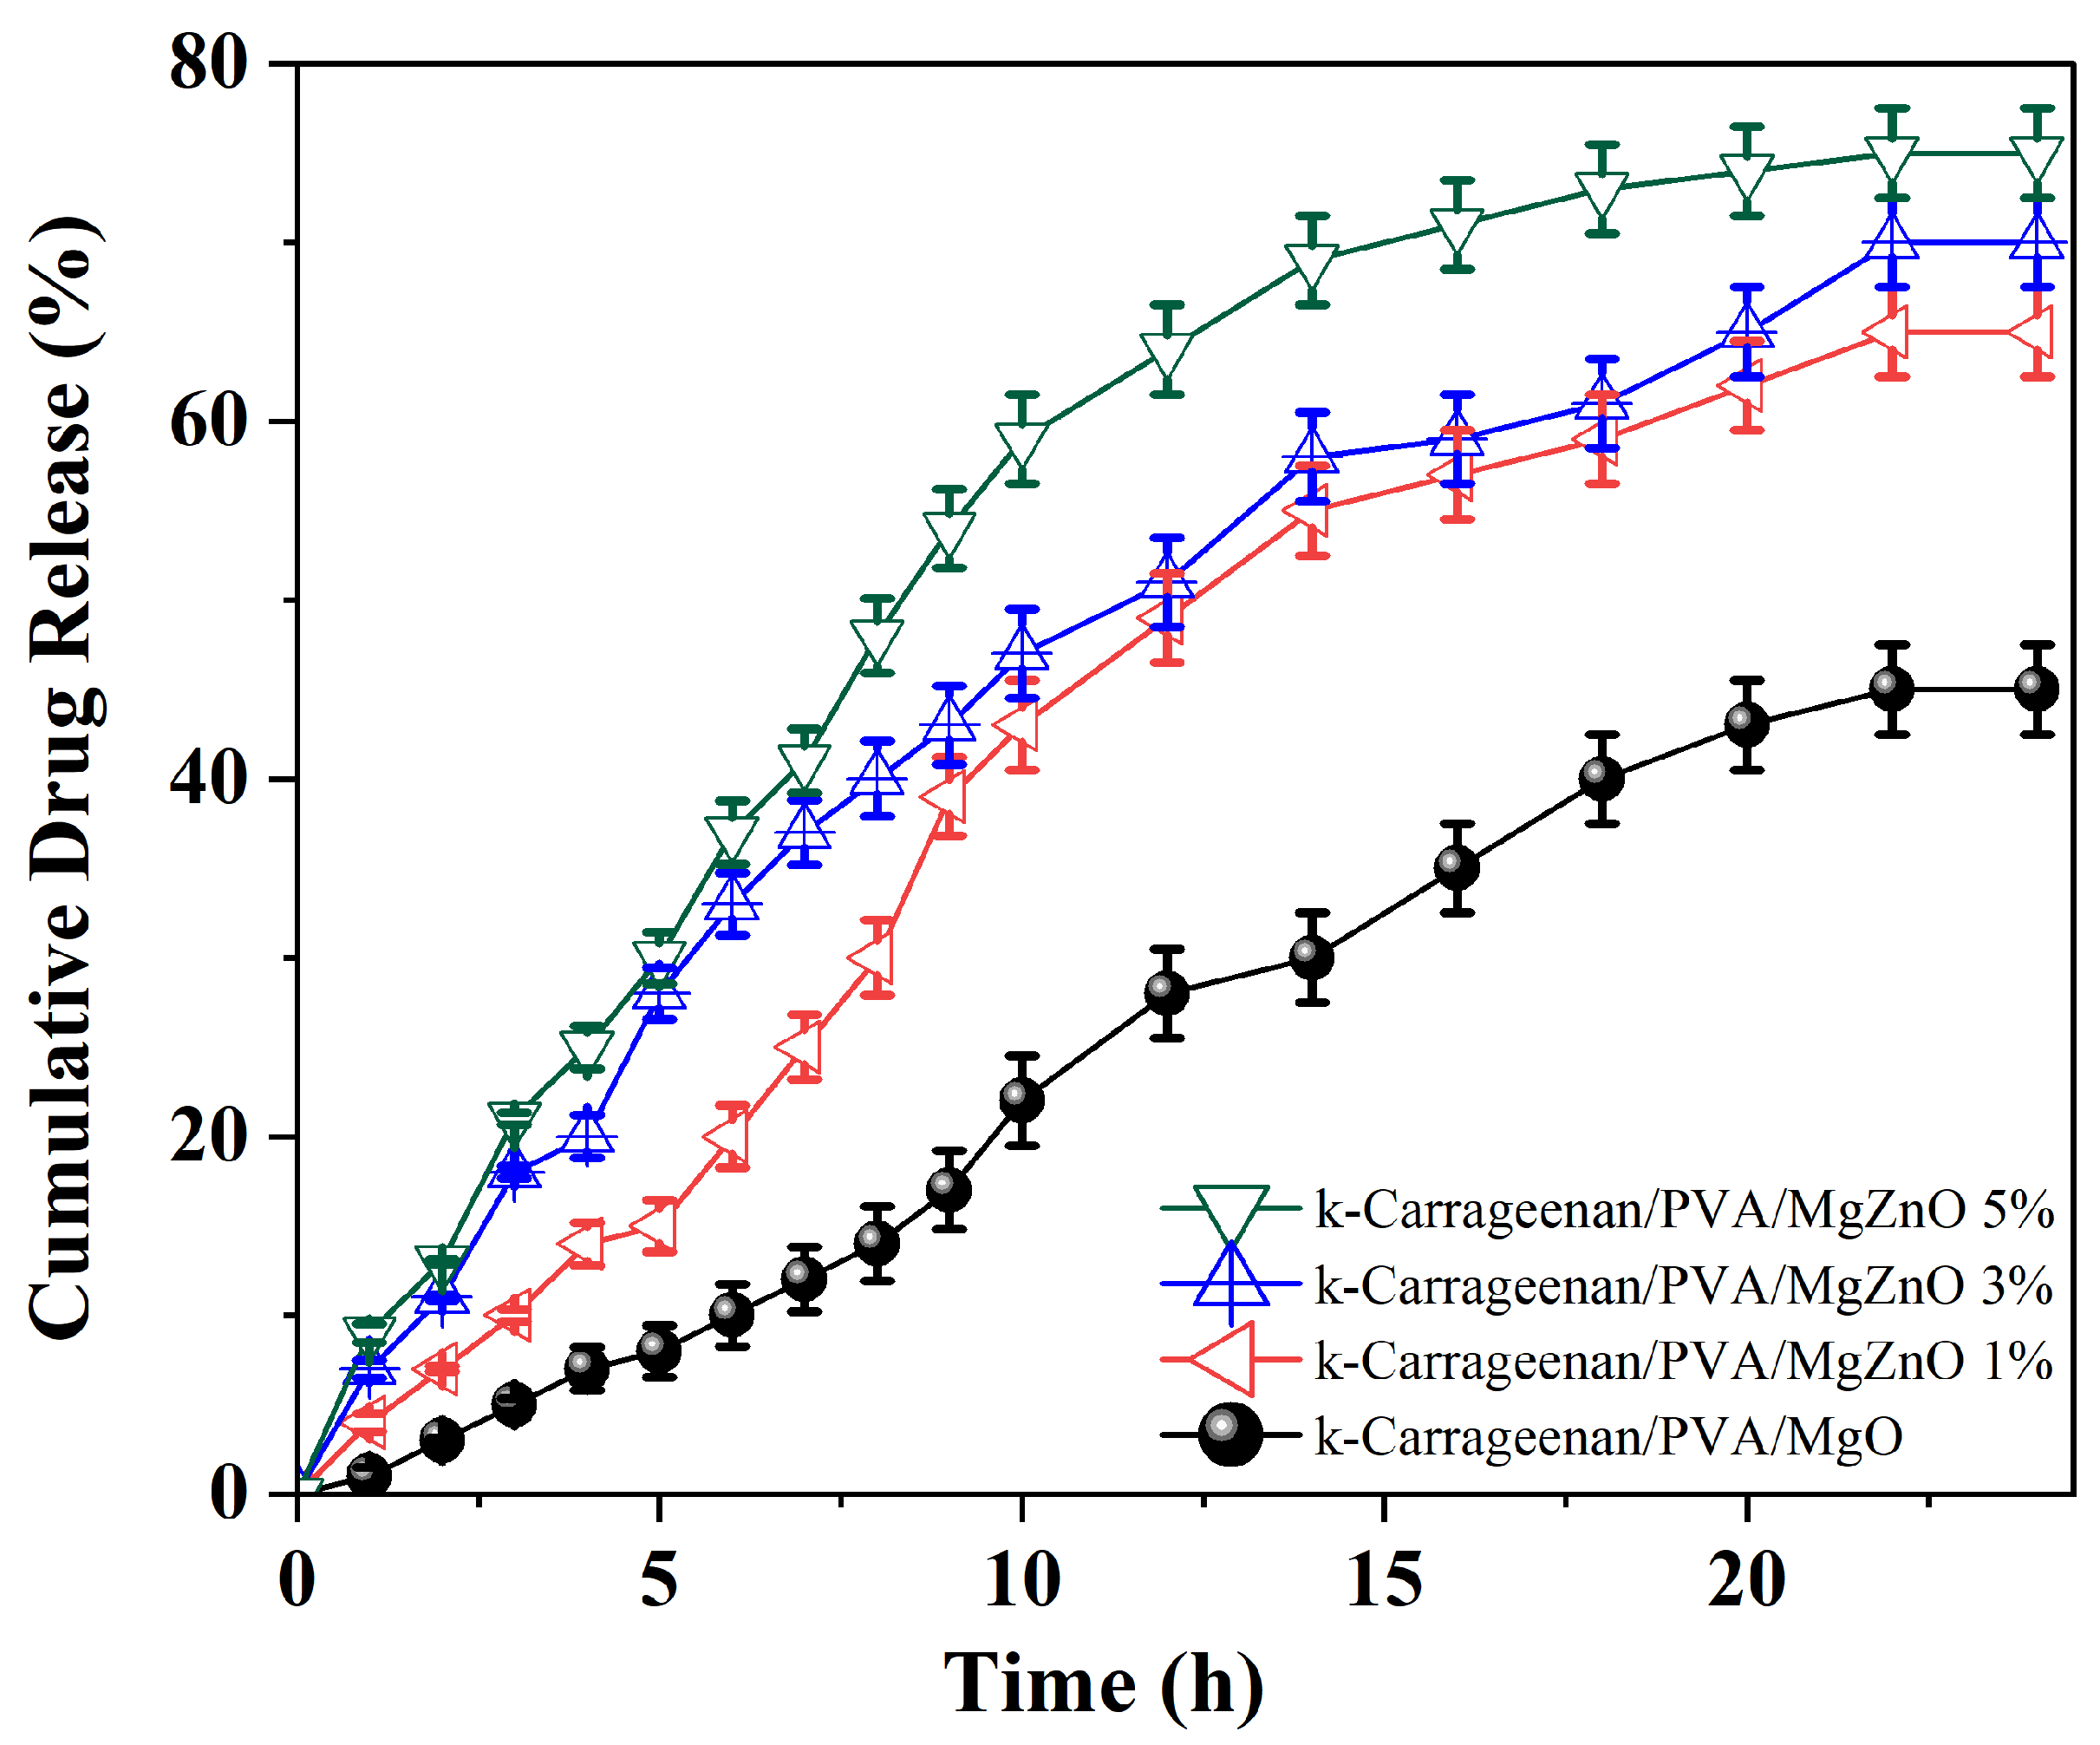
3.6. In Vitro Drug Release Analysis
3.7. In Vitro Cytotoxicity Test Cell
4. Conclusions
Author Contributions
Funding
Institutional Review Board Statement
Data Availability Statement
Acknowledgments
Conflicts of Interest
References
- Mechchate, H.; Es-safi, I.; Haddad, H.; Bekkari, H.; Grafov, A.; Bousta, D. Combination of Catechin, Epicatechin, and Rutin: Optimization of a Novel Complete Antidiabetic Formulation Using a Mixture Design Approach. J. Nutr. Biochem. 2021, 88, 108520. [Google Scholar] [CrossRef] [PubMed]
- Kaur, R.; Sharma, P.; Gupta, G.K.; Ntie-Kang, F.; Kumar, D. Structure-Activity-Relationship and Mechanistic Insights for Anti-HIV Natural Products. Molecules 2020, 25, 2070. [Google Scholar] [CrossRef] [PubMed]
- Dey, P.; Olmstead, B.D.; Sasaki, G.Y.; Vodovotz, Y.; Yu, Z.; Bruno, R.S. Epigallocatechin Gallate but Not Catechin Prevents Nonalcoholic Steatohepatitis in Mice Similar to Green Tea Extract While Differentially Affecting the Gut Microbiota. J. Nutr. Biochem. 2020, 84, 108455. [Google Scholar] [CrossRef] [PubMed]
- Hodges, J.K.; Sasaki, G.Y.; Bruno, R.S. Anti-Inflammatory Activities of Green Tea Catechins along the Gut–Liver Axis in Nonalcoholic Fatty Liver Disease: Lessons Learned from Preclinical and Human Studies. J. Nutr. Biochem. 2020, 85, 108478. [Google Scholar] [CrossRef] [PubMed]
- Chen, Q.; Xu, B.; Huang, W.; Amrouche, A.T.; Maurizio, B.; Simal-Gandara, J.; Tundis, R.; Xiao, J.; Zou, L.; Lu, B. Edible Flowers as Functional Raw Materials: A Review on Anti-Aging Properties. Trends Food Sci. Technol. 2020, 106, 30–47. [Google Scholar] [CrossRef]
- Cardoso, R.R.; Neto, R.O.; dos Santos D’Almeida, C.T.; do Nascimento, T.P.; Pressete, C.G.; Azevedo, L.; Martino, H.S.D.; Cameron, L.C.; Ferreira, M.S.L.; Barros, F.A.R. de Kombuchas from Green and Black Teas Have Different Phenolic Profile, Which Impacts Their Antioxidant Capacities, Antibacterial and Antiproliferative Activities. Food Res. Int. 2020, 128, 108782. [Google Scholar] [CrossRef]
- Kah Hui, C.; Majid, N.I.; Mohd Yusof, H.; Mohd Zainol, K.; Mohamad, H.; Mohd Zin, Z. Catechin Profile and Hypolipidemic Activity of Morinda Citrifolia Leaf Water Extract. Heliyon 2020, 6, e04337. [Google Scholar] [CrossRef]
- Tekupalli, R.; Anand, S.; Ramachandregowda, S.; Kariyappa, A.S.; Dundaiah, B.; Gopinath, M.M. Chapter 10—Neuroprotective Effects of Mangrove Plants. In Biotechnological Utilization of Mangrove Resources; Patra, J.K., Mishra, R.R., Thatoi, H.B.T., Eds.; Academic Press: Cambridge, MA, USA, 2020; pp. 261–273. ISBN 978-0-12-819532-1. [Google Scholar]
- Lin, Y.-H.; Tsai, M.-J.; Fang, Y.-P.; Fu, Y.-S.; Huang, Y.-B.; Wu, P.-C. Microemulsion Formulation Design and Evaluation for Hydrophobic Compound: Catechin Topical Application. Colloids Surf. B Biointerfaces 2018, 161, 121–128. [Google Scholar] [CrossRef]
- Siripatrawan, U.; Noipha, S. Active Film from Chitosan Incorporating Green Tea Extract for Shelf Life Extension of Pork Sausages. Food Hydrocoll. 2012, 27, 102–108. [Google Scholar] [CrossRef]
- Liang, K.; Bae, K.H.; Lee, F.; Xu, K.; Chung, J.E.; Gao, S.J.; Kurisawa, M. Self-Assembled Ternary Complexes Stabilized with Hyaluronic Acid-Green Tea Catechin Conjugates for Targeted Gene Delivery. J. Control. Release 2016, 226, 205–216. [Google Scholar] [CrossRef]
- Yusoff, A.H.M.; Salimi, M.N.; Gopinath, S.C.B.; Abdullah, M.M.A.; Samsudin, E.M. Catechin Adsorption on Magnetic Hydroxyapatite Nanoparticles: A Synergistic Interaction with Calcium Ions. Mater. Chem. Phys. 2020, 241, 122337. [Google Scholar] [CrossRef]
- Bae, K.H.; Tan, S.; Yamashita, A.; Ang, W.X.; Gao, S.J.; Wang, S.; Chung, J.E.; Kurisawa, M. Biomaterials Hyaluronic Acid-Green Tea Catechin Micellar Nanocomplexes: Fail-Safe Cisplatin Nanomedicine for the Treatment of Ovarian Cancer without off-Target Toxicity. Biomaterials 2017, 148, 41–53. [Google Scholar] [CrossRef]
- Sabaghi, M.; Maghsoudlou, Y.; Kashiri, M.; Shakeri, A. Evaluation of Release Mechanism of Catechin from Chitosan-Polyvinyl Alcohol Film by Exposure to Gamma Irradiation. Carbohydr. Polym. 2020, 230, 115589. [Google Scholar] [CrossRef]
- Taheri, A.; Kashaninejad, M.; Tamaddon, A.M.; Jafari, S.M. Vitamin D3 Cress Seed Mucilage -β-Lactoglobulin Nanocomplexes: Synthesis, Characterization, Encapsulation and Simulated Intestinal Fluid in Vitro Release. Carbohydr. Polym. 2020, 256, 117420. [Google Scholar] [CrossRef]
- Li, F.; Wang, Y.; Li, D.; Chen, Y.; Qiao, X.; Fardous, R.; Lewandowski, A.; Liu, J.; Chan, T.-H.; Dou, Q.P. Perspectives on the Recent Developments with Green Tea Polyphenols in Drug Discovery. Expert Opin. Drug Discov. 2018, 13, 643–660. [Google Scholar] [CrossRef]
- Mahdavinia, G.R.; Massoudi, A.; Baghban, A.; Shokri, E. Study of Adsorption of Cationic Dye on Magnetic Kappa-Carrageenan/PVA Nanocomposite Hydrogels. J. Environ. Chem. Eng. 2014, 2, 1578–1587. [Google Scholar] [CrossRef]
- Sabbagh, F.; Kiarostami, K.; Khatir, N.M.; Rezania, S.; Muhamad, I.I. Green Synthesis of Mg0.99 Zn0.01O Nanoparticles for the Fabrication of κ-Carrageenan/NaCMC Hydrogel in Order to Deliver Catechin. Polymers 2020, 12, 861. [Google Scholar] [CrossRef] [Green Version]
- Shim, W.; Kim, C.E.; Lee, M.; Lee, S.H.; Park, J.; Do, M.; Yang, J.; Lee, H. Catechin Solubilization by Spontaneous Hydrogen Bonding with Poly(Ethylene Glycol) for Dry Eye Therapeutics. J. Control. Release 2019, 307, 413–422. [Google Scholar] [CrossRef]
- Sabbagh, F.; Kiarostami, K.; Khatir, N.M.; Rezania, S.; Muhamad, I.I.; Hosseini, F. Effect of Zinc Content on Structural, Functional, Morphological, and Thermal Properties of Kappa-Carrageenan/NaCMC Nanocomposites. Polym. Test. 2021, 93, 106922. [Google Scholar] [CrossRef]
- Samanta, H.S.; Ray, S.K. Synthesis, Characterization, Swelling and Drug Release Behavior of Semi-Interpenetrating Network Hydrogels of Sodium Alginate and Polyacrylamide. Carbohydr. Polym. 2014, 99, 666–678. [Google Scholar] [CrossRef]
- Bajpai, S.K.; Daheriya, P. Kappa-Carrageenan/PVA Filmswith Antibacterial Properties: Part 1. Optimization of Preparation Conditions and Preliminary Drug Release Studies. J. Macromol. Sci. Part A Pure Appl. Chem. 2014, 51, 286–295. [Google Scholar] [CrossRef]


| -Carrageenan (g) | PVA (g) | Mixture (%) | |
|---|---|---|---|
| (A) Ca/P | 1 | 1 | 50:50 |
| (B) Ca/P | 1.2 | 0.8 | 60:40 |
| (C) Ca/P | 1.4 | 0.6 | 70:30 |
| (D) Ca | 2 | - | 100 |
| Compound | First Degradation °C | Second Degradation °C | Mass Change % | |||
|---|---|---|---|---|---|---|
| Onset | End | Onset | End | First | Second | |
| Ca/PVA 50:50 | 231.4 | 234.8 | 399.9 | 460.3 | 19.52 | 17.33 |
| Ca/PVA 60:40 | 230.0 | 233.8 | 507.9 | 599.7 | 20.69 | 0.35 |
| Ca/PVA 70:30 | 210.3 | 225.6 | 210.3 | 244.4 | 12.42 | 30.20 |
| Ca | 79.5 | 125.4 | 239.2 | 244.1 | 1.38 | 21.01 |
| Sample | Adhesiveness (g/s) | Springiness (mm) | Consistency (g/s) | Hardness (g) |
|---|---|---|---|---|
| -carrageenan/PVA/MgO | 129.326 | 0.199 | 56.334 | 129.326 |
| -carrageenan/PVA/MgZnO 1% | 169.462 | 0.201 | 154.01 | 387.401 |
| -carrageenan/PVA/MgZnO 3% | 322.529 | 0.201 | 169.22 | 403.248 |
| -carrageenan/PVA/MgZnO 5% | 501.596 | 0.401 | 403.248 | 549.926 |
| Nanocomposites | Drug Loading (mg/100 mg Nanocomposite) | Entrapment Efficiency (%) |
|---|---|---|
| -carrageenan/PVA/MgO | 17.45 | 55.21 |
| -carrageenan/PVA/MgZnO 1% | 23.04 | 68.30 |
| -carrageenan/PVA/MgZnO 3% | 25.55 | 77.42 |
| -carrageenan/PVA/MgZnO 5% | 27.93 | 81.58 |
Disclaimer/Publisher’s Note: The statements, opinions and data contained in all publications are solely those of the individual author(s) and contributor(s) and not of MDPI and/or the editor(s). MDPI and/or the editor(s) disclaim responsibility for any injury to people or property resulting from any ideas, methods, instructions or products referred to in the content. |
© 2023 by the authors. Licensee MDPI, Basel, Switzerland. This article is an open access article distributed under the terms and conditions of the Creative Commons Attribution (CC BY) license (https://creativecommons.org/licenses/by/4.0/).
Share and Cite
Sabbagh, F.; Khatir, N.M.; Kiarostami, K. Synthesis and Characterization of 𝒌-Carrageenan/PVA Nanocomposite Hydrogels in Combination with MgZnO Nanoparticles to Evaluate the Catechin Release. Polymers 2023, 15, 272. https://doi.org/10.3390/polym15020272
Sabbagh F, Khatir NM, Kiarostami K. Synthesis and Characterization of 𝒌-Carrageenan/PVA Nanocomposite Hydrogels in Combination with MgZnO Nanoparticles to Evaluate the Catechin Release. Polymers. 2023; 15(2):272. https://doi.org/10.3390/polym15020272
Chicago/Turabian StyleSabbagh, Farzaneh, Nadia Mahmoudi Khatir, and Khadijeh Kiarostami. 2023. "Synthesis and Characterization of 𝒌-Carrageenan/PVA Nanocomposite Hydrogels in Combination with MgZnO Nanoparticles to Evaluate the Catechin Release" Polymers 15, no. 2: 272. https://doi.org/10.3390/polym15020272