
Self-Polarized P(VDF-TrFE)/Carbon Black Composite Piezoelectric Thin Film


Abstract
:
1. Introduction
2. Experimental Details
Synthesis of P(VDF_TrFE)/CB Composite Films
3. Results and Discussion
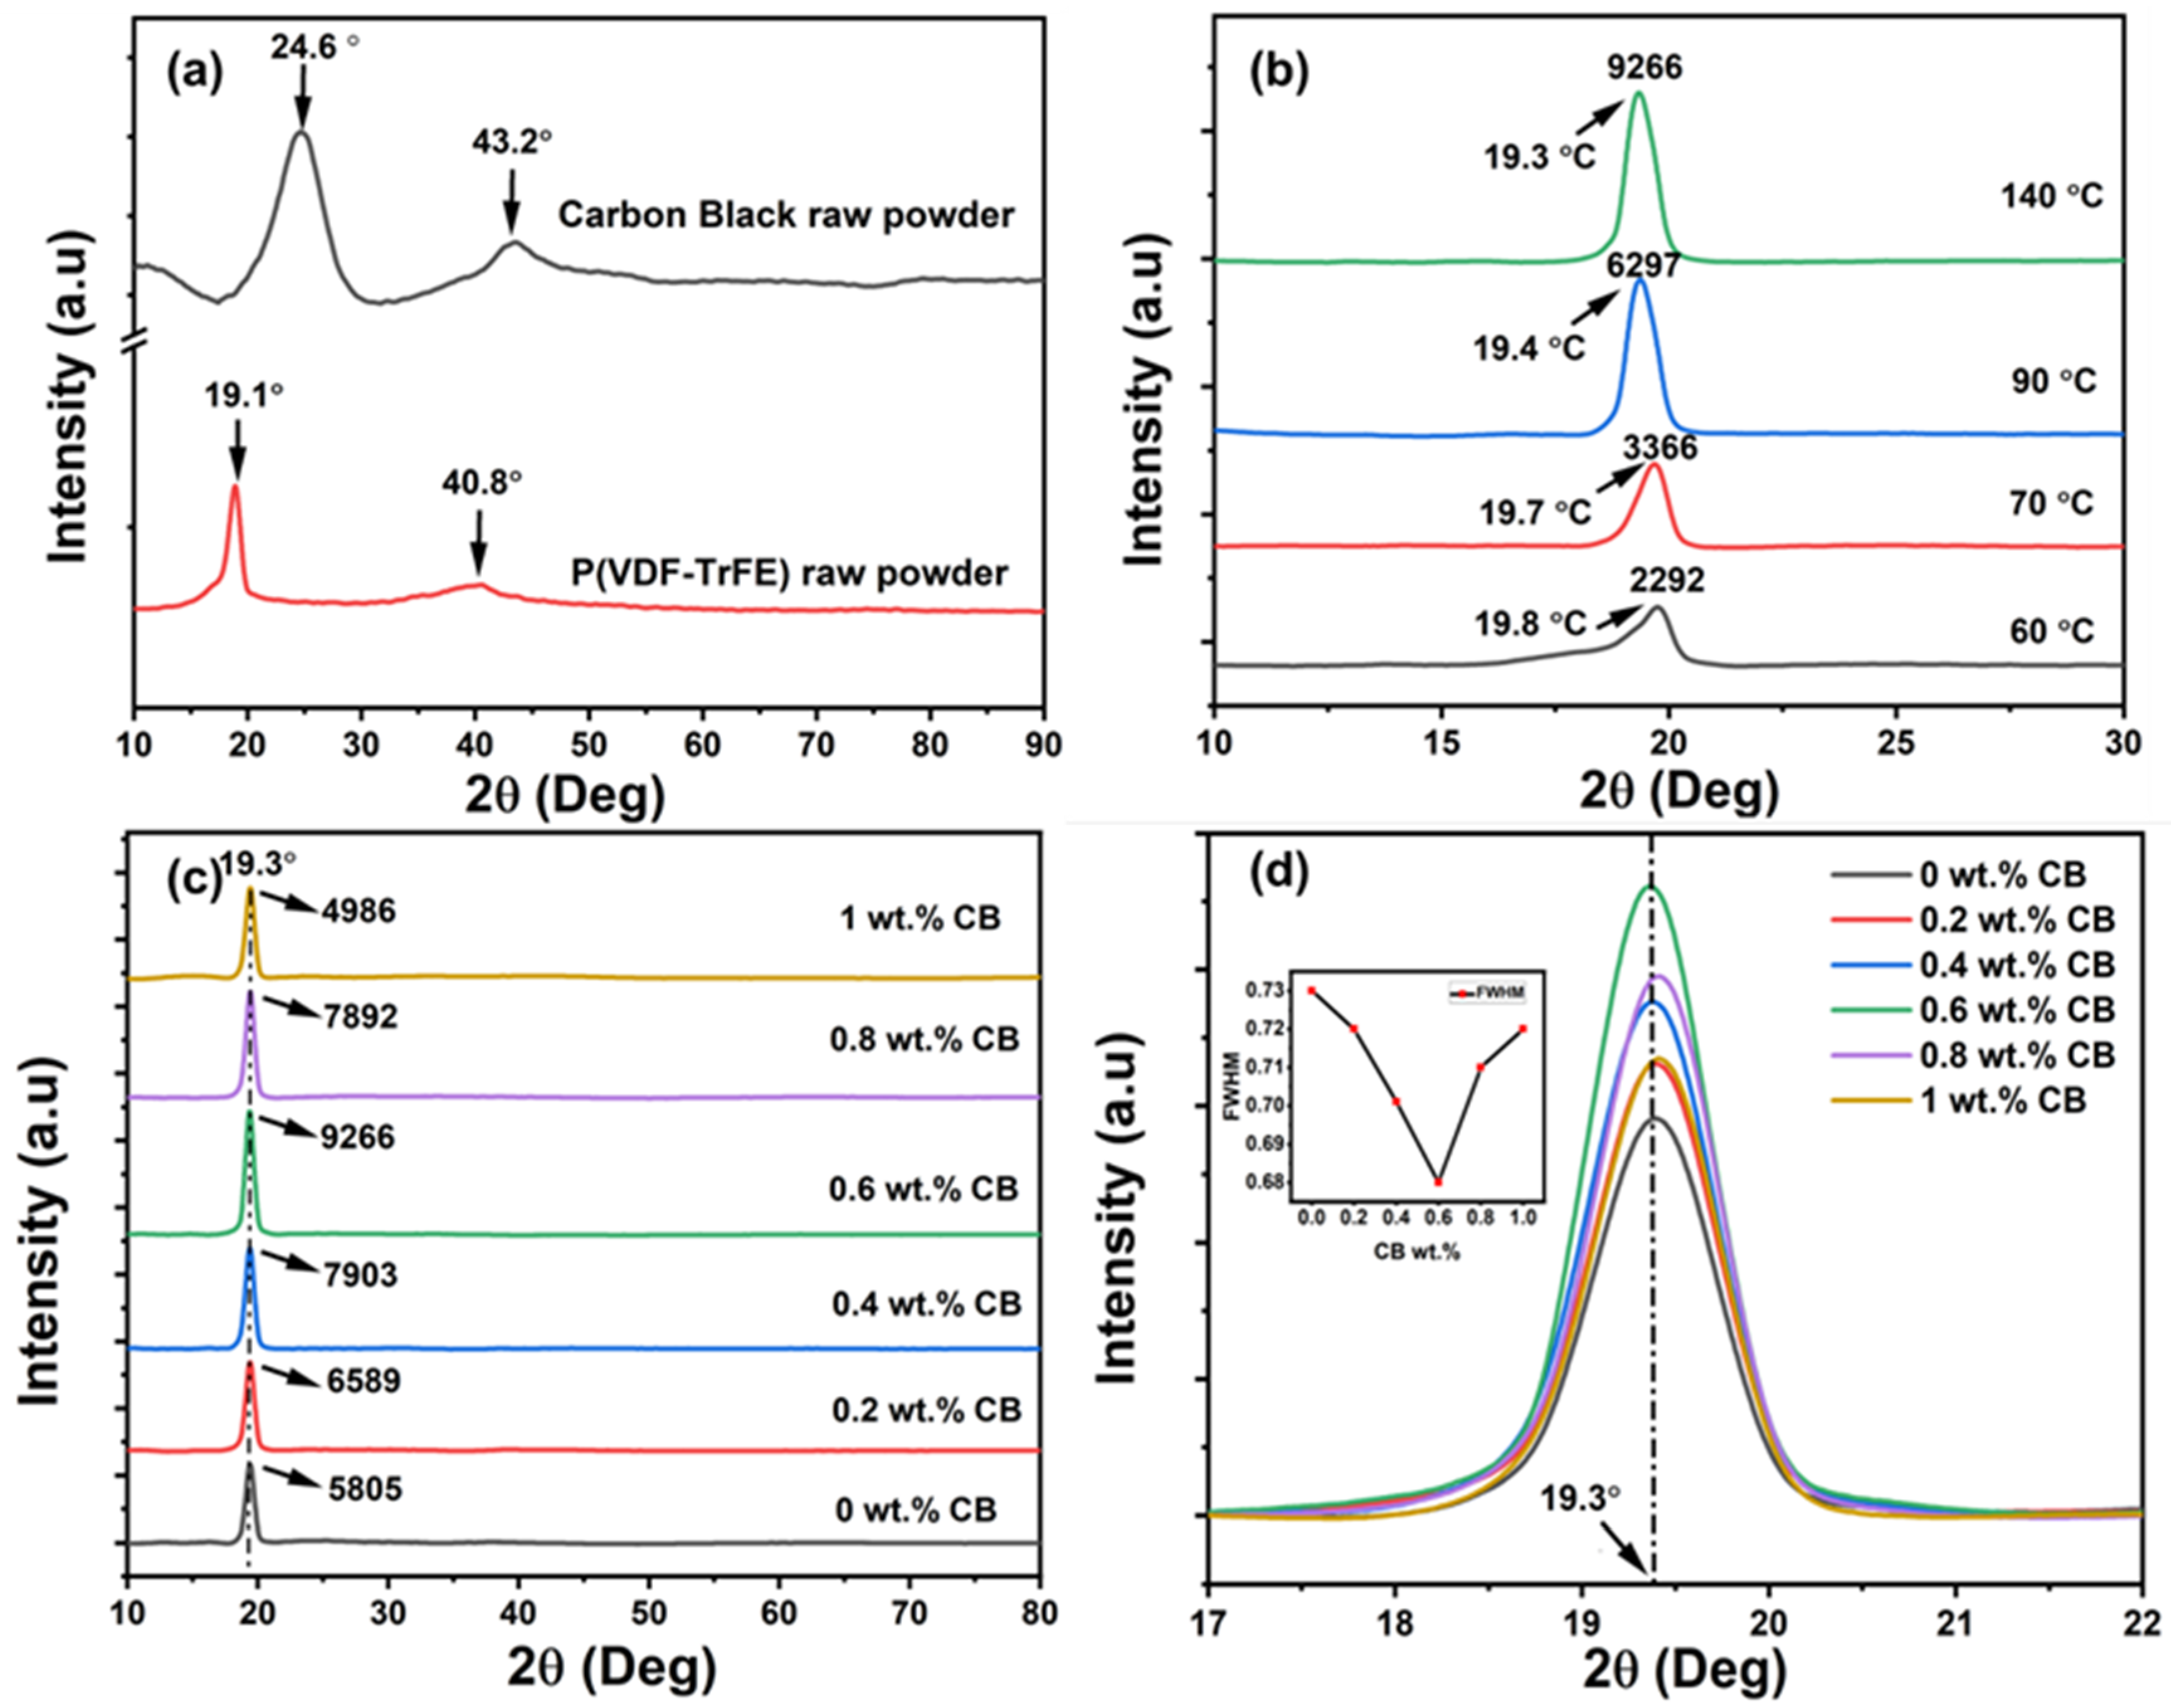
Material Characterization
4. Electrical Characterization
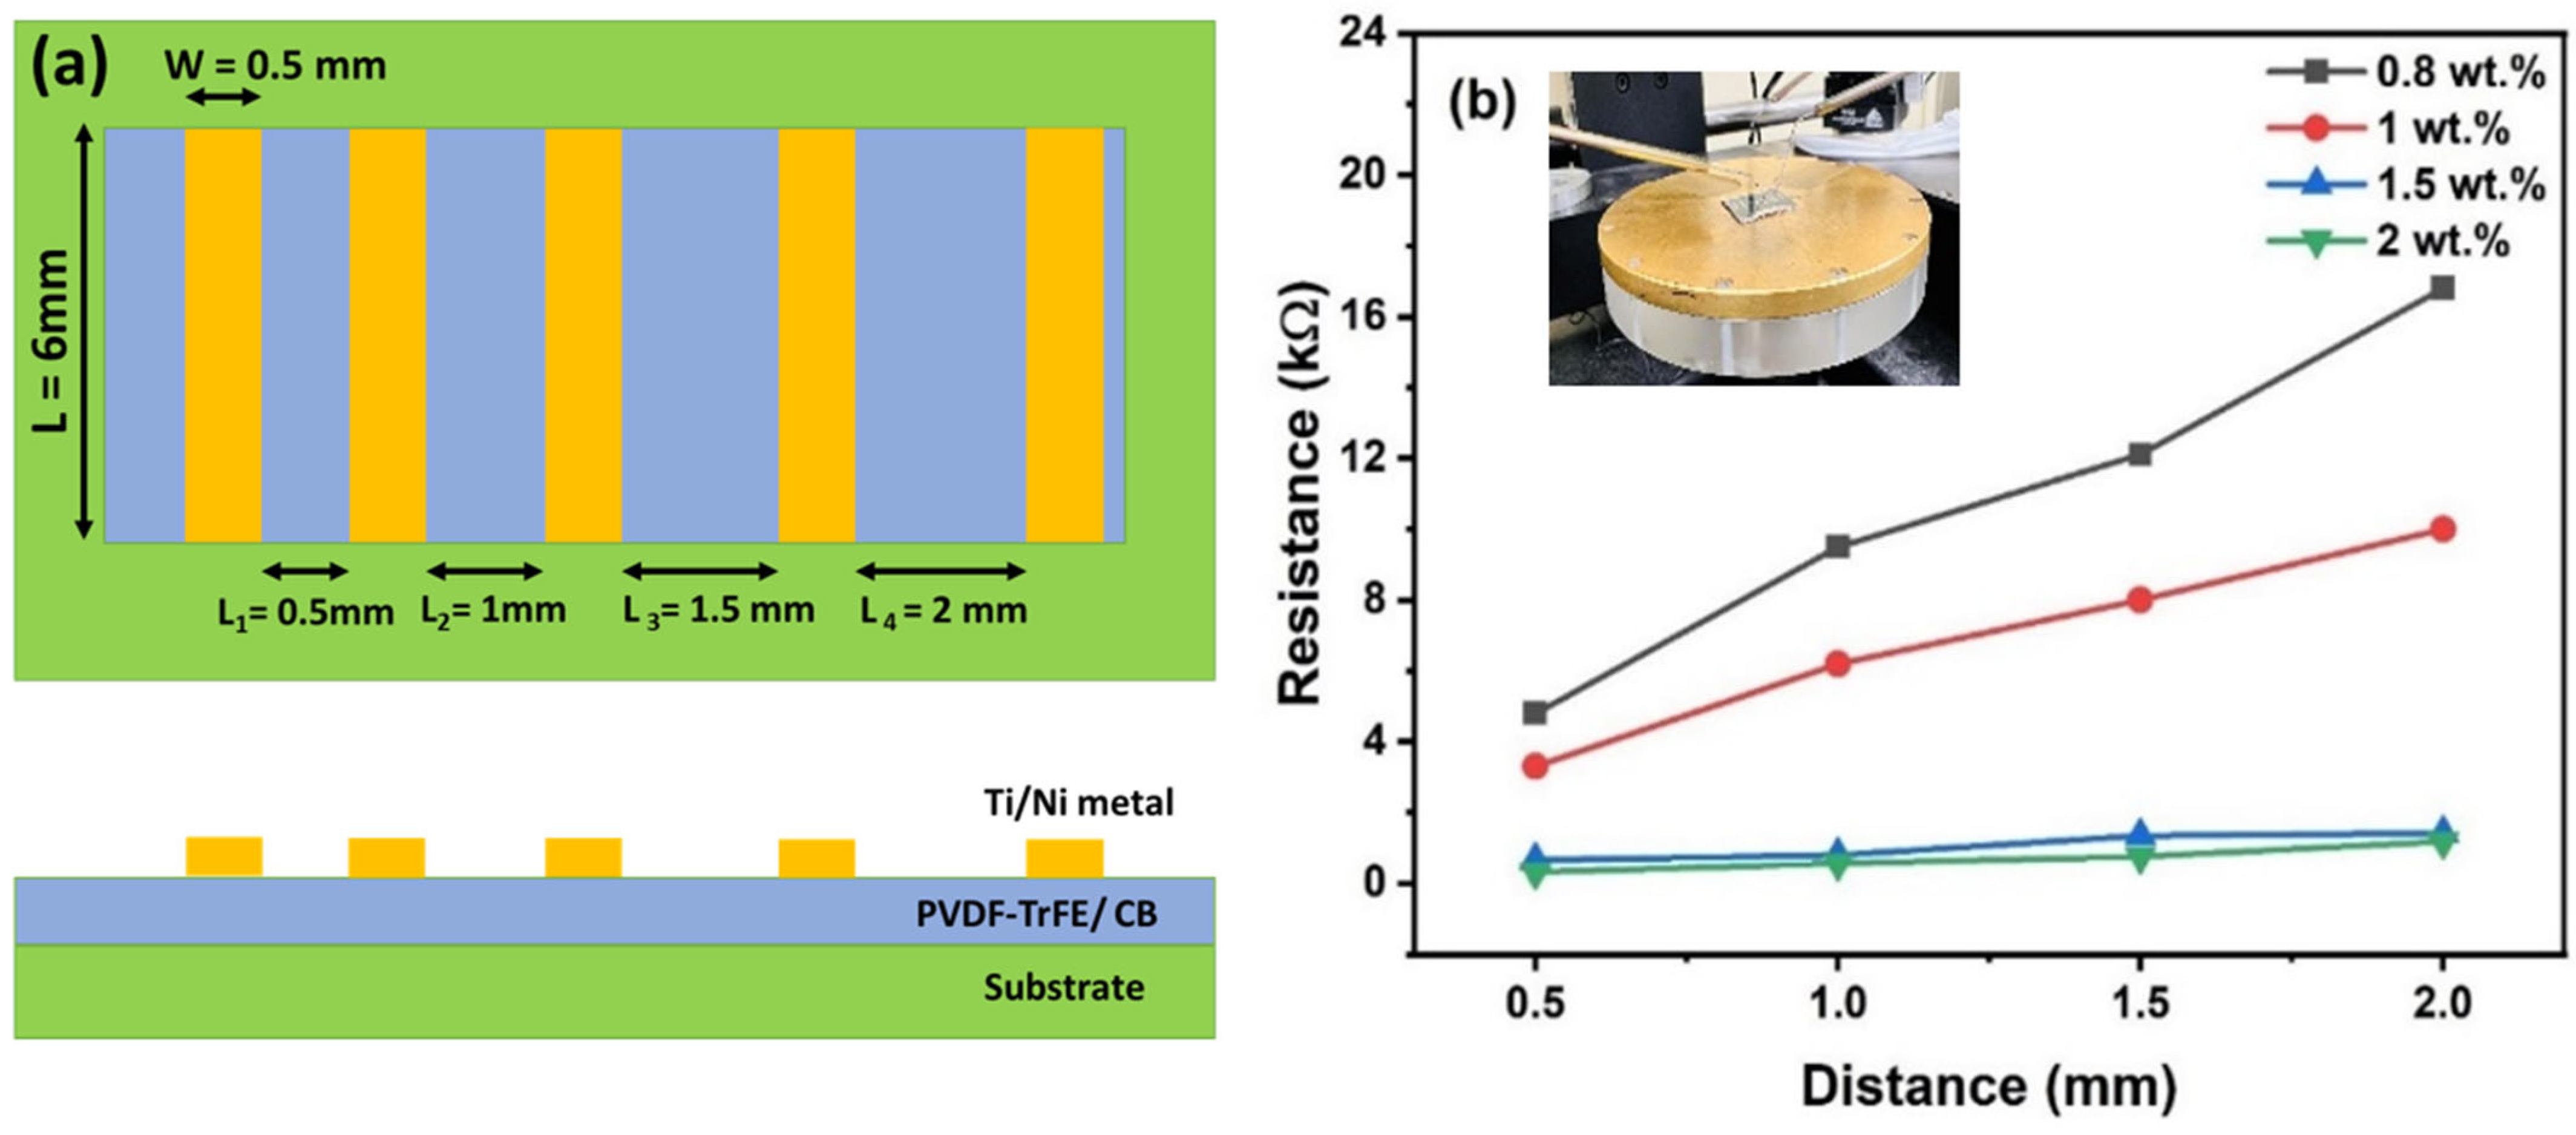
4.1. Resistivity Measurement
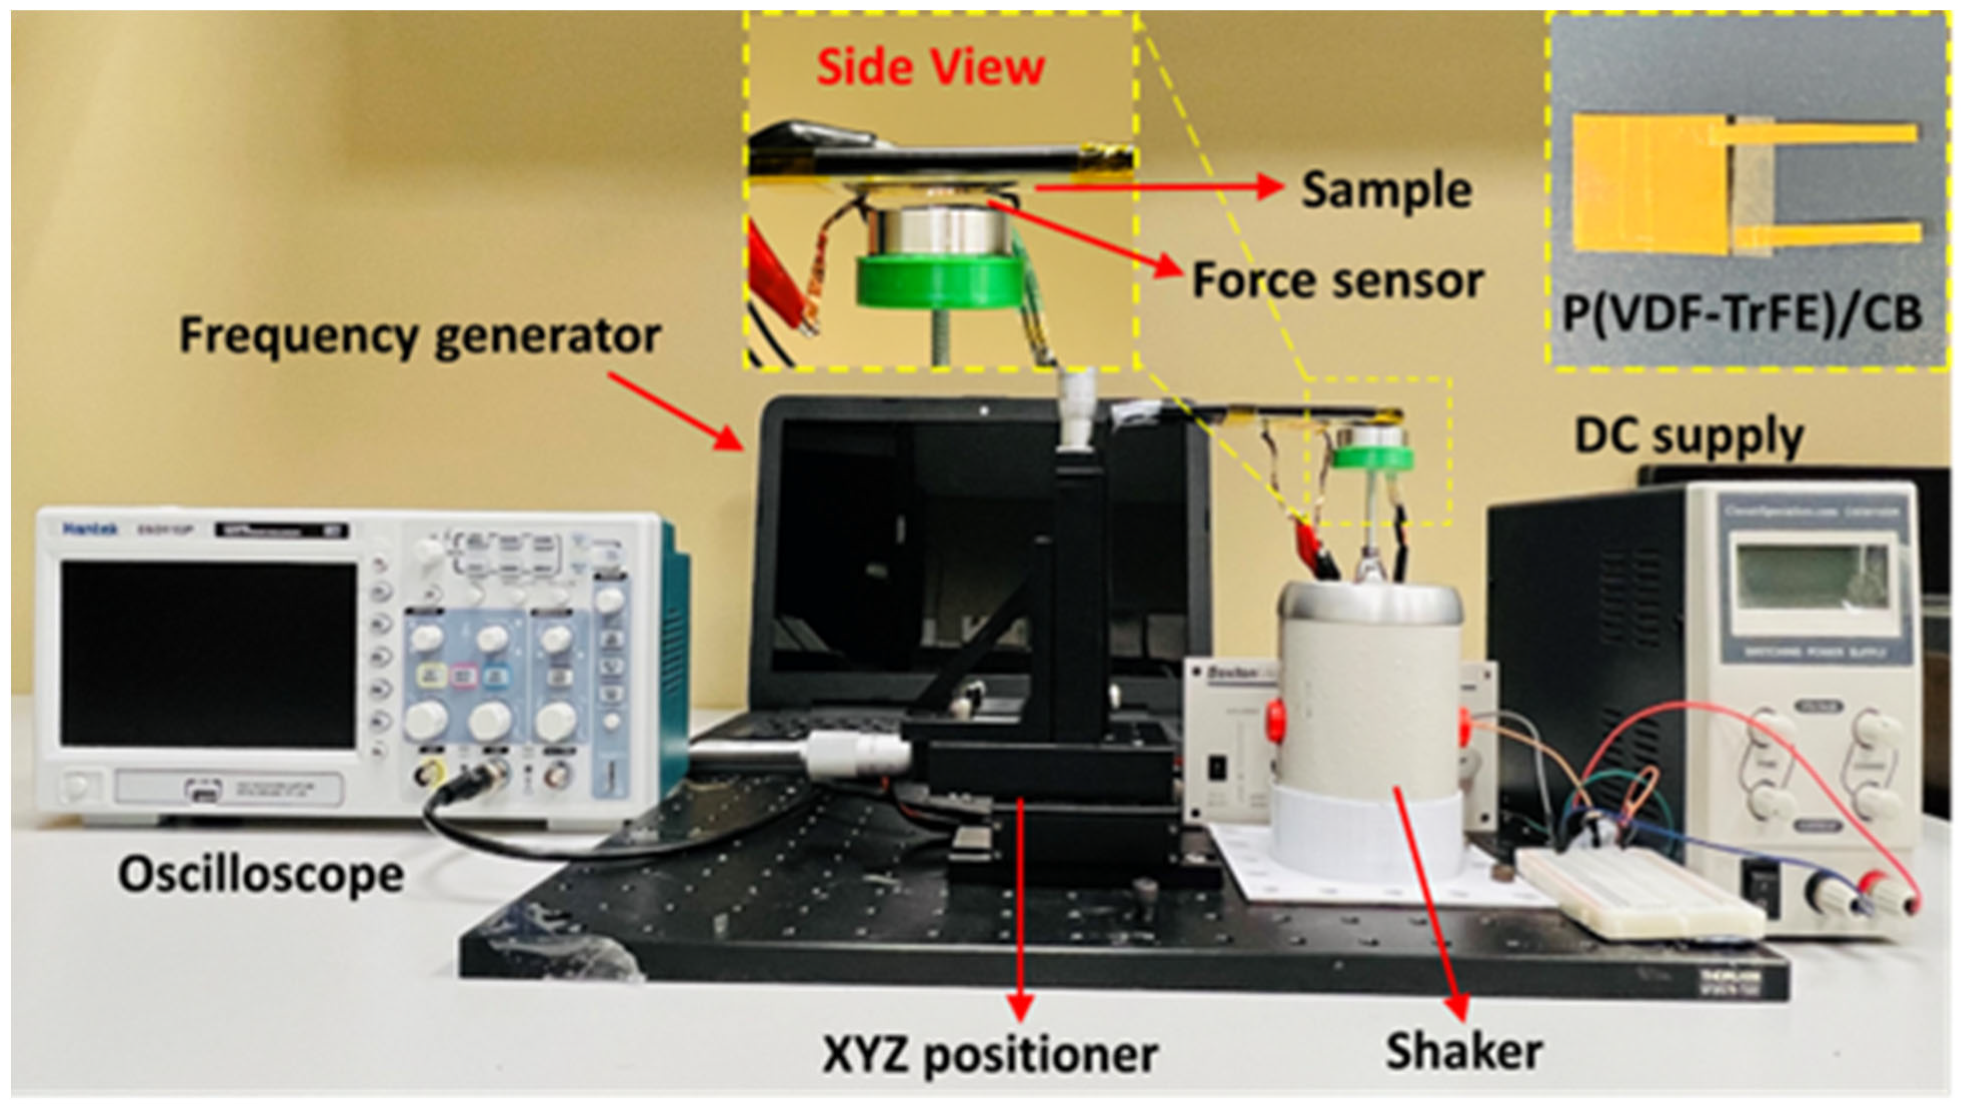
4.2. Experimental Setup
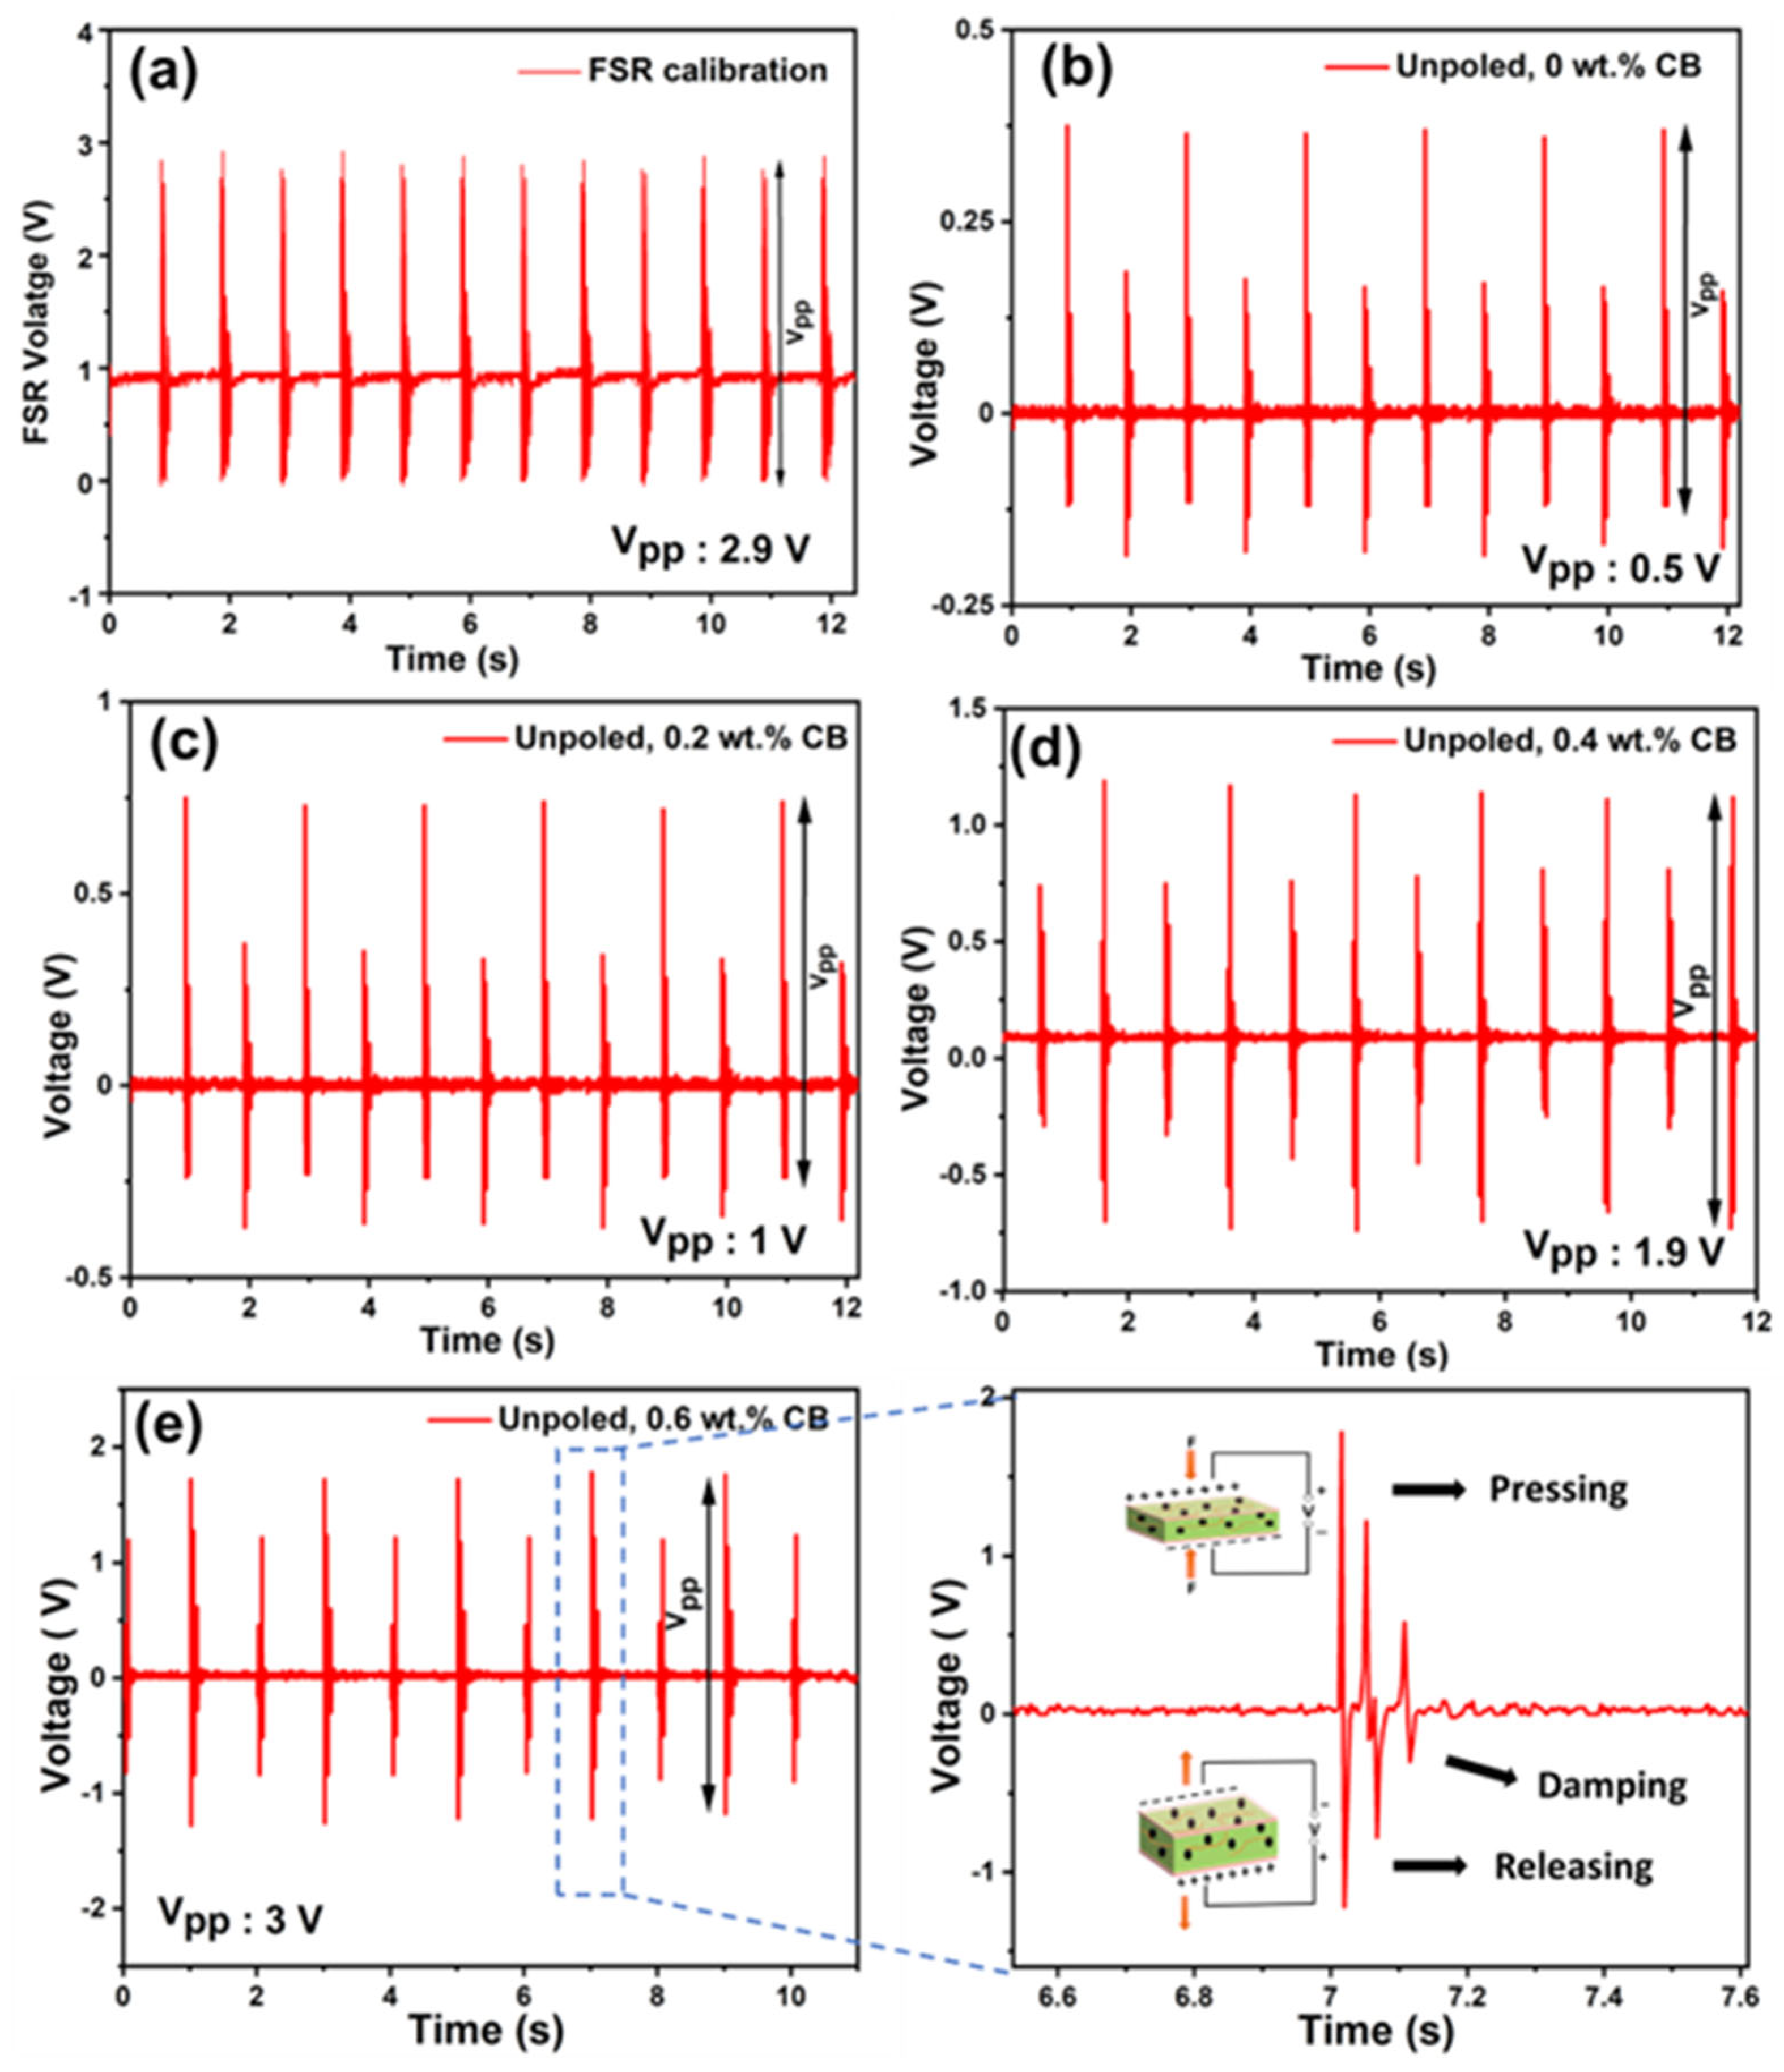
4.3. Piezoelectric Measurement
5. Conclusions
Supplementary Materials
Author Contributions
Funding
Data Availability Statement
Acknowledgments
Conflicts of Interest
References
- Kim, S.; Towfeeq, I.; Dong, Y.; Gorman, S.; Rao, A.M.; Koley, G. P (VDF-TrFE) film on PDMS substrate for energy harvesting applications. Appl. Sci. 2018, 8, 213. [Google Scholar] [CrossRef]
- Marchiori, B.; Regal, S.; Arango, Y.; Delattre, R.; Blayac, S.; Ramuz, M. PVDF-TrFE-based stretchable contact and non-contact temperature sensor for E-skin application. Sensors 2020, 20, 623. [Google Scholar] [CrossRef]
- Sang, M.; Wang, S.; Liu, S.; Liu, M.; Bai, L.; Jiang, W.; Xuan, S.; Gong, X. A hydrophobic, self-powered, electromagnetic shielding PVDF-based wearable device for human body monitoring and protection. ACS Appl. Mater. Interfaces 2019, 11, 47340–47349. [Google Scholar] [CrossRef] [PubMed]
- Kim, S.; Towfeeq, I.; Bayram, F.; Khan, D.; Koley, G. Highly flexible P (VDF-TrFE) film-based piezoelectric self-powered energy harvester. In Proceedings of the 2016 IEEE SENSORS, Orlando, FL, USA, 30 October–3 November 2016; pp. 1–3. [Google Scholar]
- Chen, X.; Tian, H.; Li, X.; Shao, J.; Ding, Y.; An, N.; Zhou, Y. A high-performance P (VDF-TrFE) nanogenerator with self-connected and vertically integrated fibers by patterned EHD pulling. Nanoscale 2015, 7, 11536–11544. [Google Scholar] [CrossRef]
- Simoes, R.D.; Rodriguez-Perez, M.A.; De Saja, J.A.; Constantino, C. Tailoring the structural properties of PVDF and P (VDF-TrFE) by using natural polymers as additives. Polym. Eng. Sci. 2009, 49, 2150–2157. [Google Scholar] [CrossRef]
- Ducrot, P.; Dufour, I.; Ayela, C. Optimization of PVDF-TrFE processing conditions for the fabrication of organic MEMS resonators. Sci. Rep. 2016, 6, 1–7. [Google Scholar] [CrossRef]
- Arrigoni, A.; Brambilla, L.; Bertarelli, C.; Serra, G.; Tommasini, M.; Castiglioni, C. P (VDF-TrFE) nanofibers: Structure of the ferroelectric and paraelectric phases through IR and Raman spectroscopies. RSC Adv. 2020, 10, 37779–37796. [Google Scholar] [CrossRef]
- María, N.; Le Goupil, F.; Cavallo, D.; Maiz, J.; Müller, A.J. Effect of the TrFE Content on the Crystallization and SSA Thermal Fractionation of P (VDF-co-TrFE) Copolymers. Int. J. Mol. Sci. 2022, 23, 10365. [Google Scholar] [CrossRef]
- Liu, Y.; Chang, Y.; Li, F.; Yang, B.; Sun, Y.; Wu, J.; Zhang, S.; Wang, R.; Cao, W. Exceptionally high piezoelectric coefficient, and low strain hysteresis in grain-oriented (Ba, Ca)(Ti, Zr) O3 through integrating crystallographic texture and domain engineering. ACS Appl. Mater. Interfaces 2017, 9, 29863–29871. [Google Scholar] [CrossRef]
- Wu, L.; Jin, Z.; Liu, Y.; Ning, H.; Liu, X.; Hu, N. Recent advances in the preparation of PVDF-based piezoelectric materials. Nanotechnol. Rev. 2022, 11, 1386–1407. [Google Scholar] [CrossRef]
- Bae, J.; Chang, S. Characterization of an electroactive polymer (PVDF-TrFE) film-type sensor for health monitoring of composite structures. Compos. Struct. 2015, 131, 1090–1098. [Google Scholar] [CrossRef]
- Shi, K.; Sun, B.; Huang, X.; Jiang, P. Synergistic effect of graphene nanosheet and BaTiO3 nanoparticles on performance enhancement of electrospun PVDF nanofiber mat for flexible piezoelectric nanogenerators. Nano Energy 2018, 52, 153–162. [Google Scholar] [CrossRef]
- Li, Y.; Feng, W.; Meng, L.; Tse, K.M.; Li, Z.; Huang, L.; Su, Z.; Guo, S. Investigation on in-situ sprayed, annealed and corona poled PVDF-TrFE coatings for guided wave-based structural health monitoring: From crystallization to piezoelectricity. Mater. Des. 2021, 199, 10941. [Google Scholar] [CrossRef]
- Dietze, M.; Es-Souni, M. Structural and functional properties of screen-printed PZT–PVDF-TrFE composites. Sens. Actuators A Phys. 2008, 143, 329–334. [Google Scholar] [CrossRef]
- Ikei, A.; Wissman, J.; Sampath, K.; Yesner, G.; Qadri, S.N. Tunable in situ 3d-printed pvdf-trfe piezoelectric arrays. Sensors 2021, 21, 5032. [Google Scholar] [CrossRef]
- Liu, Y.Z.; Zhang, H.; Yu, J.X.; Huang, Z.Y.; Wang, C.; Sun, Y. Ferroelectric P (VDF-TrFE)/POSS nanocomposite films: Compatibility, piezoelectricity, energy harvesting performance, and mechanical and atomic oxygen erosion. RSC Adv. 2020, 10, 17377–17386. [Google Scholar] [CrossRef]
- Chen, S.; Li, X.; Yao, K.; Tay, F.E.H.; Kumar, A.; Zeng, K. Self-polarized ferroelectric PVDF homopolymer ultra-thin films derived from Langmuir–Blodgett deposition. Polymer 2012, 53, 1404–1408. [Google Scholar] [CrossRef]
- Chandran, A.M.; Varun, S.; Mural, P.K.S. Development of self-poled PVDF/MWNT flexible nanocomposites with a boosted electroactive β-phase. New J. Chem. 2020, 44, 14578–14591. [Google Scholar] [CrossRef]
- Karan, S.K.; Mandal, D.; Khatua, B.B. Self-powered flexible Fe-doped RGO/PVDF nanocomposite: An excellent material for a piezoelectric energy harvester. Nanoscale 2015, 7, 10655–10666. [Google Scholar] [CrossRef]
- Soin, N.; Boyer, D.; Prashanthi, K.; Sharma, S.; Narasimulu, A.A.; Luo, J.; Shah, T.H.; Siores, E.; Thundat, T. Exclusive self-aligned β-phase PVDF films with abnormal piezoelectric coefficient prepared via phase inversion. Chem. Commun. 2015, 51, 8257–8260. [Google Scholar] [CrossRef]
- Thakur, P.; Kool, A.; Hoque, N.A.; Bagchi, B.; Khatun, F.; Biswas, P.; Brahma, D.; Roy, S.; Banerjee, S.; Das, S. Superior performances of in situ synthesized ZnO/PVDF thin film based self-poled piezoelectric nanogenerator and self-charged photo-power bank with high durability. Nano Energy 2018, 44, 456–467. [Google Scholar] [CrossRef]
- Ghosh, S.K.; Biswas, A.; Sen, S.; Das, C.; Henkel, K.; Schmeisser, D.; Mandal, D. Yb3 assisted self-polarized PVDF based ferroelectretic nanogenerator: A facile strategy of highly efficient mechanical energy harvester fabrication. Nano Energy 2016, 30, 621–629. [Google Scholar] [CrossRef]
- Li, H.; Lim, S. Boosting performance of self-polarized fully printed piezoelectric nanogenerators via modulated strength of hydrogen bonding interactions. Nanomaterials 2021, 11, 1908. [Google Scholar] [CrossRef]
- Guo, J.; Nie, M.; Wang, Q. Self-Poling Polyvinylidene Fluoride-Based Piezoelectric Energy Harvester Featuring Highly Oriented β-Phase Structured at Multiple Scales. ACS Sustain. Chem. Eng. 2021, 9, 499–509. [Google Scholar] [CrossRef]
- Tian, Y.; An, Y.; Xu, B. MXene-based materials for advanced nanogenerators. Nano Energy 2022, 101, 107556. [Google Scholar] [CrossRef]
- Pusty, M.; Sinha, L.; Shirage, P.M. A flexible self-poled piezoelectric nanogenerator based on a rGO–Ag/PVDF nanocomposite. New J. Chem. 2019, 43, 284–294. [Google Scholar] [CrossRef]
- Hu, Y.; Hsu, W.; Wang, Y.; Ho, C.; Chang, P. Enhance the pyroelectricity of polyvinylidene fluoride by graphene-oxide doping. Sensors 2014, 14, 6877–6890. [Google Scholar] [CrossRef] [PubMed]
- Rahaman, M.H.; Yaqoob, U.; Sheeraz, M.; Uddin, A.S.M.I.; Kim, H. The Effect of RGO on dielectric and energy harvesting properties of P(VDF-TrFE) matrix by optimizing electroactive β phase without traditional polling process. Mater. Chem. Phys. 2018, 215, 46–55. [Google Scholar]
- Wang, Y.; Xu, C.; Jahnke, T.; Verestek, W.; Schmauder, S.; Spatz, J.P. Microstructural Modeling and Simulation of a Carbon Black-Based Conductive Polymer─A Template for the Virtual Design of a Composite Material. ACS Omega 2022, 7, 28820–28830. [Google Scholar] [CrossRef]
- Wu, L.; Yuan, W.; Hu, N.; Wang, Z.; Chen, C.; Qiu, J.; Ying, J.; Li, Y. Improved piezoelectricity of PVDF-HFP/carbon black composite films. J. Phys. D 2014, 47, 135302. [Google Scholar] [CrossRef]
- Alamusi, W.L.; Hu, N.; Yao, J.; Liu, Y.; Ning, H.; Liu, X.; Yuan, W.; Fu, S. Improvement of the piezoelectricity of PVDF-TrFE by carbon black. Mater. Res. Express 2018, 6, 025509. [Google Scholar] [CrossRef]
- Jia, N.; He, Q.; Sun, J.; Xia, G.; Song, R. Crystallization behavior and electroactive properties of PVDF, P(VDF-TrFE) and their blend films. Polym. Test. 2016, 57, 302–306. [Google Scholar] [CrossRef]
- Zhao, C.; Hong, Y.; Chu, X.; Dong, Y.; Hu, Z.; Sun, X.; Yan, S. Enhanced ferroelectric properties of P(VDF-TrFE) thin film on single-layer graphene simply adjusted by crystallization condition. Mater. Today Energy 2021, 20, 100678. [Google Scholar] [CrossRef]
- Hu, X.; You, M.; Yi, N.; Zhang, X.; Xiang, Y. Enhanced Piezoelectric Coefficient of PVDF-TrFE Films via In Situ Polarization. Front. Energy Res. 2021, 9, 621540. [Google Scholar] [CrossRef]
- Pawlyta, M.; Rouzaud, J.; Duber, S. Raman microspectroscopy characterization of carbon blacks: Spectral analysis and structural information. Carbon 2015, 84, 479–490. [Google Scholar] [CrossRef]
- Lee, S.; Lee, S.; Roh, J. Analysis of Activation Process of Carbon Black Based on Structural Parameters Obtained by XRD Analysis. Crystals 2021, 11, 153. [Google Scholar] [CrossRef]
- Jr, R.; Botta, M. Effect of crystallization temperature on the phase transition of P(VDF/TrFE) copolymers. J. Polym. Sci. Part B-Polym. Phys. 1998, 36, 403–414. [Google Scholar]
- Arshad, A.; Mohd Wahid, M.H.; Rusop, M.; Majid, W.H.A.; Subban, R.; Rozana, M. Dielectric and Structural Properties of Poly(vinylidene fluoride) (PVDF) and Poly(vinylidene fluoride-trifluoroethylene) (PVDF-TrFE) Filled with Magnesium Oxide Nanofillers. J. Nanomater. 2019, 2019, 1–12. [Google Scholar] [CrossRef]
- Yaseen, H.M.A.; Park, S. Enhanced Power Generation by Piezoelectric P (VDF-TrFE)/RGO Nanocomposite Thin Film. Nanomaterials 2023, 13, 860. [Google Scholar] [CrossRef]
- Karumuthil, S.C.; Rajeev, S.P.; Varghese, S. Poly(vinylidene fluoride-trifluoroethylene)-ZnO Nanoparticle Composites on a Flexible Poly(dimethylsiloxane) Substrate for Energy Harvesting. ACS Appl. Nano Mater. 2019, 2, 4350–4357. [Google Scholar] [CrossRef]
- Meng, N.; Zhu, X.; Mao, R.; Reece, M.J.; Bilotti, E. Nanoscale interfacial electroactivity in PVDF/PVDF-TrFE blended films with enhanced dielectric and ferroelectric properties. J. Mater. Chem. C 2017, 5, 3296–3305. [Google Scholar] [CrossRef]
- Li, J.; Huang, C.; Chen, K.; Chen, J.; Hsu, X.; Chen, Y.; Kuo, C.J.; Cheng, C.; Suen, M.; Chiu, C. Enhanced piezoelectric properties of poly (vinylidenefluoride-co-trifluoroethylene)/carbon-based nanomaterial composite films for pressure sensing applications. Polymers 2020, 12, 2999. [Google Scholar] [CrossRef]
- Hu, X.; Ding, Z.; Fei, L.; Xiang, Y.; Lin, Y. Wearable piezoelectric nanogenerators based on reduced graphene oxide and in situ polarization-enhanced PVDF-TrFE films. J. Mater. Sci. 2019, 54, 6401–6409. [Google Scholar] [CrossRef]
- Wu, Y.; Du, X.; Gao, R.; Li, J.; Li, W.; Yu, H.; Jiang, Z.; Wang, Z.; Tai, H. Self-Polarization of PVDF Film Triggered by Hydrophilic Treatment for Pyroelectric Sensor with Ultra-Low Piezoelectric Noise. Nanoscale Res. Lett. 2019, 14, 1–9. [Google Scholar] [CrossRef] [PubMed]
- Albright, T.; Hobeck, J. Characterization of Carbon-Black-Based Nanocomposite Mixtures of Varying Dispersion for Improving Stochastic Model Fidelity. Nanomaterials 2023, 13, 916. [Google Scholar] [CrossRef]
- Hafner, J.; Teuschel, M.; Disnan, D.; Schneider, M.; Schmid, U. Large bias-induced piezoelectric response in the ferroelectric polymer P(VDF-TrFE) for MEMS resonators. Mater. Res. Lett. 2021, 9, 195–203. [Google Scholar] [CrossRef]
- Poudel, A.; Fernandez-Yague, M.; Tofail, S.; Biggs, M. Boron Nitride Nanotube Addition Enhances the Crystallinity and Cytocompatibility of PVDF-TrFE. Front. Chem. 2019, 7, 364. [Google Scholar] [CrossRef]
- Singh, H.; Singh, S.; Khare, N. Enhanced β -phase in PVDF polymer nanocomposite and its application for nanogenerator. Polym. Adv. Technol. 2017, 29, 143–150. [Google Scholar] [CrossRef]
- Khurana, V.; Kisannagar, R.R.; Domala, S.S.; Gupta, D. In Situ Polarized Ultrathin PVDF Film-Based Flexible Piezoelectric Nanogenerators. ACS Appl. Electron. Mater. 2020, 2, 3409–3417. [Google Scholar] [CrossRef]
- Wang, S.; Shao, H.; Liu, Y.; Tang, C.; Zhao, X.; Ke, K.; Bao, R.Y.; Yang, M.B.; Yang, W. Boosting piezoelectric response of PVDF-TrFE via MXene for self-powered linear pressure sensor. Compos. Sci. Technol. 2021, 202, 108600. [Google Scholar] [CrossRef]
- Chen, X.; Li, X.; Shao, J.; An, N.; Tian, H.; Wang, C.; Han, T.; Wang, L.; Lu, B. High-Performance Piezoelectric Nanogenerators with Imprinted P(VDF-TrFE)/BaTiO3 Nanocomposite Micropillars for Self-Powered Flexible Sensors. Small 2017, 13, 1604245. [Google Scholar] [CrossRef] [PubMed]
- Rahman, M.A.; Lee, B.; Phan, D.; Chung, G. Fabrication and characterization of highly efficient flexible energy harvesters using PVDF–graphene nanocomposites. Smart Mater. Struct. 2013, 22, 085017. [Google Scholar] [CrossRef]
- Yaqoob, U.; Uddin, A.S.M.I.; Chung, G. A novel tri-layer flexible piezoelectric nanogenerator based on surface- modified graphene and PVDF-BaTiO3 nanocomposites. Appl. Surf. Sci. 2017, 405, 420–426. [Google Scholar] [CrossRef]
- Kim, S.; Dong, Y.; Hossain, M.M.; Gorman, S.; Towfeeq, I.; Gajula, D.; Childress, A.; Rao, A.M.; Koley, G. Piezoresistive Graphene/P(VDF-TrFE) Heterostructure Based Highly Sensitive and Flexible Pressure Sensor. ACS Appl. Mater. Interfaces 2019, 11, 16006–16017. [Google Scholar] [CrossRef]
- Chen, J.; Li, J.; Cheng, C.; Chiu, C. Piezoelectric Property Enhancement of PZT/Poly(vinylidenefluoride-co-trifluoroethylene) Hybrid Films for Flexible Piezoelectric Energy Harvesters. ACS Omega 2022, 7, 793–803. [Google Scholar] [CrossRef]
- Kim, G.H.; Hong, S.M.; Seo, Y. Piezoelectric properties of poly(vinylidene fluoride) and carbon nanotube blends: β-phase development. Phys. Chem. Phys. 2009, 11, 10506–10512. [Google Scholar] [CrossRef] [PubMed]
- Badatya, S.; Bharti, D.K.; Sathish, N.; Srivastava, A.K.; Gupta, M.K. Humidity Sustainable Hydrophobic Poly(vinylidene fluoride)-Carbon Nanotubes Foam Based Piezoelectric Nanogenerator. ACS Appl. Mater. Interfaces 2021, 13, 27245–27254. [Google Scholar] [CrossRef]
- Zhou, X.; Parida, K.; Halevi, O.; Liu, Y.; Xiong, J.; Magdassi, S.; Lee, P.S. All 3D-printed stretchable piezoelectric nanogenerator with non-protruding kirigami structure. Nano Energy 2020, 72, 104676. [Google Scholar] [CrossRef]
- Wu, C.; Chou, M.; Zeng, W. Piezoelectric Response of Aligned Electrospun Polyvinylidene Fluoride/Carbon Nanotube Nanofibrous Membranes. Nanomaterials 2018, 8, 420. [Google Scholar] [CrossRef]
- Paik, H.; Choi, Y.; Hong, S.; No, K.S. Effect of Ag nanoparticle concentration on the electrical and ferroelectric properties of Ag/P(VDF-TrFE) composite films. Sci. Rep. 2015, 5, 13209. [Google Scholar] [CrossRef]
- Mirjalali, S.; Bagherzadeh, R.; Abrishami, S.; Asadnia, M.; Huang, S.; Michael, A.; Peng, S.; Wang, C.; Wu, S. Multilayered Electrospun/Electrosprayed Polyvinylidene Fluoride+Zinc Oxide Nanofiber Mats with Enhanced Piezoelectricity. Macromol. Mater. Eng. 2023, 308, 2300009. [Google Scholar] [CrossRef]
- Li, R.; Zhao, Z.; Chen, Z.; Pei, J. Novel BaTiO3/PVDF composites with enhanced electrical properties modified by calcined BaTiO3 ceramic powders. Mater. Express 2017, 7, 536–540. [Google Scholar] [CrossRef]
- Song, H.; Song, W.; Song, J.; Torrejon, V.M.; Xia, Q. Electrospun 1D and 2D Carbon and Polyvinylidene Fluoride (PVDF) Piezoelectric Nanocomposites. J. Nanomater. 2022, 2022, 9452318. [Google Scholar] [CrossRef]
- Kim, M.; Kaliannagounder, V.K.; Unnithan, A.R.; Park, C.H.; Kim, C.S.; Ramachandra Kurup Sasikala, A. Development of In-Situ Poled Nanofiber Based Flexible Piezoelectric Nanogenerators for Self-Powered Motion Monitoring. Appl. Sci. 2020, 10, 3493. [Google Scholar] [CrossRef]
- Li, H.; Zhu, Y.; Islam, M.S.; Rahman, M.A.; Walsh, K.B.; Koley, G. Graphene field effect transistors for highly sensitive and selective detection of K+ ions. Sens. Actuators B Chem. 2017, 253, 759–765. [Google Scholar] [CrossRef]
- Singh, A.; Uddin, M.A.; Sudarshan, T.; Koley, G. Tunable reverse-biased graphene/silicon heterojunction schottky diode sensor. Small 2014, 10, 1555–1565. [Google Scholar] [CrossRef] [PubMed]
- Khan, D.; Li, H.; Gajula, D.; Bayram, F.; Koley, G. H2 Detection Using Plasmonically Generated Surface Photoacoustic Waves in Pd Nanoparticle-Deposited GaN Microcantilevers. ACS Sens. 2020, 5, 3124–3132. [Google Scholar] [CrossRef]
- Kang, M.; Jung, W.; Kang, C.; Yoon, S. Recent Progress on PZT Based Piezoelectric Energy Harvesting Technologies. Actuators 2016, 5, 5. [Google Scholar] [CrossRef]
- Xu, M.; Kang, H.; Guan, L.; Li, H.; Zhang, M. Facile Fabrication of a Flexible LiNbO3 Piezoelectric Sensor through Hot Pressing for Biomechanical Monitoring. ACS Appl. Mater. Interfaces 2017, 9, 34687–34695. [Google Scholar] [CrossRef]
- Uppalapati, B.; Gajula, D.; Bayram, F.; Kota, A.; Gunn, A.; Khan, D.; Chodavarapu, V.P.; Koley, G. An AlGaN/GaN Dual Channel Triangular Microcantilever Based UV Detector. ACS Photonics 2022, 9, 1908–1918. [Google Scholar] [CrossRef]
- Jahangir, I.; Quddus, E.B.; Koley, G. Unique detection of organic vapors below their auto-ignition temperature using III–V Nitride based triangular microcantilever heater. Sens. Actuators B Chem. 2016, 222, 459–467. [Google Scholar] [CrossRef]
- Uppalapati, B.; Gajula, D.; Bava, M.; Muthusamy, L.; Koley, G. Low-Power AlGaN/GaN Triangular Microcantilever for Air Flow Detection. Sensors 2023, 23, 7465. [Google Scholar] [CrossRef] [PubMed]


| Temperature (°C) | 2theta (θ) | D Spacing (Å) | FWHM | Intensity (cps) |
|---|---|---|---|---|
| 60 | 19.8 | 4.46 | 1.54 | 2292 |
| 70 | 19.7 | 4.58 | 0.81 | 3366 |
| 90 | 19.4 | 4.57 | 0.67 | 6297 |
| 140 | 19.3 | 4.59 | 0.68 | 9266 |
| CB (%) | 2θ (°) | D Spacing (Å) | FWHM | Intensity (cps) | F(β) (%) | Roughness (nm) |
|---|---|---|---|---|---|---|
| 0 | 19.34 | 4.585 | 0.72 | 5805 | 76 | 5.2 |
| 0.2 | 19.32 | 4.589 | 0.71 | 6589 | 81 | 8 |
| 0.4 | 19.33 | 4.587 | 0.70 | 7903 | 83 | 21 |
| 0.6 | 19.38 | 4.591 | 0.68 | 9266 | 96.6 | 37 |
| 0.8 | 19.35 | 4.583 | 0.71 | 7892 | 87.4 | - |
| 1 | 19.38 | 4.590 | 0.72 | 4986 | 74.7 | - |
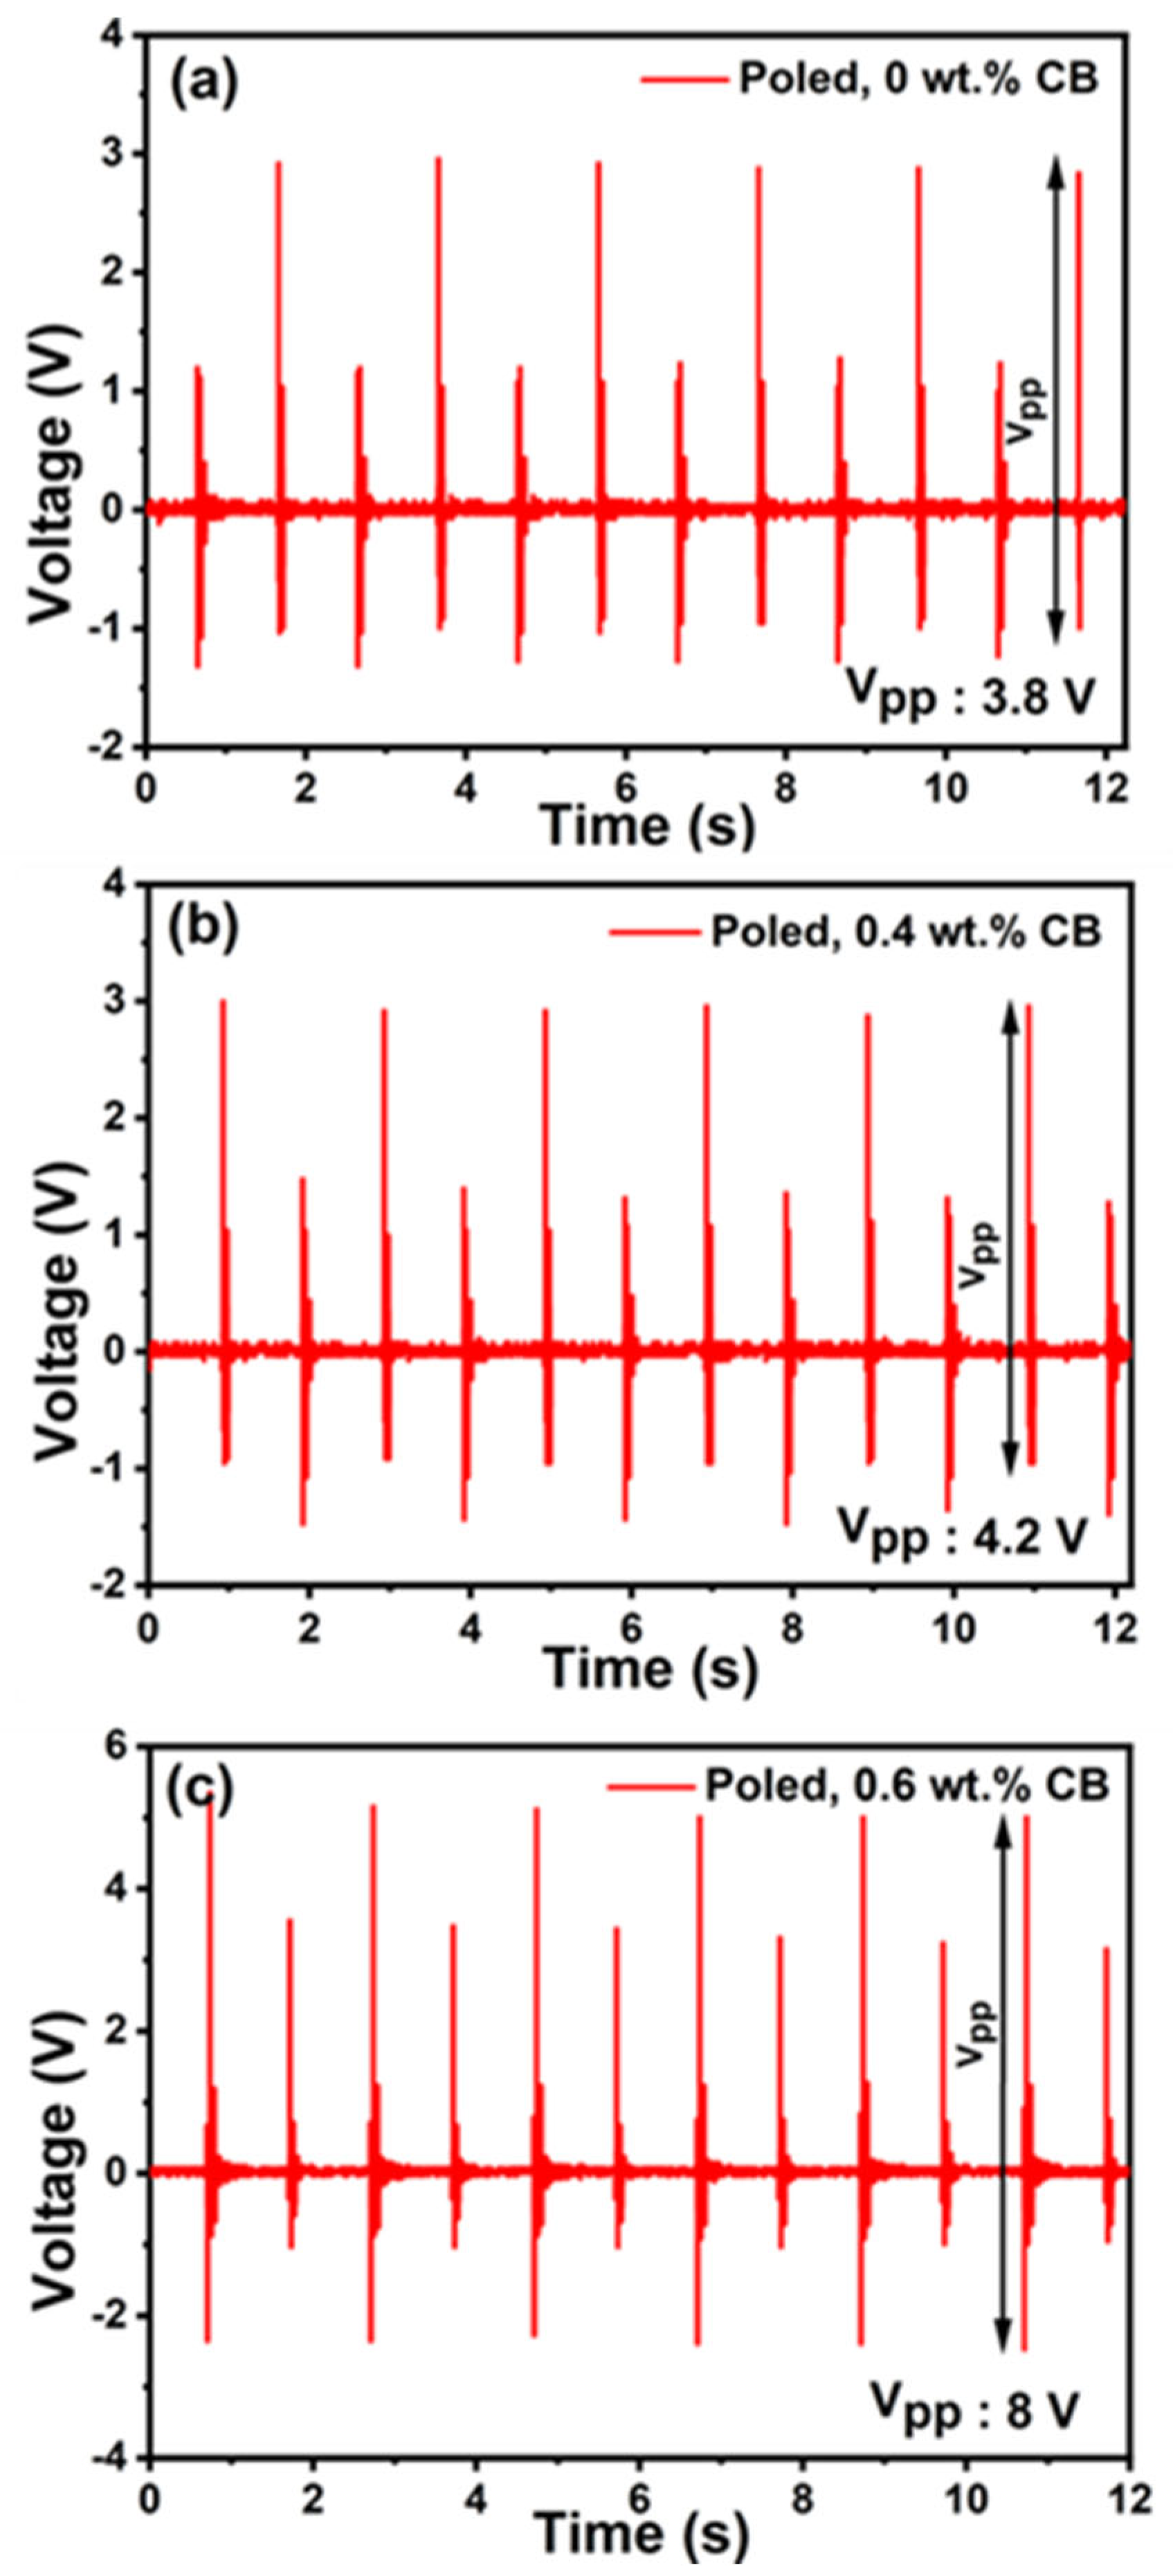
| CB wt.% | Poling Condition | Vpk-pk (V) | d33 (pC/N) |
|---|---|---|---|
| 0 | Unpoled | 0.5 | 2.8 |
| 0.2 | Unpoled | 1 | 5.4 |
| 0.4 | Unpoled | 1.9 | 8.8 |
| 0.6 | Unpoled | 3.0 | 10.5 |
| 0 | Poled | 3.8 | 20 |
| 0.4 | Poled | 4.2 | 21 |
| 0.6 | Poled | 8 | 35 |
| Poling | Samples | Synthesis | Size (cm2 × μm) | Stimuli | Maximum Voltage (V) | Current (µA) | Power Density (µW/cm3) |
|---|---|---|---|---|---|---|---|
| Self-poled | PVDF/MWCNT [19] | Phase inversion | 9 × 250 | ~3.7 N 4.13 kPa | 10pk-pk | - | - |
| PVDF/Yb 3+ [23] | Casting | 5 × 170 | 85 N 0.17 MPa | 10 | - | 5.7 | |
| PVDF/PFD-BTO [24] | Casting | 6 × 30 | 100 N ~166 kPa | 5.9 | 0.3 | 102 | |
| PVDF-TrFE/rGO [29] | Casting | 6 × 21 | 2 N 3.3 kPa | 2.4 | 1.3 | 253.3 | |
| PVDF/ZnO [49] | Casting | 2.25 × 60 | 3.5 N 15 kPa | 1.8pk-pk | 0.57 | 34.8 | |
| PVDF [50] | Quenching | 4 × 30 | Finger tapping | 19.2pk-pk | 0.7 | 758 | |
| This work | Spin coating | 4 × 5.4 | 6 N 15 kPa | 1.5 | 1.5 | 1, 100 | |
| Poled | PVDF/rGo [44] | Scrap coating | 20 × 10 | 5 N 2.5 kPa | 8.3 | 0.6 | 28.7 |
| PVDF-TrFE/MXene [51] | Electrospinning | 1 × 40 | 20 N 0.2 Mpa | 1.58pk-pk | - | 91.1 | |
| PVDF-TrFE/BaTiO3 [52] | Printing | 1 × 60 | 50 N 0.5 MPa | 13.2 | 0.3 | 2200 | |
| PVDF/Graphene [53] | Casting | 1.4 × 50 | 1g | 1.3pk-pk | - | 5.2 | |
| PVDF/BTO [54] | Spray coating | 8 × 50 | 2 N 2.5 kPa | 10pk-pk | 2.5pk-pk | 145 | |
| This work | Spin coating | 4 × 5.4 | 6 N 15 kPa | 5.1 | 5.1 | 12, 000 |
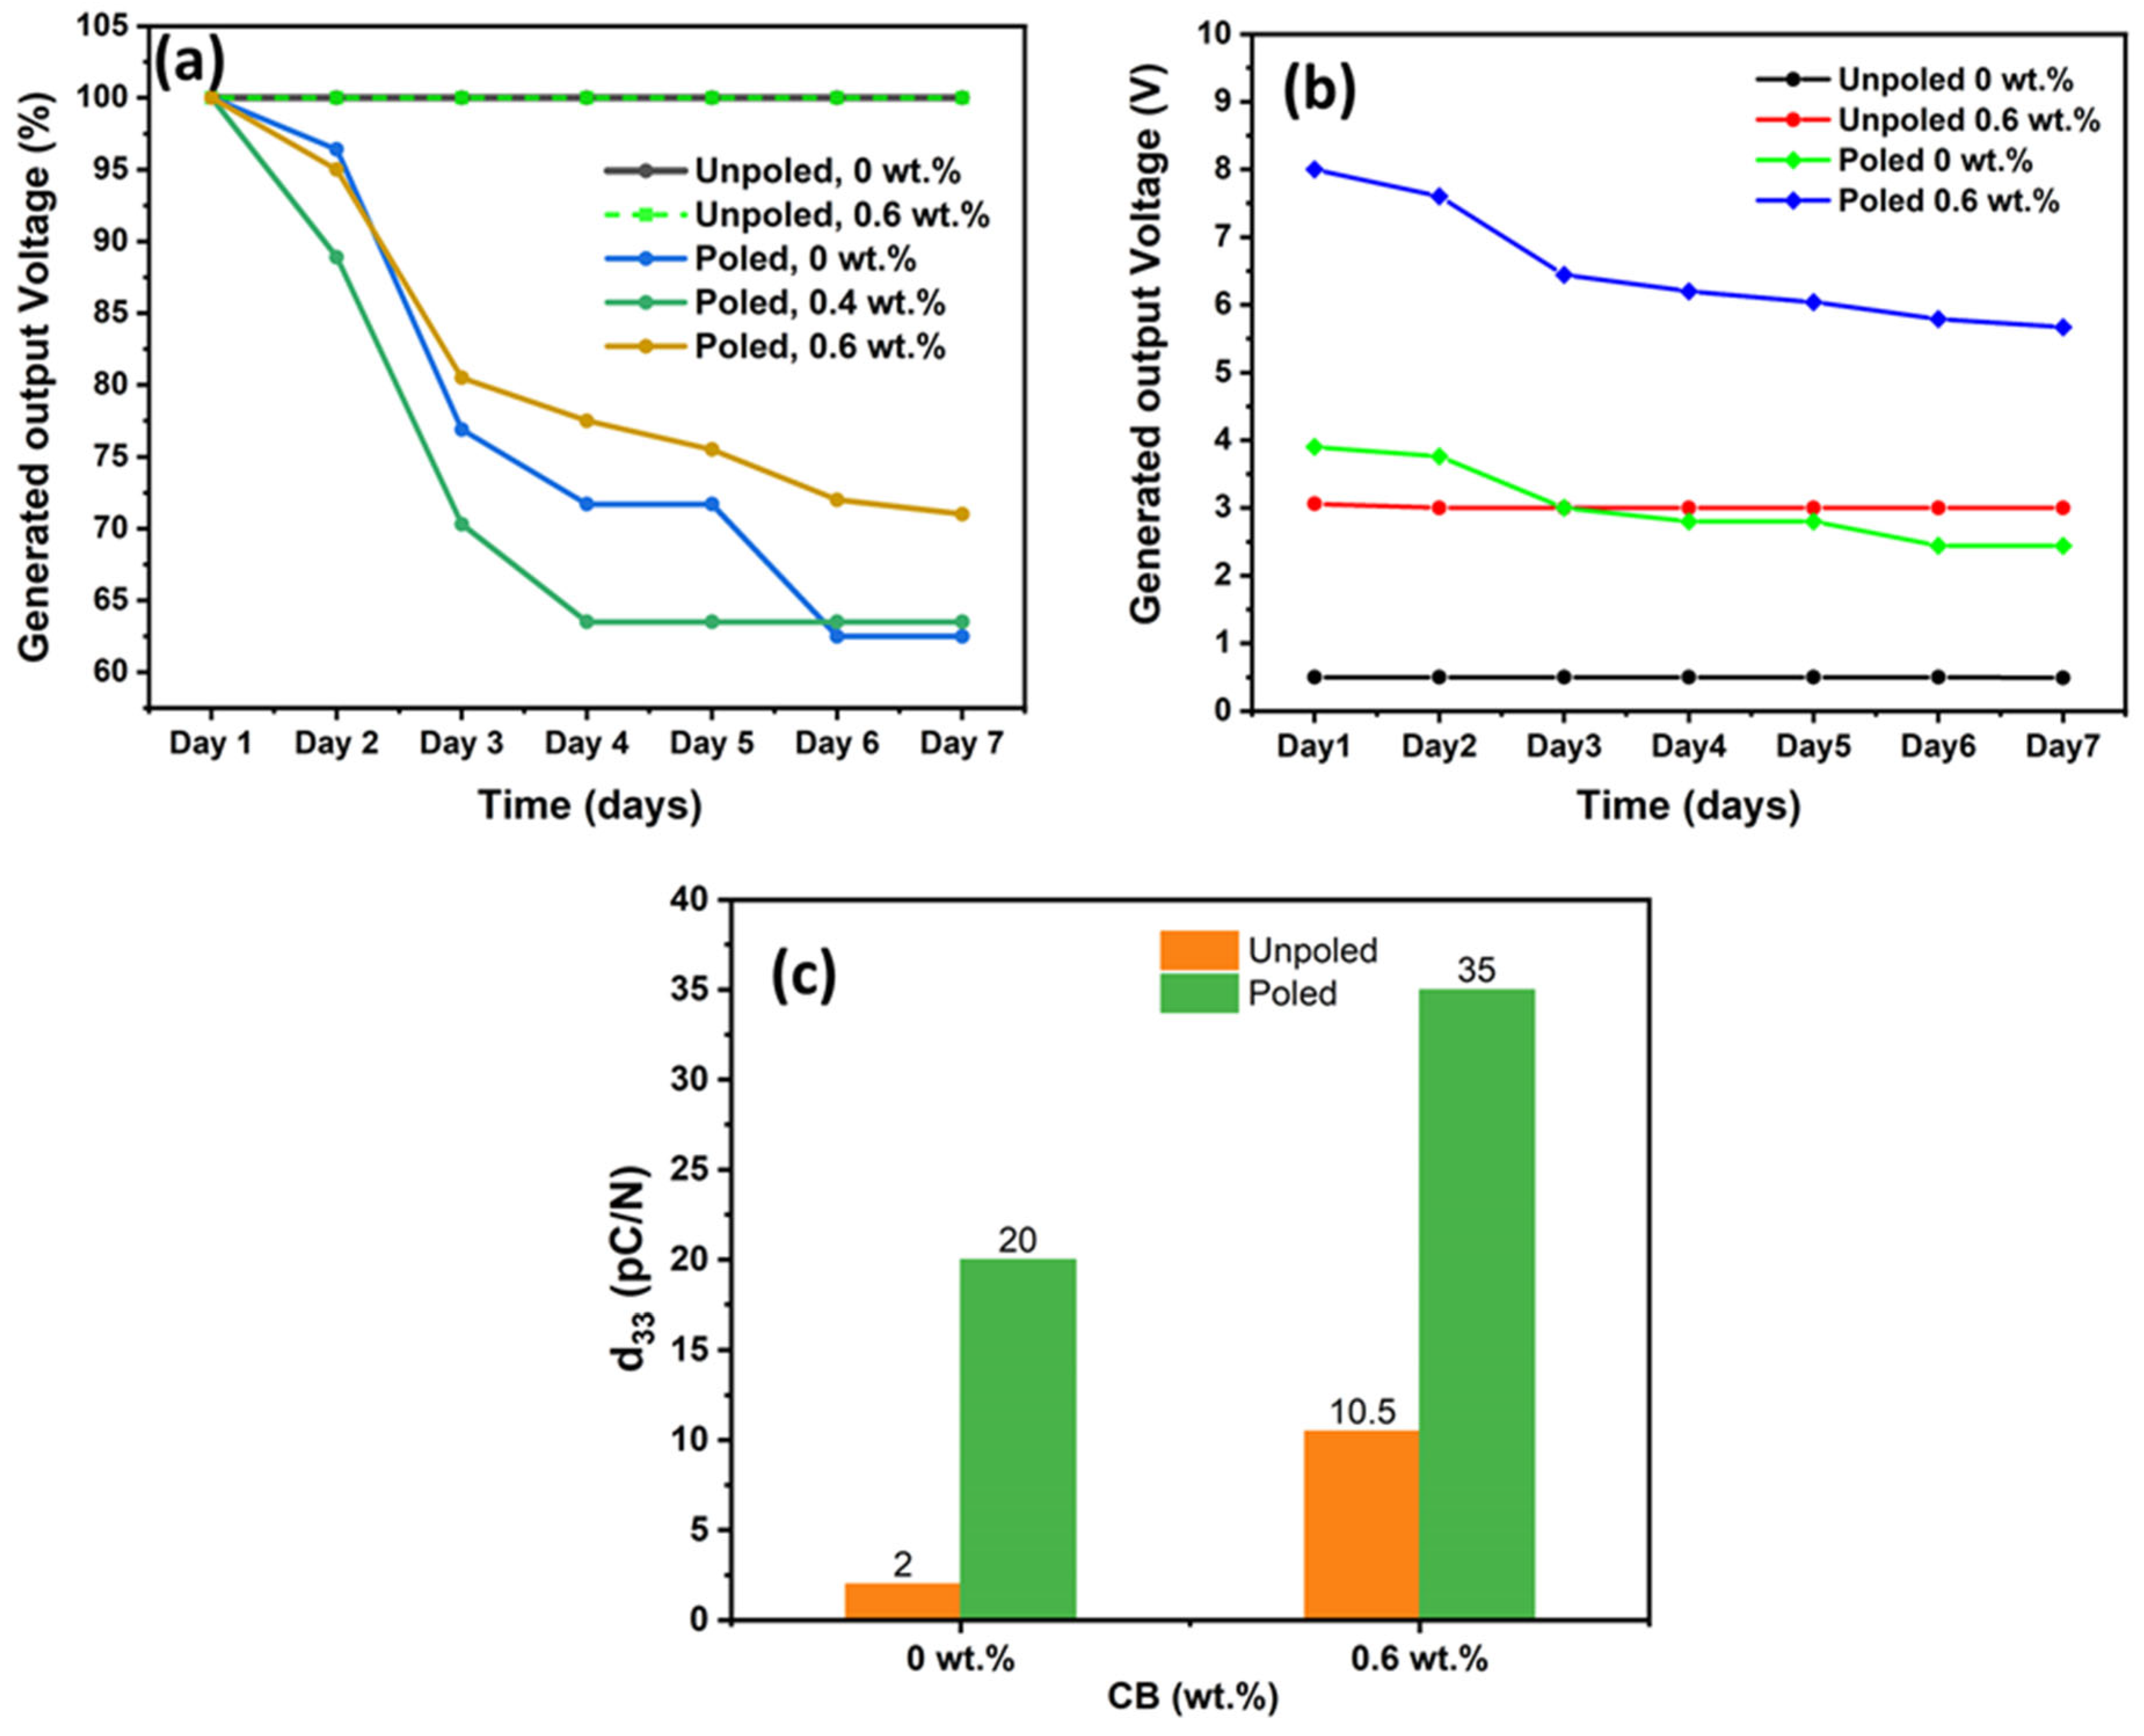
| Samples | Day1 (V) | Day2 (V) | Day3 (V) | Day4 (V) | Day5 (V) | Day5 (V) | Day7 (V) |
|---|---|---|---|---|---|---|---|
| Unpoled, 0 wt.% | 0.5 | 0.5 | 0.5 | 0.5 | 0.5 | 0.5 | 0.5 |
| Unpoled, 0.6 wt.% | 3 | 3 | 2.98 | 3 | 3 | 3 | 3 |
| Poled, 0 wt.% | 3.8 | 3.76 | 3 | 2.8 | 2.83 | 2.3 | 2.3 |
| Poled, 0.4 wt.% | 4.7 | 4.2 | 3.32 | 3.2 | 3.1 | 3.1 | 3.1 |
| Poled, 0.6 wt.% | 8 | 7.60 | 6.44 | 6.2 | 6.04 | 5.79 | 5.2 |
Disclaimer/Publisher’s Note: The statements, opinions and data contained in all publications are solely those of the individual author(s) and contributor(s) and not of MDPI and/or the editor(s). MDPI and/or the editor(s) disclaim responsibility for any injury to people or property resulting from any ideas, methods, instructions or products referred to in the content. |
© 2023 by the authors. Licensee MDPI, Basel, Switzerland. This article is an open access article distributed under the terms and conditions of the Creative Commons Attribution (CC BY) license (https://creativecommons.org/licenses/by/4.0/).
Share and Cite
Muthusamy, L.; Uppalapati, B.; Azad, S.; Bava, M.; Koley, G. Self-Polarized P(VDF-TrFE)/Carbon Black Composite Piezoelectric Thin Film. Polymers 2023, 15, 4131. https://doi.org/10.3390/polym15204131
Muthusamy L, Uppalapati B, Azad S, Bava M, Koley G. Self-Polarized P(VDF-TrFE)/Carbon Black Composite Piezoelectric Thin Film. Polymers. 2023; 15(20):4131. https://doi.org/10.3390/polym15204131
Chicago/Turabian StyleMuthusamy, Lavanya, Balaadithya Uppalapati, Samee Azad, Manav Bava, and Goutam Koley. 2023. "Self-Polarized P(VDF-TrFE)/Carbon Black Composite Piezoelectric Thin Film" Polymers 15, no. 20: 4131. https://doi.org/10.3390/polym15204131