Abstract
The preparation of poly (vinyl alcohol)/chitosan/ZnO (PVA/Cs/ZnO) nanocomposite films as bioactive nanocomposites was implemented through an environmentally friendly approach that included mixing, solution pouring, and solvent evaporation. The nanocomposite films were characterized using various techniques such as X-ray diffraction (XRD), Fourier-transform infrared (FT-IR) spectroscopy, differential scanning calorimetry (DSC), thermogravimetric analysis (TGA), and UV-Vis spectroscopy. The XRD study revealed the encapsulation of nanoparticles by the PVA/Cs blend matrix. The DSC results showed that the addition of ZnO NPs increased glass transition and melting temperature values of the PVA/Cs blend. ATR-FTIR spectra detected an irregular shift (either red or blue) in some of the characteristic bands of the PVA/Cs nanocomposite, indicating the existence of intra/intermolecular hydrogen bonding creating an interaction between the OH groups of PVA/Cs and ZnO nanoparticles. A thermogravimetric (TGA) analysis demonstrated that the nanocomposites achieved better thermal resistance than a pure PVA/Cs blend and its thermal stability was enhanced with increasing concentration of ZnO nanoparticles. UV analysis showed that with an increase in the content of ZnO NPs, the optical bandgap of PVA/Cs was decreased from 4.43 eV to 3.55 eV and linear and nonlinear parameters were enhanced. Our optical results suggest the use of PVA/Cs/ZnO nanocomposite films for various optoelectronics applications. PVA/Cs/ZnO nanocomposites exhibited significant antibacterial activity against Gram-positive and Gram-negative bacteria. It was found that nanocomposite samples were more effective against Gram-positive compared to Gram-negative bacteria.
1. Introduction
Bio-nanocomposites are a promising material due to their remarkable properties and thus have found wide applications in food preservation, packaging, drug delivery, organic dye removal, tissue engineering, and photonics []. Recently, the incorporation of nanoparticles into polymer matrices has attracted considerable attention due to the remarkable improvement in the physicochemical properties of nanocomposites even at low levels of nanofillers. Therefore, polymers, especially natural nano-biopolymers, have attracted much attention in recent years [,].
Polymer nanocomposites are mainly prepared by adding small amounts of inorganic filler into the host matrix of polymeric materials, while polymer blending involves two or more polymers being mixed to produce novel polymeric materials with promising properties for modern applications. In general, PVA and chitosan have many unique features compared to other polymers, such as biocompatibility, water solubility, non-toxicity, environmental friendliness, and biodegradability []. The hydroxyl group (-OH) attached to the mainchain of PVA acts as a source of hydrogen bonding that improves the complexation processes and consequently assists blending with other polymers []. Chitosan (Cs) is chitin’s primary derivative, containing 2-amino-2-deoxy-D-glucose and 2-acetamido-2-deoxy-D-glucose. The amine (-NH2) and hydroxyl (OH) groups in the mainchain of Cs facilitate the complexation process with inorganic fillers []. Cs has a wide range of medical applications owing to its unique biocompatibility, antimicrobial, and antifungal properties [,]. The high density of the reactive functional groups and hydrophilic properties make both PVA and Cs favorable for cross-linking with dopant materials [,]. Blending PVA and Cs yields a novel host for different types of dopant materials. The polymer blends can be classified as a completely miscible or compatible polymer blend, or an immiscible or incompatible blend. Adding inorganic particles to mixtures improves various technological properties and reduces cost [,].
Zinc oxide (ZnO) nanoparticles have attracted much attention due to their high stability, good photocatalytic activity, antibacterial properties, and nontoxicity []. ZnO nanoparticles can be prepared by various techniques, including electrochemical deposition, thermal evaporation, hydrothermal synthesis, and sol-gel [,]. Nanoparticles incorporated into the matrix of a polymer blend alters its physicochemical properties due to the interfacial interactions of the polymer blend components with the NPs, as well as the phase morphology of the polymer blend [,]. The kinetic parameters of the thermal degradation of polymers is of greater interest due to the improvement of their mechanical and thermal properties [,]. It has been reported that the thermal stability of polymers is significantly improved with incorporated metal oxide nanoparticles [].
ZnO nanoparticles have been incorporated into poly (vinyl alcohol)/chitosan polymer blends to enhance their functional properties and antimicrobial activity [,,]. However, incorporating ZnO nanoparticles in a poly (vinyl alcohol)/chitosan polymer blend faces several challenges. One challenge is achieving a homogeneous dispersion of the nanoparticles in the polymer matrix. This is important for enhancing the mechanical properties of the blend films [,]. Another challenge is maintaining the stability and compatibility of the nanoparticles with the polymer blend. The addition of ZnO nanoparticles can affect the thermal stability of the blend, and it is important to ensure that the nanoparticles do not degrade or react with the polymer components []. Additionally, controlling the concentration of ZnO nanoparticles is crucial to achieve the desired properties of the blend films. Too high of a concentration can led to agglomeration and negatively impact the mechanical properties []. Therefore, optimizing the concentration, dispersion, and compatibility of ZnO nanoparticles in the poly (vinyl alcohol)/chitosan polymer blend is essential to overcome this challenge and achieve the desired properties for the desired application, which has been attempted in this work. The effects of ZnO NP content on the structure, chemical composition, thermal degradation, and linear/nonlinear optical properties of a poly (vinyl alcohol)/chitosan polymer blend have been investigated.
In this work, a simple and environmentally friendly polymer solution blending method was carried out to prepare PVA/Cs/ZnO nanocomposite films with different concentrations of ZnO NPs. The PVA/Cs/ZnO nanocomposite films were investigated with various techniques, such as XRD, ATR-FTIR, DSC, TGA, and UV-vis spectroscopy, and their antibacterial activity was evaluated.
2. Experimental Work
2.1. Materials
PVA with a molecular weight of 72,000 was supplied by Merck (Rahway, NJ, USA); chitosan (Cs) with a molecular weight of Mw = 60,000–100,000 Da and deacetylation degree of 85% was supplied by Sigma-Aldrich (St. Louis, MI, USA). Zn (NO3)2 with Mw = 189.4 was supplied by Merck (Rahway, NJ, USA). Acetic acid and NH3 were supplied by Sigma-Aldrich (St. Louis, MI, USA).
2.2. Preparation Method
In the current work, the zinc oxide nanoparticles were prepared using co-precipitation. Typically, nitrate Zn (NO3)2 is dissolved in DI water to form transparent solutions with 0.05 M concentration. The mixture pH was adjusted by dropping 3 mL of NH3 solution slowly, followed by stirring for 2 h, till a white precipitate was formed in the solution. The white precipitate was filtered and cleaned several times with DI water to remove any remaining byproducts. The product was dried at 60 °C for 24 h, and later calcined at 110 °C in the oven for 24 h.
Preparation of PVA/Cs blend: both PVA and chitosan are typically dissolved separately to form individual solutions. In this experiment, 1 g of chitosan powder was dissolved in 200 mL of DI water and acetic acid in a glass beaker. Aqueous solution of polyvinyl alcohol (200 mL) with acetic acid was also prepared. The two solutions were then mixed and stirred for 30 min with a blend ratio 1:1 to obtain a PVA-chitosan blend. To obtain the PVA-Chitosan-ZnO nanocomposite films, 0.3 g of ZnO NPs was dissolved in 40 mL of ethanol and stirred ultrasonically for 30 min. Later, the ZnO solution was mixed with PVA-Chitosan blend with various ratios of ZnO NPs. The PVA-Chitosan-ZnO nanocomposite solution was ultrasonicated to ensure uniform distribution, then poured into a glass substrate and kept for 48 h at 50 °C in an oven. The PVA/Cs blend was prepared with doping of 2 wt%, 5 wt%, 10 wt%, and 15 wt% of ZnO NPs, respectively.
2.3. Characterization Methods
Measurements of XRD patterns were performed by a Bruker D8 advance powder XRD with a CuKα radiation source, with λ of 1.5418 Ǻ (I = 50 mA and V = 40 kV). The rate of scanning was 3°/min in the range of 2θ from 40 to 70°. ATR-FTIR spectra were recorded at room temperature in ambient air in the wavenumber range from 4000 to 400 cm−1 using a Thermo Scientific iD5 ATR spectrometer (Thermo Electron Scientific Instruments LLC, Madison, WI, USA) with a spectral resolution of 1 cm−1. DSC measurements were performed using a Netzsch DSC 214 (NETZSCH-Gerätebau GmbH, Wittelsbacherstrasse, Selb, Germany). All the samples were sealed in an aluminum pan and scans of DSC were performed in the temperature range from 25 to 200 °C with a heating rate of 10 °C/min. The thermal degradation of PVA/Cs and PVA/Cs/ZnO nanocomposites were carried out using a Netzsch TG 209 (NETZSCH-Gerätebau GmbH, Wittelsbacherstrasse, Selb, Germany) Thermogravimetric analyzer (TGA) under a nitrogen atmosphere with a constant flow rate of 20 mL min−1 in the temperature range from 25 to 1000 °C at a rate of 10 °C/min. The sample holder used was crucibles made of alumina (Al2O3) in which approximately 5 mg sample was degraded.
2.4. Antibacterial Activity
The antibacterial activity of PVA/Cs and PVA/Cs/ZnO nanocomposites was evaluated against (S. aureus) and (E. coli) bacteria with the agar well diffusion method by evaluating the zone of inhibition (mm). This method was reported previously in more detail [,].
3. Results and Discussion
3.1. XRD
Figure 1a shows that the XRD pattern of ZnO NPs has several sharp diffraction peaks at 31.69°, 34.37°, 36.32°, 47.53°, and 56.70°. These peaks correspond to the (100), (002), (101), (102), and (110) planes of typical hexagonal wurtzite crystalline ZnO with the space group P63mc (Card No. 96-900-4180) []. Figure 1b illustrates the XRD pattern of the PVA/Cs polymer blend and PVA/Cs/ZnO nanocomposites. The XRD pattern of the PVA/Cs polymer blend displayed two diffraction peaks at 2θ = 11.89° and 22.37°. The broad diffraction peak at 2θ = 22.37° confirms the semicrystalline nature of the pure PVA/Cs polymer blend due to the inter/intramolecular interaction through hydrogen bonding among the chains of both PVA and chitosan. On the other hand, we found that with the increase in ZnO NP content in the PVA/Cs blend, the broadness of the diffraction peaks increased, and their intensity decreased, which indicates that the amorphous structure of the PVA/Cs polymer blend was enhanced. The characteristic peaks of the PVA/Cs blend were shifted and observed at 12.36° and 24.05° in PVA/Cs/ZnO nanocomposites. The broadness and decrease in the intensity may be ascribed to the interaction between ZnO NPs and the PVA/Cs polymer blend.
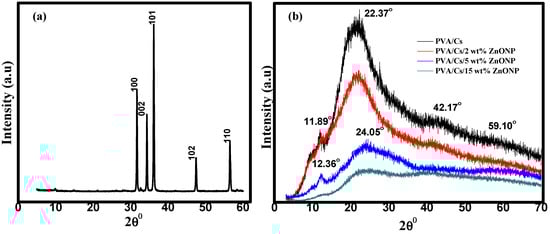
Figure 1.
XRD of (a) ZnO NPs and (b) PVA/Cs and PVA/Cs/ZnO NPs composites.
These results confirm that there is a variation in the electrostatic interactions between PVA/Cs and the ZnO NPs which alters the blend structure with the change in the content of ZnO, causing an increase in the amorphous degree in the nanocomposite samples []. Similar behavior has been reported previously for polymeric nanocomposites [,,]. The XRD pattern of nanocomposites with higher ZnO content clearly showed some characteristic diffraction peaks of the ZnO nanoparticles at 2θ = 42.17 and 59.10°, and the major diffraction peaks of the PVA/Cs blend confirmed ZnO nanoparticle incorporation in the nanocomposite’s samples. These characteristic peaks are attributed to the hexagonal Wurtzite structure of ZnO NPs []. The observed variation in peak positions and intensities is attributed to the differences in the size of the embedded ZnO nanoparticles and to the lattice strain which is developed in the nanocomposite samples due to the existence of the ZnO NPs []. Thus, XRD data confirmed ZnO-NP dispersion in the PVA/Cs polymer blend matrix.
3.2. ATR-FTIR Spectra
ATR-FTIR spectra were performed to understand the chemical and structural nature of PVA/Cs/ZnO nanocomposites. Figure 2 illustrates the ATR-FTIR spectrum of the PVA/Cs blend and PVA/Cs/ZnO nanocomposites. The spectra of FT-IR confirmed the interaction between metal oxide and polymeric materials in the wavenumber range 500–4000 cm−1. The characteristic FT-IR spectrum of the PVA/Cs blend is depicted in Figure 2a. The intense and broad transmission band centered at 3304 cm−1 was assigned to the stretching vibration of the –OH and –NH2 groups and to O–H/N–H interacting with the oxygen of the C=O group []. The bands at 2928 and 2863 cm−1 were attributed to the asymmetric stretching vibration of CH3 and CH2 of chitosan []. The bands at 1656 cm−1 were ascribed to C=O stretching (Amide I), 1563 cm−1 to N-H bending (Amide II), and 1394 cm−1 to –COO- stretching vibration. The bands at 1325 cm−1 were ascribed to C–O stretching and 1252 cm−1 to O–H bending [,]. The transmission bands at 1158, 1051, and 1012 cm−1 were attributed to the glycosidic linkage and C–O–C vibration of the glucose ring []. The band at 1116 cm−1, which was observed as a minor shoulder, was attributed to β(1–4) glucosidic stretching []. The band at 886 cm−1 was ascribed to unsaturated CH2 stretching of PVA [].
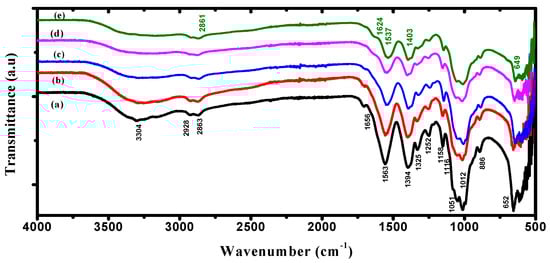
Figure 2.
ATR-FTIR spectra of (a) PVA/Cs, (b) PVA/Cs/2 wt% ZnO, (c) PVA/Cs/5 wt% ZnO, (d) PVA/Cs/10 wt% ZnO and (e) PVA/Cs/15 wt% ZnO.
Figure 2b–e shows the FT-IR spectra of the PVA/Cs/ZnO nanocomposite samples. It was found that ZnO NPs had a significant effect on some of the functional groups of the PVA/Cs blend due to the complexation or interactions between these groups and ZnO NPs. It was observed that the transmittance of some functional groups was predominately decreased. The intensity of O–H/N–H stretching was found to decrease with increasing ZnO NPs content in the PVA/Cs matrix and became broader and covered a wide range from 3435 to 3104 cm−1 compared to the pure PVA/Cs blend, as can be seen in Figure 2e. This can be explained based on the reduction in hydrogen bonds between the –OH and –NH2 groups with the incorporation of ZnO NPs into the matrix of the PVA/Cs blend []. The band of asymmetric stretching vibration of CH2 was slightly red-shifted with a shift order of 2 cm−1 and appeared at 2861 cm−1 in the highly doped sample of the PVA/Cs blend. The band intensities of amide I and amide II were decreased and red-shifted to a lower wavenumber to appear at 1524 cm−1 and 1537 cm−1 with shift orders of 32 cm−1 and 26 cm−1, while the band of COO- stretching vibration was blue-shifted to a higher wavenumber and appeared at 1404 cm−1 with a shift order of 10 cm−1. These features are because of the strong interaction between the PVA/Cs blend and ZnO NPs by making co-ordinations between these functional groups and Zn2+ ions. This is evidence for the hydrogen bond formation between ZnO NPs and the pure PVA/Cs blend. Hence, it can be concluded that ZnO NPs will be located between the PVA/Cs chains which are linked through functional groups [,]. The band at 652 cm−1 is due to the attachment of the stretching mode of ZnO and the amide group []. The bands between 500 and 750 cm−1 are attributed to the Zn–O vibration of ZnO []. The wavenumber and assignment of the ATR-FTIR bands of PVA/Cs/ZnO nanocomposites are listed in Table 1.

Table 1.
The wavenumber and assignment of ATR-FTIR bands of PVA/Cs/ZnO nanocomposites.
3.3. DSC Measurements
Thermal properties of PVA/Cs/ZnO nanocomposites were studied using DSC to interpret the influence of ZnO NPs on the glass transition temperature (Tg) of PVA/Cs/ZnO nanocomposite samples. DSC thermograms of all samples are displayed in Figure 3 and the results are summarized in Table 2. It is noted that the incorporation of ZnO nanoparticles increased the Tg value of the PVA/Cs blend from 80.96 °C to 103.62 °C. The glass transition process was affected by the chain stiffness and molecular packing []. The increase in Tg values with the increase in ZnO content may be due to the confinement effects and the strong coupling between the PVA/Cs blend and ZnO nanoparticles. This coupling leads to the restriction of the segmental motion of the molecular chains and hence the increase in Tg.

Figure 3.
DSC thermograms of PVA/Cs blend and PVA/Cs/ZnO nanocomposites.
Table 2.
Tg and Tm values of PVC/Cs and PVC/Cs/ZnO nanocomposite samples.
The increase in the values of Tg of the PVA/Cs blend is similar to the observed results in silica/ PVA composites []. It was found that the melting temperature (Tm) of the PVA/Cs blend was 153.42 °C. Table 2 shows the increase in Tm from 153.42 °C to 183.96 °C with the increase in the content of ZnO NPs. The increase in the melting temperature of PVA/Cs/ZnO nanocomposites may be attributed to the strong interactions among hydroxyl groups of the PVA/Cs blend and ZnO NPs.
3.4. TGA
The thermal properties of nanocomposite materials are among the most important properties that are used in packaging applications, particularly in food packaging. TGA is a very important tool for assessing the thermal stability of manufactured nanocomposite materials. Figure 4a–c displays the (TGA) and DTG plots of the PVA/Cs blend and PVA/Cs/ZnO nanocomposites in the temperature range from 25 to 800 °C. It can clearly be seen that the thermal degradation of pure PVA/Cs and nanocomposites with low ZnO NPs content was achieved in four steps, while for nanocomposites with high ZnO NP content it was achieved in three steps. It has been reported that the addition of ZnO to different polymer matrices leads to degradation or stabilization effects []. In the first stage, the weight loss for all samples was attributed to the evaporation of water in all samples at different maximum temperatures (Tm) depending on the content of ZnO NPs in the nanocomposite samples. The water absorption in the PVA/Cs blend is related to the availability of hydroxyl and amino groups that interact with water molecules through hydrogen bonding [].
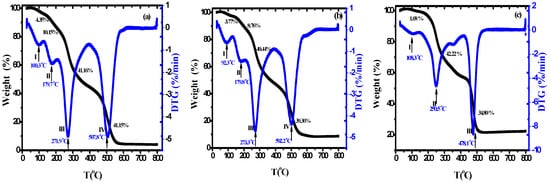
Figure 4.
TGA/DTG of (a) PVA/Cs, (b) PVA/Cs/2 wt% ZnO, and (c) PVA/Cs/15 wt% ZnO nanocomposites.
The water molecules interacted with various polar groups and the interaction with the amine groups was weaker than those containing hydroxyl groups. It was found that the water content depends on the concentration of ZnO NPs, as shown in Figure 5, and decreases with increasing content of ZnO NPs (5.84% in pure PVA/Cs blend and 0.62% in the highly doped PVA/Cs/ZnO nanocomposite sample at a temperature of 150 °C). Hence, with increasing ZnO NP concentration, a decrease in the water absorption ability was observed.
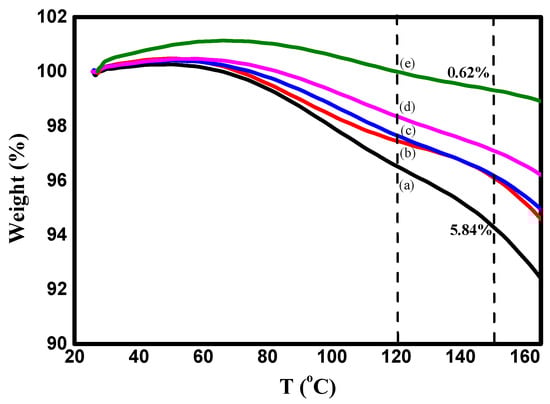
Figure 5.
TGA plots of PVA/CS and PVA/Cs/ZnO nanocomposites in the first stage I: (a) PVA/Cs, (b) PVA/Cs/2 wt% ZnO, (c) PVA/Cs/5 wt% ZnO, (d) PVA/Cs/10 wt% ZnO and (e) PVA/Cs/15 wt% ZnO.
The weight loss of the PVA/Cs blend and PVA/Cs/ZnO nanocomposites in the second and third stages may be attributed to the decomposition of the chains into small fragments and degradation of saccharide rings []. Further weight loss in the fourth stage may be attributed to the cleavage of the C–C bond in the PVA/Cs chain []. Pyrolysis of the polysaccharide polymers begins with a random splitting of the glycosidic bond followed by further hydrolysis, forming butyric and acetic acids and a series of lower fatty acids []. Maximum temperature ™ with weight loss rate for each degradation stage is a good indicator to define the difference in degradation temperatures of the samples quantitatively. The maximum temperature (Tm), the percentage of weight loss (%), initial temperature (Ti), and the residual mass (%) values for PVA/Cs and PVA/Cs/ZnO nanocomposites in each degradation stage are summarized in Table 3. The initial temperature (Ti) is the temperature at which the loss in weight of the initial sample is 5%. Both the initial temperature and the residual mass of PVA/Cs/ZnO nanocomposites increased with the increase in ZnO NP content, indicating that the nanocomposite samples were more thermally stable than the pure PVA/Cs blend. The same behavior has been reported previously by other researchers [,].
Table 3.
Maximum temperature (Tm) and weight loss percentage (%) for PVA/Cs/ZnO nanocomposites.
In general, the TGA plots revealed that the weight loss of PVA/Cs/ZnO nanocomposites was lower than that of the PVA/Cs polymer blend. The incorporation of ZnO NPs increased the thermal stability of the PVA/Cs matrix, demonstrating that thermal stability is directly related to the concentration of nanoparticles. The change in thermal stability of PVA/Cs/ZnO nanocomposites could be interpreted as follows: on one hand, the existence of ZnO in the PVA/Cs blend may restrict the polymer chains’ mobility due to the formation of networks of polymer chains and inorganic moiety and may act as a thermal insulator and barrier to the volatile products formed during the decomposition process, thus delaying the thermal decomposition []. On the other hand, ZnO as a semiconductor can create oxygen and oxygen vacancies via thermal stimulation in the lattice structure. Free oxygen increases the formation of peroxy radicals to break the chains of the polymer and oxygen vacancies will trap and bind electrons to create active catalytic positions in ZnO. Thus, the presence of oxygen and free oxygen vacancies will have a major effect on the decomposition process of polymers [].
Thermal Degradation Kinetics
The TGA/DTG technique is very important in determining the decomposition steps, decomposition temperature, and kinetic parameters of solids. Kinetics of thermal degradation processes are expressed by different equations taking into consideration the characteristic features of its mechanisms. The reaction rate can be described by conversion degree (g) based on the following equation []:
where mi, mt, and mf are the initial mass, current mass of the sample t, and final mass, respectively. The rate of many condensed phase reactions can be determined in terms of the temperature (T) and the reaction conversion (g). The reaction rate in the non-isothermal kinetics can be expressed as follows:
where q, k(T), f(g), f, and Ea are the linear rate of heating rate, rate constant, differential conversion function, frequency factor, and activation energy and R is the universal gas constant, respectively. The frequency factor based on the Eyring rate theory can be described as follows []:
Here, γ, e, kB, Tm, h, and ΔS are the transmission coefficient (unity for monomolecular reaction), Neper number (e = 2.7183), Boltzmann’s constant, the maximum temperature of the decomposition stage, Planck’s constant, and the activation of entropy, respectively. Thus, the rate constant can be expressed as follows []:
The change in the activation of entropy (ΔS) can be estimated using the following equation []:
and
Hence, from Equations (5) and (6), the Gibbs free energy (ΔG) of every stage can be calculated at the maximum temperature (Tm) by a well-known thermodynamic equation as follows:
Activation energy (Ea) and frequency factor (f) of each decomposition stage can be evaluated by applying the Coats and Redfern approximation as follows []:
In the case of 2RT/Ea << 1, Equation (8) will become:
Figure 6 illustrates the variation of versus 103/T for pure PVA/Cs and some samples of PVA/Cs/ZnO nanocomposites in the first stage as a representative curve for the other stages. From the intercept and slope, the values of frequency factor, activation energy, and regression of each degradation stage were evaluated for all samples and are presented in Table 4. Also, using Equations (5)–(7), the values of ΔS, ΔH, and ΔG are calculated and given in Table 4. Our results are in good agreement with previously reported data [,]. The slight difference between our results and the reported data may be due to different conditions such as the different gas flow and heating rates. Low activation entropy values indicate that the polymer sample has undergone some form of chemical or physical rearrangement of the initial structure, bringing it into thermodynamic equilibrium. This is why the material showed little reactivity in this case, which increases the time required to form the activated complex. In contrast, when the activation entropy values are high, this indicates that the polymer material will not be in thermodynamic equilibrium. The reactivity in this case will be high, and the system will react quickly to produce an active complex; hence, short reaction times are obtained. The negative values of ΔS as mentioned in Table 4 confirm that the formation of the activated complexes is directly related to the decrease in entropy, i.e., the activated complexes are more ordered structures compared to the starting materials, and hence these reactions are classified as slow [].
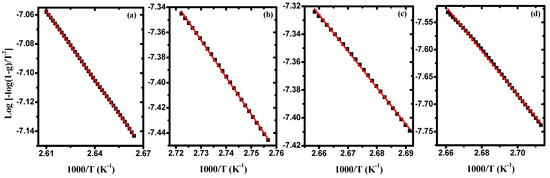
Figure 6.
Log[−log(1−g)/T2] against 1000/T in the first stage for (a) PVA/Cs, (b) PVA/Cs/2 wt% ZnO -NPs, (c) PVA/Cs/5 wt% ZnO - NPs, and (d) PVA/Cs/10 wt% ZnO -NPs.
Table 4.
The kinetic parameters for PVA/Cs and PVA/Cs/ZnO nanocomposites are based on C–R approach.
The correlation between Ea and f values, as given in Table 4, confirmed the existence of the compensation phenomenon or the isokinetic effect [], as illustrated in Figure 7a–c. The observed linear relationship between (ΔS) and (ΔH) indicated the existence of the compensation phenomenon in PVA/Cs/ZnO nanocomposites, as shown in Figure 8a–c. Such behavior has been reported for various polymer blends and polymer composites [,,]. Structural changes that may arise when increasing the temperature of the polymeric material to reach equilibrium is the reason for the existence of the linear relationship between ΔH and ΔS, i.e., the variation in ΔH values is compensated by the variation in ΔS values [].
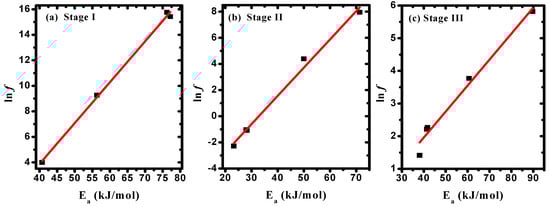
Figure 7.
Frequency factor versus the activation energy in (a) stage I, (b) stage II, and (c) stage III.
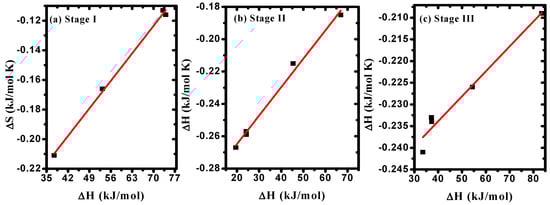
Figure 8.
ΔS versus ΔH in (a) stage I, (b) stage II, (c) stage III.
3.5. UV-Vis Spectroscopy
Figure 9a displays the absorption spectra of the PVA/Cs blend and PVA/Cs/ZnO nanocomposites. The spectra of the PVA/Cs blend show an absorption band at 217 nm and a shoulder centered at 288 nm. These bands are attributed to π-π* and to n-π* transition, respectively []. These bands shifted after incorporating ZnO NPs and appeared at 242 nm and 305 nm, and a new absorption peak characteristic to ZnO nanoparticles was observed at 343 nm in the highly doped PVA/Cs/ZnO nanocomposite samples []. These observations are an indication of the complexation between the ZnO NPs and PVA/Cs matrix by hydrogen bonding through OH groups. Also, the absorption edge was found to be red-shifted to higher wavelengths (lower energies) by increasing the content of ZnO nanoparticles in the PVA/Cs/ZnO nanocomposites.
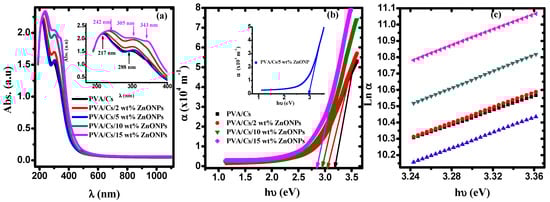
Figure 9.
(a) The absorption against λ, (b) α against hυ, (c) Ln α against hυ.
The values of the absorption edges were estimated from the plot of absorption coefficient (α = 2.303 A/d; A is the absorption and d is the thickness of the samples) against the incident photon energy (hυ), as shown in Figure 9b. By extrapolating the linear portion of Figure 9b to α = 0 on the x-axis, values of the absorption edge are estimated and given in Table 5. The observed shift in the absorption edge to lower energies (higher wavelengths) with increasing the content of ZnO in PVA/Cs nanocomposites could be attributed to the phase transition, i.e., from the crystalline phase to the amorphous phase, which ultimately may reflect in the optical bandgap energy values. This shift is an indication of the existence of intra-/intermolecular interaction among Zn+ ions and adjacent OH groups in the PVA/Cs matrix.
Table 5.
Optical parameter values of PVA/Cs/Ag nanocomposites.
3.5.1. Urbach Energy (EU)
More information regarding the band structure of nanocomposite samples can be obtained by knowing the Urbach energy (EU), which describes the system order of the material by estimating the tail width of localized states in the forbidden gap using the following equation []:
where α0 is a pre-exponential factor. Variation of Ln α versus (hυ) is shown in Figure 9c. By knowing the slope of the fitted lines in the plot, EU values are evaluated and tabulated in Table 5. The variation of the EU values with various concentrations of ZnO NPs is an indication of the enhancement of the amorphous phase of the PVA/Cs matrix and suggested that the trap states are generated because of the doping of ZnO NPs. Moreover, more information regarding the density of defects (DOF) and relaxation of the distorted bond can be obtained by determining the steepness parameter (β) and the electron–phonon interaction strength (Ee-p). Values of β and Ee-p are evaluated as follows []:
where kB and T are Boltzmann’s constant and room temperature, respectively. The estimated values β and Ee-p are given in Table 5. As the steepness parameter decreases, the values of Ee-p are increased. This variation indicates that near the absorption edge, the defect density states increased, confirming that the crystallinity of PVA/Cs decreases with increasing ZnO NPs content.
3.5.2. Optical Bandgap Energy (Eg)
The optical bandgap energy (Eg) of the materials is estimated from Tauc’s equation as follows:
where B is a constant and correlated with the sample structure and y is an empirical index describing the electronic transition. For allowed direct transitions, the y-value will be ½, while for allowed indirect transitions, the y-value will be ½. Figure 10 shows the variation of (αhυ)2 against hυ for PVA/Cs with various concentrations of ZnO nanoparticles. By extending the linear part of the plot to intersect the x-axis at (αhυ)2 = 0, values of direct optical bandgap energy (Edg) were computed and are given in Table 5. It is evident that as the ZnO NPs content increases, the Edg values in the nanocomposite samples decrease. It is interesting that there are two values of the direct optical bandgap energies as listed in Table 5. This decrease in Edg values can be attributed to the generation of new energy levels in the bandgap, which makes it easier for electrons to move from the valence band to the conduction band through these new energy levels.
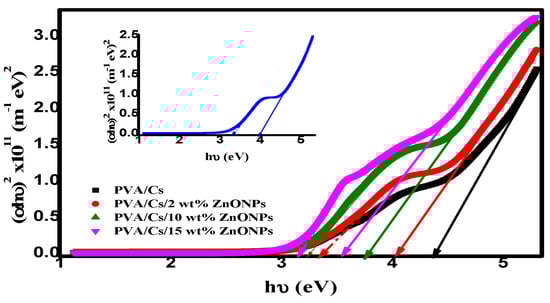
Figure 10.
(αhυ)2 versus hυ.
The number of carbon clusters (Ncc) of PVA/Cs and PVA/Cs/ZnO nanocomposites was evaluated using the optical bandgap according to the following relation []:
The Ncc value was increased from 60 for PVA/Cs to 90 for PVA/Cs/15 wt% ZnO nanocomposite. This increase in the values of Ncc is attributed to the resulting conjugation between monomer units of the PVA/Cs matrix after incorporating the ZnO NPs []. The improvement of Ncc values is attributed to the ZnO NP content; more defects in the PVA/Cs matrix are produced with an increase in the content of ZnO, leading to the generation of additional low energy states, and consequently the optical bandgap is decreased, resulting in an improvement of the values of Ncc.
3.5.3. Refractive Index–Energy Gap Correlation
Many of the optical parameters such as atomic polarizability, static, and high-frequency dielectric constants that contribute effectively to the utilization of materials in optoelectronic applications are directly related to the refractive index (n). Also, the refractive index is correlated with the optical energy gap (Eg), and this relationship is the basis for the design of optoelectronic devices. The correlation between the refractive index and the energy gap can be expressed by different relations. A linear relation between the refractive index and the energy gap is proposed by Ravindra et al. as follows []:
As the energy levels of the materials can be scaled by a factor of , where εopt = n2, Moss suggested the following relation []:
Hervé-Vandamme suggested the following relation according to the theory of vibrations []:
where EH = 13.6 eV represents the ionization energy of hydrogen. Various relations are suggested by Reddy and Singh-Kumar as follows [,]:
where K and B equal 3.366 and −0.3223, respectively. The refractive index values of the PVA/Cs blend and PVA/Cs/ZnO nanocomposites were computed based on these different models and are given in Table 6. Obviously, the average value of n is enhanced and increased from 1.852 for PVA/Cs to 2.072 for the highly doped nanocomposite sample, indicating that ZnO modified the PVA/Cs matrix and resulted in denser nanocomposites with a lower optical band gap and higher refractive index. Polymeric nanocomposites with higher refractive index values have promising applications in the field of photonics due to their ability to reduce the reflection loss at interfaces and are also used in anti-reflective coating and fabrication of solar cells [].
Table 6.
Refractive index values based on the different models.
3.5.4. Single Oscillator Model
Refractive index (n) plays an important role in advancing light-emitting diodes, optoelectronics, and waveguides []. Values of n depend mainly on the bond strength, molecular weight, and density of the material and are related directly to the reflectance (R) and extinction coefficient (k = αλ/4π) as follows:
where R is estimated using the empirical formula and T is the transmittance, respectively []. Figure 11a displays the variation of the refractive index against wavelength for all samples. It is observed that the refractive index showed dispersion behavior in the range of 400–600 nm. This dispersion can be interpreted using the single oscillator model (SOM). The correlation between refractive index and photon energy can be presented as follows []:
where E0 and Ed are the oscillation energy and dispersion energy, respectively. The static refractive index (no) and static dielectric constant (εs) can be estimated using the following equations:
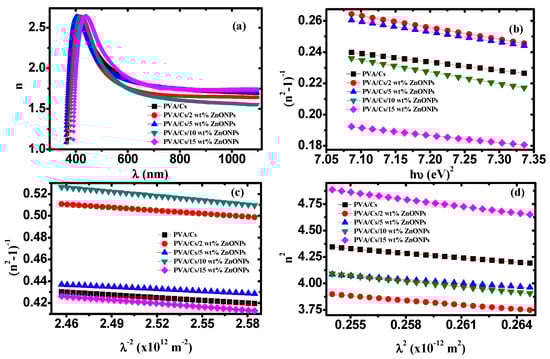
Figure 11.
(a) n versus λ, (b) (n2 − 1)−1 versus (hυ)2, (c) (n2 − 1)−1 versus λ−2, (d) n2 versus λ2.
Figure 11b shows the dependence of (n2−1)−1 on (hυ)2 for the PVA/Cs blend and PVA/Cs/ZnO nanocomposites. The oscillation and dispersion energy were evaluated by determining the intercept (Eo/Ed) and slope (−1/EoEd) of the fitted curves of Figure 11b. Also, no and εs values were estimated using Equation (21) and are given in Table 7. The interaction strengths (f = EdEo) between the material and the electromagnetic radiation were also estimated and are listed in Table 7.
Table 7.
Dispersion parameter values of PVA/Cs/ZnO nanocomposites.
The dispersion parameters (E0 and Ed) were used to calculate the transition moments of the optical spectrum (M−1 and M−3) of the PVA/Cs blend and the PVA/Cs/ZnO nanocomposite samples as follows []:
The values of M−1 and M−3 are determined and listed in Table 7. M–1 and M–3 values were enhanced with the increase in ZnO nanoparticle content. Since Ed >> E0 and the parameters M–1 and M–3 depend mainly on the values of Ed and E0, M–1 and M–3 values will have similar behavior to Ed. Also, M–1 and M–3 values are increased with decreases in the optical bandgap energy. Since E0 is proportional to the frequency of optical transition and Ed depends on the charge’s distribution in the unit cell and the chemical bonds confirming the dependence of the optical properties on the material structure, the high values of Ed, M–1, and M–3 indicate that the crystallinity of the PVA/Cs blend is reduced [].
For more information regarding the dispersion of refractive index, a single-term Sellmeier oscillator was applied []. Hence, the Wemple–Didomenico formula to calculate the values of no at an infinite wavelength should be rewritten as follows []:
where λ0 is the average oscillator wavelength. Solving for (n2 − 1)−1 will give
The dispersion Equation (20) can be rewritten again in terms of λ, where E = hc/λ, as follows:
Thus, from Equations (24) and (25), we will obtain:
Consequently, we can obtain the following equations.
So, Equation (25) can be expressed in terms of (λ0) and average oscillator strength (s0) as follows:
Figure 11c illustrates the dependence of 1/(n2−1) on λ−2 for PVA/Cs and the PVA/Cs/ZnO nanocomposites. Values of so and λo were estimated by determining the slope (−1/s0) and intercept (1/s0 λ02) of the fitted curves of Figure 11c and are summarized in Table 7.
The correlation between refractive index and wavelength can be represented using the following equation:
where εL, ε0, e, c, N, and m* are the lattice dielectric constant, free space permittivity, electron charge, speed of light, concentration of charge carriers, and electron effective mass, respectively. The dependence of n2 on λ2 for PVA/Cs and the PVA/Cs/ZnO nanocomposites are displayed in Figure 11d. εL and (N/m*) values for all samples were evaluated from the intercept and slope of the fitted lines in Figure 11d and are given in Table 7. Values of charge carrier concentration (N) were estimated by the effective mass of the electron (m* = 0.44mo, where mo is the electron rest mass) and are summarized in Table 7. It was found that the values of (N) increased with increasing ZnO content in PVA/Cs. Also, it was found that εL values were higher than the values of εs as listed in Table 7. The difference between εL and εs values was ascribed to the increase in the free carrier concentrations and to the contribution of the polarization which resulted within the material after light fell on the sample []. The variation of Ed, E0, εs, and n0 values indicates an increase in the charge transfer between the PVA/Cs macromolecules and ZnO NPs and an increase in the disorder degree in the PVA/Cs matrix [,]. The plasma frequency (ωp) of PVA/Cs and PVA/Cs/ZnO nanocomposites were calculated based on the Drude free-electron mode according to the following equation and are also summarized in Table 7:
Equation (30) indicates that ωp values depend mainly on values of N. When the frequency (ω) of the incident light and plasma frequency (ωp) are equal, higher absorption occurs. However, when ω < ωp, no radiation can propagate within the materials while, when ω > ωp the material becomes transparent, and the electronic oscillation occurs.
3.5.5. Linear and Nonlinear Parameters
When a light with high intensity falls on the material, nonlinear behavior is produced. The resulting polarization (P) inside the material is a nonlinear function of an electric field (E) and can be expressed as follows []:
where χ(1), χ(2), and χ(3) are the first, second, and third orders of optical susceptibility. The linear (χ(1)) and non-linear cubic order (χ(3)) susceptibilities can be evaluated using the dispersion parameters (E0 and Ed) or the static refractive index (n0) as follows []:
where A = 1.79 × 10⁻¹⁰ esu. Considering that χ(3) is a dominant nonlinear parameter in the materials, it is generated by the excitation below the optical bandgap energy in the transparent frequency region. Also, the nonlinear refractive index (n2) is evaluated from optical band gap energy using the following equation []:
where G is a constant equal to 1.26 × 10⁻⁹ [esu (eV)4]. Values of χ(1), χ(3), and the n2 of PVA/Cs and the PVA/Cs/ZnO nanocomposites were determined and are given in Table 8. The values of χ(1), χ(3), and n2 show that the PVA/Cs/ZnO nanocomposites can be strongly nominated for use in optical power reduction, optical switching, photonics, fiber communication, and optical information processing [].
Table 8.
Linear and nonlinear optical parameters values of PVA/Cs/ZnO nanocomposites.
3.5.6. Dielectric Constant and Optical Conductivity
Figure 12a,b depicts the behavior of the real part () and imaginary part () of the complex dielectric constant () for the PVA/Cs and PVA/Cs/ZnO nanocomposites as a function of wavelength. It was found that both εr and εi behave with the same trend with the increase in the ZnO content as well as the wavelength. They increased with the increase in the content of ZnO and decreased with increasing wavelength. The higher values of εr and εi at lower wavelengths are attributed to the high contribution of charge carrier. Also, a wide dispersion region in the behavior of εr and εi below 600 nm was observed because of the polar nature of nanocomposite samples that follows the fluctuation of the incident field [,].
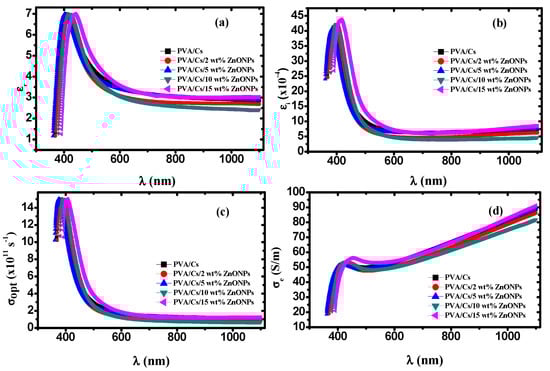
Figure 12.
(a) εr versus λ, (b) εi versus λ, (c) σopt versus λ, (d) σe versus λ.
The dispersion regions play an important role in designing optical communication systems. The molecules cannot follow the fluctuations of the incident field at higher wavelengths because of the inertia, and consequently εr remains constant [,], while at lower wavelengths the high values of εi (Figure 12b) are attributed to the dipolar polarization of the materials.
Optical and electrical conductivities (σopt & σe), which describe the behavior of the conductivity of materials because of charge carrier transport due to changing electric fields of incident electromagnetic waves, can be evaluated by the optical parameters using the following equations []:
Figure 12c,d depicts the dependence of σopt and σe of PVA/Cs and PVA/Cs/ZnO nanocomposites on the wavelength. Both σopt and σe behave in different ways. It was found that the value of σopt was in the order of 1012 s−1 in the UV region, which indicates that PVA/Cs/ZnO nanocomposite samples have a high photo response, meaning these nanocomposites are strong candidates for use in information processing. Higher values of σopt in the high absorption region at lower wavelengths (higher energies) and higher ZnO nanoparticle content are ascribed to the higher charge carrier density. Moreover, the reduction in the optical bandgap with the increase in the ZnO NP content in the nanocomposites will lead to an increase in the number of energy localized states as well as the charge carrier concentration, resulting in an increase in the values of σopt. On the other hand, it was found that σopt decreased with increasing wavelength. This behavior in this wavelength region can be attributed to the lack of availability of mobile charge carrier for transition between localized states because of interfacial polarization (IP) []. With increasing wavelength, the average displacement of charge carrier is decreased and thus the conductivity will decrease [,]. Furthermore, the electrical conductivity was enhanced with an increase in the content of ZnO NPs and found to range from 17 to ~92 S/m, revealing that the PVA/Cs/ZnO nanocomposite has a semiconducting nature.
3.6. Antibacterial Activity
Figure 13 and Figure 14 illustrate the bacterial activity of PVA/Cs/ZnO nanocomposites against Gram-positive (S. aureus) and Gram-negative (E. coli) bacteria. The Gram-positive (S. aureus) bacteria were more strongly affected by both the PVA/Cs blend or by the PVA/Cs/ZnO nanocomposite than the Gram-negative (E. coli) bacteria. Due to the existence of teichoic acid in the Gram-positive bacteria as well as phospholipids in the Gram-negative bacteria, the bacterial cell contains a negatively charged membrane []. As the PVA/Cs blend is positively charged, it can interact electrostatically with the negatively charged lipidic bacterial membranes and consequently can alter its permeability, ultimately affecting cell growth and viability. Also, since the Gram-positive bacteria (S. aureus) have only one cytoplasmic membrane, they will be more susceptible to the effects of surface rupture than the Gram-negative (E. coli) bacteria, which have a double outer membrane (a plasma membrane with a peptidoglycan thin layer and an outer membrane) []. Also, it is noticeable that the antibacterial activity was improved with an increase in ZnO NP content in the nanocomposite samples. In general, ZnO NPs have a wide spectrum of antibacterial activity through several mechanisms that include reactive oxygen species production (i.e., hydroxyl radicals (OH−), hydrogen peroxide (H2O2), and peroxide (O2−)) and membrane disruption []. The toxicity of reactive oxygen species (ROS) against bacteria can be attributed to its high reactivity and oxidative properties. The toxicity of these products will involve the destruction of most cellular components such as proteins, DNA, and lipids, because of their internalization into the membrane of the bacteria cell. The mechanism of ZnO NPs’ interaction with bacterial cells is represented in Figure 15. Because of the negative charge, the hydroxyl radicals and peroxides cannot penetrate the bacterial membrane and thus remain on the bacteria’s outer surface []. In contrast, H2O2 molecules can pass through the cell wall of the bacteria, which subsequently leads to infections and destruction, and eventually leads to cell death []. When ZnO nanoparticles kill or interact with the cell membrane, it is likely that the particles remain strongly adsorbed on the surface of the killed/remaining bacteria, preventing additional antibacterial activity. Once the ZnO nanoparticles are in the growth medium, they will continue to release peroxides covering the entire surface of the dead bacteria. Hence, this continuous release of peroxide will increase the bactericidal efficacy.
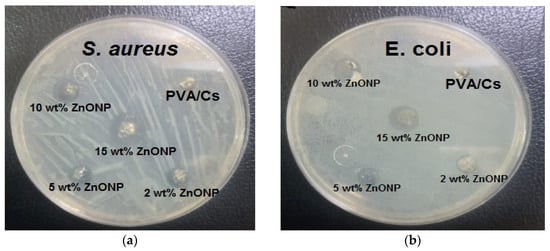
Figure 13.
The bacterial inhibition zones of PVA/Cs and PVA/Cs/ZnONPs with different ratios (2, 5, 10, and 15 wt%) against (a) S. aureus and (b) E. coli.
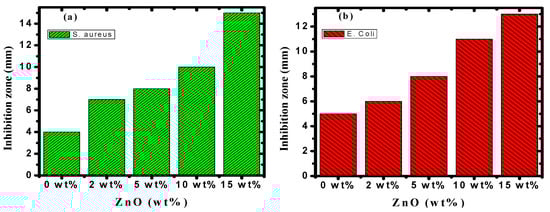
Figure 14.
The antibacterial activity of PVA/Cs/ZnO nanocomposites against (a) S. aureus and (b) E. coli bacteria.
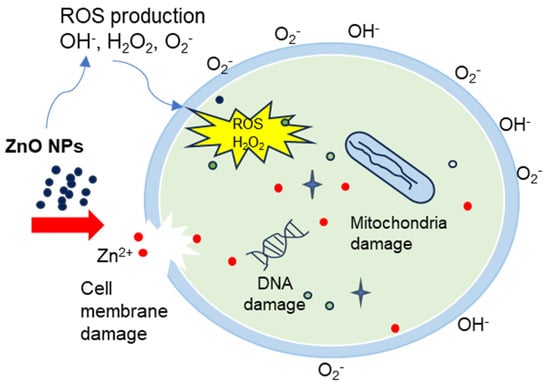
Figure 15.
The mechanism representation of ZnO NPs anti-bactericidal activity.
Also, the release of zinc ions (Zn2+) causes cell membrane damage and mitochondria to weaken, and restricts the cell growth by leaking DNA, proteins, and lipids, ultimately leading to cell destruction. Released Zn2+ has a significant effect on inhibiting active transport as well as in amino acid metabolism and perturbing the enzyme system []. Similar results of the antibacterial activity of polymeric nanocomposites against Gram-positive and Gram-negative bacteria were published previously [,].
4. Conclusions
XRD study showed that by increasing the content of ZnO nanoparticles, the intensity of the main characteristic peaks of the PVA/Cs blend was decreased and shifted to higher diffraction angles, indicating that an interaction between PVA/Cs and ZnO had taken place. ATR-FTIR investigation verified the modifications in the structure of PVA/Cs due to the doping with ZnO. These modifications were observed in the locations and intensities of transmission bands of PVA/Cs/ZnO nanocomposites in comparison with the pure PVA/Cs blend. Analysis of DSC data showed that the values of Tg and Tm were shifted to higher temperatures by increasing the content of ZnO NPs, and this shift was attributed to the strong interaction between the –OH groups of PVA/Cs and ZnO nanoparticles. TGA revealed that the thermal stability of PVA/Cs/ZnO nanocomposites was enhanced with increasing content of ZnO nanoparticles. The decrease in the optical bandgap from 4.43 eV for PVA/Cs to 3.55 eV for PVA/Cs/15 wt% ZnO nanocomposite was explained in terms of created localized states and defects, as verified by the Urbach energy investigation. Single oscillator and Sellmeier oscillator models were used to investigate the effect of ZnO NPs on the dispersion performance of the PVA/Cs blend. The dielectric constant (εL) was greatly improved from 7.98 for PVA/Cs to 10.44 for PVA/Cs/15 wt% ZnO nanocomposite, and the values of (N/m*) of PVA/Cs blend were enhanced. The nonlinear parameters of the PVA/Cs blend were also improved and the values of χ(3) and n2 were duplicated after doping with ZnO NPs. These novel results nominate PVA/Cs/ZnO nanocomposites for updated optoelectronic applications. Antibacterial activity of PVA/Cs/ZnO nanocomposites was greatly enhanced against both Gram-positive and Gram-negative bacterial pathogens with an increase in the content of ZnO NPs. Hence, PVA/Cs/ZnO nanocomposites could inhibit bacterial pathogens.
Author Contributions
Conceptualization: E.M.A. and T.F.; formal analysis: E.M.A., W.B.E., M.A.A., Z.M.E., H.E. and T.F.; investigation: M.A.A. and H.E.; writing—original draft: E.M.A., W.B.E., M.A.A., Z.M.E., H.E. and T.F.; writing—review and editing: S.A., M.A., E.M.A. and T.F.; funding acquisition: Z.M.E. All authors have read and agreed to the published version of the manuscript.
Funding
This research was funded by the Princess Nourah bint Abdulrahman University (Grant No. PNURSP2023R124), Riyadh, Saudi Arabia.
Institutional Review Board Statement
No applicable.
Data Availability Statement
Full experimental data and results are available upon request.
Acknowledgments
Z. M. Elqahtani expresses her gratitude to the Princess Nourah bint Abdulrahman University Researchers Supporting Project number (Grant No. PNURSP2023R124), Princess Nourah bint Abdulrahman University, Riyadh, Saudi Arabia. This study was supported via funding from Prince sattam bin Abdulaziz University project number (PSAU/2023/R/1445).
Conflicts of Interest
The authors declare no conflict of interest.
References
- Kumar, S.; Prasad, K.; Gil, J.M.; Sobral, A.J.F.N.; Koh, J. Mesoporous zeolitechitosan composite for enhanced capture and catalytic activity in chemical fixation of CO2. Carbohydr. Polym. 2018, 198, 401–406. [Google Scholar] [CrossRef] [PubMed]
- Fahmy, T.; Sarhan, A. Investigation of optical properties and antibacterial activity of chitosan copper nanoparticle composites. Mater. Technol. Adv. Perform. Mater. 2022, 37, 2400–2413. [Google Scholar] [CrossRef]
- Sarhan, A.; Fahmy, T. Optical Properties, Antibacterial Activity, and Relaxation Behavior Investigation of Chitosan/Green Synthesized Silver Nanoparticles by Thermally Stimulated Depolarization Current Technique. Polym. Sci. Ser. B 2021, 63, 578–590. [Google Scholar] [CrossRef]
- Shameli, K.; Ahmad, M.; Yunus, W.W.; Rustaiyan, A.; Ibrahim, N.A.; Zargar, M.; Abdollahi, Y. Green synthesis of silver/montmorillonite/chitosan bionanocomposites using the UV irradiation method and evaluation of antibacterial activity. Int. J. Nanomed. 2010, 5, 875–887. [Google Scholar] [CrossRef] [PubMed]
- Muthupandeeswari, A.; Kalyani, P.; Nehru, L.C. On the efects of high loading of ZnO nanofller on the structural, optical, impedance and dielectric features of PVA@ZnO nanocomposite flms. Polym. Bull. 2021, 78, 7071–7088. [Google Scholar] [CrossRef]
- Fahmy, T.; Sarhan, A. Characterization, and molecular dynamic studies of chitosan–iron complexes. Bull. Mater. Sci. 2021, 44, 142. [Google Scholar] [CrossRef]
- Javed, R.; Rais, F.; Fatima, H.; Haq, I.; Kaleem, M.; Naz, S.S.; Ao, Q. Chitosan encapsulated ZnO nanocomposites: Fabrication, characterization, and functionalization of bio-dental approaches. Mater. Sci. Eng. C 2020, 116, 111184. [Google Scholar] [CrossRef]
- Bharathi, D.; Ranjithkumar, R.; Chandarshekar, B.; Bhuvaneshwari, V. Preparation of chitosan coated zinc oxide nanocomposite for enhanced antibacterial and photocatalytic activity: As a bionanocomposite. Int. J. Biol. Macromole 2019, 129, 989–996. [Google Scholar] [CrossRef]
- Motelica, L.; Ficai, D.; Ficai, A.; Truscă, R.D.; Ilie, C.I.; Oprea, O.C.; Andronescu, E. Innovative Antimicrobial Chitosan/ZnO/Ag NPs/Citronella Essential Oil Nanocomposite-Potential Coating for Grapes. Foods 2020, 9, 1801. [Google Scholar] [CrossRef]
- Gong, X.; Tang, C.Y.; Pan, L.; Hao, Z.; Tsui, C.P. Characterization of poly(vinyl alcohol) (PVA)/ZnO nanocomposites prepared by a one-pot method. Compos. Part B 2014, 60, 144–149. [Google Scholar] [CrossRef]
- Abraham, A.; Soloman, P.A.; Rejini, V.O. Preparation of Chitosan-Polyvinyl Alcohol Blends and Studies on Thermal and Mechanical Properties. Procedia Technol. 2016, 24, 741–748. [Google Scholar] [CrossRef]
- Elmahdy, M.M.; Ahmed, M.T.; Aldhafeeri, K.A.; Azzam, M.A.; Fahmy, T. Molecular dynamics and conduction mechanism of poly(vinyl chloride-co-vinyl acetate-co-2-hydroxypropyl acrylate) terpolymer containing ionic liquid. Polym. Adv. Technol. 2023, 34, 800–816. [Google Scholar] [CrossRef]
- Ummartyotin, S.; Pechyen, C. Physico-Chemical Properties of ZnO and Chitosan Composite for Packaging Material. J. Biobased Mater. Bioenergy 2017, 11, 183–192. [Google Scholar] [CrossRef]
- Ma, X.Y.; Zhang, W.D. Effects of flower-like ZnO nanowhiskers on the mechanical, thermal, and antibacterial properties of waterborne polyurethane. Polym. Deg. Stab. 2009, 94, 1103–1109. [Google Scholar] [CrossRef]
- Vodnik, V.V.; Božanic, D.K.; Džunuzovic, E.; Vukovic, J.; Nedeljkovic, J.M. Thermal and optical properties of silver–poly(methylmethacrylate) nanocomposites prepared by in-situ radical polymerization. Eur. Polym. J. 2010, 46, 137–144. [Google Scholar] [CrossRef]
- Jandas, P.J.; Mohanty, S.; Nayak, S.K. Morphology and thermal properties of renewable resource-based polymer blend nanocomposites influenced by a reactive compatibilizer. ACS Sustain. Chem. Eng. 2014, 2, 377–386. [Google Scholar] [CrossRef]
- Chen, Q.; Cabanas-Polo, S.; Goudouri, O.M.; Boccaccini, A.R. Electrophoretic co-deposition of polyvinyl alcohol (PVA) reinforced alginate–Bioglass composite coating on stainless steel: Mechanical properties and in vitro bioactivity assessment. Mater. Sci. Eng. C Mater. Biol. Appl. 2014, 40, 55–64. [Google Scholar] [CrossRef]
- Fahmy, T.; Elhendawi, H.; Elsharkawy, W.B.; Reicha, F.M. AC conductivity and dielectric relaxation of chitosan/poly(vinyl alcohol) biopolymer polyblend. Bull Mater. Sci. 2020, 43, 243. [Google Scholar] [CrossRef]
- Hassan, A.; Sarhan, A.; Abdelhamid, M.I.; Fahmy, T.; Habib, A. Enhancing of piezoelectric coefficient and optical Properties of flexible ZnO/Poly (Vinylidene Fluoride-Trifluoroethylene) Nanocomposites for Optoelectronic Applications. Egypt. J. Chem. 2023. [Google Scholar] [CrossRef]
- Karpuraranjith, M.; Thambidurai, S. Chitosan/zinc oxide-polyvinylpyrrolidone (CS/ ZnO-PVP) nanocomposite for better thermal and antibacterial activity. Int. J. Biol. Macromol. 2017, 104, 1753–1761. [Google Scholar] [CrossRef]
- Coneo, N.; Ramos, Y.; De Ávila, G.; Herrera, A.; Cremades, A. Active chitosan- poly (vinyl alcohol) film reinforced with zinc oxide nanoparticles for food packaging applications. Polym. Renew. Resour. 2023, 14, 173–194. [Google Scholar] [CrossRef]
- Ahmed, R.; Tariq, M.; Ali, I.; Asghar, R.; Khanam, P.N.; Augustine, R.; Hasan, A. Novel electrospun chitosan/polyvinyl alcohol/zinc oxide nanofibrous mats with antibacterial and antioxidant properties for diabetic wound healing. Int. J. Biol. Macromol. 2018, 120 Pt A, 385–393. [Google Scholar] [CrossRef]
- Azizi, S.; Ahmad, M.B.; Ibrahim, N.A.; Hussein, M.Z.; Namvar, F. Cellulose nanocrystals/ZnO as a bifunctional reinforcing nanocomposite for poly (vinyl alcohol)/chitosan blend films: Fabrication, characterization and properties. Int. J. Mol. Sci. 2014, 15, 11040–11053. [Google Scholar] [CrossRef] [PubMed]
- Vicentini, D.S.; Smania, A., Jr.; Laranjeira, M.C.M. Chitosan/poly (vinyl alcohol) films containing ZnO nanoparticles and plasticizers. Mater. Sci. Eng. C 2010, 30, 503–508. [Google Scholar] [CrossRef]
- Kesavan, K.; Rajendran, S.; Mathew, C.M. Studies on poly(vinyl pyrrolidone) based solid polymer blend electrolytes complexed with various lithium salts. Polym. Sci. B 2014, 56, 520–529. [Google Scholar] [CrossRef]
- Shafiq, M.; Yasin, T.; Rafiq, M.A. Structural, Thermal, and Antibacterial Properties of Chitosan/ZnO Composites. Polym. Compos. 2014, 35, 1–7. [Google Scholar] [CrossRef]
- Li, L.-H.; Deng, J.-C.; Deng, H.-R.; Liu, Z.-L.; Xin, L. Synthesis and characterization of chitosan/ZnO nanoparticle composite membranes. Carbohydr. Res. 2010, 345, 994–998. [Google Scholar] [CrossRef]
- Guo, M.; Diao, P.; Cai, S. Hydrothermal growth of wellaligned ZnO nanorod arrays: Dependence of morphology and alignment ordering upon preparing conditions. J. Solid State Chem. 2005, 178, 1864–1873. [Google Scholar] [CrossRef]
- Fahmy, T.; Sarhan, A.; Elsayed, I.A.; Ahmed, M.T. Effect of UV Irradiation on The Structure and Optical Properties of PVA/Cucl2. J. Adv. Phys. 2018, 14, 5378–5387. [Google Scholar]
- Nasikhudin, N.; Puspitasari, I.; Diantoro, M.; Kusumaatmaja, A.; Triyana, K. Effect of Blend Ratio on Morphology and Swelling Properties of PVA/Chitosan Nanofibers. Mater. Sci. Forum 2017, 901, 79–84. [Google Scholar] [CrossRef]
- Cui, Z.; Xiang, Y.; Si, J.; Yang, M.; Zhang, Q.; Zhang, T. Ionic interactions between sulfuric acid and chitosan membranes. Carbohydr. Polym. 2008, 73, 111–116. [Google Scholar] [CrossRef]
- Muinde, V.M.; Onyari, J.M.; Wamalwa, B.; Wabomba, J.N. Adsorption of malachite green dye from aqueous solutions using mesoporous chitosan–zinc oxide composite material. Environ. Chem. Ecotoxicol. 2020, 2, 115–125. [Google Scholar] [CrossRef]
- Ibupoto, Z.; Khun, K.; Eriksson, M.; AlSalhi, M.; Atif, M.; Ansari, A.; Willander, M. Hydrothermal growth of vertically aligned ZnO nanorods using a biocomposite seed layer of ZnO nanoparticles. Materials 2013, 6, 3584–3597. [Google Scholar] [CrossRef] [PubMed]
- Hema, M.; Selvasekerapandian, S.; Sakunthala, A.; Arunkumar, D.; Nithya, H. Structural, vibrational and electrical characterization of PVA–NH4Br polymer electrolyte system. Phys. B Cond. Matter. 2008, 403, 2740–2747. [Google Scholar] [CrossRef]
- Prabhu, Y.T.; Rao, K.V. X-ray analysis by Williamson-Hall and size-strain plot methods of ZnO nanoparticles with fuel variation. World J. Nano Sci. Eng. 2014, 4, 21–28. [Google Scholar] [CrossRef]
- Bhadra, P.; Mitra, M.K.; Das, G.C.; Dey, R.; Mukherjee, S. Interaction of chitosan capped ZnO nanorods with Escherichia coli. Mater. Sci. Eng. C 2011, 31, 929–937. [Google Scholar] [CrossRef]
- Sui, X.M.; Shao, C.L.; Liu, Y.C. White-light emission of polyvinyl alcoholZnO hybrid nanofibers prepared by electrospinning. Appl. Phys. Lett. 2005, 87, 113115. [Google Scholar] [CrossRef]
- Chandrakala, H.N.; Ramaraj, B.; Maraiah, S.; Lee, J.H.; Ramaiah, S. Polyvinyl alcohol/carbon coated zinc oxide nanocomposites: Electrical, optical, structural and morphological characteristics. J. Alloys Comp. 2013, 580, 392–400. [Google Scholar] [CrossRef]
- Chen, Y.; Zhou, S.; Yang, H.; Wu, L. Structure and properties of polyurethane/nanosilica composites. J. Appl. Polym. Sci. 2005, 95, 1032–1039. [Google Scholar] [CrossRef]
- Murariu, M.; Doumbia, A.; Bonnaud, L.; Dechief, A.N.; Paint, Y.F.M.; Campagne, C.; Devaux, E.; Dubois, P. High-Performance Polylactide/ZnO Nanocomposites Designed for Films and Fibers with Special End-Use Properties. Biomacromolecules 2011, 12, 1762–1771. [Google Scholar] [CrossRef]
- Prokhorov, E.; Bárcenas, G.L.; Limón, J.M.Y.; Sánchez, A.G.; Kovalenko, Y. Chitosan-ZnO Nanocomposites Assessed by Dielectric, Mechanical, and Piezoelectric Properties. Polymers 2020, 12, 1991. [Google Scholar] [CrossRef] [PubMed]
- Kumar, S.; Krishnakumar, B.; Sobral, A.J.F.N.; Koh, J. Bio-based (Chitosan/PVA/ZnO) nanocomposites film: Thermally stable and photoluminescence material for removal of organic dye. Carbohydr. Polym. 2019, 205, 559–564. [Google Scholar] [CrossRef] [PubMed]
- Gallego, R.; Gonzalez, M.; Arteaga, J.F.; Valencia, C.; Franco, J.M. Influence of Functionalization Degree on the Rheological Properties of Isocyanate-Functionalized Chitin- and Chitosan-Based Chemical Oleogels for Lubricant Applications. Polymers 2014, 6, 1929–1947. [Google Scholar] [CrossRef]
- Lopez, F.A.; Merce, A.L.R.; Alguacil, F.J.; Lopez-Delgado, A. A kinetic study on the thermal behaviour of chitosan. J. Therm. Anal. Cal. 2008, 91, 633–639. [Google Scholar] [CrossRef]
- Chandrakala, H.N.; Bommulu, R.; Shivakumaraiah; Madhu, G.M.; Siddaramaiah. The influence of zinc oxide–cerium oxide nanoparticles on the structural characteristics and electrical properties of polyvinyl alcohol films. J. Mater. Sci. 2012, 47, 8076–8084. [Google Scholar] [CrossRef]
- Hong, P.Z.; Li, S.D.; Ou, C.Y.; Li, C.P.; Yang, L.; Zhang, C.H. Thermogravimetric Analysis of Chitosan. J. Appl. Polym. Sci. 2007, 105, 547–551. [Google Scholar] [CrossRef]
- Georgieva, V.; Zvezdova, D.; Vlaev, L. Non-isothermal kinetics of thermal degradation of chitosan. Chem. Cent. J. 2012, 6, 81. [Google Scholar] [CrossRef]
- Vlaev, L.; Nedelchev, N.; Gyurova, K.; Zagorcheva, M. A comparative study of non-isothermal kinetics of decomposition of calcium oxalate monohydrate. J. Anal. Appl. Pyrolysis 2008, 81, 253–262. [Google Scholar] [CrossRef]
- Boonchom, B.; Puttawong, S. Thermodynamics and kinetics of the dehydration reaction of FePO42H2O. Phys. B 2010, 405, 2350–2355. [Google Scholar] [CrossRef]
- Coats, A.W.; Redfern, J.P. Kinetic parameters from thermogravimetric data. Nature 1964, 201, 68–69. [Google Scholar] [CrossRef]
- Stolarek, P.; Ledakowicz, S. Pyrolysis kinetics of chitin by non-isothermal thermogravimetry. Thermochim. Acta 2005, 433, 200–208. [Google Scholar] [CrossRef]
- Covas, C.P.; Monal, W.A.; Roman, J.S. A kinetic study of the thermal degradation of chitosan and a mercaptan derivative of chitosan. Polym. Deg. Stab. 1993, 39, 21–28. [Google Scholar] [CrossRef]
- Liu, L.; Guo, X.Q. Isokinetic Relationship, Isoequilibrium Relationship, and Enthalpy−Entropy Compensation. Chem. Rev. 2001, 101, 673–695. [Google Scholar] [CrossRef]
- Migahed, M.D.; Fahmy, T. Structural relaxation around the glass transition temperature in amorphous polymer blends: Temperature and composition dependence. Polymer 1994, 35, 1688–1693. [Google Scholar] [CrossRef]
- Fahmy, T.; Abdelmuttlib, E.O.; Abdelhamid, M.I.; Elsharkawy, W.B.; Elqahtani, Z.M.; Ahmed, M.T. TSDC of Irradiated and Non-Irradiated Cellulose Acetate. Egypt. J. Chem. 2021, 64, 2453–2468. [Google Scholar] [CrossRef]
- Elsharkawy, W.B.; Ahmed, M.T.; Abdelmuttlib, E.O.; Elqahtani, Z.M.; Azzam, M.A.; Fahmy, T. Effect of γ-irradiation on thermally stimulated depolarization current spectra of polyethylenegrafted-poly(Acrylic acid). Radiat. Eff. Defects Solids 2022, 177, 671–687. [Google Scholar] [CrossRef]
- Fahmy, T. Dielectric Relaxation and Electrical Conductivity Study inThiourea- Doped Poly (Vinyl Alcohol). Intern. J. Polym. Mater. 2001, 50, 109–127. [Google Scholar] [CrossRef]
- Ambrosio, R.; Carrillo, A.; Mota, M.L.; Torre, K.; Torrealba, R.; Moreno, M.; Vazquez, H.; Flores, J.; Vivaldo, I. Polymeric Nanocomposites Membranes with High Permittivity Based on PVA-ZnO Nanoparticles for Potential Applications in Flexible Electronics. Polymers 2018, 10, 1370. [Google Scholar] [CrossRef]
- Urbach, F. The Long-Wavelength Edge of Photographic Sensitivity and of the Electronic Absorption of Solids. Phys. Rev. 1953, 92, 1324. [Google Scholar] [CrossRef]
- Borah, D.J.; Mostako, A.T.T. Investigation on dispersion parameters of Molybdenum Oxide thin films via Wemple–DiDomenico (WDD) single oscillator model. Appl. Phys. A 2020, 126, 818–825. [Google Scholar] [CrossRef]
- Rahman, M.M.; Miran, H.A.; Jiang, Z.T.; Altarawneh, M.; Chuah, L.S.; Lee, H.L.; Amri, A.; Mondinos, N.; Dlugogorski, B.Z. Investigation of the post-annealing electromagnetic response of Cu–Co oxide coatings via optical measurement and computational modeling. RSC Adv. 2017, 7, 16826–16835. [Google Scholar] [CrossRef]
- Fink, D.; Chung, W.H.; Klett, R.; Schmoldt, A.; Cardoso, J.; Montiel, R.; Vazquez, M.H.; Wang, L.; Hosoi, F.; Omichi, H.; et al. Carbonaceous clusters in irradiated polymers as revealed by UV-Vis spectrometry. Radiat. Eff. Defects Solids 1995, 133, 193–208. [Google Scholar] [CrossRef]
- Ahmed, M.T.; Sarhan, A.; Elqahtani, Z.M.; Elsharkawy, W.B.; Azzam, M.A.; Fahmy, T. Linear and Non-linear optical parameters of Copper Chloride doped Poly (Vinyl Alcohol) for Optoelectronic Applications. Egypt. J. Chem. 2022, 65, 99–108. [Google Scholar] [CrossRef]
- Ravindra, N.M.; Auluck, S.; Srivastava, V.K. On the Penn gap in semiconductors. Phys. Status Solidi B 1979, 93, K155–K160. [Google Scholar] [CrossRef]
- Moss, T.S. Relations between the refractive index and energy gap of semiconductors. Phys. Status Solidi 1985, 131, 415–427. [Google Scholar] [CrossRef]
- Hervé, P.; Vandamme, L.K. General relation between refractive index and energy gap in semiconductors. Infrared Phys. 1994, 35, 609–615. [Google Scholar] [CrossRef]
- Reddy, R.R.; Ram, G.; Narasimhulu, K.; Reddy, L.S.S.; Kumar, K.R.; Balakrishnaiah, G.; Kumar, M.R. Interrelationship between structural, optical, electronic and elastic properties of materials. J. Alloys Compd. 2009, 473, 28–35. [Google Scholar] [CrossRef]
- Kumar, V.; Singh, J.K. Model for calculating the refractive index of different materials. Ind. J. Pure Appl. Phys. 2010, 48, 571–574. [Google Scholar]
- Tsai, M.; Hsu, S.H.; Ho, C.C.; Tsai, H.C.; Wang, C.A.; Su, W.F. High refractive index transparent nanocomposites prepared by in situ polymerization. J. Mater. Chem. C 2014, 2, 2251–2258. [Google Scholar] [CrossRef]
- Chahal, R.P.; Mahendia, S.; Tomar, A.K.; Kumar, S. γ-Irradiated PVA/Ag nanocomposite films: Materials for optical applications. J. Alloys Comp. 2012, 538, 212–219. [Google Scholar] [CrossRef]
- Wemple, S.H. Refractive-Index Behavior of Amorphous Semiconductors and Glasses. Phys. Rev B 1973, 7, 3767–3777. [Google Scholar] [CrossRef]
- Wemple, S.H.; Domenico, M.D., Jr. Behavior of the Electronic Dielectric Constant in Covalent and Ionic Materials. Phys. Rev B 1971, 3, 1338–1351. [Google Scholar] [CrossRef]
- Domenico, M.D., Jr.; Wemple, S.H. Oxygen-Octahedra Ferroelectrics. I. Theory of Electro-optical and Nonlinear optical Effects. J. Appl. Phys. 1969, 40, 720–734. [Google Scholar] [CrossRef]
- Elsharkawy, W.B.; Fahmy, T.; Azzam, M.A.; Habib, A.; Sarhan, A. Structural and Optical Properties of Poly (Vinyl Alcohol)/Copper Nanocomposites Prepared by an Eco-friendly Electrochemical Method. Biointerface Res. Appl. Chem. 2023, 13, 1–22. [Google Scholar]
- Soliman, T.S.; Vshivkov, S.A.; Elkalashy, S.I. Structural, linear and nonlinear optical properties of Ni nanoparticles– olyvinyl alcohol nanocomposite films for optoelectronic applications. Opt. Mater. 2020, 107, 110037. [Google Scholar] [CrossRef]
- Frumar, M.; Jedelský, J.; Frumarova, B.; Wagner, T.; Hrdlička, M. Optically and thermally induced changes of structure, linear and non-linear optical properties of chalcogenides thin films. J. Non-Cryst. Solids 2003, 326, 399–404. [Google Scholar] [CrossRef]
- Tichý, L.; Ticha, H.; Nagels, P.; Callaerts, R.; Mertens, R.; Vlček, M. Optical properties of amorphous As–Se and Ge–As–Se thin films. Mater. Lett. 1999, 39, 122–128. [Google Scholar] [CrossRef]
- Tichá, H.; Tichý, L. Semiempirical relation between non-linear susceptibility (refractive index), linear refractive index and optical gap and its application to amorphous chalcogenides. J. Optoelectron. Adv. Mater. 2002, 4, 381–386. [Google Scholar]
- Dhatarwal, P.; Sengwa, R.J. Investigation on the optical properties of (PVP/PVA)/Al2O3 nanocomposite films for green disposable optoelectronics. Phys. B Cond. Matter. 2021, 613, 412989. [Google Scholar] [CrossRef]
- Wang, Z.; Zhou, W.; Dong, L.; Sui, X.; Cai, H.; Zuo, J.; Chen, Q. Dielectric spectroscopy characterization of relaxation process in Ni/epoxy composites. J. Alloys Comp. 2016, 682, 738–745. [Google Scholar] [CrossRef]
- Fahmy, T.; Ahmed, M.T.; Sarhan, A.; Abdelwahed, H.G.; Alshaaer, M. AC Conductivity and Dielectric Spectroscopy of Poly (3-hydroxybutyrateco-3-hydroxyvalerate). Int. J. Appl. Eng. Res. 2016, 11, 9279–9288. [Google Scholar]
- Banerjee, M.; Jain, A.; Mukherjee, G.S. Spectroscopic evaluation of optical parameters of a transition metal salt filled polymer material. Def. Sci. J. 2018, 68, 225–231. [Google Scholar] [CrossRef]
- Fahmy, T.; Ahmed, M.T.; El-kotp, A.; Abdelwahed, H.G.; Alshaaer, M. Broadband Dielectric Spectroscopy and Electric Modulus Analysis of Poly (3-hydroxybutyrate-co-3-hydroxyvalerate) and Related Copolymers Films. Int. J. Phys. Appl. 2016, 8, 1–14. [Google Scholar]
- Fahmy, T.; Elzanaty, H. AC conductivity and broadband dielectric spectroscopy of a poly(vinyl chloride)/poly(ethyl methacrylate) polymer blend. Bull. Mater. Sci. 2019, 42, 220. [Google Scholar] [CrossRef]
- Yusof, N.A.A.; Zain, N.M.; Pauzi, N. Synthesis of ZnO nanoparticles with chitosan as stabilizing agent and their antibacterial properties against Gram-positive and Gram-negative bacteria. Int. J. Biol. Macromol. 2019, 14, 1132–1136. [Google Scholar] [CrossRef]
- Perelshtein, I.; Ruderman, E.; Perkas, N.; Tzanov, T.; Beddow, J.; Joyce, E.; Mason, T.J.; Blanes, M.; Molla, K.; Patlolla, A.; et al. Chitosan and chitosan–ZnO-based complex nanoparticles: Formation, characterization, and antibacterial activity. J. Mater. Chem. B 2013, 1, 1968–1976. [Google Scholar] [CrossRef] [PubMed]
- Xie, Y.; He, Y.; Irwin, P.L.; Jin, T.; Shi, X. Antibacterial activity and mechanism of action of zinc oxide nanoparticles against Campylobacter jejuni. Appl. Environ. Microbiol. 2011, 77, 2325–2331. [Google Scholar] [CrossRef]
- Zhang, L.; Jiang, Y.; Ding, Y.; Povey, M.; York, D. Investigation into the antibacterial behaviour of suspensions of ZnO nanoparticles (ZnO nanofluids). J. Nanopart. Res. 2007, 9, 479–489. [Google Scholar] [CrossRef]
- Sirelkhatim, A.; Mahmud, S.; Seeni, A.; Kaus, N.H.M.; Ann, L.C.; Bakhori, S.K.M.; Hasan, H.; Mohamad, D. Review on Zinc Oxide Nanoparticles: Antibacterial Activity and Toxicity Mechanism. Nano-Micro Lett. 2015, 7, 219–242. [Google Scholar] [CrossRef]
Disclaimer/Publisher’s Note: The statements, opinions and data contained in all publications are solely those of the individual author(s) and contributor(s) and not of MDPI and/or the editor(s). MDPI and/or the editor(s) disclaim responsibility for any injury to people or property resulting from any ideas, methods, instructions or products referred to in the content. |
© 2023 by the authors. Licensee MDPI, Basel, Switzerland. This article is an open access article distributed under the terms and conditions of the Creative Commons Attribution (CC BY) license (https://creativecommons.org/licenses/by/4.0/).