Abstract
The composite rubber reinforced with hollow glass microsphere (HGM) was a promising composite material for noise reduction, and its sound insulation mechanism was studied based on an acoustic finite element simulation to gain the appropriate parameter with certain constraint conditions. The built simulation model included the air domain, polymer domain and inorganic particles domain. The sound insulation mechanism of the composite material was investigated through distributions of the sound pressure and sound pressure level. The influences of the parameters on the sound transmission loss (STL) were researched one by one, such as the densities of the composite rubber and HGM, the acoustic velocities in the polymer and inorganic particle, the frequency of the incident wave, the thickness of the sound insulator, and the diameter, volume ratio and hollow ratio of the HGM. The weighted STL with the 1/3 octave band was treated as the evaluation criterion to compare the sound insulation property with the various parameters. For the limited thicknesses of 1 mm, 2 mm, 3 mm and 4 mm, the corresponding optimal weighted STL of the composite material reached 14.02 dB, 19.88 dB, 22.838 dB and 25.27 dB with the selected parameters, which exhibited an excellent sound insulation performance and could promote the practical applications of the proposed composite rubber reinforced with HGM.
1. Introduction
The characteristics of viscoelasticity and inner damping for rubber make it a promising material for noise reduction [1], which can obtain excellent sound insulation and vibration attenuation, simultaneously [2]. Meanwhile, it has the advantages of possessing a light weight, fine machinability, outstanding physical and mechanical performances, a small occurred space, can facilitate construction, and so on [3,4]. Thus, rubber products have been widely utilized for sound insulation in the fields of communications and in the transportation industry (such as high speed rail, massive ships, passenger planes and vehicles), the construction industry, electrical equipment, industrial buildings, hospitals, educational institutions, guesthouses, and so on [5,6,7,8]. This makes it a focus of research in the domain of polymeric material and has attracted enthusiastic research interests all over the world. For example, the crumb rubber asphalt mixtures had been utilized to gain newly laid low-noise pavements [9,10,11,12], which could reduce the generated noise in urban traffic.
In order to further improve the sound insulation property of the rubber products, some functional reinforced fillers are added to develop the composite rubber by the mechanical or solution blending methods [13,14], and the normal utilized fillers include the metallic hollow sphere [15], ultrafine metal powder [16], kenaf and calcium carbonate [17], micro CaCO3 and hollow glass microspheres (HGM) [18], Eichhornia crassipes fiber (ECF) and maleates of Eichhornia crassipes fiber (MoECF) [19], recycled fir sawdust [20], etc. The polyurethane/316L stainless steel hollow spheres and silicone rubber/316L stainless steel hollow sphere composites had been prepared by Yu et al. [15] using the casting method, which proved that the different proportions of free volume in the polyurethane and silicone rubber matrix was a major reason for the significant differences in their sound absorption properties. Hu et al. [16] proved that the microcellular foaming material exhibited the best performance of sound insulation with the superfine metal powder content in matrix 30 wt%. The rubber composites as sound insulators were prepared by Suhawati et al. [17] through the incorporation of two types of fillers, namely kenaf and calcium carbonate, in blends of 50 mole% epoxidized natural rubber and methyl methacrylate–grafted natural rubber latex. It had been proved by Fang et al. [18] that, compared to the pure polymer sample, both the CaCO3 and HGM–filled thermoplastic elastomer composites exhibited greatly enhanced the soundproofing efficiency, which increased the sound transmission loss (STL) value from the original 29 dB to 45 dB. El–Wakil et al. [19] proved that the styrene–butadiene rubber composite with 10 phr of MoECF had sound absorption amplitude equal to 0.9 at the frequency of 400 Hz, and the sound absorption performance improved in low–frequency regions below 500 Hz by increasing the thickness to 2.3 mm. The mixing rigid polyurethane foam (RPUF)/flexible polyurethane foam (FPUF) with 0, 35, 40, 45, and 50 wt% fir sawdust was prepared by Tiuc et al. [20], and the obtained composite materials containing 50% sawdust had superior acoustic properties compared to those with 100% FPUF in the frequency range of 420–1250 Hz. Meanwhile, graphene nanoplatelet [21], organoclay montmorillonite [21], glass fiber [22], magnetite and barite minerals [23] have also been utilized as functional reinforced fillers, all of which aim to further improve the sound insulation performance of the rubber products.
Among these functional reinforced fillers [15,16,17,18,19,20,21,22,23], the HGM is a novel hollow spherical particle, which has the advantages of light weight, low density, excellent heat insulation performance, high pressure resistance, outstanding fire–resistant insulation property, and the fine sound insulation capacity, which is considered as a potential functional material for the fields of construction, transportation, machinery, aerospace, military, etc. [24,25,26,27,28,29,30]. Du and He [24] reviewed the progress made in synthesis and applications of the spherical silica micro/nanomaterials with multilevel (hierarchical) structures, which might enable them to be used in the broad and promising applications as ideal scaffolds (carriers) for biological, medical, and catalytic applications. An overview of the fabrication techniques of bulk and hollow microspheres was provided by Righini [25], as well as of the excellent results made possible by the peculiar properties of microspheres. To take advantage of both the low density and thermal conductivity of HGM, and the high mechanical and electrical conductivity of the carbon–based nanofiller, micro– and nanosized filler were combined into a single composite material by Herrera–Ramirez et al. [26]. An and Zhang [27] fabricated the core/shell structured glass/Ni–P/Co–Fe–P composite hollow microspheres by a three–step route, which showed their promising applications in the fields of low–density magnetic materials, conduction, and catalysis, etc. Cho et al. [28] had modelled the elastoplastic deformation behaviors of HGM/iron syntactic foam under tension by using a representative volume element (RVE) approach, which exhibited the potential for applications in the design of composites with a high modulus matrix and high strength reinforcement. Composite foamy structures were prepared by An and Zhang [29] through the HGM-assisted bubbling of silicone rubber with ammonium hydrogen carbonate as a blowing agent, and the proposed composite foamy structures improved the heat insulation and sound absorbing properties.
In order to improve the research efficiency and reduce the experiment cost, the acoustic finite element simulation has been widely utilized in the field of sound insulation and noise reduction [30,31,32,33,34,35,36,37,38,39]. Okuzono et al. [30] applied the finite element method using hexahedral 27-node spline acoustic elements with low numerical dispersion for the room acoustics simulation in both the frequency and time domains. The combination of the finite element simulation and cuckoo search algorithm was utilized by Yang et al. [31] to optimize the sound absorption property of the acoustic metamaterial of multiple parallel hexagonal Helmholtz resonators with sub-wavelength dimensions, in which the simulation results and experimental results exhibited an excellent consistency. Sathyan et al. [32] proposed a numerical method combining both the finite element method and boundary element method for the acoustic noise of electromagnetic origin generated by an induction motor. In order to improve the research efficiency, Wang et al. [33] used a two–dimensional equivalent simulation model to obtain the initial value of the parameters and a three–dimensional finite element model to simulate the sound absorption performance of a metamaterial cell. The finite element analysis procedure was selected by Abdullahi and Oyadiji [34] to simulate wave propagation in air-filled pipes, which was essential in the study of wave propagation in pipe networks such as oil and gas pipelines and urban water distribution networks. Yang et al. [35] used the finite element method to exhibit the sound absorption mechanism of adjustable parallel Helmholtz acoustic metamaterial through the distribution of sound pressures for the peak absorption frequency points. Van Genechten et al. [36] developed a hybrid simulation technique for coupled structural-acoustic analysis, which included a wave-based model for acoustic cavity and a direct- or modally-reduced finite element model for the structural part. The influence of tunable aperture with a variable length was investigated by Yang et al. [37] through an acoustic finite element simulation with a two-dimensional rotational symmetric model, which were consistent with the experimental results. Lin et al. [38] used the finite element simulation method and the experiment testing to validate the sound insulation performances of a novel sandwich structure compounded with a resonant acoustic metamaterial. Acoustic finite element numerical simulation analysis of the sound insulation hood model was carried out using the acoustic software LMS Virtual Lab Acoustics by Wu et al. [39], and the simulation result was verified by the experimental validation. It has been proved by these literatures [30,31,32,33,34,35,36,37,38,39] that the acoustic finite element simulation is an effective and helpful method to analyze the sound characteristics of materials or structures through selecting the suitable mesh type and appropriate element parameters, which is propitious for improving research efficiency and reducing the experimental steps and costs.
Therefore, the sound insulation performance of the composite rubber reinforced with HGM was investigated by acoustic finite element simulation in this research, which aimed to promote its practical application in the field of noise reduction. Meanwhile, the weighted STL with the 1/3 octave band was treated as the evaluation criterion for comparing the sound insulation performance with various influencing parameters [40,41,42]. The finite element simulation model was first built based on the basic theory of pressure acoustics [43,44], which could research the sound insulation mechanism of the composite material through analyzing the distribution of the sound pressure level (SPL). Afterward, the influences of the parameters on the STL of the composite materials were investigated one by one, such as the density of the composite rubber and that of the HGM, the acoustic velocity in the polymer and that in the inorganic particle, the frequency of the incident wave, the thickness of the sound insulator, and the diameter, volume ratio and hollow ratio of the HGM. Later, based on the achieved effect behaviors of the influencing parameters, the weighted STL of the composite material for the limited thickness of the sound insulator was optimized through parameter optimization with the neural network algorithm [45,46,47,48], which aimed to obtain the optimal sound insulation effect with certain constraint conditions. The proposed sound insulation material of composite rubber reinforced with HGM could be considered as a highly efficient sound insulator with little occupied space, which could be favorable for promoting its practical application in the industrial field. In general, the object of this study is to improve the sound insulation performance of the composite rubber reinforced with HGM, and the major method is investigating the influencing principle of each parameter on the SPL based on the acoustic finite element simulation model. The major achievements gained in this research, on the influencing principle of each parameter and the exhibition of the sound insulation mechanism, would provide effective guidance and meaningful reference for the development of a novel sound insulator.
2. Acoustic Finite Element Simulation Model
The acoustic finite element simulation model was built based on the basic theory of pressure acoustics [43,44], and it supplied the foundation to investigate the sound insulation mechanism of the composite material by analyzing the distributions of the SPL.
2.1. Model Construction
The constructed acoustic finite element simulation model for the composite rubber reinforced with HGM based on the basic theory of pressure acoustics is shown in Figure 1. It consisted of an air domain, polymer domain and inorganic particles domain, as shown in Figure 1a. The incident wave with a pressure amplitude of 1 Pa was set in the acoustic wave inlet. The composite sound insulation material consisted of the basic material of rubber and the filler of HGMs, as shown in Figure 1b. The details of these filled HGMs are shown Figure 1c, and the blue part in each HGM was the air. After setting the geometric parameters (such as thickness of the sound insulator, diameter, volume ratio and hollow ratio of the HGM, etc.) and physical parameters (such as density of the composite rubber and that of the HGM, acoustic velocity in the polymer and that in the inorganic particle, etc.), the geometric model was further gridded, as shown in the Figure 1d. The mesh type for the finite element simulation model was the free tetrahedron mesh, which could give considerations to both the simulation accuracy and computational efficiency, and the size of the elements in it was determined by the tiniest unit within the whole finite element structure, which was the hollow air domain inside the HGM in in this study. Thus, the selected smallest unit size and largest unit size for the composite sound insulation material, as shown in Figure 1a, were determined by the diameter, Dm, and the hollow ratio, μh, of the HGM; the former was set as μh × Dm/10 and the latter was set as μh × Dm/100. The mesh for the air domains in the Figure 1a was obtained by sweeping with the 80 fixed units, as shown in the Figure 1e. Meanwhile, the gridded models of the sound insulator, HGMs and single HGM are shown in Figure 1f, Figure 1g and Figure 1h, respectively. With the exception of the acoustic wave inlet and the acoustic wave outlet, the other boundaries were set as the hard boundary condition. The acoustic wave with vibration mode Pn = 1 and mode wavenumber kn = 2 × π/(C0/acpr.freq) was set in the acoustic wave inlet, and its value was defined as 1 Pa and its phase was 0 rad. The STL was selected to evaluate the sound insulation performance with 1/3 octave band (the investigated frequencies were 100 Hz, 125 Hz, 160 Hz, 200 Hz, 250 Hz, 315 Hz, 400 Hz, 500 Hz, 630 Hz, 800 Hz, 1000 Hz, 1250 Hz, 1600 Hz, 2000 Hz, 2500 Hz and 3150 Hz) in this research, which was conversed by calculating the transmission loss at the acoustic wave outlet relative to the standard input at the acoustic wave inlet.
Figure 1.
The constructed finite element simulation model. (a) General structure of whole model; (b) the sound insulator; (c) the HGMs; (d) the gridded model of whole finite element structure; (e) the gridded model of air domain; (f) the gridded model of sound insulator; (g) the gridded model of the HGMs; (h) the gridded model of single HGM.
With the exception that the density of air and the acoustic velocity in the air were kept at the constant of 1.21 Kg/m3 and 343 m/s, respectively, the other parameters were selected in a reasonable range, which are summarized in Table 1. The reference values for each parameter were chosen as the median, which was treated as the selected parameters for the investigation of the sound insulation mechanism and the analysis of the influencing parameters.

Table 1.
Summary of value ranges of the parameters in acoustic finite element simulation model.
2.2. Sound Insulation Mechanism
The sound insulation mechanism of the composite rubber reinforced with the HGM was investigated through distributions of the sound pressure (SP) and those of the SPL, as shown in the Figure 2, which corresponded to the frequency of 1000 Hz for the composite rubber reinforced with HGM, selecting the parameters by the reference values in the Table 1.
Figure 2.
Sound insulation mechanism of the composite rubber reinforced with HGM. (a) Distribution of the SP; (b) the isosurfaces of the SP; (c) the sectional surfaces of the SP; (d) distribution of the SPL; (e) the isosurfaces of the SPL; (f) the sectional surfaces of the SPL.
It could be found that both the SP and SPL decreased along the thickness direction. The SP decreased from 1.8 to 0, judging from Figure 2a, and the SPL decreased from 95 dB to 70 dB, judging from Figure 2d. Meanwhile, it could be observed that the isosurfaces of the SP, shown in Figure 2b, were equally spaced from 1.85 to 0.09 with an approximate interval of 0.2, and the isosurfaces of the SP, in Figure 2b, were unequally spaced from 95.5 to 68.98 with the approximate interval of 2.95; this was consistent with the normal relationship between SP and SPL, as shown in Equation (1). Here, SPref is the reference sound pressure, which is 2 × 10⁻⁵ Pa for the propagation medium of air. Moreover, it could be found from the sectional surfaces of the SP, in Figure 2c, and those of the SPL, in Figure 2f, that the existence of the HGMs would significantly alter the sound wave propagation in the composite rubber. Then, the sound insulation mechanism was discussed based on the acoustic wave transmission process in the composite rubber reinforced with the HGM.
The schematic diagram of the acoustic wave transmission process in the composite rubber reinforced with the HGM is shown in the Figure 3. Among the composite rubbers, HGM and air (including the ambient air and the inside air in the HGM), there were six interfaces, as shown in the Figure 3. At each interface, there would be a reflection and transmission of the incident sound wave, which are exhibited by the blue arrows in Figure 3. When the incident sound energy EIncident reached the interface between the ambient air and composite rubber, part of the sound energy was reflected back as EReflection, and the other penetrated into the composite rubber. Similarly, there would be multiple reflections and refractions at the various interfaces, and the final transmission sound energy ETransmission penetrated outside of the composite rubber. The STL could be calculated by Equation (2) for the condition of normal incidence. Here, Pi and Pt are the sound intensity of the incident wave and that of the transmission wave, respectively.
Figure 3.
Schematic diagram of acoustic wave transmission process in the composite rubber reinforced with the HGM.
There were two major reasons to generate the sound insulation effect in the composite rubber reinforced with the HGM [49,50,51]. Firstly, there existed many interfaces with unmatched acoustic impedance among the air, composite rubber and HGM, as shown in Figure 3. These interfaces not only increased the reflection and diffraction of the sound wave, but could also extend the transmission path of the sound wave to consume more sound energy, which resulted in a decrease in the transmitted acoustic energy and an improvement in the sound insulation effect. Secondly, the hollow structures in the HGM could reflect the sound wave entering the cavity for many times to consume part of the sound energy, and the expansion and compression of the air in the cavity could translate the sound energy to kinetic energy and thermal energy of the air, which could further consume the sound energy to reduce the transmitted acoustic energy. It could be found that the sound insulation process in the composite rubber reinforced with the HGM was really complex, which indicated that the construction of the theoretical model based on the sound insulation mechanism was difficult to realize and the accuracy of the constructed model was limited. Thus, the acoustic finite element simulation method was selected to investigate the effects of the influencing parameters in this study, which could better simulate the actual acoustic wave transmission process in the proposed sound insulator of composite rubber reinforced with HGM.
3. Influencing Parameters
The influencing parameters that affected the sound insulation effect of the composite rubber reinforced with the HGM could be divided into two groups. The first group was made up of the structural parameters, such as the diameter, volume ratio, and hollow ratio of the HGM and the thickness of the sound insulator. The second group was the physical parameters, such as the density of the composite rubber and HGM, and the acoustic velocity in the composite rubber and HGM. These eight influencing parameters were investigated one by one in this study. In the simulation process, the calculation quantity of the HGM was the major factor in determining the simulation accuracy. An increase in the calculation quantity could make the simulation process closer to the actual situation, which would lead to a higher simulation accuracy, but the simulation calculation amount would significantly increase, and the simulation time would remarkably extend. Thus, the establishment of the suitable calculation quantity of HGM should be confirmed first. The acoustic finite element simulation models of the composite rubber reinforced with HGM for the various calculation quantities of the HGM are shown in Figure 4, and the selected calculation quantities of the HGM were 5, 10, 20, 30, 40 and 50, respectively. The other parameters were the same as the reference values of the parameters in Table 1. The HGMs were randomly distributed in the rubber, which was realized by the random generation of the HGMs in the acoustic finite element simulation model. Supposing the diameter of the computational model was Dc, and calculation quantity of the HGM was N, the volume of the HGM Vh and that of the whole sound insulator Vs could be calculated by Equations (3) and (4), respectively, according to the parameters listed in Table 1. Thus, according to the definition of the volume ratio of the HGM μv, the value of Dc was confirmed by the Equation (5). That is why the Dc had become larger along with the increase in the calculation quantity of the HGM, as shown in Figure 4.
Figure 4.
Acoustic finite element simulation models of the composite rubber reinforced with HGM for the various calculation quantity of the HGM. (a) 5; (b) 10; (c) 20; (d) 30; (e) 40; (f) 50.
The mesh partition is another pivotal factor influencing the simulation accuracy and efficiency. In order to give consideration to both the simulation efficiency and accuracy, the free tetrahedron mesh grid was utilized, and the minimum cell size was set as Dh/20/μh, and the maximum cell size was set as Dh/2/μh for the HGM domain; the minimum cell size was set as Dh/20 and the maximum cell size was set as Dh for the composite rubber domain; the other domains were generated by sweeping with the distribution number of 80. These parameters for the mesh partition were applied to all of the finite element simulation models in this study.
Based on the constructed acoustic finite element simulation model and the selected parameters, the STL data with the various calculation quantities of the HGM were gained, as shown in Table 2, and the change of the weighted STL along with the increase in the calculation quantity N is shown in Figure 5. It could be calculated that the undulation of the weighted STL was limited in 0.005 dB when the calculation quantity was larger than 20, which indicated that the calculation quantity 20 was enough to achieve accurate simulation results. Therefore, the calculation quantity N was selected as 20 for the following research in this study.
Table 2.
The summarized STL data with the various calculation quantity of the HGM.
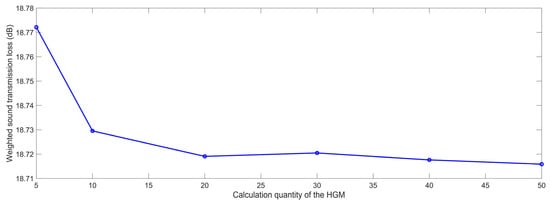
Figure 5.
The weighted STL of composite rubber reinforced with HGM for the various calculation quantity of the HGM.
It was interesting to note that the weighted STL rose a little, from 18.7191 dB to 18.7205 dB, when the calculation quantity N increased from 20 to 30. The major reason for this phenomenon was that the generation of HGM in the composite rubber was completely random, and the uniformity of the distribution of the HGMs would affect the simulation accuracy. Normally, the uniformity would improve along with the increase in the calculation quantity N. However, for this particular simulation process, it could be judged that the uniformity of the distribution of the HGMs, when N = 20, as in Figure 4c, was better than that when N = 30, as in Figure 4d. Therefore, the uniformity of the distribution of the HGMs was taken into account in the following simulation process, and it would improve when the distribution of the HGMs in the composite rubber was as uniform as possible.
3.1. Structural Parameters
3.1.1. Diameter of the HGM
The acoustic finite element simulation models of the composite rubber reinforced with HGM for the various diameters of the HGM are shown in Figure 6, which select eleven samples in the value range of Dm, and the other parameters select the reference values. It can be observed from Figure 6 that the diameter of the computational model Dc grew larger along with the increase in the Dm, which was consistent with the calculation results for Equation (5). Based on the constructed acoustic finite element simulation models and the selected parameters, the STL data with the various diameters of the HGM were gained, as shown in Table 3. It could be found that the STL data at each investigated frequency point in the range of 100–3150 Hz decreased normally along with the increase in the diameter of the HGM, and this difference was more obvious for the high frequency region.
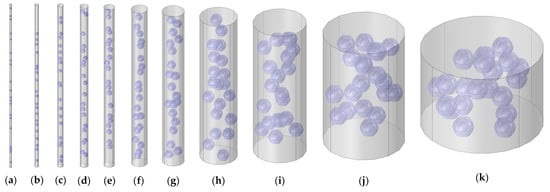
Figure 6.
Acoustic finite element simulation models of the composite rubber reinforced with HGM for the various diameter of the HGM. (a) 20; (b) 30; (c) 40; (d) 50; (e) 60; (f) 80; (g) 100; (h) 150; (i) 200; (j) 300; (k) 500.
Table 3.
The summarized STL data with the various diameter of the HGM.
The variation of the weighted STL along with the increase in the diameter of the HGM Dm is shown in the Figure 7. It could be found that the relationship between the weighted STL and the diameter of the HGM was negative, particularly when the value of the Dm was smaller than 60. The possible reason for this phenomenon was that the STL was proportional to the modulus of the elasticity of the material E, and the value of E decreased along with the increase in diameter of the HGM Dm. Meanwhile, the HGM with a smaller diameter had the higher density, larger thickness of the wall and the higher rigidity, as shown in the acoustic wave transmission process in the composite rubber reinforced with the HGM in Figure 3, which generated more acoustic reflecting and diffractive interfaces to consume more acoustic energy. Moreover, the absolute value of the variation of the weighted STL was smaller than 0.1 dB with the increase in the Dm from 20 μm to 500 μm, and all of the weighted STL was maintained in range of 18.71–18.81 dB, which indicated that the relative change of the weighted STL was limited in 0.5%. The major reason for this phenomenon was that the volume of rubber was reduced along with the increase in the diameter of the HGM Dm, because the volume ratio of the HGM was kept constant, which resulted in a smaller decrease in the equivalent modulus of the elasticity of the whole sound insulator and the STL was proportional to the modulus of the elasticity of the material E. However, the HGM with a larger diameter could result in more acoustic reflecting and diffractive interfaces, as shown in Figure 3, which would lead to an increase in the sound insulation effect. Thus, the final sound insulation performance was determined by the comprehensive effect. That is why the weighted STL decreased normally and there was a small increase in the weighted STL when the diameter of the HGM was 100 μm and 200 μm, respectively. Therefore, it could be concluded that the diameter of the HGM Dm had little impact on the sound insulation effect of the composite rubber reinforced with HGM, and its selection could pay more attention to the other factors, such as manufacturing cost, dispersion, uniformity, etc.
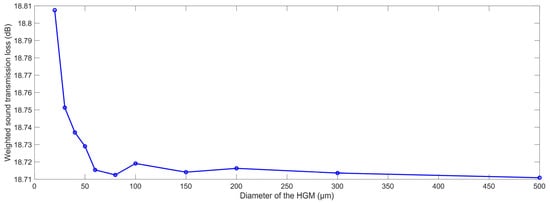
Figure 7.
The weighted STL of composite rubber reinforced with HGM for the various diameter of the HGM.
3.1.2. Volume Ratio of the HGM
Similarly, the finite element simulation models of the composite rubber reinforced with HGM for various volume ratios of the HGM μv were built, as shown in Figure 8. When the μv is larger than 17.5%, the theoretical computational diameter Dc will be smaller than the diameter of the HGM Dm, which indicated that the model cannot be constructed. Thus, the picked values for the μv were in the range of 2.5% to 17.0% in this research.
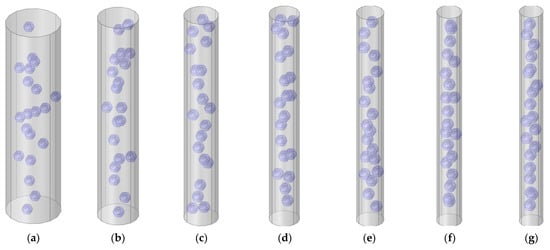
Figure 8.
Acoustic finite element simulation models of composite rubber reinforced with HGM for various volume ratio of HGM. (a) 2.5%; (b) 5.0%; (c) 7.5%; (d) 10.0%; (e) 12.5%; (f) 15.0%; (g) 17.0%.
Based on the constructed acoustic finite element simulation models and the selected parameters, the STL data with various volume ratios of the HGM were achieved, as shown in Table 4, and the variation of the weighted STL along with the increase in the volume ratio of the HGM μv is shown in Figure 9. It could be found that the relationship between the weighted STL and the volume ratio of the HGM μv was positive, which was almost linear. The major reason for this phenomenon was that more acoustic reflecting and diffractive interfaces were generated with the increase in the volume ratio of the HGM μv, as shown in the acoustic wave transmission process in the composite rubber reinforced with the HGM in Figure 3, which could result in a greater consumption of the acoustic energy. However, the absolute value of the variation of the weighted STL was close to 0.6 dB, with the increase in the μv from 2.5% to 17%, because the increase in the volume ratio of the HGM μv occupied the space of the base material of the rubber, which indicated that the volume ratio of the the HGM also had little impact on the sound insulation effect of the composite rubber reinforced with HGM.
Table 4.
The summarized STL data with the various volume ratio of the HGM.
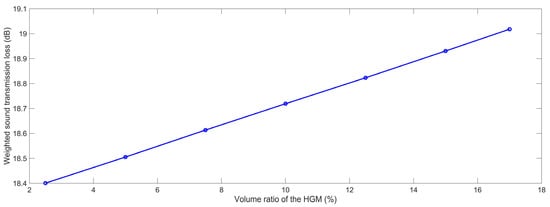
Figure 9.
The weighted STL of composite rubber reinforced with HGM for the various volume ratio of the HGM.
3.1.3. Hollow Ratio of the HGM
Similarly, the finite element simulation models of the composite rubber reinforced with HGM for various hollow ratios of the HGM μm were constructed, as shown in Figure 10. The selected μh was in the range of 10% to 90% with an interval of 10%. Based on the built finite element simulation models and the selected parameters, the STL data with the various hollow ratios of the HGM μh were achieved, as shown in Table 5. It could be found that the STL data at each frequency point in the range of 100–3150 Hz decreased normally along with the increase in the hollow ratio of the HGM, both in the low and high frequency ranges.
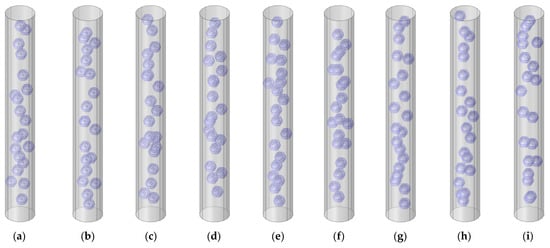
Figure 10.
Acoustic finite element simulation models of the composite rubber reinforced with the HGM for the various hollow ratio of the HGM. (a) 10%; (b) 20%; (c) 30%; (d) 40%; (e) 50%; (f) 60%; (g) 70%; (h) 80%; (i) 90%.
Table 5.
The summarized STL data with the various hollow ratio of the HGM.
The variation of the weighted STL along with the increase in the hollow ratio of the HGM μh is shown in Figure 11. It could be found that the relationship between the weighted STL and the hollow ratio of the HGM was negative, particularly when the value of the μh was larger than 50%. Along with the increase in the hollow ratio, from 10% to 90%, the weighted STL data decreased from 18.95 dB to 17.10 dB. The major reason for this phenomenon was that with the increase in the hollow ratio of the HGM μh, the thickness of the wall of the HGM reduced gradually, as shown in the acoustic wave transmission process in the composite rubber reinforced with HGM in Figure 3, and its influence on the sound insulation performance was larger than that of the increase in the interface between the HGM and the air inside it, which would result in a decrease in the STL. The variation of the weighted STL was remarkable, which indicated that the hollow ratio of the HGM μh was an important controllable factor for adjusting the sound insulation performance of the composite rubber reinforced with HGM. Meanwhile, the small hollow ratio indicated the reduction in the cavity in the HGM, which would increase the actual weight of the HGM. Therefore, the appropriate hollow ratio should be established to give consideration to both the sound insulation performance and the weight of the sound insulator.
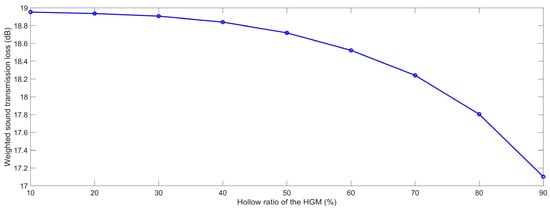
Figure 11.
The weighted STL of the composite rubber reinforced with HGM for the various hollow ratio of the HGM.
3.1.4. Thickness of the Sound Insulator
In the same way, the acoustic finite element simulation models of the composite rubber reinforced with HGM for various thicknesses of the sound insulator T were constructed, as shown in the Figure 12. The selected T was in the range of 0.5 mm to 4.0 mm, with an interval of 0.5 mm. With the increase in the thickness T, the distribution of the HGMs were more decentralized in the composite rubber, as shown in the Figure 12. According to the built finite element simulation models and the selected parameters, the STL data with the various thicknesses of the sound insulator T were achieved, which are summarized in Table 6. It could be observed that the STL was significantly affected by the thickness T in the low frequency range, the middle frequency area or in the high frequency region.
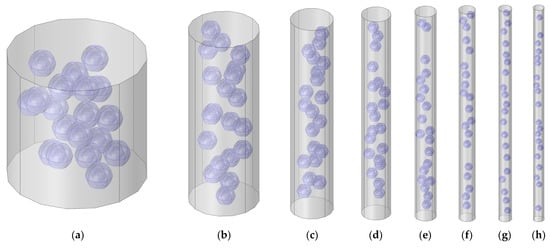
Figure 12.
Acoustic finite element simulation models of composite rubber reinforced with HGM for various thickness of the sound insulator. (a) 0.5 mm; (b) 1.0 mm; (c) 1.5 mm; (d) 2.0 mm; (e) 2.5 mm; (f) 3.0 mm; (g) 3.5 mm; (h) 4.0 mm.
Table 6.
The summarized STL data with the various thickness of the sound insulator.
The variation of the weighted STL along with the increase in the thickness of the sound insulator T is shown in Figure 13. It could be observed that the relationship between the weighted STL and the thickness of the sound insulator was positive, which was consistent with the normal sound insulation principle of viscoelastic materials. As shown in the acoustic wave transmission process in the composite rubber reinforced with HGM in Figure 3, the consumption of the incident sound wave increased along with the thickness of the sound insulator, because the propagation length of the sound wave increased, and the number of the interfaces raised simultaneously. Meanwhile, it could be found that the improvement in the weighted STL slowed down with the continuous increase in the thickness. Therefore, the thickness T should be confirmed to give consideration to both the sound insulation performance and the occupied space.
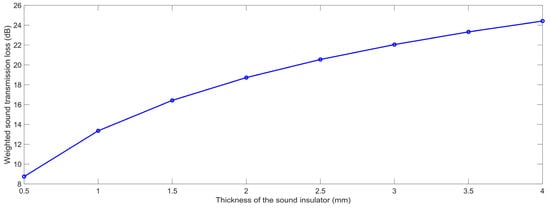
Figure 13.
The weighted STL of the composite rubber reinforced with HGM for various thickness of the sound insulator.
3.2. Physical Parameters
In addition to these structural parameters, four physical parameters were investigated in this study, which included the density of the composite rubber ρr, the density of the HGM ρm, the acoustic velocity in the composite rubber Cr and the acoustic velocity in the HGM Ch. These four physical parameters were studied successively in this section. In contrast to the analysis of the structural parameters, the analysis of the physical parameters does not require a new acoustic finite element simulation model to be built because the alteration of the physical parameters had no influence on the three–dimensional structures of the model. Therefore, the acoustic finite element simulation model in Figure 1 was utilized, and the influence of the physical parameters was analyzed by changing the values of the corresponding parameters.
3.2.1. Density of the Composite Rubber
Similarly, The STL data with the various densities of the composite rubber ρr were gained, which are shown in Table 7. The variation of the weighted STL along with the increase in the ρr is shown in Figure 14. It could be found that the relationship between the weighted STL and ρr was positive. The major reason for this phenomenon was that the sound insulation performance of the composite rubber reinforced with HGM obeyed the law of quality control, which meant that the weighted STL could increase along with the density of the composite rubber ρr. However, the improvement of the weighted STL was smaller than 0.8 dB when the value of the ρr increased from 900 kg/m3 to 1000 kg/m3, because the actual variable range for the density of the composite rubber ρr was limited, which meant that the ρr had little impact on the sound insulation effect of the sound insulator as well.
Table 7.
The summarized STL data with the various density of the composite rubber.
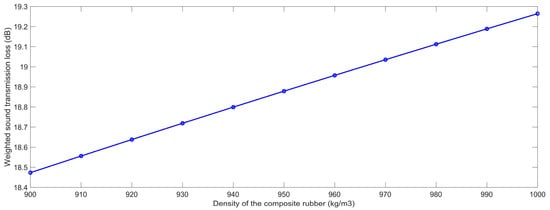
Figure 14.
The weighted STL of composite rubber reinforced with HGM for the various density of the composite rubber.
3.2.2. Density of the HGM
Similarly, according to the constructed finite element simulation models in Figure 1 and the selected parameters in Table 1, the STL data with the various densities of the HGM ρm were gained, which are summarized in Table 8, and the investigated values were in the range of 2100 kg/m3 to 2900 kg/m3 with an interval of 100 kg/m3. The variation of the weighted STL along with the increase in the ρm is shown in Figure 15. It could be found that the relationship between the weighted STL and ρm was also positive. Similarly, the major reason for this phenomenon was that the sound insulation performance of the composite rubber reinforced with HGM obeyed the law of quality control, which meant that the weighted STL could increase along with the density of the HGM ρm. However, as shown in the acoustic wave transmission process in the composite rubber reinforced with HGM in Figure 3, the increase in the density of the HGM ρm had little influence on the propagation length of the sound wave and the number of interfaces; therefore, the improvement of the weighted STL was near 0.2 dB when the value of the ρm increased from 2100 kg/m3 to 2900 kg/m3, which indicated that the density of the HGM ρm also had little impact on the sound insulation effect of the sound insulator.
Table 8.
The summarized STL data with the various density of the HGM.
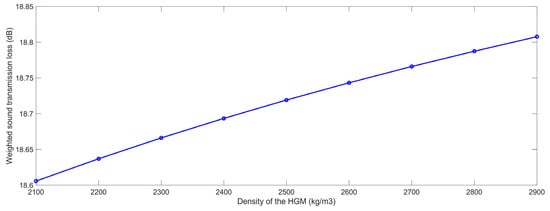
Figure 15.
The weighted STL of composite rubber reinforced with HGM for the various density of the HGM.
3.2.3. Acoustic Velocity in the Composite Rubber
In the same way, according to the constructed finite element simulation models in Figure 1 and the selected parameters in Table 1, the STL data with the various acoustic velocities in the composite rubber Cr for the range of 1500 m/s to 2100 m/s with the interval of 100 m/s were obtained, which are shown in Table 9, and the variation of the weighted STL along with the increase in the Cr is shown in Figure 16. Although the relationship between the weighted STL and the Cr was positive judging from Figure 16, the actual weighted STL had almost no change and the variation was smaller than 0.0001 dB, judging from Table 9, which indicates that the Cr should not be of concern in the development of a sound insulator using composite rubber reinforced with HGM. The major reason for this phenomenon was that the acoustic velocity in the composite rubber Cr was determined by the characteristic parameters of the rubber, such as density, rigidity, hardness, etc.; therefore, the increase in the Cr itself would not affect the sound insulation performance. In fact, the acoustic velocity in the composite rubber Cr was difficult to control and to detect for the actual composite rubber, it was only an investigated parameter in the acoustic finite element model as an influencing factor.
Table 9.
The summarized STL data with the various acoustic velocity in the composite rubber.
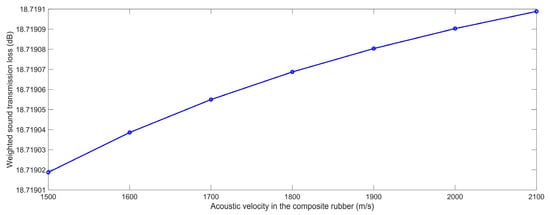
Figure 16.
The weighted STL of composite rubber reinforced with HGM for the various acoustic velocity in the composite rubber.
3.2.4. Acoustic Velocity in the HGM
In the same light, according to the constructed finite element simulation models in Figure 1 and the selected parameters in Table 1, the STL data with the various acoustic velocities in the HGM Cm were achieved for the range of 4600 m/s to 5400 m/s, with an interval of 100 m/s, which are summarized in Table 10, and the variation of the weighted STL along with the increase in the Cm is shown in Figure 17. Similarly, it could be judged from Figure 16 that the relationship between the weighted STL and the Cm was positive, and the actual weighted STL had almost no change and the variation was smaller than 0.000002 dB, judging from Table 10. The major reason for this phenomenon was similar to the analysis in Section 3.2.3 for the acoustic velocity in the composite rubber Cr.
Table 10.
The summarized STL data with the various acoustic velocity in the HGM.
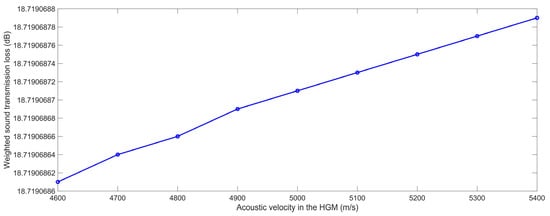
Figure 17.
The weighted STL of the composite rubber reinforced with HGM for the various acoustic velocity in the HGM.
Therefore, it could be concluded that the sound insulation performance was insensitive to the density of the composite rubber and that of the HGM, or the acoustic velocity in the composite rubber and that in the HGM, which indicated that the selections of the type of composite rubber and HGM had almost no influence on the sound insulation performance. This feature was favorable for developing various kinds of sound insulators made up of composite rubber reinforced with HGM for different practical applications by using the suitable rubber (such as butadiene styrene rubber, polyisoprene rubber, fluororubber, butyl rubber, polyurethane rubber, polybutadiene rubber, nitrile rubber, silicon rubber, ethylene propylene rubber, etc.) and the appropriate HGM, which could obtain fine thermal, mechanical, electrical or other properties, as desired.
4. Results and Discussions
It could be judged from the analysis of these influencing parameters that the thickness was the most important factor for determining the sound insulation performance of the composite rubber reinforced with HGM, and the structural parameters (diameter, volume ratio, and hollow ratio of the HGM and thickness of the sound insulator) had a larger influence on the sound insulation property than the physical parameters (the density of composite rubber and that of HGM, and the acoustic velocity in the composite rubber and that in the HGM).
In order to exhibit the effect of the filled HGM, the sound insulation performance of the pure composite rubber without any reinforcement was analyzed through the acoustic finite element simulation, which could be treated as the contrast. Afterward, the sound insulation performance of the composite rubber reinforced with HGM with different thicknesses was improved through selecting the suitable influencing parameters.
4.1. Sound Insulation Performance of Pure Composite Rubber
According to the built finite element simulation model in Figure 1, without the generation of the HGM, and the reference values of these parameters in Table 1, the STL data with the various thicknesses of the sound insulator T were achieved, which are summarized in Table 11 and shown in Figure 18, and the investigated values were in the range of 0.5 mm to 4.0 mm with an interval of 0.5 mm. Its characteristic was consistent with the normal sound insulation principle of viscoelastic materials. In the majority of cases, the sound insulation performance of the viscoelastic material was determined by its mass. In other words, it was determined by the thickness when the density was kept constant.
Table 11.
The summarized STL data with the various thickness for the pure composite rubber.
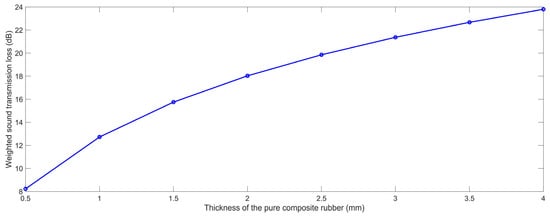
Figure 18.
The weighted STL of the pure composite rubber with the various thickness.
Meanwhile, it could be found that the increased range descended along with the increase in the frequency. Taking the sound insulator with the thickness of 0.5 mm and that with the thickness of 1.0 mm, for example, the increase ranges were 247.30%, 227.33%, 201.12%, 175.33%, 149.63%, 125.02%, 103.08%, 86.17%, 72.10%, 60.68%, 52.30%, 45.63%, 39.77%, 35.52%, 32.02% and 29.02%, corresponding to frequencies 100 Hz, 125 Hz, 160 Hz, 200 Hz, 250 Hz, 315 Hz, 400 Hz, 500 Hz, 630 Hz, 800 Hz, 1000 Hz, 1250 Hz, 1600 Hz, 2000 Hz, 2500 Hz and 3150 Hz, respectively. The major reason for this phenomenon was that the sound wave with a higher frequency was easier to be reflected by the interface between the ambient air and rubber, as shown in the acoustic wave transmission process in the composite rubber in Figure 3. This meant a larger reflected sound energy EReflection and a smaller actual incident sound energy. By contrast, the sound wave with a lower frequency had a stronger penetration capacity, which could penetrate into the composite rubber better and be consumed more thoroughly with the increase in the thickness.
Moreover, for a certain frequency, the increased range descended along with the increase in the thickness T. Taking the frequency 200 Hz, for example, the increase ranges were 175.33%, 56.66%, 29.62%, 18.89%, 13.42%, 10.20% and 8.12% corresponding to thicknesses 1.0 mm, 1.5 mm, 2.0 mm, 2.5 mm, 3.0 mm, 3.5 mm and 4.0 mm, respectively, because the sound insulation performance was not completely linear to the thickness and its influence decreased with the continuous increase in the thickness. Furthermore, the weighted STL of the pure composite rubber reached 12.72 dB, 18.03 dB, 21.37 dB and 23.80 dB with the thickness of 1.0 mm, 2.0 mm, 3.0 mm and 4.0 mm, respectively, which exhibited an excellent sound insulation performance and took little occupied space. The results were basically consistent with the experimental data expressed in the literatures [52,53,54].
4.2. Comparative Analysis
According to the analysis results of the influencing parameters on the sound insulation performance, and taking into consideration the common optional material for practical application as well, the selected parameters of the optimal composite rubber reinforced with HGM were Dm = 20 μm, μv = 17%, μh = 10%, ρr = 1000 kg/m3, ρm = 2900 kg/m3, Cr = 2100 m/s and Cm = 5400 m/s, and the investigated T ranged between 0.5 mm to 4.0 mm, with an interval of 0.5 mm. The STL data with the various thicknesses of the sound insulator T were summarized in Table 12, and the comparisons of the sound insulation performance of the pure composite rubber and that of the optimized composite rubber reinforced with HGM are shown in Figure 19. It could be found that the sound insulation performance was effectively improved through the reinforcement with HGM. In particular, when the T was 0.5 mm, the weighted STL rose from 8.23 dB to 9.62 dB, and the increase range reached 16.95%. The improved sound insulation performance would promote the application of the proposed sound insulator.
Table 12.
The summarized STL data of the optimized composite rubber reinforced with HGM for the various thickness.
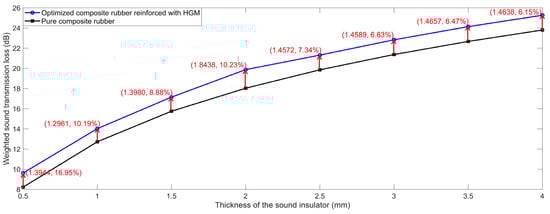
Figure 19.
Comparisons of sound insulation performance of pure composite rubber and that of the optimized composite rubber reinforced with HGM.
5. Conclusions
According to the constructed acoustic finite element simulation model based on the basic theory of pressure acoustics, the sound insulation performance and mechanism of the composite rubber reinforced with HGM for various influencing parameters was analyzed in this research, and the major achievements were as follows.
- (1)
- Through the analysis of the sound insulation mechanism with the distribution of SP and SPL in the built acoustic finite element simulation models, it could be concluded that the sound insulation effect of the composite rubber reinforced with HGM was realized through: the reflection and diffraction of the sound wave at the interfaces; the extension of the transmission path of sound wave; the reflection of the sound wave in the hollow structure; and the expansion and compression of the air in the cavity. The exhibited sound insulation mechanism would explain the different sound insulation performances with various parameters for the composite rubber reinforced with HGM.
- (2)
- There were four structural parameters and four physical parameters investigated, and the weighted STL with 1/3 octave band was selected as the evaluating indicator. It could be concluded that the diameter Dm, volume ratio μv and hollow ratio μh of the HGM had a negative effect on the sound insulation performance, and the other five parameters (T, ρr, ρm, Cr and Cm) had a positive effect. Meanwhile, the thickness T was the most influential parameter, and the influences of the Cr and Cm were negligible within the given value range. These summarized characteristics for the various influencing parameters would provide effective guidance for the selection of parameters and the development of various sound insulation materials for different application requirements.
- (3)
- The weighted STL of the optimized composite rubber reinforced with HGM was up to 14.02 dB, 19.88 dB, 22.83 dB and 25.27 dB, with the limited thickness of 1 mm, 2 mm, 3 mm and 4 mm, respectively, which obtained the increase ranges of 10.19%, 10.23%, 6.83% and 6.15%, relative to the composite rubber without any reinforcement. The improvement would not only promote the application of the proposed sound insulator of the composite rubber reinforced with HGM, but also provide a reference for the development of other sound insulation materials.
Author Contributions
Conceptualization, X.Y. and X.S.; Software, S.T. and W.P.; Validation, X.Y.; Investigation, W.P.; Data curation, X.Y., S.T. and X.S.; Writing—original draft preparation, X.Y., S.T. and X.S.; Writing—review and editing, X.S. and W.P.; Supervision, S.T. and X.S.; Funding acquisition, X.Y., S.T., X.S. and W.P. All authors have read and agreed to the published version of the manuscript.
Funding
This research was funded by the National Natural Science Foundation of China, grant numbers 12004178 and 52075538; the Natural Science Foundation of Jiangsu Province, grant numbers BK20201336 and BK20211356; the Natural Science Foundation of Hunan Province, grant number 2020JJ5670; the China Postdoctoral Science Foundation, grant number 2021M691579; the Natural Science Foundation of Jiangsu Higher Education Institution, grant number 20KJD460003; the Scientific Research Foundation for the Introduction of talent of Nanjing Vocational University of Industry Technology, grant number YK20–14–01.
Institutional Review Board Statement
Not applicable.
Data Availability Statement
The data that support the findings of this study are available from the corresponding author upon reasonable request.
Conflicts of Interest
The authors declare no conflict of interest.
References
- Dissanayake, D.G.K.; Weerasinghe, D.U.; Thebuwanage, L.M.; Bandara, U.A.A.N. An environmentally friendly sound insulation material from post–industrial textile waste and natural rubber. J. Build. Eng. 2021, 33, 101606. [Google Scholar] [CrossRef]
- Wang, J.Q.; Du, B. Experimental studies of thermal and acoustic properties of recycled aggregate crumb rubber concrete. J. Build. Eng. 2020, 32, 101836. [Google Scholar] [CrossRef]
- Kosala, K. Sound insulation properties of two–layer baffles used in vibroacoustic protection. Appl. Acoust. 2019, 156, 297–305. [Google Scholar] [CrossRef]
- Zhang, B.Y.; Poon, C.S. Sound insulation properties of rubberized lightweight aggregate concrete. J. Clean. Prod. 2018, 172, 3176–3185. [Google Scholar] [CrossRef]
- Aliabdo, A.A.; Abd Elmoaty, A.E.M.; AbdElbaset, M.M. Utilization of waste rubber in non–structural applications. Constr. Build. Mater. 2015, 91, 195–207. [Google Scholar] [CrossRef]
- Holmes, N.; Browne, A.; Montague, C. Acoustic properties of concrete panels with crumb rubber as a fine aggregate replacement. Constr. Build. Mater. 2014, 73, 195–204. [Google Scholar] [CrossRef]
- Merillas, B.; Villafañe, F.; Rodríguez-Pérez, M.Á. A New Methodology Based on Cell-Wall Hole Analysis for the Structure-Acoustic Absorption Correlation on Polyurethane Foams. Polymers 2022, 14, 1807. [Google Scholar] [CrossRef] [PubMed]
- Kaidouchi, H.; Kebdani, S.; Slimane, S.A. Vibro-acoustic analysis of the sound transmission through aerospace composite structures. Mech. Adv. Mater. Struc. 2022, 3, 1–11. [Google Scholar] [CrossRef]
- Picado-Santos, L.G.; Capitao, S.D.; Neves, J.M.C. Crumb rubber asphalt mixtures: A literature review. Constr. Build. Mater. 2020, 247, 118577. [Google Scholar] [CrossRef]
- Teti, L.; de Leon, G.; Del Pizzo, L.G.; Moro, A.; Bianco, F.; Fredianelli, L.; Licitra, G. Modelling the acoustic performance of newly laid low-noise pavements. Constr. Build. Mater. 2020, 247, 118509. [Google Scholar] [CrossRef]
- Ascari, E.; Cerchiai, M.; Fredianelli, L.; Licitra, G. Statistical Pass-By for Unattended Road Traffic Noise Measurement in an Urban Environment. Sensors 2022, 22, 8767. [Google Scholar] [CrossRef] [PubMed]
- Freitas, E.F. The effect of time on the contribution of asphalt rubber mixtures to noise abatement. Noise Control Eng. J. 2012, 60, 1–8. [Google Scholar] [CrossRef]
- Fei, Y.; Fang, W.; Zhong, M.; Jin, J.; Fan, P.; Yang, J.; Fei, Z.; Chen, F.; Kuang, T. Morphological Structure, Rheological Behavior, Mechanical Properties and Sound Insulation Performance of Thermoplastic Rubber Composites Reinforced by Different Inorganic Fillers. Polymers 2018, 10, 276. [Google Scholar] [CrossRef] [PubMed]
- Zhao, J.; Wang, X.M.; Chang, J.M.; Yao, Y.; Cui, Q. Sound insulation property of wood–waste tire rubber composite. Compos. Sci. Technol. 2010, 70, 2033–2038. [Google Scholar] [CrossRef]
- Yu, T.M.; Jiang, F.C.; Wang, J.H.; Wang, Z.Q.; Chang, Y.P.; Guo, C.H. Acoustic insulation and absorption mechanism of metallic hollow spheres composites with different polymer matrix. Compos. Struct. 2020, 248, 112566. [Google Scholar] [CrossRef]
- Hu, S.; Cai, J.; Liao, G.F.; Fu, Q. Preparation and Sound Insulation Performance of Superfine Metal Powder/Nitrile–Butadiene Rubber–Polyvinyl Chloride Microcellular Foaming Material. Adv. Polym. Tech. 2019, 2019, 7608641. [Google Scholar] [CrossRef]
- Suhawati, I.; Shamsul, K.; Ismaliza, I.; Kamarudin, A.M. Sound Absorption Analysis of Foamed Rubber Composites from Kenaf and Calcium Carbonate. J. Rubber Res. 2013, 16, 36–44. [Google Scholar]
- Fang, W.; Fei, Y.P.; Lu, H.Q.; Jin, J.M.; Zhong, M.Q.; Fan, P.; Yang, J.T.; Fei, Z.D.; Chen, F.; Kuang, T.R. Enhanced sound insulation and mechanical properties based on inorganic fillers/thermoplastic elastomer composites. J. Thermoplast. Compos. 2019, 32, 936–950. [Google Scholar] [CrossRef]
- El–Wakil, A.; Abd–Elbasseer, M.; El–Basheer, T.M. Mechanical and acoustical properties of Eichhornia crassipes (water hyacinth) fiber–reinforced styrene butadiene rubber. Polym. Composite 2021, 42, 3732–3745. [Google Scholar] [CrossRef]
- Tiuc, A.-E.; Borlea, S.I.; Nemeș, O.; Vermeșan, H.; Vasile, O.; Popa, F.; Pințoi, R. New Composite Materials Made from Rigid/Flexible Polyurethane Foams with Fir Sawdust: Acoustic and Thermal Behavior. Polymers 2022, 14, 3643. [Google Scholar] [CrossRef]
- Barghamadi, M.; Karrabi, M.; Ghoreishy, M.H.R.; Mohammadian–Gezaz, S. Effects of two types of nanoparticles on the cure, rheological, and mechanical properties of rubber nanocomposites based on the NBR/PVC blends. J. Appl. Polym. Sci. 2019, 136, 47550. [Google Scholar] [CrossRef]
- Shin, P.S.; Kim, J.H.; DeVries, K.L.; Park, J.M. Manufacturing and qualitative properties of glass fiber/epoxy composite boards with added air bubbles for airborne and solid–borne sound insulation. Compos. Sci. Technol. 2020, 194, 108166. [Google Scholar] [CrossRef]
- Ersoy, O. The effect of dispersion quality of fillers on soundproofing properties of acrylonitrile butadiene styrene/dense filler composites: Barite vs Magnetite. Polym. Composite 2020, 41, 1045–1052. [Google Scholar] [CrossRef]
- Du, X.; He, J.H. Spherical silica micro/nanomaterials with hierarchical structures: Synthesis and applications. Nanoscale 2011, 3, 3984–4002. [Google Scholar] [CrossRef] [PubMed]
- Righini, G.C. Glassy Microspheres for Energy Applications. Micromachines 2018, 9, 379. [Google Scholar] [CrossRef]
- Herrera–Ramirez, L.C.; Cano, M.; de Villoria, R.G. Low thermal and high electrical conductivity in hollow glass microspheres covered with carbon nanofiber–polymer composites. Compos. Sci. Technol. 2017, 151, 211–218. [Google Scholar] [CrossRef]
- An, Z.G.; Zhang, J.J. Glass/Ni–P/Co–Fe–P three layer hollow microspheres: Controlled fabrication and magnetic properties. Mater. Lett. 2012, 85, 95–97. [Google Scholar] [CrossRef]
- Cho, Y.J.; Lee, W.; Park, Y.H. Finite Element Modeling of Tensile Deformation Behaviors of Iron Syntactic Foam with Hollow Glass Microspheres. Materials 2017, 10, 1201. [Google Scholar] [CrossRef]
- An, Z.G.; Zhang, J.J. Composite foams prepared through hollow glass microspheres assisted bubbling. Adv. Compos. Lett. 2013, 22, 10–12. [Google Scholar] [CrossRef]
- Okuzono, T.; Otsuru, T.; Tomiku, R.; Okamoto, N. A finite-element method using dispersion reduced spline elements for room acoustics simulation. Appl. Acoust. 2014, 79, 1–8. [Google Scholar] [CrossRef]
- Yang, F.; Wang, E.; Shen, X.; Zhang, X.; Yin, Q.; Wang, X.; Yang, X.; Shen, C.; Peng, W. Optimal Design of Acoustic Metamaterial of Multiple Parallel Hexagonal Helmholtz Resonators by Combination of Finite Element Simulation and Cuckoo Search Algorithm. Materials 2022, 15, 6450. [Google Scholar] [CrossRef]
- Sathyan, S.; Aydin, U.; Belahcen, A. Acoustic Noise Computation of Electrical Motors Using the Boundary Element Method. Energies 2020, 13, 245. [Google Scholar] [CrossRef]
- Wang, E.; Yang, F.; Shen, X.; Duan, H.; Zhang, X.; Yin, Q.; Peng, W.; Yang, X.; Yang, L. Development and Optimization of Broadband Acoustic Metamaterial Absorber Based on Parallel–Connection Square Helmholtz Resonators. Materials 2022, 15, 3417. [Google Scholar] [CrossRef] [PubMed]
- Abdullahi, M.; Oyadiji, S.O. Acoustic Wave Propagation in Air-Filled Pipes Using Finite Element Analysis. Appl. Sci. 2018, 8, 1318. [Google Scholar] [CrossRef]
- Yang, X.; Yang, F.; Shen, X.; Wang, E.; Zhang, X.; Shen, C.; Peng, W. Development of Adjustable Parallel Helmholtz Acoustic Metamaterial for Broad Low-Frequency Sound Absorption Band. Materials 2022, 15, 5938. [Google Scholar] [CrossRef]
- Van Genechten, B.; Vandepitte, D.; Desmet, W. A direct hybrid finite element—Wave based modelling technique for efficient coupled vibro-acoustic analysis. Comput. Methods Appl. Mech. Eng. 2011, 200, 5–8. [Google Scholar] [CrossRef]
- Yang, F.; Bi, S.; Shen, X.; Li, Z.; Zhang, X.; Wang, E.; Yang, X.; Peng, W.; Huang, C.; Liang, P.; et al. Adjustable Sound Absorber of Multiple Parallel-Connection Helmholtz Resonators with Tunable Apertures Prepared by Low-Force Stereolithography of Photopolymer Resin. Polymers 2022, 14, 5434. [Google Scholar] [CrossRef]
- Lin, Q.H.; Lin, Q.L.; Wang, Y.H.; Di, G.Q. Sound insulation performance of sandwich structure compounded with a resonant acoustic metamaterial. Compos. Struct. 2021, 273, 114312. [Google Scholar] [CrossRef]
- Wu, H.; Shen, Y.; Liang, M.; Liu, J.; Wu, J.; Li, Z. Performance Research and Optimization of Sound Insulation Hood of Air Compressor Unit. Appl. Sci. 2021, 11, 10364. [Google Scholar] [CrossRef]
- Xu, X.; Wang, Y.; Wang, Y. Influence of Magnetic Field on Sound Transmission Loss of the Unit Filled with Magnetorheological Fluid. Materials 2022, 15, 6032. [Google Scholar] [CrossRef]
- Shi, X.; Shi, G.; Li, S.; Du, X.; Han, Y. Sound Insulation Properties of Hollow Polystyrene Spheres/Polyethylene Glycol/Epoxy Composites. Polymers 2022, 14, 1388. [Google Scholar] [CrossRef]
- Li, S.; Xu, D.; Wu, X.; Jiang, R.; Shi, G.; Zhang, Z. Sound Insulation Performance of Composite Double Sandwich Panels with Periodic Arrays of Shunted Piezoelectric Patches. Materials 2022, 15, 490. [Google Scholar] [CrossRef]
- Yang, G.; Huang, Q.; Yang, M.; Huang, Y. Sound Transmission Loss of Metamaterial Honeycomb Core Sandwich Plate Elastically Connected with Periodic Subwavelength Arrays of Shunted Piezoelectric Patches. Materials 2022, 15, 3923. [Google Scholar] [CrossRef] [PubMed]
- Zhang, Z.; Wang, J.; Li, Z.; Zhang, X. Broadband Sound Insulation and Dual Equivalent Negative Properties of Acoustic Metamaterial with Distributed Piezoelectric Resonators. Materials 2022, 15, 4907. [Google Scholar] [CrossRef] [PubMed]
- Lee, B.M.; Johnson, J.R.; Dowling, D.R. Predicting Acoustic Transmission Loss Uncertainty in Ocean Environments with Neural Networks. J. Mar. Sci. Eng. 2022, 10, 1548. [Google Scholar] [CrossRef]
- Cunha, B.Z.; Zine, A.-M.; Ichchou, M.; Droz, C.; Foulard, S. On Machine–Learning–Driven Surrogates for Sound Transmission Loss Simulations. Appl. Sci. 2022, 12, 10727. [Google Scholar] [CrossRef]
- Hou, Z.; Wang, Q.; Zhang, S.; Si, T.; Li, T.; Zhang, Z. Structural Design and Parameter Optimization of Bionic Exhaust Tailpipe of Tractors. Appl. Sci. 2022, 12, 2741. [Google Scholar] [CrossRef]
- Huang, H.; Cao, E.; Zhao, M.; Alamri, S.; Li, B. Spider Web–Inspired Lightweight Membrane–Type Acoustic Metamaterials for Broadband Low–Frequency Sound Isolation. Polymers 2021, 13, 1146. [Google Scholar] [CrossRef] [PubMed]
- Zhang, Z.J.; Jiang, H.; Li, R.; Gao, S.; Wang, Q.; Wang, G.J.; Ouyang, X.; Wei, H. High-damping polyurethane/hollow glass microspheres sound insulation materials: Preparation and characterization. J. Appl. Polym. Sci. 2020, 138, e49970. [Google Scholar] [CrossRef]
- Pakdel, E.; Naebe, M.; Kashi, S.; Cai, Z.; Xie, W.; Yuen, A.C.Y.; Montazer, M.; Sun, L.; Wang, X.G. Functional cotton fabric using hollow glass microspheres: Focus on thermal insulation, flame retardancy, UV-protection and acoustic performance. Prog. Org. Coat. 2020, 141, 105553. [Google Scholar] [CrossRef]
- Liang, J.Z. Tensile and flexural properties of hollow glass bead-filled ABS composites. J. Elastom. Plast. 2005, 37, 361–370. [Google Scholar] [CrossRef]
- Gao, N.S.; Hou, H. Low frequency acoustic properties of a honeycomb-silicone rubber acoustic metamaterial. Mod. Phys. Lett. B 2017, 31, 1750118. [Google Scholar] [CrossRef]
- El Messiry, M.; Ayman, Y. Investigation of sound transmission loss of natural fiber/rubber crumbs composite panels. J. Ind. Text. 2022, 51, 5347S–5369S. [Google Scholar] [CrossRef]
- Huq, M.M.; Chen, P.Q.; Hsieh, C.T.; Yang, H.C.; Tasi, T.P. Sound transmission loss from polyvinyl acetate polymer mixed with different porous carbons. Micropor. Mesopor. Mat. 2016, 232, 184–188. [Google Scholar] [CrossRef]


Disclaimer/Publisher’s Note: The statements, opinions and data contained in all publications are solely those of the individual author(s) and contributor(s) and not of MDPI and/or the editor(s). MDPI and/or the editor(s) disclaim responsibility for any injury to people or property resulting from any ideas, methods, instructions or products referred to in the content. |
© 2023 by the authors. Licensee MDPI, Basel, Switzerland. This article is an open access article distributed under the terms and conditions of the Creative Commons Attribution (CC BY) license (https://creativecommons.org/licenses/by/4.0/).