Abstract
Polymer blend hybrid nanocomposites are of great importance for future optoelectronic applications. This paper presents the preparation of new polymer blend hybrid nanocomposites based on PVC/PVP modified with Er2O3 nanoparticles. A low-cost solution casting method has been used to prepare the polymer nanocomposites at 0.0, 0.1, 0.3 and 0.6 wt% of Er2O3. X-ray diffraction (XRD), Fourier transform infrared (FTIR), Raman spectroscopy, and environmental scanning electron microscopy (ESEM) measurements have all been used to examine the impact of a varying wt% of Er2O3 on the structural and optical characteristics of PVP/PVC polymer blends. The PVC/PVP polymer blend and Er2O3 nanoparticles showed a strong interaction, which was validated by XRD, FTIR, and Raman spectrum investigations. The SEM micrographs showed a remarkable complexation among the components of the polymer nanocomposites. The activation energies for thermal decomposition of PVC/PVP doped with different Er2O3 concentrations were less than that of the pure polymer film. The linear and nonlinear refractive indexes, dispersion energy, optical susceptibility and the energy gap values were found to be Er2O3 concentration-dependent. With an increase in Er2O3 concentration to 0.1 and 0.3 wt%, the dispersion energy and nonlinear refractive index improved, and thereafter decreased when the concentration was further increased to 0.6For the film doped with 0.1 wt% Er2O3, the optical band gap (Eopt) of the composite film enhanced by about 13%. The optical absorption measurements revealed clear improvements with the addition of erbium oxide. Higher refractive index values of PVC/PVP/Er2O3 films qualify the polymer blend as a cladding for electro-optic modulators. Our results indicated that the PVC/PVP/Er2O3 polymer films could be suitable for optoelectronic space applications.
1. Introduction
The current advances in polymer science and technology have enabled the production of multiple types of polymer nanocomposites that are used in different industrial applications. Polymer blends have recently emerged as highly promising materials for many applications including solar cells, sensors, energy storage, as well as water desalination [1,2,3,4]. This is because the mixture of two or more polymer matrices often exhibits novel properties that cannot be achieved with their individual components. Moreover, successful dispersion of metal oxide nanoparticles into polymer blend matrices, as guest fillers, has become an interesting subject of research due to its potential to improve many physical and chemical properties which, in turn, expands the range of their potential applications [5,6,7].
Among the various types of polymers, PVC has a large variety of applications because of its excellent physical properties [8,9]. Recently, PVC polymer nanocomposites have been proposed for optoelectronic applications due to their superior optical characters such as transmittance, fluorescence and tunable refractive index [10]. However, the use of PVC is limited due to its moderate flexibility and lower thermal stability. PVP on the other hand has excellent properties such as transparency, charge storage capacity, stability, ease of processing and biocompatibility, but its commercial prospects are limited due to its brittleness. Earlier reports have demonstrated the miscibility of PVP with PVC through a decreased association of PVP chains [11]. Moreover, the dehydrochlorination temperature of PVC was found to decrease by the addition of PVP, thereby decreasing the defects in the PVC matrix [12]. Bhavsar, V. et al. [13] reported the enhanced dielectric properties, mechanical flexibility, and degradability of PVC/PVP blend. This study reported that PVP/PVC blend films with 50%/50% weight concentration have enhanced mechanical flexibility, improved degradability, and modulated dielectric constants (2–3). Moreover, the mixture of PVC and PVP exhibited a tunable optical band gap and the IR spectrum of this blend (50%;50%) demonstrated the complexation reaction between PVC and PVP. These findings suggest that the PVC/PVP blend could be an attractive host for the deployment of different nanoparticles. Although there are a considerable number of studies on metal oxide or sulfide nanoparticle-doped polymer blends, the reports on nanocomposites based on PVC/PVP blend matrices are very scarce. Nevertheless, in a recent study, we reported the enhanced thermal stability of PVC/PVP by the addition of zinc ferrite (ZnFe2O4) nanoparticles [14]. More recently, we demonstrated that the incorporation of SrTiO3 nanofillers in PVC/PVP blend polymers had a dramatic impact on the optical absorption, optical susceptibility, and linear and nonlinear refractive indexes [15].
Er2O3 nanoparticles have drawn remarkable interest in many studies due to their high dielectric constant (10–14) [16] and characteristic fluorescence emissions (650 nm for 4F9/2 to 4I15/2 and 580 nm for 4S3/2 to 4I15/2) [17]. These properties rendered erbium oxide a potential material for optoelectronic applications such as optical sensors and waveguide amplifiers [18]. Various studies reported the impact of using Er2O3 as a nanofiller on the properties of various polymer nanocomposites. For example, the addition of Er2O3 nanoparticles was shown to improve the electrical, thermal and optical properties of PMMA polymers [19]. Similarly, the electrical conductivity of CMC/PVA was observed to be enhanced after the addition of Er2O3 nanoparticles [20]. Additionally, the controlled attachment of Er2O3 nanoparticles has led to significant improvements in the thermal and dielectric properties of PVDF [21].
In the present work, we aim to investigate the feasibility of modifying the PVC/PVP mixture with Er2O3 nanoparticles for possible optoelectronic applications. The preparation protocol follows the method of solution casting that includes mixing the two dissolved polymers before the addition of dissolved Er2O3 nanoparticles at room temperature. To obtain detailed information on the structural properties of these nanocomposites, complementary characterization techniques will be employed. The thermal stability of the triple mixture films will be studied using TGA analysis, whereas the linear and nonlinear optical behavior with variable Er2O3 content will be also discussed.
2. Materials and Methods
AnalaR grade PVC (MERK, Germany) and PVP (LOBACEMIE, India) polymer powders were used for the synthesis of PVC/PVP polymer blends. The first step involved in the preparation of the polymer blend films was dissolving certain amounts of PVC (0.9 g) and PVP (0.1 g) polymers in tetrahydrofuran (THF) solvent provided from CARLO ERBA, Italy. This process was carried out for 60 min at room temperature on a magnetic stirrer. In a separate step, Er2O3 nanoparticles were dispersed in THF solvent in different proportions. Finally, the Er2O3 solution was mixed with the polymer mixture solution under magnetic stirring for 60 min. In polypropylene dishes, the final solution was poured before being allowed to dry naturally.
The Shimadzu XRD 7000 (λ = 1.54056 Å) generated diffractograms of PVC/PVP/Er2O3 films. A Shimadzu FTIR–Tracer 100 spectrometer was used to measure the ATR spectra between 399 and 2000 cm−1. Raman data were recorded on Hound Unchained spectrometer at 785 nm and a 5 s exposure time. On a Thermo Fisher Scientific Quattro ESEM environmental scanning electron microscope, ESEM images were collected for blend films. TGA scans for the polymer films at a heating rate of 10 °C/min were recorded on a thermogravimetric analyzer (Shimadzu TGA-51 Japan) within the range 30–600 °C. On an Agilent Cary 60 UV-Vis spectrophotometer, optical absorption data were measured in the wavelength range of 190–1000 nm.
3. Results and Discussions
3.1. Strucutral Characterization
Figure 1 displays the X-ray diffraction patterns of the PVC/PVP polymer film and PVC/PVP/Er2O3 nanocomposites. The remarkable crystalline quality of Er2O3 nanoparticles was demonstrated by the strong XRD peaks. The (211), (222), (400), (440), and (622) reflections of cubic Er2O3 (JCPDS No. 35-0734) correspond to the peak positions at 2θ = 20.3°, 29.1°, 33.7°, 48.5° and 57.7°, respectively [21]. The average nanocrystalline size of Er2O3 was found to be 39 nm using the Scherer equation, according to the formula [22,23,24,25]:
where λ is the X-ray wavelength and β is the full width at half maximum (FWHM).

Figure 1.
XRD diffraction peaks of PVC/PVP/Er2O3 blend nanocomposites.
The two diffuse peaks at 19.0° and 25.0° in the spectra indicate the semicrystalline character of the PVC/PVP blend. However, the XRD patterns of PVC/PVP/Er2O3 nanocomposites indicate that increasing the concentration of Er2O3 does not change the semicrystalline structure. This finding agrees with previous work that small concentrations of nanofillers were not able to modify the polymer network structure [21]. ESEM cross-sectional micrographs were taken to verify the distribution of Er2O3 nanoparticles within the polymer blend films. The images in Figure 2 show a good complexity of nano-Er2O3 with the PVC/PVP network. Moreover, the images in Figure 2e,f support the characterization of a homogeneous dispersion of Er2O3 nanoparticles inside the polymer blend composites.
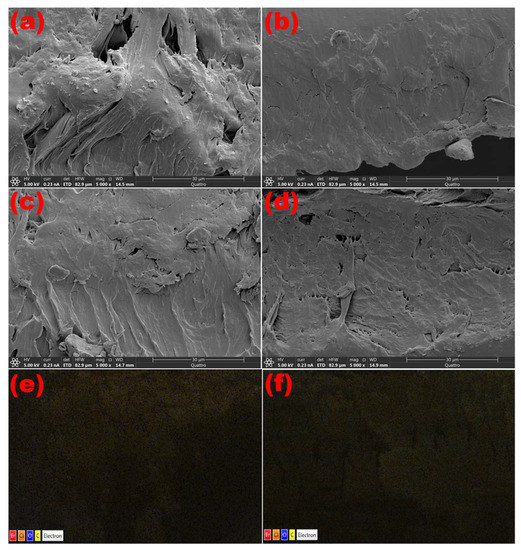
Figure 2.
Cross-sectional ESEM scans of PVC/PVP/Er2O3 polymer films at (a) 0.0, (b) 0.1, (c) 0.3 and (d) 0.6 wt% and EDS mapping for (e) 0.3 and (f) 0.6 wt%.
The FTIR spectra of the PVC/PVP/Er2O3 blends with different Er2O3 concentrations are shown in Figure 3. At 1650 cm−1, the hydroxyl group bending vibrations were identified for all polymer films [26]. The bands at 1322 and 1495 cm−1 belong to vibrations of C−O and C=C [27]. The bending vibrations of C−H plane verified at positions 684, 833 and 957 cm−1 [27,28].

Figure 3.
FTIR spectra of nanocomposites PVC/PVP/Er2O3.
The vibrations at 1462 and 1290 cm−1 are generated because of C−N stretching and bending vibrations, while the C−Cl bond is responsible for the bands at 605 and 633 cm−1 [27]. Er2O3 has a metal-oxygen bond (M−O) shown at 557 cm−1 [29].
The Raman spectra of the nanocomposites at various Er2O3 concentrations are shown in Figure 4. Stretching vibrations of the C−Cl bonds induced the strong peaks at 635 and 695 cm−1. Furthermore, the stretching vibration of C−H and CH2 bonds generated the sharp peak at 2916 cm−1 [30]. The intensity of the band at 635 cm−1 of the PVC/PVP blend is increased upon doping with only 0.1 wt% of Er2O3. The intercalation of PVC/PVP/Er2O3 was proven with this level of quenching, particularly in the C−Cl region where the asymmetric stretching vibration of Er2O3 is most noticeable.
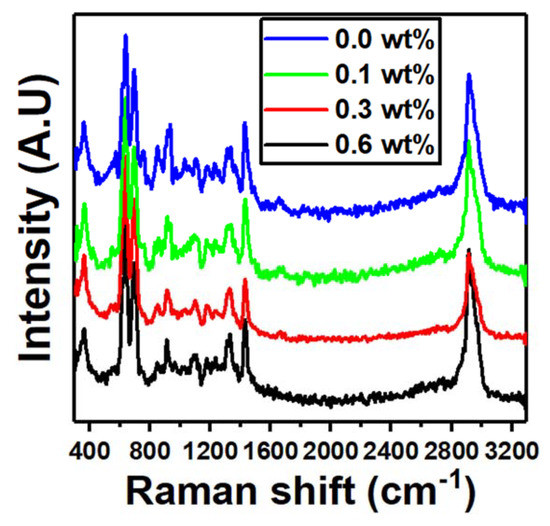
Figure 4.
Raman spectra for blend nanocomposites PVC/PVP with different concentrations of Er2O3.
3.2. Thermal Stability Measurements
In order to examine the thermal decomposition of PVC/PVP/Er2O3 films, TGA and DTG tests were performed at 0.0, 0.1, 0.3 and 0.6 wt% of Er2O3. The TGA plots have three distinct stages of thermal decomposition, as shown in Figure 5a. The first degradation stage of the undoped film occurs in the temperature range of 300 to 502 K, while for the films doped with 0.1, 0.3 and 0.6 wt% of Er2O3, it appears in the ranges of 300 to 398 K, 300 to 503 K and 300 to 408 K, respectively. The second stage (main stage) appears for the pure PVC/PVP film in the range of 389 to 459 K and for the nanocomposite films in the ranges of 480 to 555 K, 485 to 551 K and 485 to 559 K, respectively. The third degradation stage occurs in the range of 746 to 786 K for the undoped films, while it appears for doped films in the ranges of 730 to 756 K, 733 to 766 K and 638 to 669 K, respectively. This is typically associated with the PVC/PVP polymer blend backbone. Figure 5b represents the derivative thermogravimetric (DTG) curve where the highest decomposition temperature, Tp, is shifted toward higher values.

Figure 5.
Representation of (a) TGA data plots, (b) DTG plots and (c) Coats–Redfern graphs for PVC/PVP doped with Er2O3 at different concentrations of 0.0, 0.1, 0.3 and 0.6 wt%.
For all samples, the increase of Er2O3 concentration improved the thermal stability of PVC/PVP polymers films. We also investigated the thermal kinetics of these samples in the main stage using the Coats–Redfern method via the formula [31,32]:
where α = indicates the decomposition degree, Ea refers to the activation energy of decomposition stage, R represents the gas constant, the reaction rate coefficient represented by A and φ denotes the heating rate. Figure 5c shows Coats–Redfern graphs of versus for the nanocomposites films. The Ea values can be easily extracted from the slope of the straight line as Ea =2.303 R slope, while the reaction rate coefficient A can be evaluated from the y-axis intercept.
Table 1 shows the thermal calculations for PVC/PVP with various concentrations of Er2O3 (0.0, 0.1, 0.3 and 0.6 wt%). It is shown that the activation energies values of PVC/PVP doped samples are less than that of the undoped film [33]. The reduced activation energy is attributed to the movement of pure polymer segments [34].

Table 1.
The thermal parameters for PVC/PVP doped with different Er2O3 concentrations.
The thermodynamic parameters of entropy, ∆S°, enthalpy, ∆H, and Gibbs free energy, ∆G°, have been evaluated in the main degradation stage using the following equations [21]:
where h and kβ represent Plank’s and Boltzmann constants. Table 1 shows negative values of entropy (∆S°) for all samples, which means that the active state becomes less disordered in the studied polymer blend. The enthalpy (∆H) calculations show positive values, presumably due to the change of translational, vibrational or rotation states. Moreover, the Gibbs free energy values are also positive because the residue’s free energy and thermal decomposition is larger than the pure blend [35].
3.3. Optical Properties
Figure 6a shows the optical absorbance and transmittance of pure and Er2O3-doped PVC/PVP. The presence of an absorption band at 280 nm for the pure PVC/PVP blend film is attributed to π→π* interband electronic transitions [36,37]. The absorption edge is blue shifted towards lower wavelengths for the doped films due to an increase in the optical band gap that may be caused by the formation of cation and anion intermolecular bonds. It can therefore be concluded that increasing the concentration of Er2O3 nanoparticles is responsible for the band defect formation in PVC/PVP blend films [38].

Figure 6.
Plots of optical measurements for pure and doped PVC/PVP film with different Er2O3 concentrations: (a) absorbance and (b) transmittance against wavelength.
Figure 6b shows the optical transmittance for pure and doped PVC/PVP blend films. The image shows a clear drop in the transmittance for films doped with 0.1 and 0.3 wt% Er2O3. This decrease in the optical transmittance is expected, since the dispersion of Er2O3 forms dense nanoparticles within the blend matrix which increases photon scattering [39]. However, the optical transmittance spectrum does not follow the same trend for the sample doped with 0.6 wt% Er2O3. This is due to defect formations in the PVC/PVP polymer chains caused by high Er2O3 concentration after filling the polymer clusters.
The following Tauc’s formula (Equation (6)) was used to determine the values of the optical band gap (Eopt) [40,41]:
where α and hυ are the absorption coefficient and the incident photon energy, respectively, and k is a constant. The direct and indirect allowed transitions have the values of x = 0.5 and 2.0, respectively. The direct (Edir) and indirect (Eind) optical energy gaps are obtained from the intercept of straight lines at zero absorption as shown in Figure 7a,b. Doping the PVC/PVP film with only 0.1 wt% Er2O3 causes a significant increase in Edir and Eind values by 12.5 and 9.0 %, respectively, compared to those of the pure film. Further increasing the concentration to 0.3 wt% causes minor changes in these energy values, as shown in Table 2. In addition, the optical band gap (Eopt) is drastically increased by ~13% for the doped film with 0.1 wt% Er2O3. The improvement of charge transfer at the polymer/filler interface increase the optical energy gap [42]. For the sample doped with the higher concentration of 0.6 wt% Er2O3, the values of Edir, Eind and Eopt are slightly decreased, which indicate a narrower band gap at this concentration.
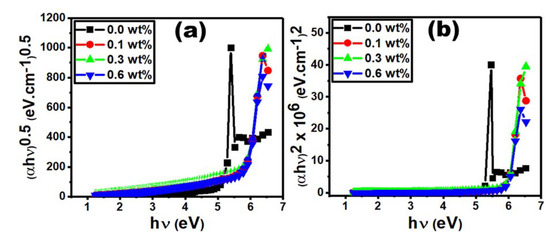
Figure 7.
(a) (αh0.5 vs. h and (b) (αh2 vs. h for different Er2O3 concentrations.
Table 2.
The optical parameters generated for the PVC/PVP/Er2O3 polymer films.
The optical reflectance measurements in Figure 8a show that the reflectance increases with the increase in Er2O3 content for the film doped with 0.1 and 0.3 wt% Er2O3. However, when the Er2O3 content increases to 0.6 wt%, the optical reflectance decreases compared to the 0.3 wt% Er2O3 sample. This behavior can be explained by defect formation due to the presence of high molecular weight Er2O3 in the polymer blend films. The optical reflectance values extracted from the plot shown in Figure 7a support the calculation of refractive index (n) as follows [43]:
where R denotes the optical reflectance and k denotes the extinction coefficient (k = αλ/4π). Figure 7b illustrates that the refractive index increases with the addition of 0.1 and 0.3 wt% Er2O3, which could be due to large clusters formed via Er2O3 condensation [44]. However, the n value decreases for the sample doped with 0.6 wt% Er2O3.
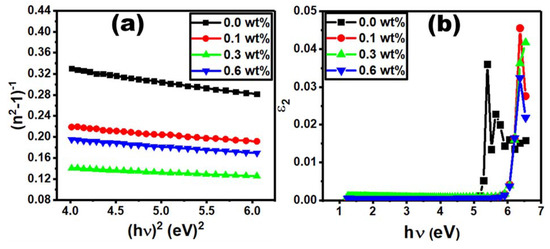
Figure 8.
Plot of (a) reflectance and (b) refractive index for PVC/PVP films with different Er2O3 concentrations.
Nevertheless, the refractive index values determined in this work were found to be higher than those obtained in a previous study [44]. Since they are all above 1.65, they are very attractive for optoelectronic applications for example LEDs, emissive displays [45] photonic crystals [46,47] and solar cells [48].
The following formula is used to express the refractive index dispersion of PVC/PVP/Er2O3 films [49]:
where E0 is the single-oscillator energy and Ed is the dispersion energy [50]. E0 and Ed can be calculated from Figure 8a ((n2−1) vs. by identifying the slope and interception value with the y-axis. The E0 and Ed values were found to be Er2O3 concentration dependent, as given in Table 2. The E0 value varies in the range from 4.23 eV to 4.75 eV. It increases with increasing Er2O3 content to 0.1 and 0.3 wt% and then decreases for the film doped with 0.6% Er2O3 due to the electron transition probability within allowed electronic bands [51]. The Ed value also varies in the range of 10 eV to 27.9 eV, depending on the concentration of Er2O3. Its variation trend is compatible with the values of E0 and the optical band gap. The Ed value increases rapidly for the PVC/PVP polymer films doped with 0.1 and 0.3 wt% Er2O3, which reflects the enhancement in optical transition strength between the polymer blend and Er2O3. This, on the other hand, indicates that a charge transfer between the PVC/PVP blend and Er2O3 took place [39]. The reduction in Ed value as the concentration increases to 0.6 wt% may be explained by the formation of defects in PVC/PVP chains. The dependency of E0 and Ed values on the doping concentration agrees with a previous study on PVC/SiO2 [52]. In our study, almost all optical parameters depend on the Er2O3 concentration, which can be considered as a key control for the energy of excitation in the PVC/PVP matrix composites. The static refractive index (n0) at (hv→0) can be evaluated by Equation (9) [53]:
The evaluation of n0 values for pure and doped PVC/PVP films with different Er2O3 concentrations is given in Table 2. Following all the optical characteristics presented in this work, the n0 values increase from 2.16 to 2.62 for PVP/PVC films doped with the two lowest concentrations (0.1 and 0.3 wt%) while it decreases for the sample doped with 0.6 wt%. This result could be very interesting from an industrial point of view, since higher n0 values are required for many applications.
Figure 8b shows the plot of optical dielectric loss, ε2, as function of photon energy, hυ, where ε2 is expressed as 2nk [54]. The energy gap values were determined by extrapolating the linear part of the curve to the intercept with the photon energy (hυ) axis in the plot of ε2 as a function of hυ. The value of the hυ axis intercept represents the real band gap energy [55], which is compatible with the values of Edir for all content of Er2O3.
The oscillator strength (f) is calculated based on Ed and E0 (see Equation (10)) [46], and the values associated with Er2O3 content are recorded in Table 2.
As seen in Table 3, the values of oscillator strength increase with an increase in the Er2O3 concentration. Furthermore, the optical moments () of PVC/PVP/Er2O3 polymer films can be computed from Equation (11) [56]:
Table 3.
Values of optical moments, optical susceptibility, nonlinear refractive index and real optical energy gap for PVC/PVP/Er2O3 blend films.
Table 3 contains the values of M−1 and M−3, which improved as the content of Er2O3 varies from 0.0 to 0.6 wt%. Therefore, the strength of optical transitions is strengthened by this increase in optical spectrum moments. Moreover, Equation (12) was used to calculate the linear optical susceptibility () and the third order nonlinear optical susceptibility () of PVC/PVP/Er2O3 polymer blends [57]:
The values of and recorded in Table 3 were enhanced upon the increase in Er2O3 content. In addition, the nonlinear refractive index (n2) was estimated according to Equation (13) [58]:
Table 3 shows the variation of nonlinear refractive index with the content of Er2O3 content for the PVC/PVP polymer matrix. It is widely accepted that the increase in the nonlinear refractive index is due to increased interactions between the photons and metal oxide nanoparticles embedded in the blend matrix.
4. Conclusions
We have successfully prepared PVC/PVP/Er2O3 polymer nanocomposites for the first time using a low-cost solution casting method. Characterization techniques such as XRD, FTIR, Raman and FESEM confirmed a strong complexation between the polymer blend and the dispersed Er2O3 nanofillers. The TGA measurements carried out in this work showed that the addition of Er2O3 leads to changes in Ea, ΔG, ΔH and ΔS thermal kinetics of the polymer films. The addition of 0.1 wt% Er2O3 into the pure blend film causes a significant increase of Edir and Eind by 12.5 and 9.0 %, respectively. The values of dispersion energy and nonlinear refractive index increase as Er2O3 concentration increases to 0.1 and 0.3 wt%, thereafter decreasing when the content further increases to 0.6 wt%. We found that increasing the Er2O3 concentration to 0.1 and 0.3 wt% enhances the strength of optical transition between the polymer matrix and nanofillers. Our analysis concluded that the potential benefits of PVC/PVP/Er2O3 blend polymers can be realized with lower Er2O3 concentrations. To this end, PVC/PVP/Er2O3 polymer nanocomposites are expected to play a substantial role in optoelectronic space applications in the future.
Author Contributions
Conceptualization, T.A.M.T.; methodology, A.H.A. and M.A.; investigation, A.H.A. and K.A.; writing—original draft preparation, A.H.A., M.A., K.A. and T.A.M.T.; writing—review and editing, A.H.A. and M.I.; supervision, T.A.M.T.; funding acquisition, A.H.A. All authors have read and agreed to the published version of the manuscript.
Funding
This research was funded by the Deanship of Scientific Research at Jouf University under grant number DSR2022-RG-0121.
Institutional Review Board Statement
Not applicable.
Informed Consent Statement
Not applicable.
Data Availability Statement
Data are available on request from the corresponding author.
Acknowledgments
The authors are grateful to the Central laboratory at Jouf University for the XRD, SEM, FTIR and Raman measurements.
Conflicts of Interest
The authors declare no conflict of interests.
References
- Darwish, M.S.; Mostafa, M.H.; Al-Harbi, L.M. Polymeric Nanocomposites for Environmental and Industrial Applications. Int. J. Mol. Sci. 2022, 23, 1023. [Google Scholar] [CrossRef] [PubMed]
- Wen, F.; Zhu, C.; Li, L.; Zhou, B.; Zhang, L.; Han, C.; Zhang, S. Enhanced energy storage performance of polymer nanocomposites using hybrid 2D ZnO@ MoS2 semiconductive nano-fillers. Chem. Eng. J. 2022, 430, 132676. [Google Scholar] [CrossRef]
- Feng, Y.; Xue, J.P.; Zhang, T.D.; Chi, Q.G.; Li, J.L.; Chen, Q.G.; Chen, L.Q. Double-gradients design of polymer nanocomposites with high energy density. Energy Storage Mater. 2022, 44, 73–81. [Google Scholar] [CrossRef]
- Cheikh, D.; Majdoub, H.; Darder, M. An overview of clay-polymer nanocomposites containing bioactive compounds for food packaging applications. Appl. Clay Sci. 2022, 216, 106335. [Google Scholar] [CrossRef]
- Huang, J.; Zhou, J.; Liu, M. Interphase in polymer nanocomposites. JACS Au 2022, 2, 280–291. [Google Scholar] [CrossRef]
- Ming, Y.; Zhou, Z.; Hao, T.; Nie, Y. Polymer Nanocomposites: Role of modified filler content and interfacial interaction on crystallization. Eur. Polym. J. 2022, 162, 110894. [Google Scholar] [CrossRef]
- Ishizuka, F.; Kim, H.J.; Kuchel, R.P.; Yao, Y.; Chatani, S.; Niino, H.; Zetterlund, P.B. Nano-dimensional spheres and worms as fillers in polymer nanocomposites: Effect of filler morphology. Polym. Chem. 2022, 13, 1818–1823. [Google Scholar] [CrossRef]
- Sellami, F.; Kebiche-Senhadji, O.; Marais, S.; Fatyeyeva, K. PVC/EVA-based polymer inclusion membranes with improved stability and Cr (VI) extraction capacity: Water plasticization effect. J. Hazard. Mater. 2022, 436, 129069. [Google Scholar] [CrossRef]
- Ahmad, T.; Guria, C. Progress in the modification of polyvinyl chloride (PVC) membranes: A performance review for wastewater treatment. J. Water Process Eng. 2022, 45, 102466. [Google Scholar] [CrossRef]
- Ebnalwaled, A.A.; Thabet, A. Controlling the optical constants of PVC nanocomposite films for optoelectronic applications. Synth. Met. 2016, 220, 374–383. [Google Scholar] [CrossRef]
- Zheng, S.; Guo, Q.; Mi, Y. Characterization of Blends of Poly(vinyl chloride) and Poly(N-vinyl pyrrolidone) by FTIR and 13C CP/MAS NMR Spectroscopy. J. Polym. Sci. Part B Polym. Phys. 1999, 37, 2412–2419. [Google Scholar] [CrossRef]
- Dong, J.; Fredericks, P.M.; George, G.A. Studies of the structure and thermal degradation of poly(vinyl chloride)—Poly (N-vinyl-2-pyrrolidone) blends by using Raman and FTIR emission spectroscopy. Polym. Degrad. Stab. 1997, 58, 159–169. [Google Scholar] [CrossRef]
- Bhavsar, V.; Tripathi, D. Structural, optical, and aging studies of biocompatible PVC-PVP blend films. J. Polym. Eng. 2018, 38, 419–426. [Google Scholar] [CrossRef]
- Alshammari, A.H.; Taha, T.A. Structure, thermal and dielectric insights of PVC/PVP/ZnFe2O4 polymer nanocomposites. Eur. Phys. J. Plus 2021, 136, 1–13. [Google Scholar] [CrossRef]
- Alshammari, A.H.; Alshammari, M.; Alshammari, K.; Allam, N.K.; Taha, T.A. PVC/PVP/SrTiO3 polymer blend nanocomposites as potential materials for optoelectronic applications. Results Phys. 2022, 13, 106173. [Google Scholar] [CrossRef]
- Xu, K.; Dang, V.S.; Ney, A.; Arcos, T.D.; Devi, A. Nanostructured Er2O3 thin films grown by metalorganic chemical vapour deposition. J. Nanosci. Nanotechnol. 2014, 14, 5095–5102. [Google Scholar] [CrossRef] [PubMed]
- Ajroud, M.; Haouari, M.; Ben Ouada, H.; Mâaref, H.; Brenier, A.; Champagnon, B. Study of the spectroscopic properties and infrared-to-visible up-conversion fluorescence of Er3+-doped germanate glasses. Phys. Status Solidi A 2005, 202, 316–329. [Google Scholar] [CrossRef]
- Isshiki, H.; Ushiyama, T.; Kimura, T. Demonstration of ErSiO superlattice crystal waveguide toward optical amplifiers and emitters. Phys. Status Solidi A 2008, 205, 52–55. [Google Scholar] [CrossRef]
- Chandra, S.; Gruber, J.B.; Burdick, G.W.; Sardar, D.K. Fabrication and Absorption Intensity Analyses of Er2O3 Nanoparticles Suspended in Polymethyl Methacrylate. J. Appl. Polym. Sci. 2011, 122, 289–295. [Google Scholar] [CrossRef]
- El Askary, A.; El-Sharnouby, M.; Awwad, N.S.; Ibrahium, H.A.; El-Morsy, M.A.; Farea, M.O.; Menazea, A.A. Optical, thermal, and electrical conductivity strength of ternary CMC/PVA/Er2O3 NPs nanocomposite fabricated via pulsed laser ablation. Phys. B Condens. Matter 2022, 637, 413910. [Google Scholar] [CrossRef]
- Taha, T.A.; Mahmoud, M.H. Synthesis and characterization of PVDF-Er2O3 polymer nanocomposites for energy storage applications. Mater. Chem. Phys. 2021, 270, 124827. [Google Scholar] [CrossRef]
- Taha, T.A.; El-Molla, M.M. Green simple preparation of LiNiO2 nanopowder for lithium ion battery. J. Mater. Res. Technol. 2020, 9, 7955–7960. [Google Scholar] [CrossRef]
- Alrowaili, Z.A.; Taha, T.A.; El-Nasser, K.S.; Donya, H. Significant enhanced optical parameters of PVA-Y2O3 polymer nanocomposite films. J. Inorg. Organomet. Polym. Mater. 2021, 31, 3101–3110. [Google Scholar] [CrossRef]
- Mahmoud, M.H.; Taha, T.A. FTIR and Mössbauer spectroscopy investigations of Ag/FexAl2−xO3 nanocomposites. J. Electron. Mater. 2019, 48, 7396–7403. [Google Scholar] [CrossRef]
- Sanad, M.M.; Azab, A.A.; Taha, T.A. Introduced oxygen vacancies in cadmium ferrite anode materials via Zn2+ incorporation for high performance lithium-ion batteries. Mater. Sci. Semicond. Process. 2022, 143, 106567. [Google Scholar] [CrossRef]
- Abbasian, A.R.; Shafiee, A.M. One-step solution combustion synthesis and characterization of ZnFe2O4 and ZnFe1.6O4 nanoparticles. Appl. Phys. A 2019, 125, 1–12. [Google Scholar] [CrossRef]
- Bhran, A.; Shoaib, A.; Elsadeq, D.; El-gendi, A.; Abdallah, H. Preparation of PVC/PVP composite polymer membranes via phase inversion process for water treatment purposes. Chin. J. Chem. Eng. 2018, 26, 715–722. [Google Scholar] [CrossRef]
- Rani, P.; Ahamed, M.B.; Deshmukh, K. Significantly enhanced electromagnetic interference shielding effectiveness of montmorillonite nanoclay and copper oxide nanoparticles based polyvinylchloride nanocomposites. Polym. Test. 2020, 91, 106744. [Google Scholar] [CrossRef]
- Xiao, F.; Xu, J.; Cao, L.; Jiang, S.; Zhang, Q.; Wang, L. In situ hydrothermal fabrication of visible light-driven g-C3N4/SrTiO3 composite for photocatalytic degradation of TC. Environ. Sci. Pollut. Res. 2020, 27, 5788–5796. [Google Scholar] [CrossRef]
- Solodovnichenko, V.S.; Polyboyarov, V.A.; Zhdanok, A.A.; Arbuzov, A.B.; Zapevalova, E.S.; Kryazhev, Y.G.; Likholobov, V.A. Synthesis of carbon materials by the short-term mechanochemical activation of polyvinyl chloride. Procedia Eng. 2016, 152, 747–752. [Google Scholar] [CrossRef]
- Coats, A.W.; Redfern, J.P. Kinetic parameters from thermogravimetric data. Nature 1964, 201, 68–69. [Google Scholar] [CrossRef]
- Al Mahmood, A.; Hossain, R.; Sahajwalla, V. Investigation of the effect of laminated polymers in the metallic packaging materials on the recycling of aluminum by thermal disengagement technology (TDT). J. Clean. Prod. 2020, 274, 122541. [Google Scholar] [CrossRef]
- Sharmila, T.B.; Ayswarya, E.P.; Abraham, B.T.; Begum, P.S.; Thachil, E.T. Fabrication of partially exfoliated and disordered intercalated cloisite epoxy nanocomposites via in situ polymerization: Mechanical, dynamic mechanical, thermal and barrier properties. Appl. Clay Sci. 2014, 102, 220–230. [Google Scholar] [CrossRef]
- Li, L.; Ma, Y.; Wang, W.; Xu, Y.; You, J.; Zhang, Y. A thermal and electrochemical properties research on gel polymer electrolyte membrane of lithium ion battery. J. Phys. Chem. Solids 2016, 99, 159–166. [Google Scholar] [CrossRef]
- Haque, M.A.; Paliwal, L.J. Synthesis, spectral characterization and thermal aspects of coordination polymers of some transition metal ions with adipoyl bis (isonicotinoylhydrazone). J. Mol. Struct. 2017, 1134, 278–291. [Google Scholar] [CrossRef]
- Sankhla, A.; Sharma, R.; Yadav, R.S.; Kashyap, D.; Kothari, S.L.; Kachhwaha, S. Biosynthesis and characterization of cadmium sulfide nanoparticles—An emphasis of zeta potential behavior due to capping. Mater. Chem. Phys. 2016, 170, 44–51. [Google Scholar] [CrossRef]
- Bhajantri, R.F.; Ravindrachary, V.; Harisha, A. Microstructural studies on BaCl2 doped poly(vinyl alcohol). Polymer 2006, 47, 3591–3598. [Google Scholar] [CrossRef]
- Heiba, Z.K.; Mohamed, M.B.; Imam, N.G. Fine-tune optical absorption and light emitting behavior of the CdS/PVA hybridized film nanocomposite. J. Mol. Struct. 2017, 1136, 321–329. [Google Scholar] [CrossRef]
- Heiba, Z.K.; Mohamed, M.B.; Ahmed, S.I. Exploring the physical properties of PVA/PEG polymeric material upon doping with nano gadolinium oxide. Alex. Eng. J. 2022, 61, 3375–3383. [Google Scholar] [CrossRef]
- Mahmoud, W.E.; Al-Ghamdi, A.A.; Al-Agel, F. Synthesis and optical properties of poly (vinyl acetate)/bismuth oxide nanorods. Polym. Adv. Technol. 2011, 22, 2055–2061. [Google Scholar] [CrossRef]
- Mahmoud, W.E.; Shirbeeny, W.; Al-Ghamdi, A.A.; Al-Heniti, S. Synthesis and characterization of CdxZn1−xO nanoparticles-doped aryl poly ether ether ketone for novel application potentials. J. Appl. Polym. Sci. 2012, 125, 339–343. [Google Scholar] [CrossRef]
- Keshtov, M.L.; Konstantinov, I.O.; Khokhlov, A.R.; Kuklin, S.A.; Alekseev, V.G.; Ostapov, I.E.; Sharma, G.D. New wide band gap π-conjugated copolymers based on anthra [1, 2-b: 4, 3-b′: 6, 7-c″] trithiophene-8, 12-dione for high performance non-fullerene polymer solar cells with an efficiency of 15.07%. Polymer 2022, 251, 124892. [Google Scholar] [CrossRef]
- El-Naggar, A.M.; Heiba, Z.K.; Mohamed, M.B.; Kamal, A.M.; Osman, M.M.; Albassam, A.A.; Lakshminarayana, G. Improvement of the optical characteristics of PVA/PVP blend with different concentrations of SnS2/Fe. J. Vinyl Addit. Technol. 2022, 28, 82–93. [Google Scholar] [CrossRef]
- Oubaha, M.; Elmaghrum, S.; Copperwhite, R.; Corcoran, B.; McDonagh, C.; Gorin, A. Optical properties of high refractive index thin films processed at low-temperature. Opt. Mater. 2012, 34, 1366–1370. [Google Scholar] [CrossRef]
- Flaim, T.D.; Wang, Y.; Mercado, R. High-refractive-index polymer coatings for optoelectronics applications. In Advances in Optical Thin Films; SPIE: Washington, DC, USA, 2004; Volume 5250, pp. 423–434. [Google Scholar]
- Taha, T.A. Optical properties of PVC/Al2O3 nanocomposite films. Polym. Bull. 2019, 76, 903–918. [Google Scholar] [CrossRef]
- Paladino, D.; Iadicicco, A.; Campopiano, S.; Cusano, A. Not-lithographic fabrication of micro-structured fiber Bragg gratings evanescent wave sensors. Opt. Express 2009, 17, 1042–1054. [Google Scholar] [CrossRef]
- Leguijt, C.; Lölgen, P.; Eikelboom, J.A.; Weeber, A.W.; Schuurmans, F.M.; Sinke, W.C.; Verhoef, L.A. Low temperature surface passivation for silicon solar cells. Sol. Energy Mater. Sol. Cells 1996, 40, 297–345. [Google Scholar] [CrossRef]
- Sakr, G.B.; Yahia, I.S.; Fadel, M.; Fouad, S.S.; Romčević, N. Opticalspectroscopy, optical conductivity, dielectric properties and new methods for determining the gap states of CuSe thin films. J. Alloys Compd. 2010, 507, 557–562. [Google Scholar] [CrossRef]
- Aly, K.A. Optical band gap and refractive index dispersion parameters of AsxSe70Te30−x (0 ≤ x ≤ 30 at.%) amorphous films. Appl. Phys. A 2010, 99, 913–919. [Google Scholar] [CrossRef]
- Yaqub, N.; Farooq, W.A.; AlSalhi, M.S. Delving into the properties of polymer nanocomposites with distinctive nano-particle quantities, for the enhancement of optoelectronic devices. Heliyon 2020, 6, e05597. [Google Scholar] [CrossRef]
- Abdel-Baset, T.; Elzayat, M.; Mahrous, S. Characterization and optical and dielectric properties of polyvinyl chloride/silica nanocomposites films. Int. J. Polym. Sci. 2016, 2016, 1707018. [Google Scholar] [CrossRef]
- Taha, T.A.; Hendawy, N.; El-Rabaie, S.; Esmat, A.; El-Mansy, M.K. Effect of NiO NPs doping on the structure and optical properties of PVC polymer films. Polym. Bull. 2016, 76, 4769–4784. [Google Scholar] [CrossRef]
- Soliman, T.S.; Zaki, M.F.; Hessien, M.M.; Elkalashy, S.I. The structure and optical properties of PVA-BaTiO3 nanocomposite films. Opt. Mater. 2021, 111, 110648. [Google Scholar] [CrossRef]
- Aziz, S.B.; Rasheed, M.A.; Hussein, A.M.; Ahmed, H.M. Fabrication of polymer blend composites based on [PVA-PVP](1 − x):(Ag2S) × (0.01 ≤ x ≤ 0.03) with small optical band gaps: Structural and optical properties. Mater. Sci. Semicond. Process. 2017, 71, 197–203. [Google Scholar] [CrossRef]
- Yakuphanoglu, F.; Cukurovali, A.; Yilmaz, I. Determination and analysis of the dispersive optical constants of some organic thin films. Phys. B Condens. Matter 2004, 351, 53–58. [Google Scholar] [CrossRef]
- Mondal, R.; Biswas, D.; Paul, S.; Das, A.S.; Chakrabarti, C.; Roy, D.; Kabi, S. Investigation of microstructural, optical, physical properties and dielectric relaxation process of sulphur incorporated selenium–tellurium ternary glassy systems. Mater. Chem. Phys. 2021, 257, 123793. [Google Scholar] [CrossRef]
- Dhatarwal, P.; Sengwa, R.J. Investigation on the optical properties of (PVP/PVA)/Al2O3 nanocomposite films for green disposable optoelectronics. Phys. B Condens. Matter 2021, 613, 412989. [Google Scholar] [CrossRef]
Disclaimer/Publisher’s Note: The statements, opinions and data contained in all publications are solely those of the individual author(s) and contributor(s) and not of MDPI and/or the editor(s). MDPI and/or the editor(s) disclaim responsibility for any injury to people or property resulting from any ideas, methods, instructions or products referred to in the content. |
© 2023 by the authors. Licensee MDPI, Basel, Switzerland. This article is an open access article distributed under the terms and conditions of the Creative Commons Attribution (CC BY) license (https://creativecommons.org/licenses/by/4.0/).