
Mechanical and Tribological Performances of Thermoplastic Polymers Reinforced with Glass Fibres at Variable Fibre Volume Fractions
 , and
, and
Abstract
:
1. Introduction
2. Material and Methods
2.1. Raw Materials
2.2. Preparation
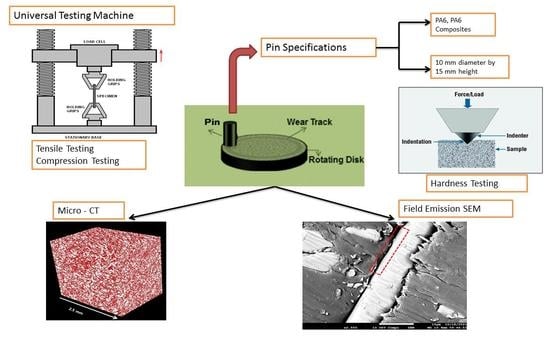
2.3. Mechanical Testing
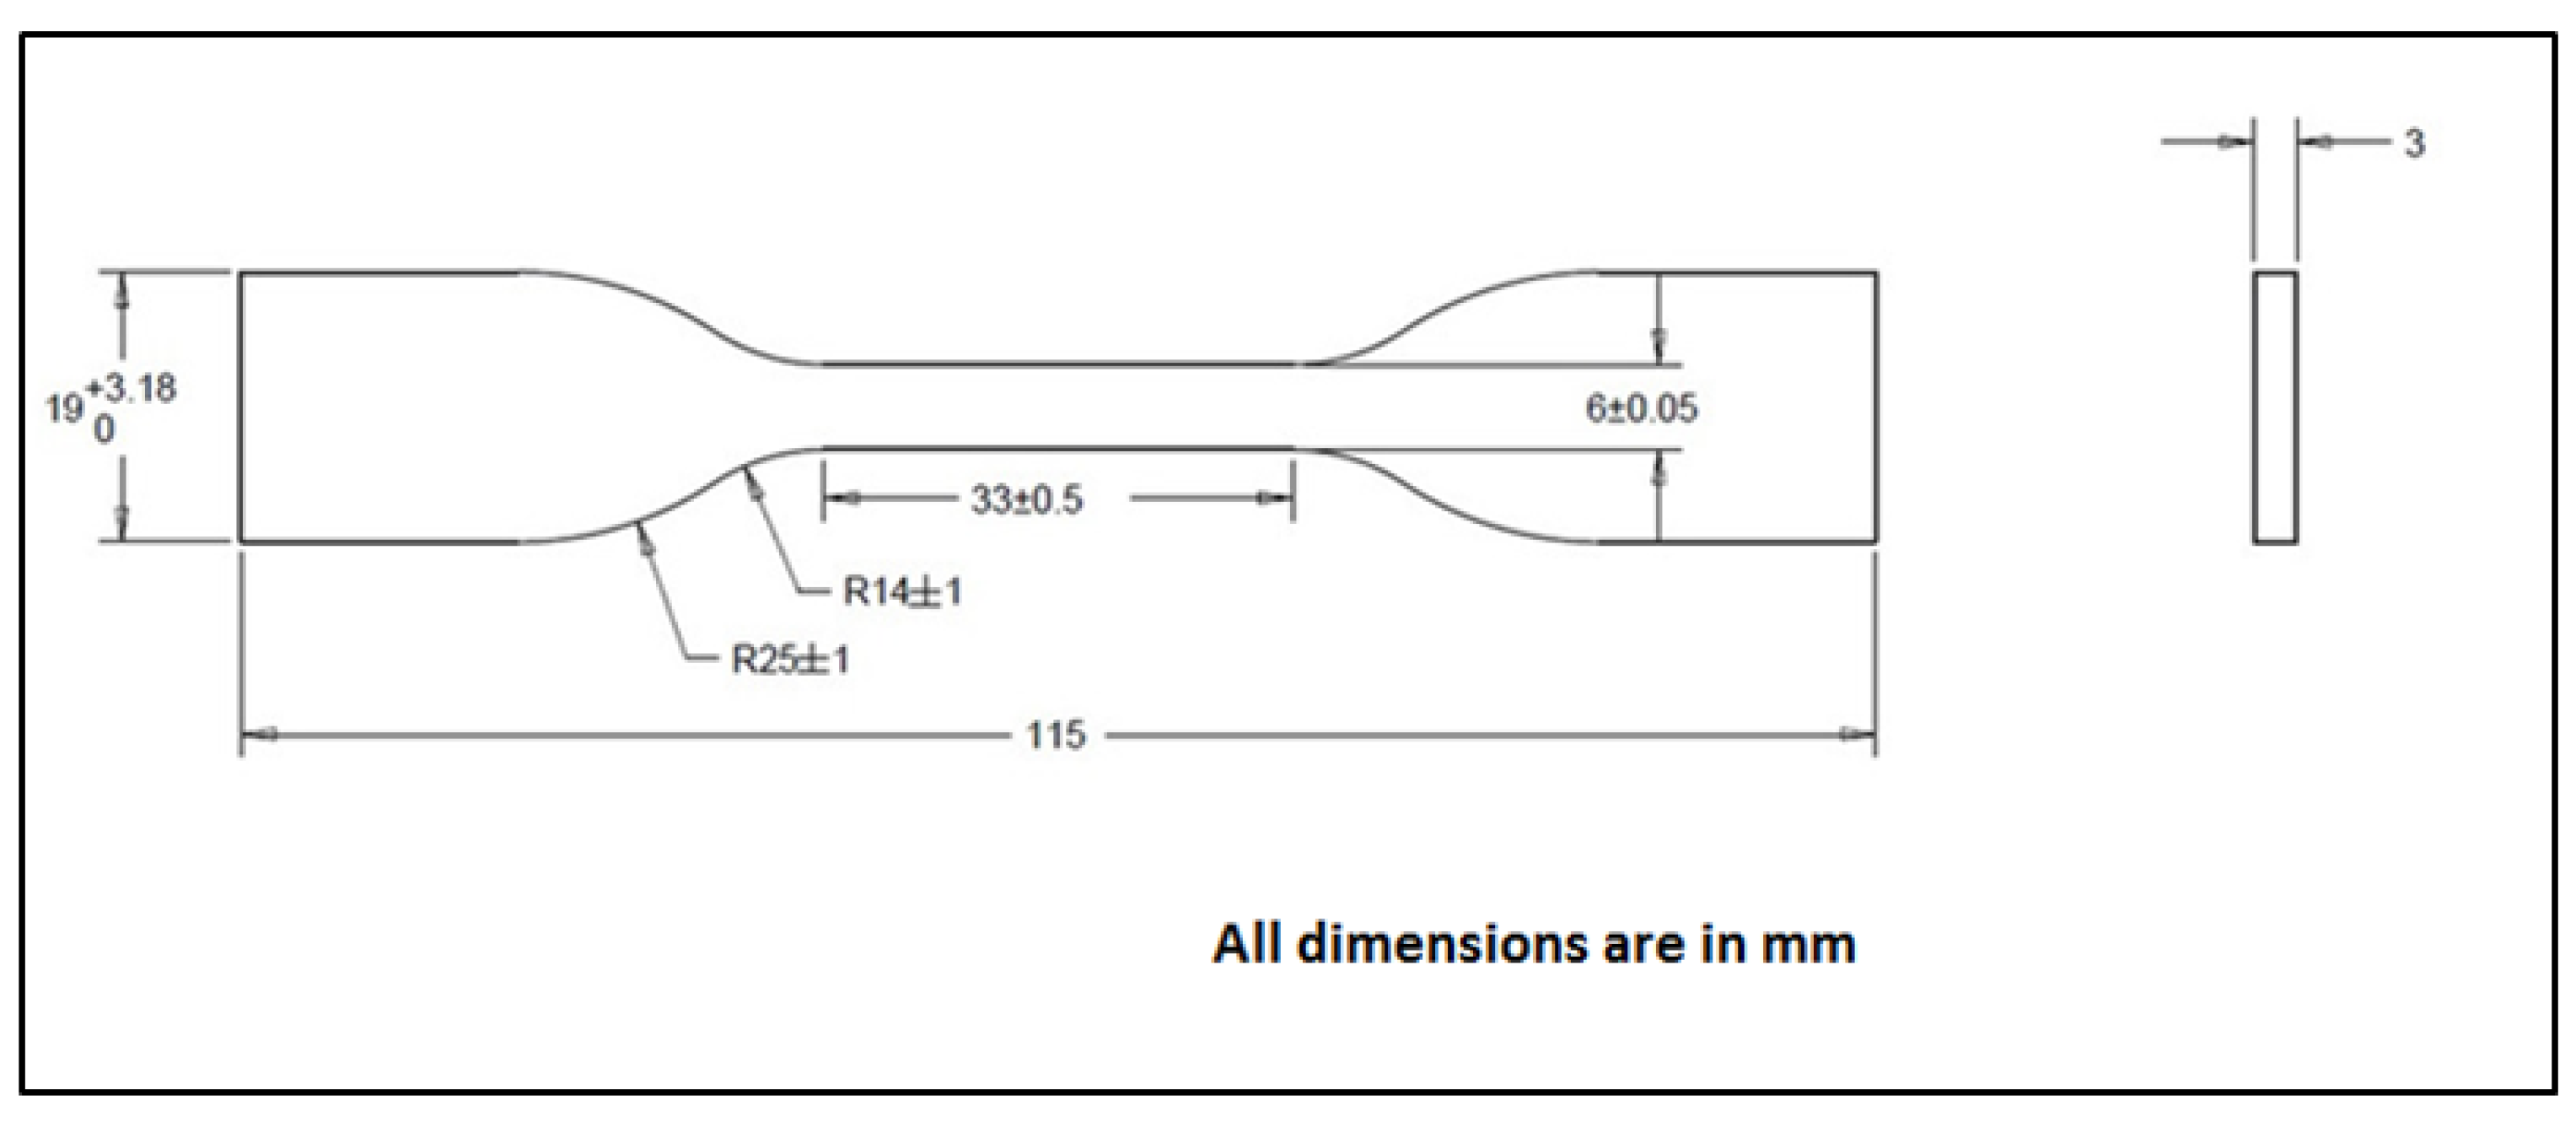
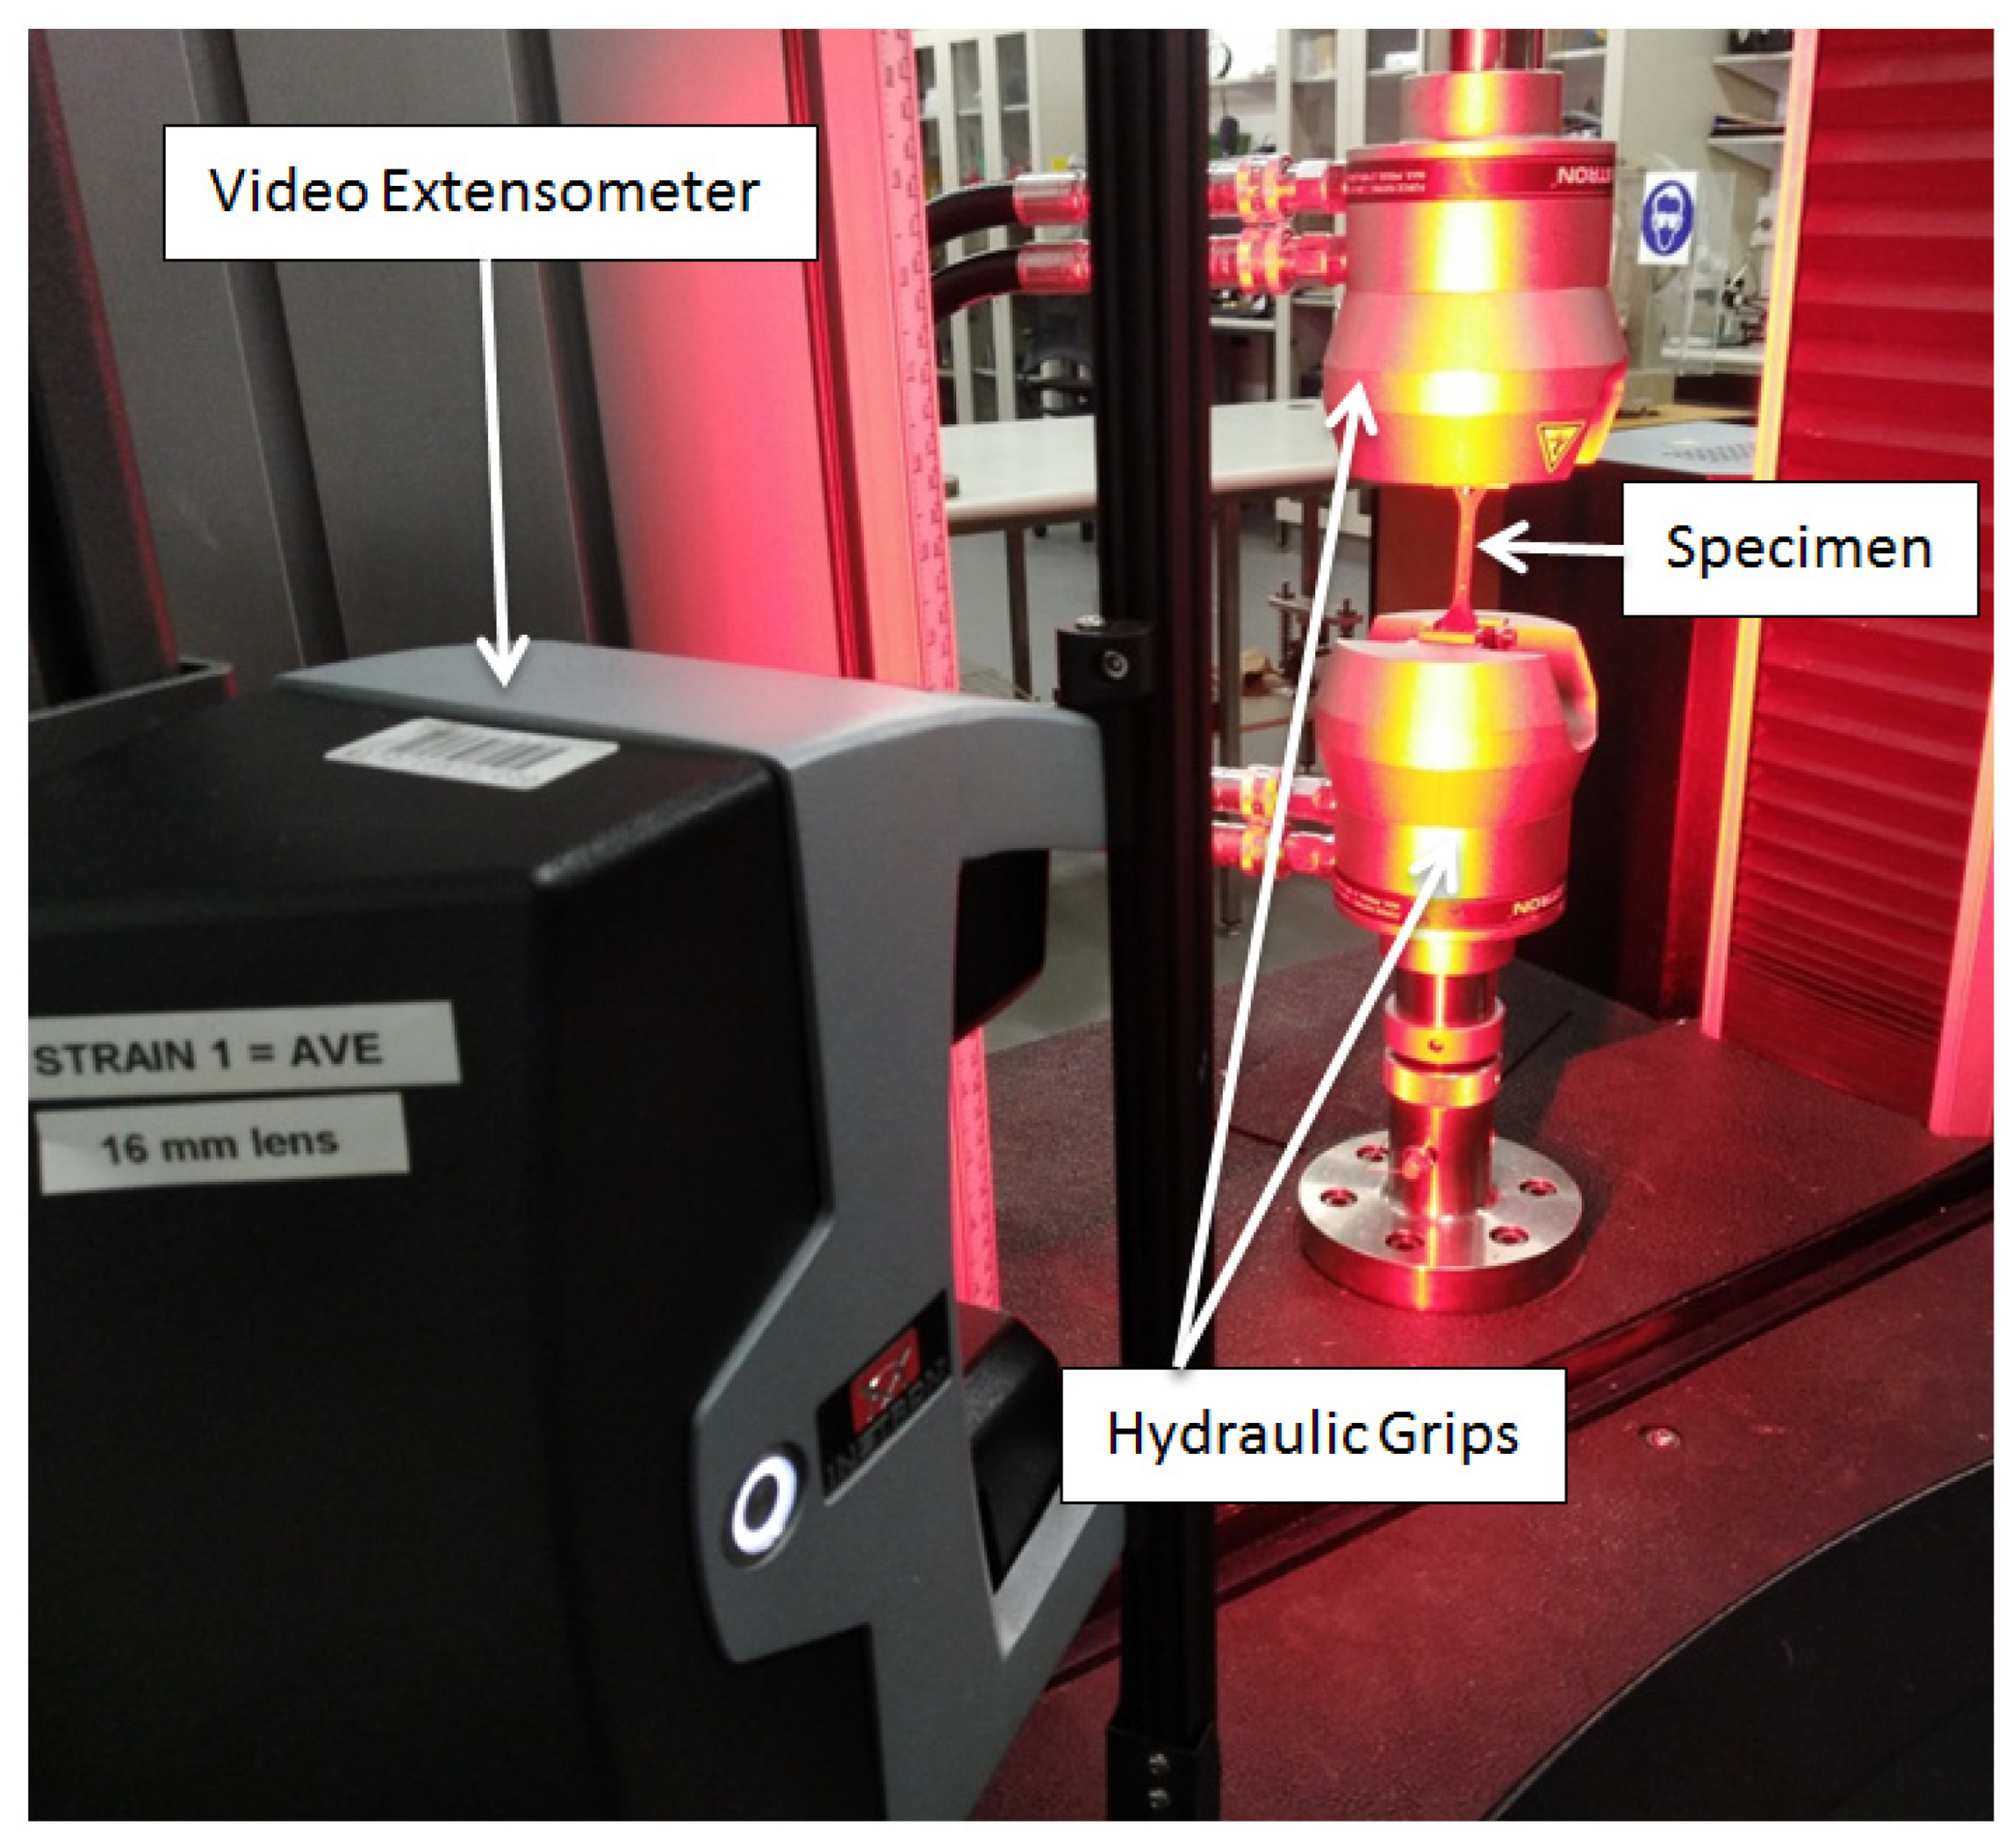
2.3.1. Tensile Testing
2.3.2. Compression Testing
2.3.3. Hardness Testing
2.4. Wear Testing
2.5. X-ray Diffraction Analysis
2.6. Micro-CT Analysis
2.7. Morphological Analysis
3. Results and Discussion
3.1. Tensile Behaviour of Materials
3.2. Compressive Behaviour of Materials
3.3. Hardness Behaviour of Materials
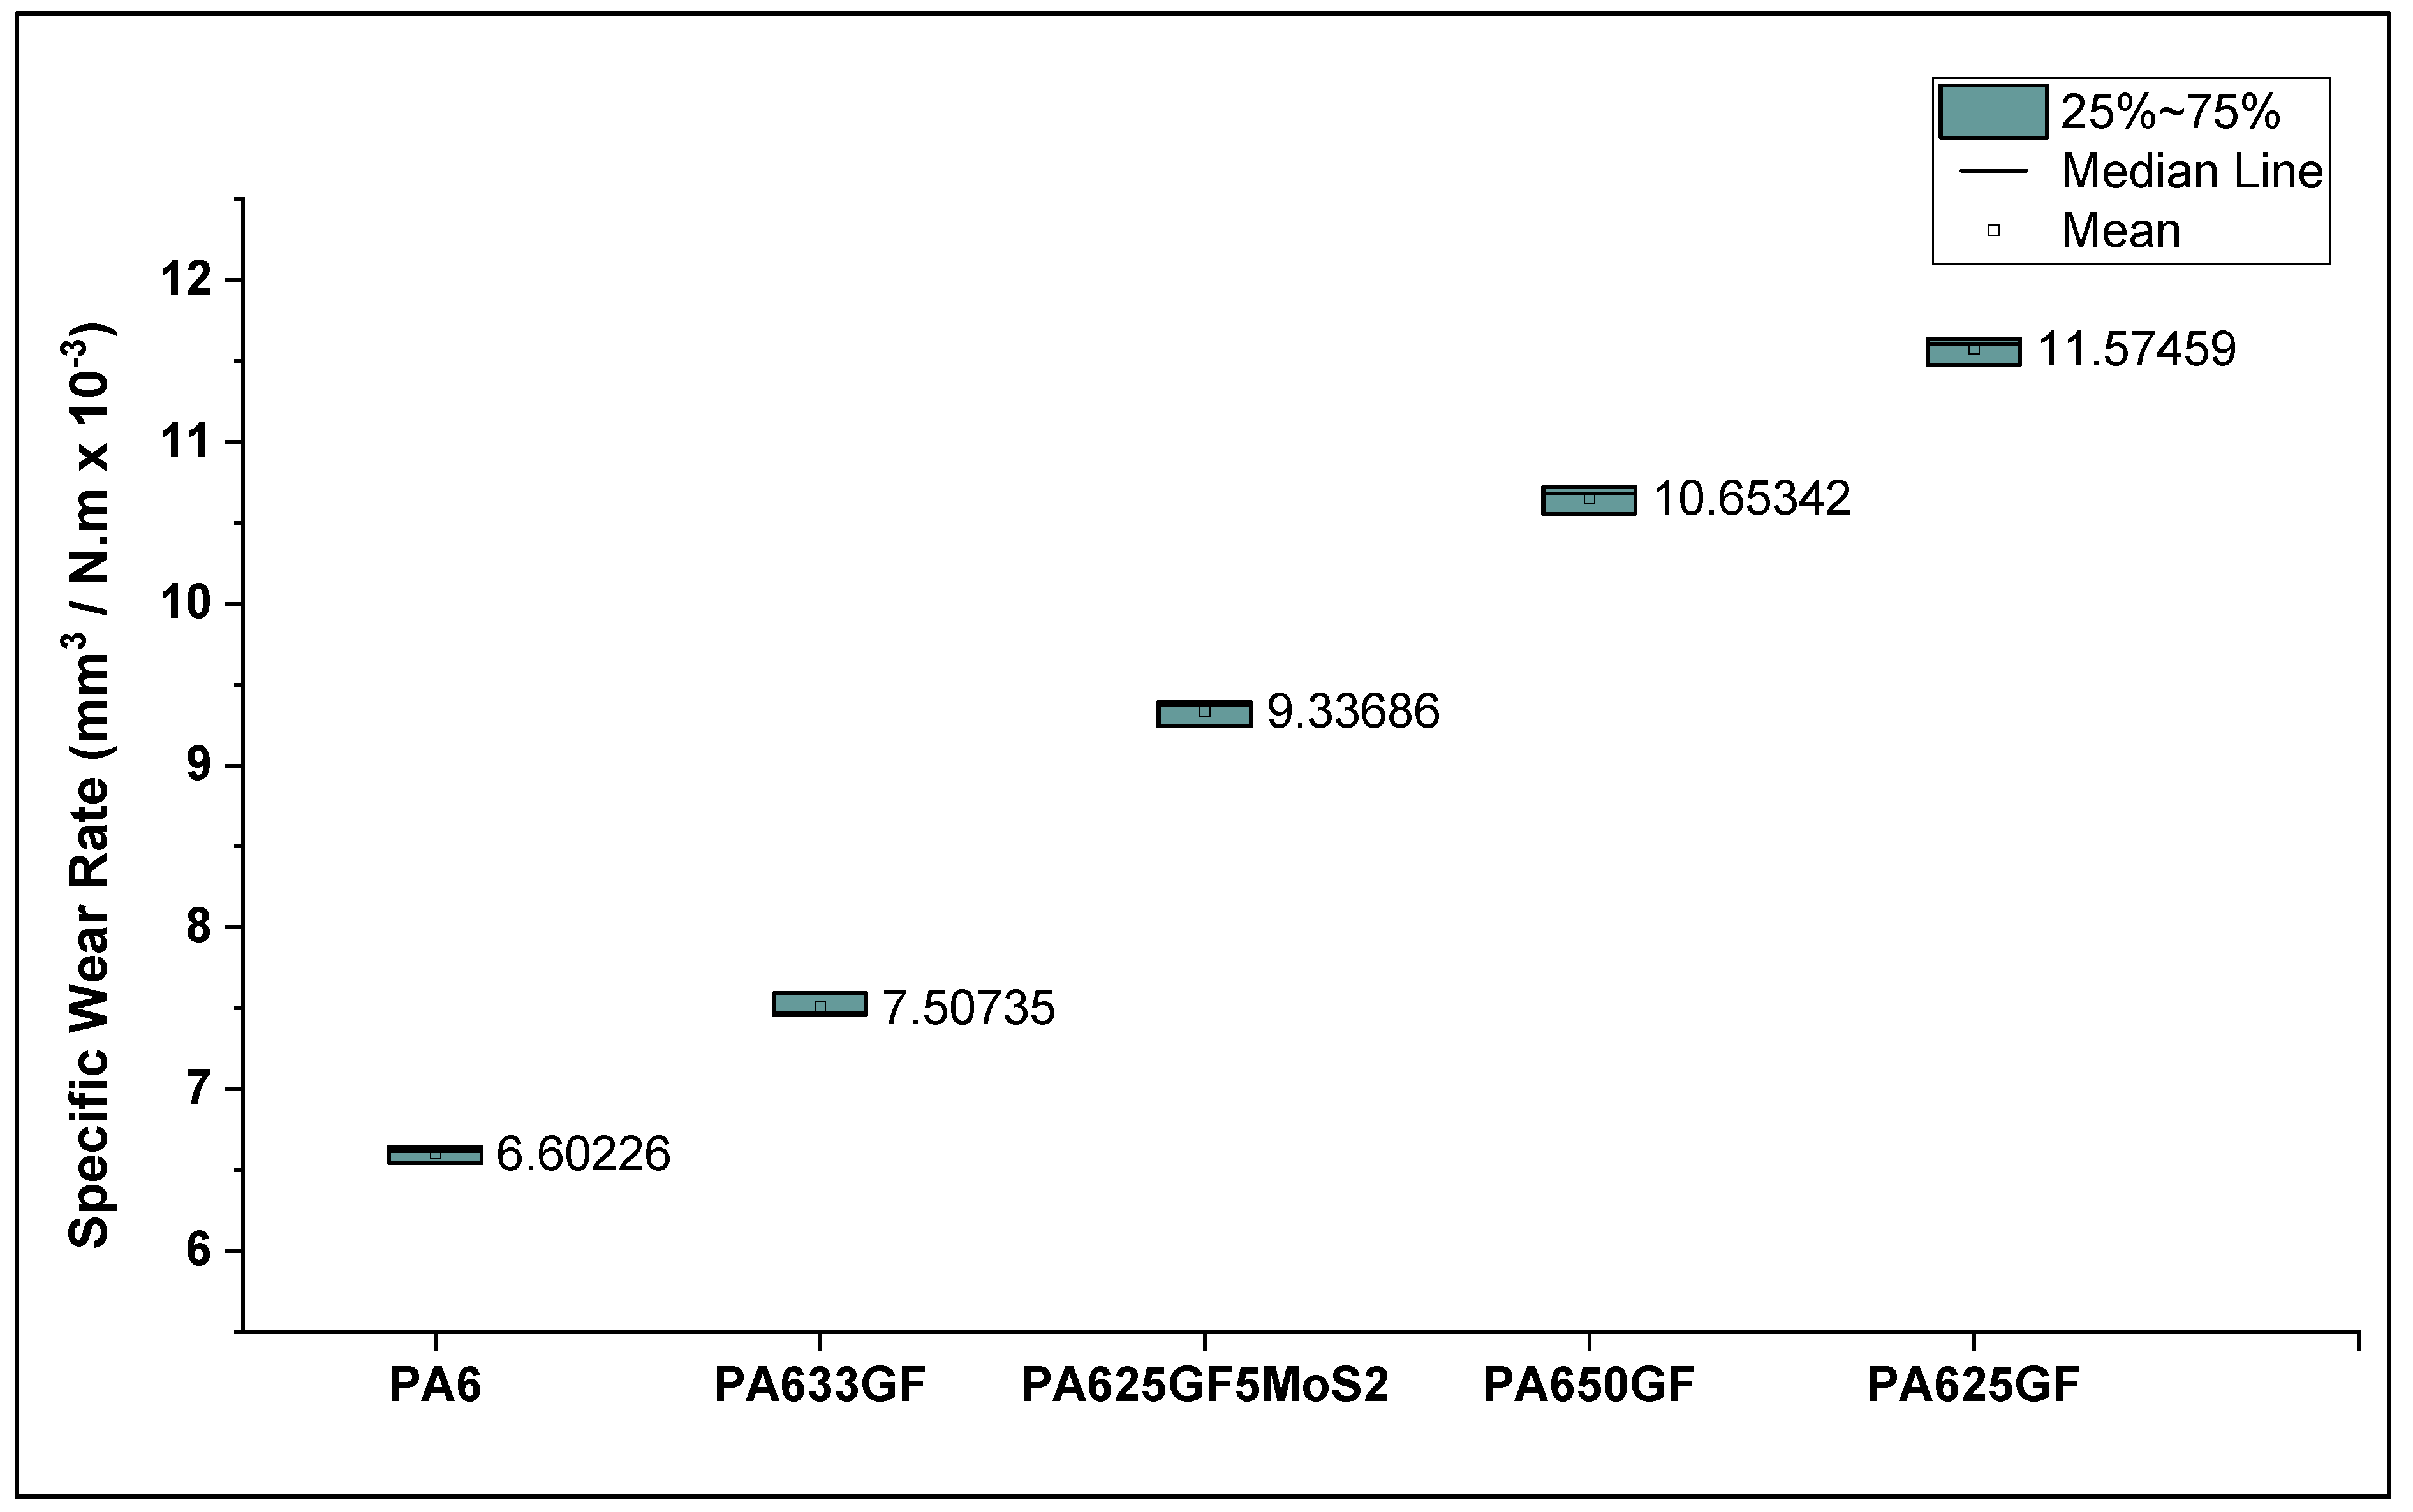
3.4. Wear Behaviour of Materials
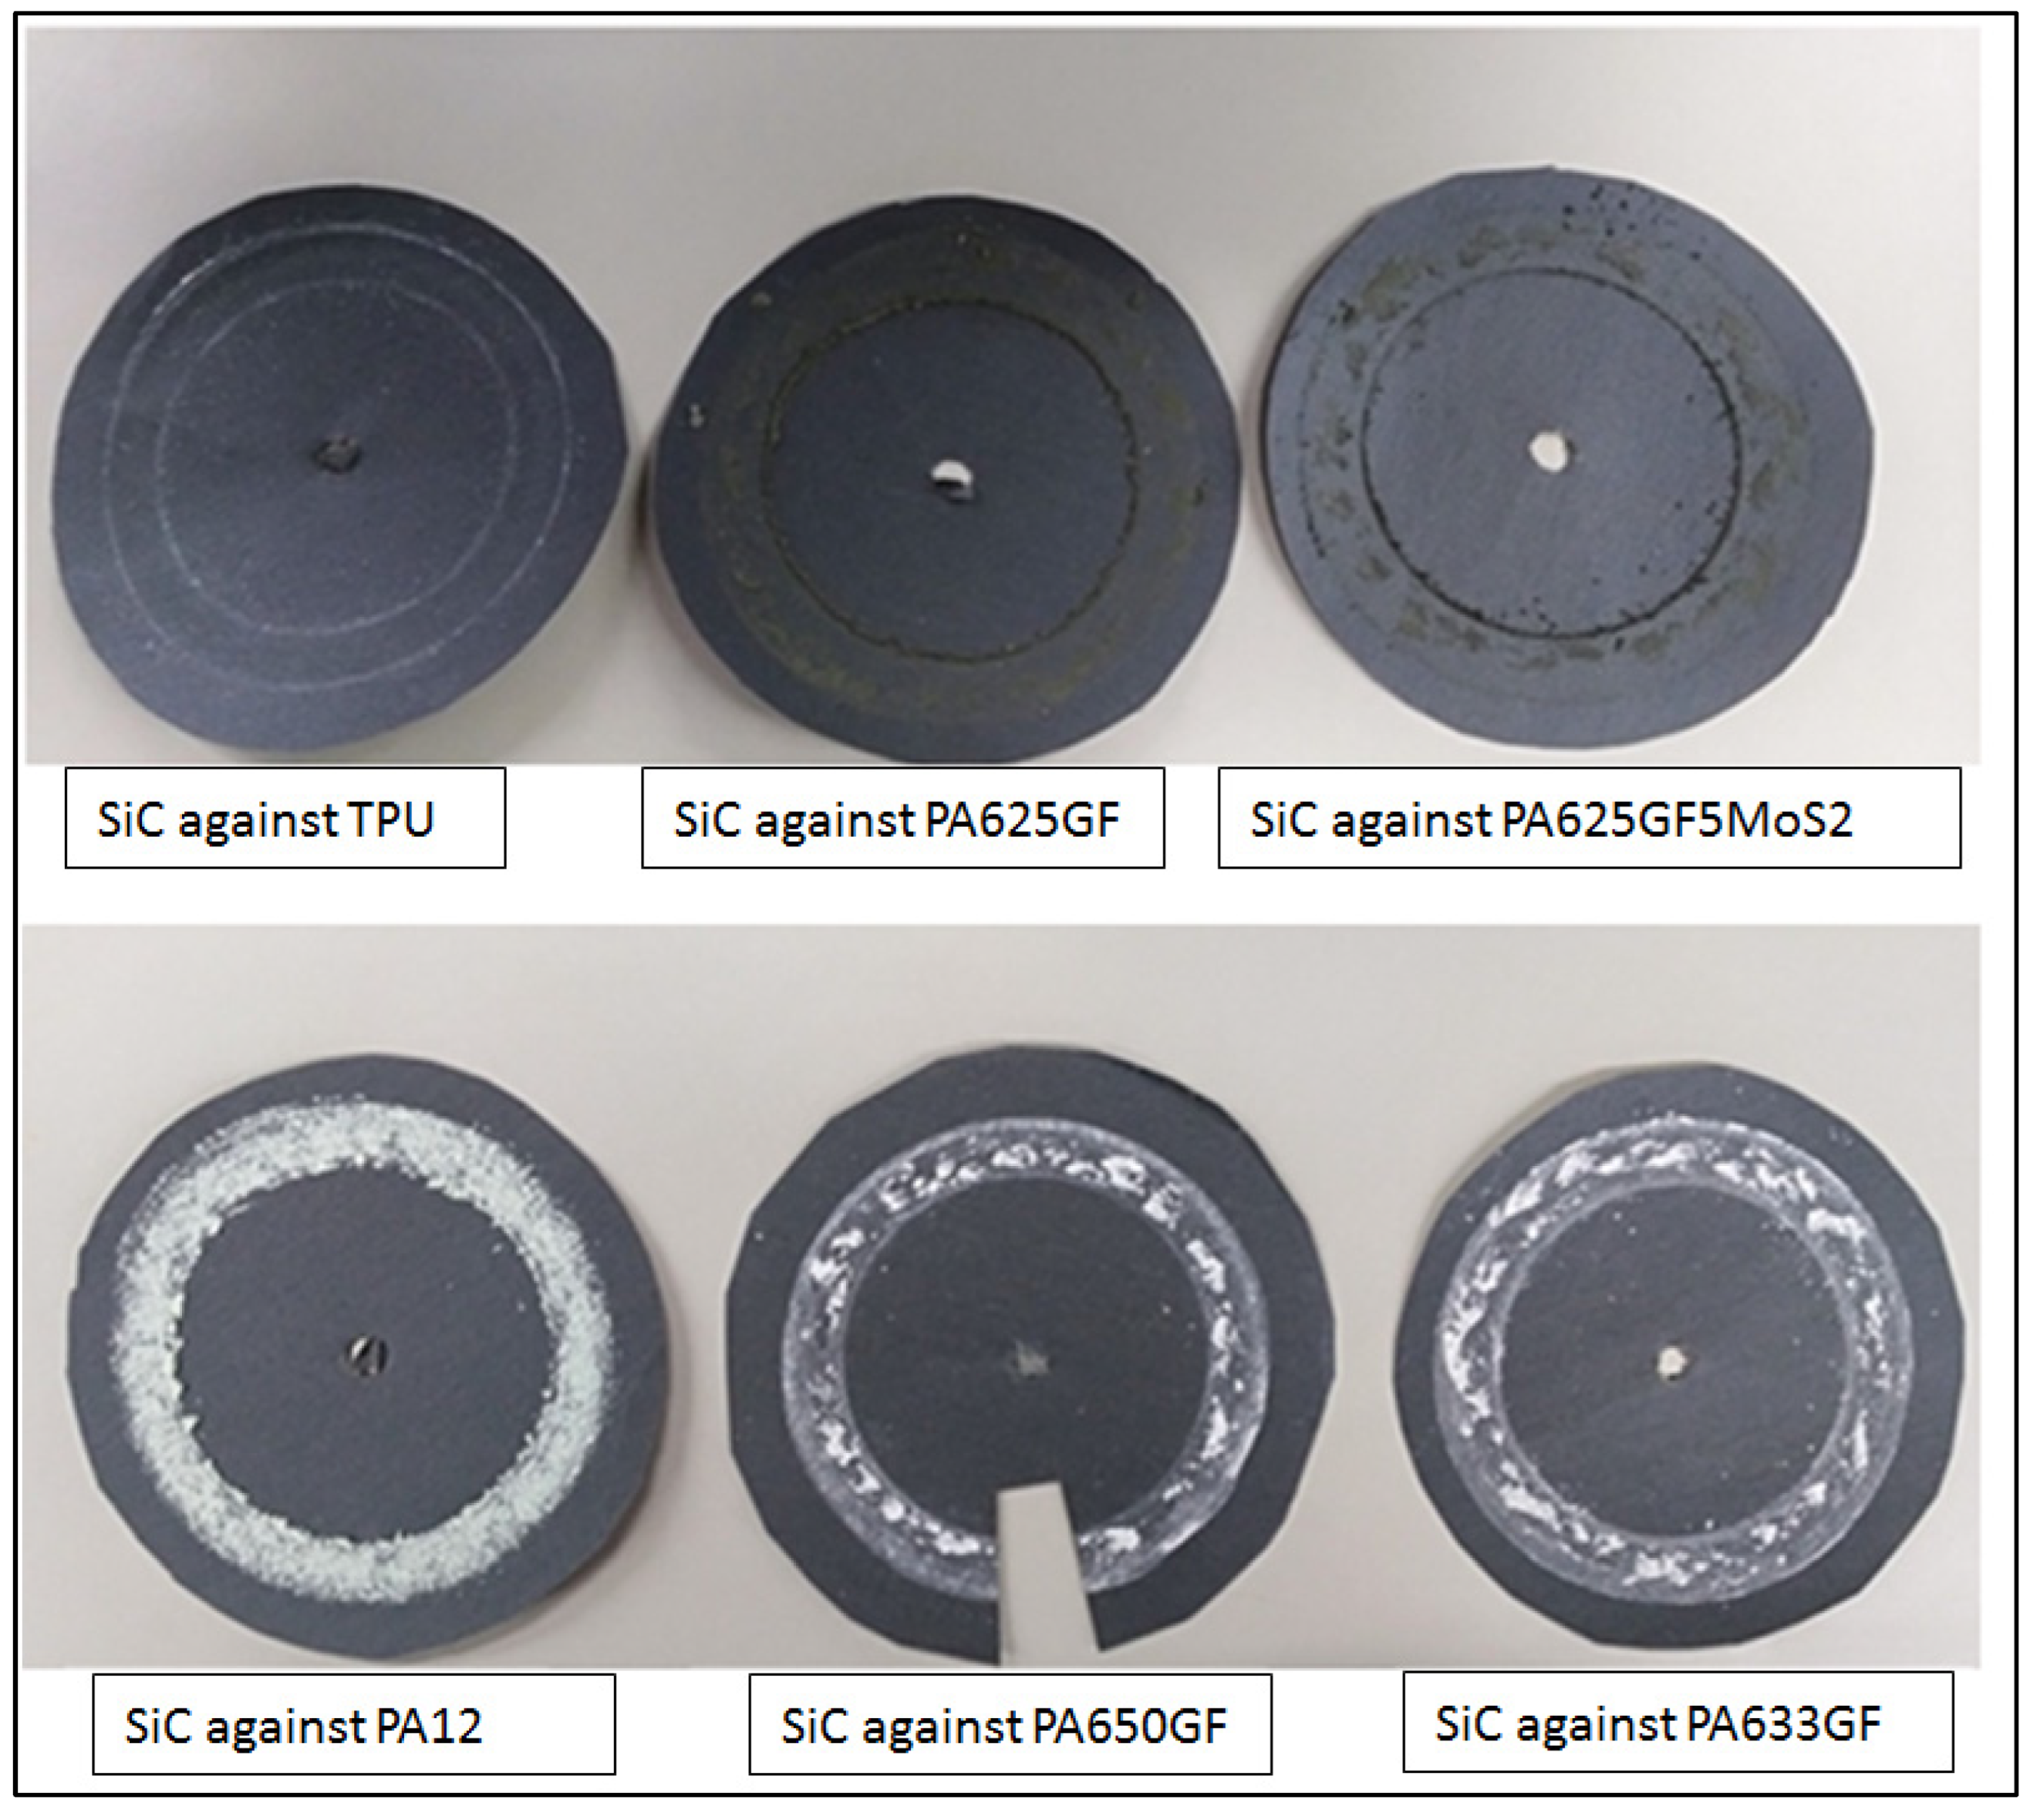
3.4.1. Wear of Polymers against SiC Counter-Face
3.4.2. Wear of Polymeric Composite Materials against SiC Counter-Face
3.5. XRD Analysis of PA6 and PA6 Composites
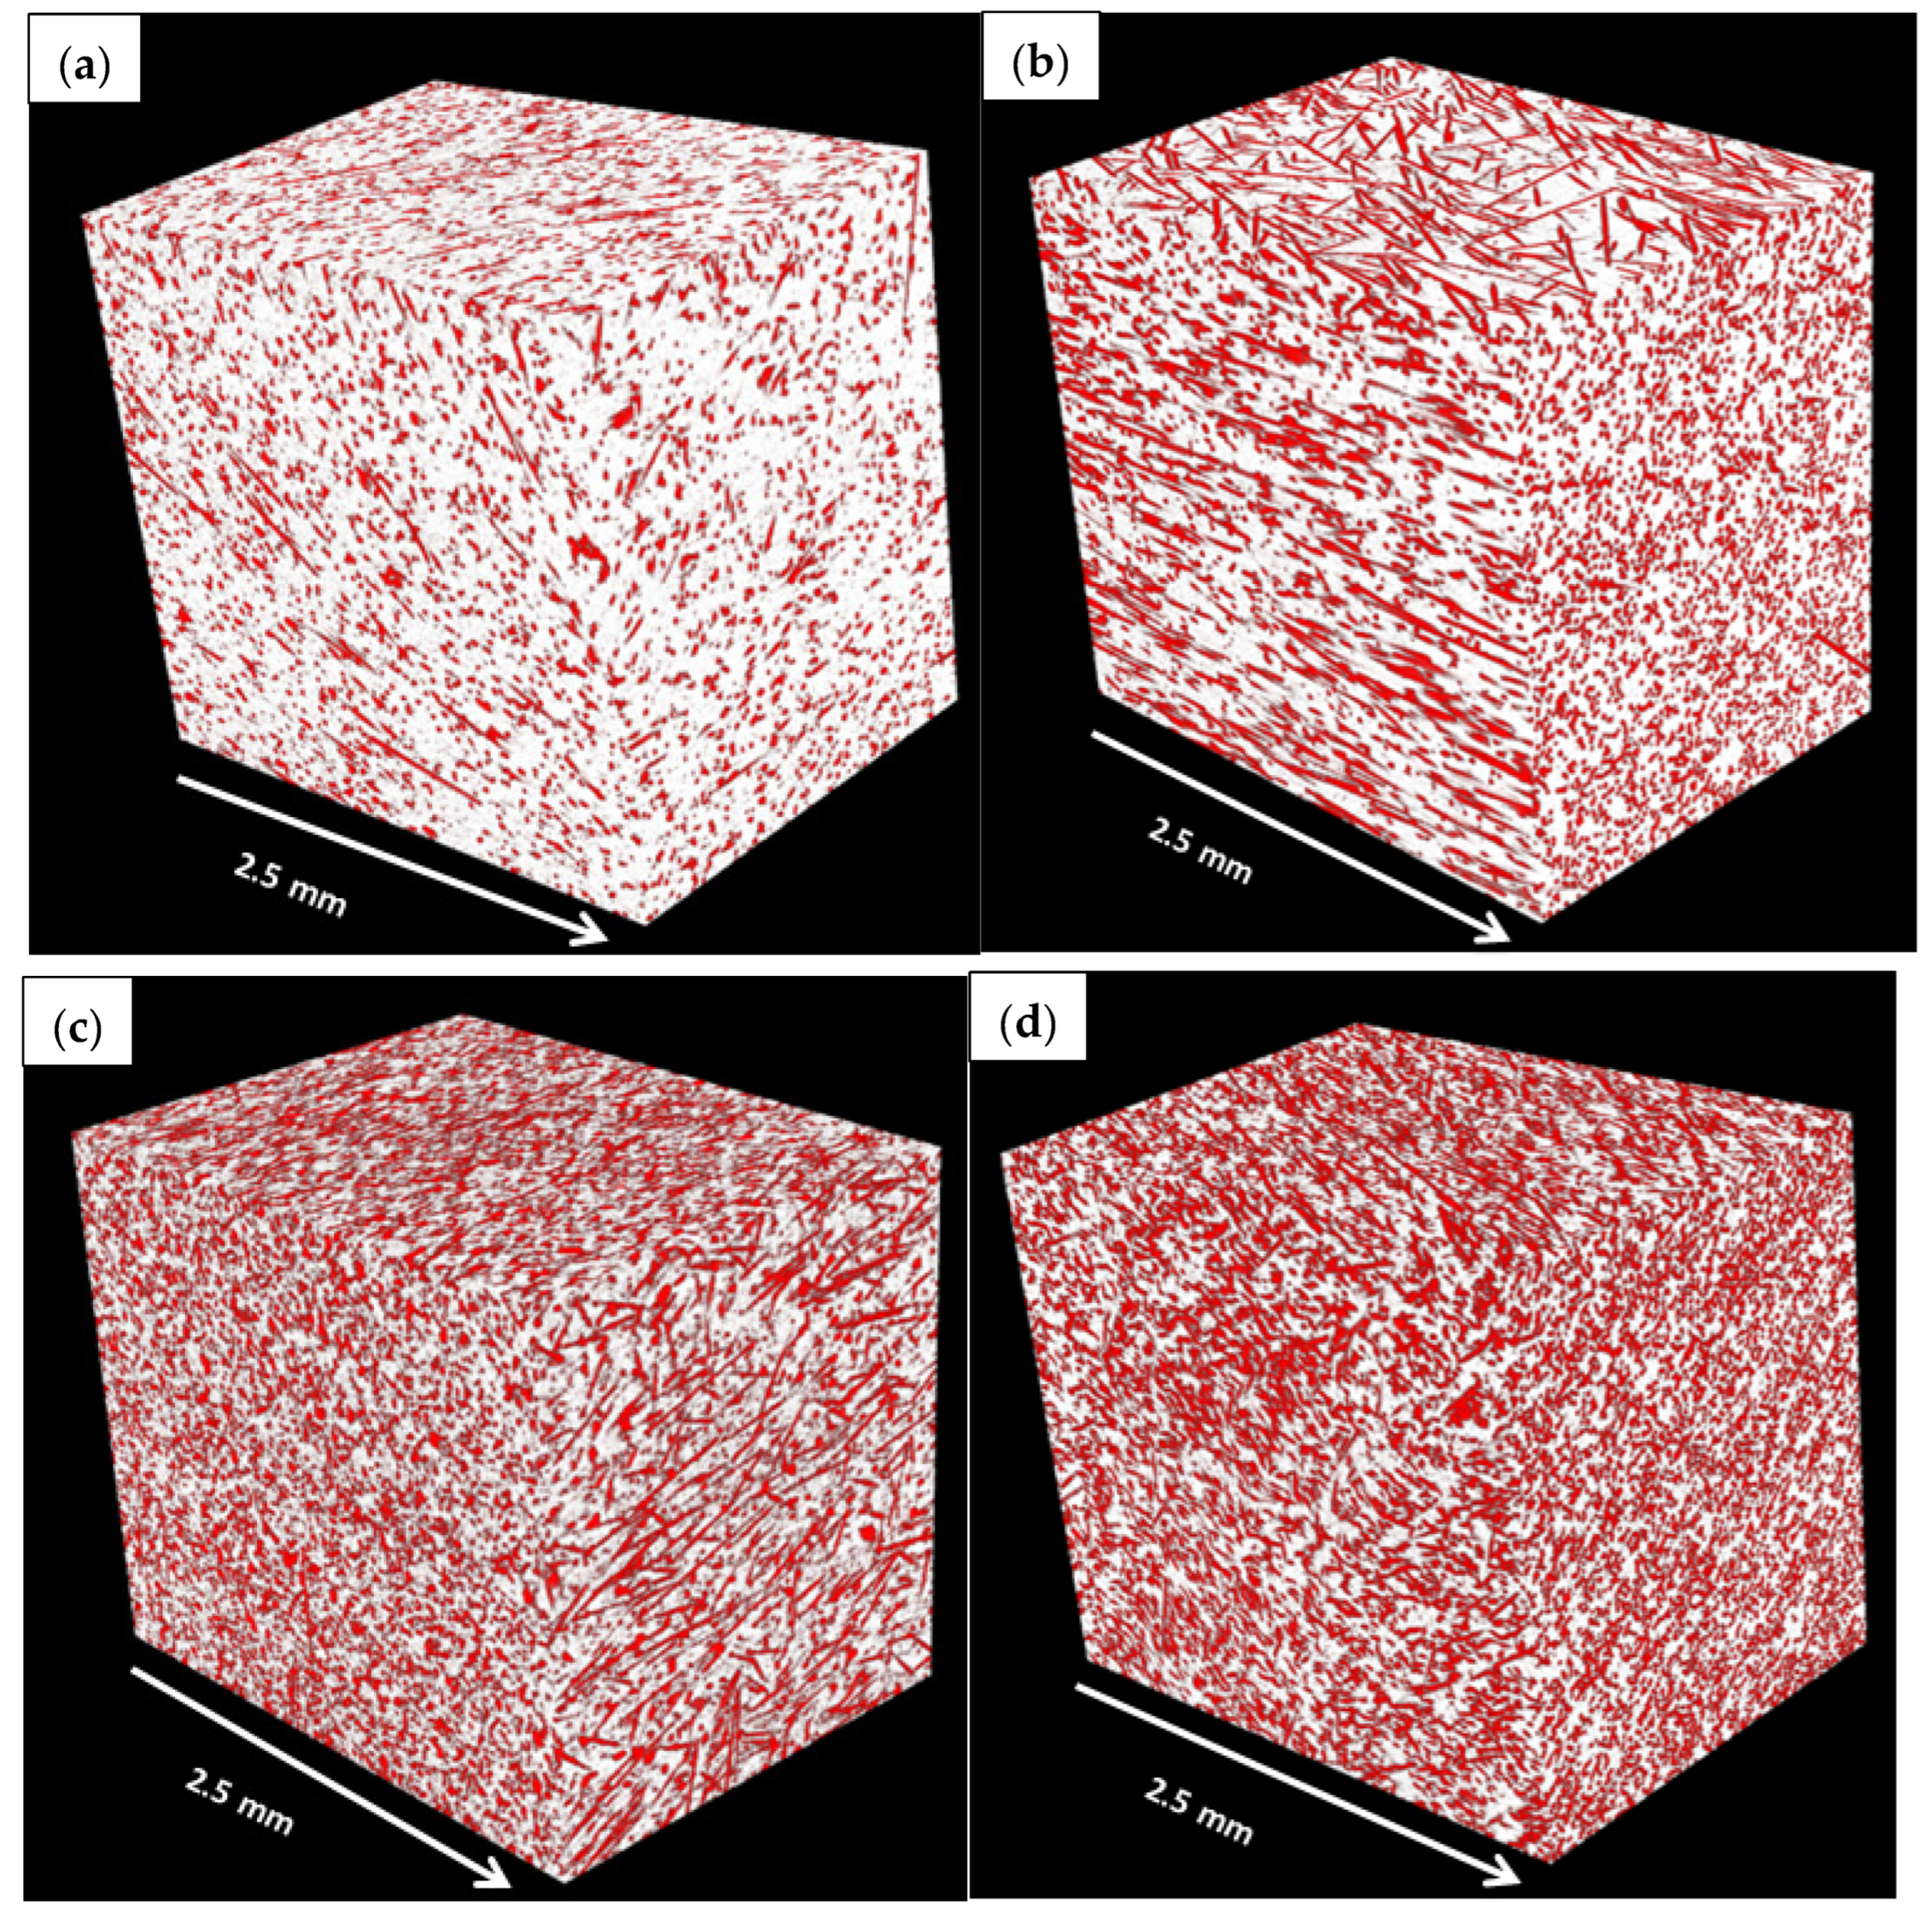
3.6. Micro-CT Analysis of Materials
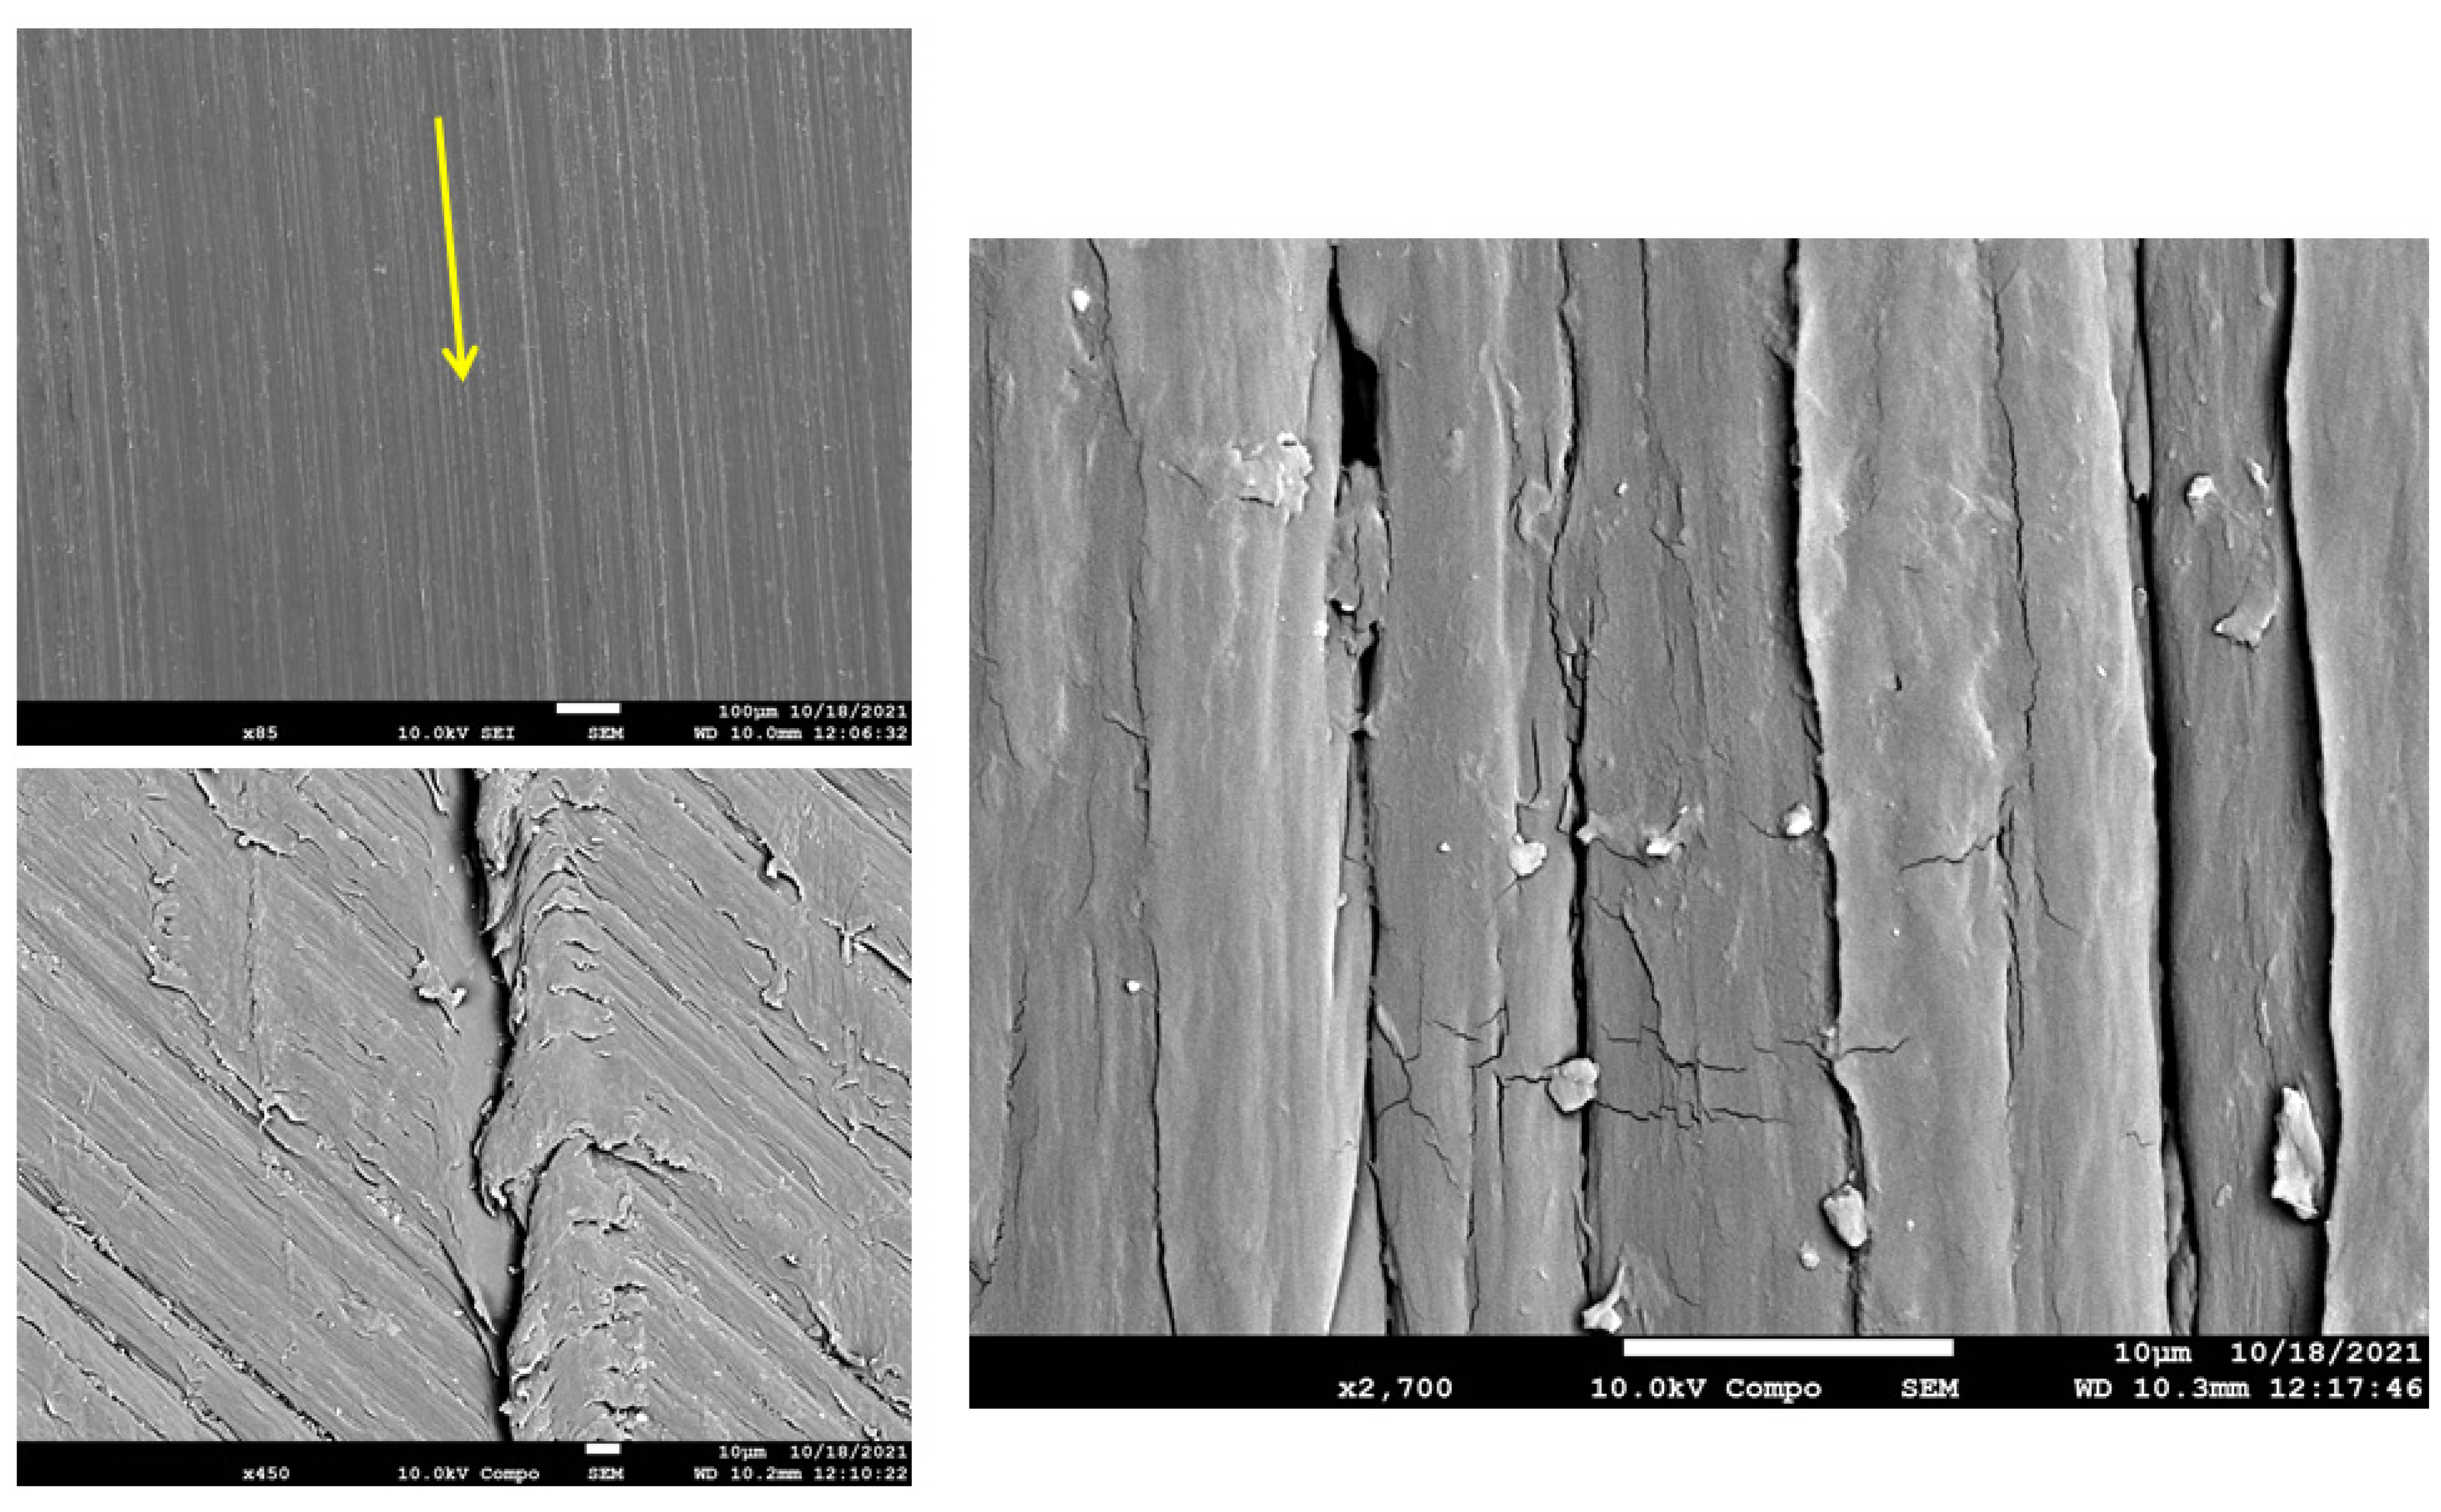
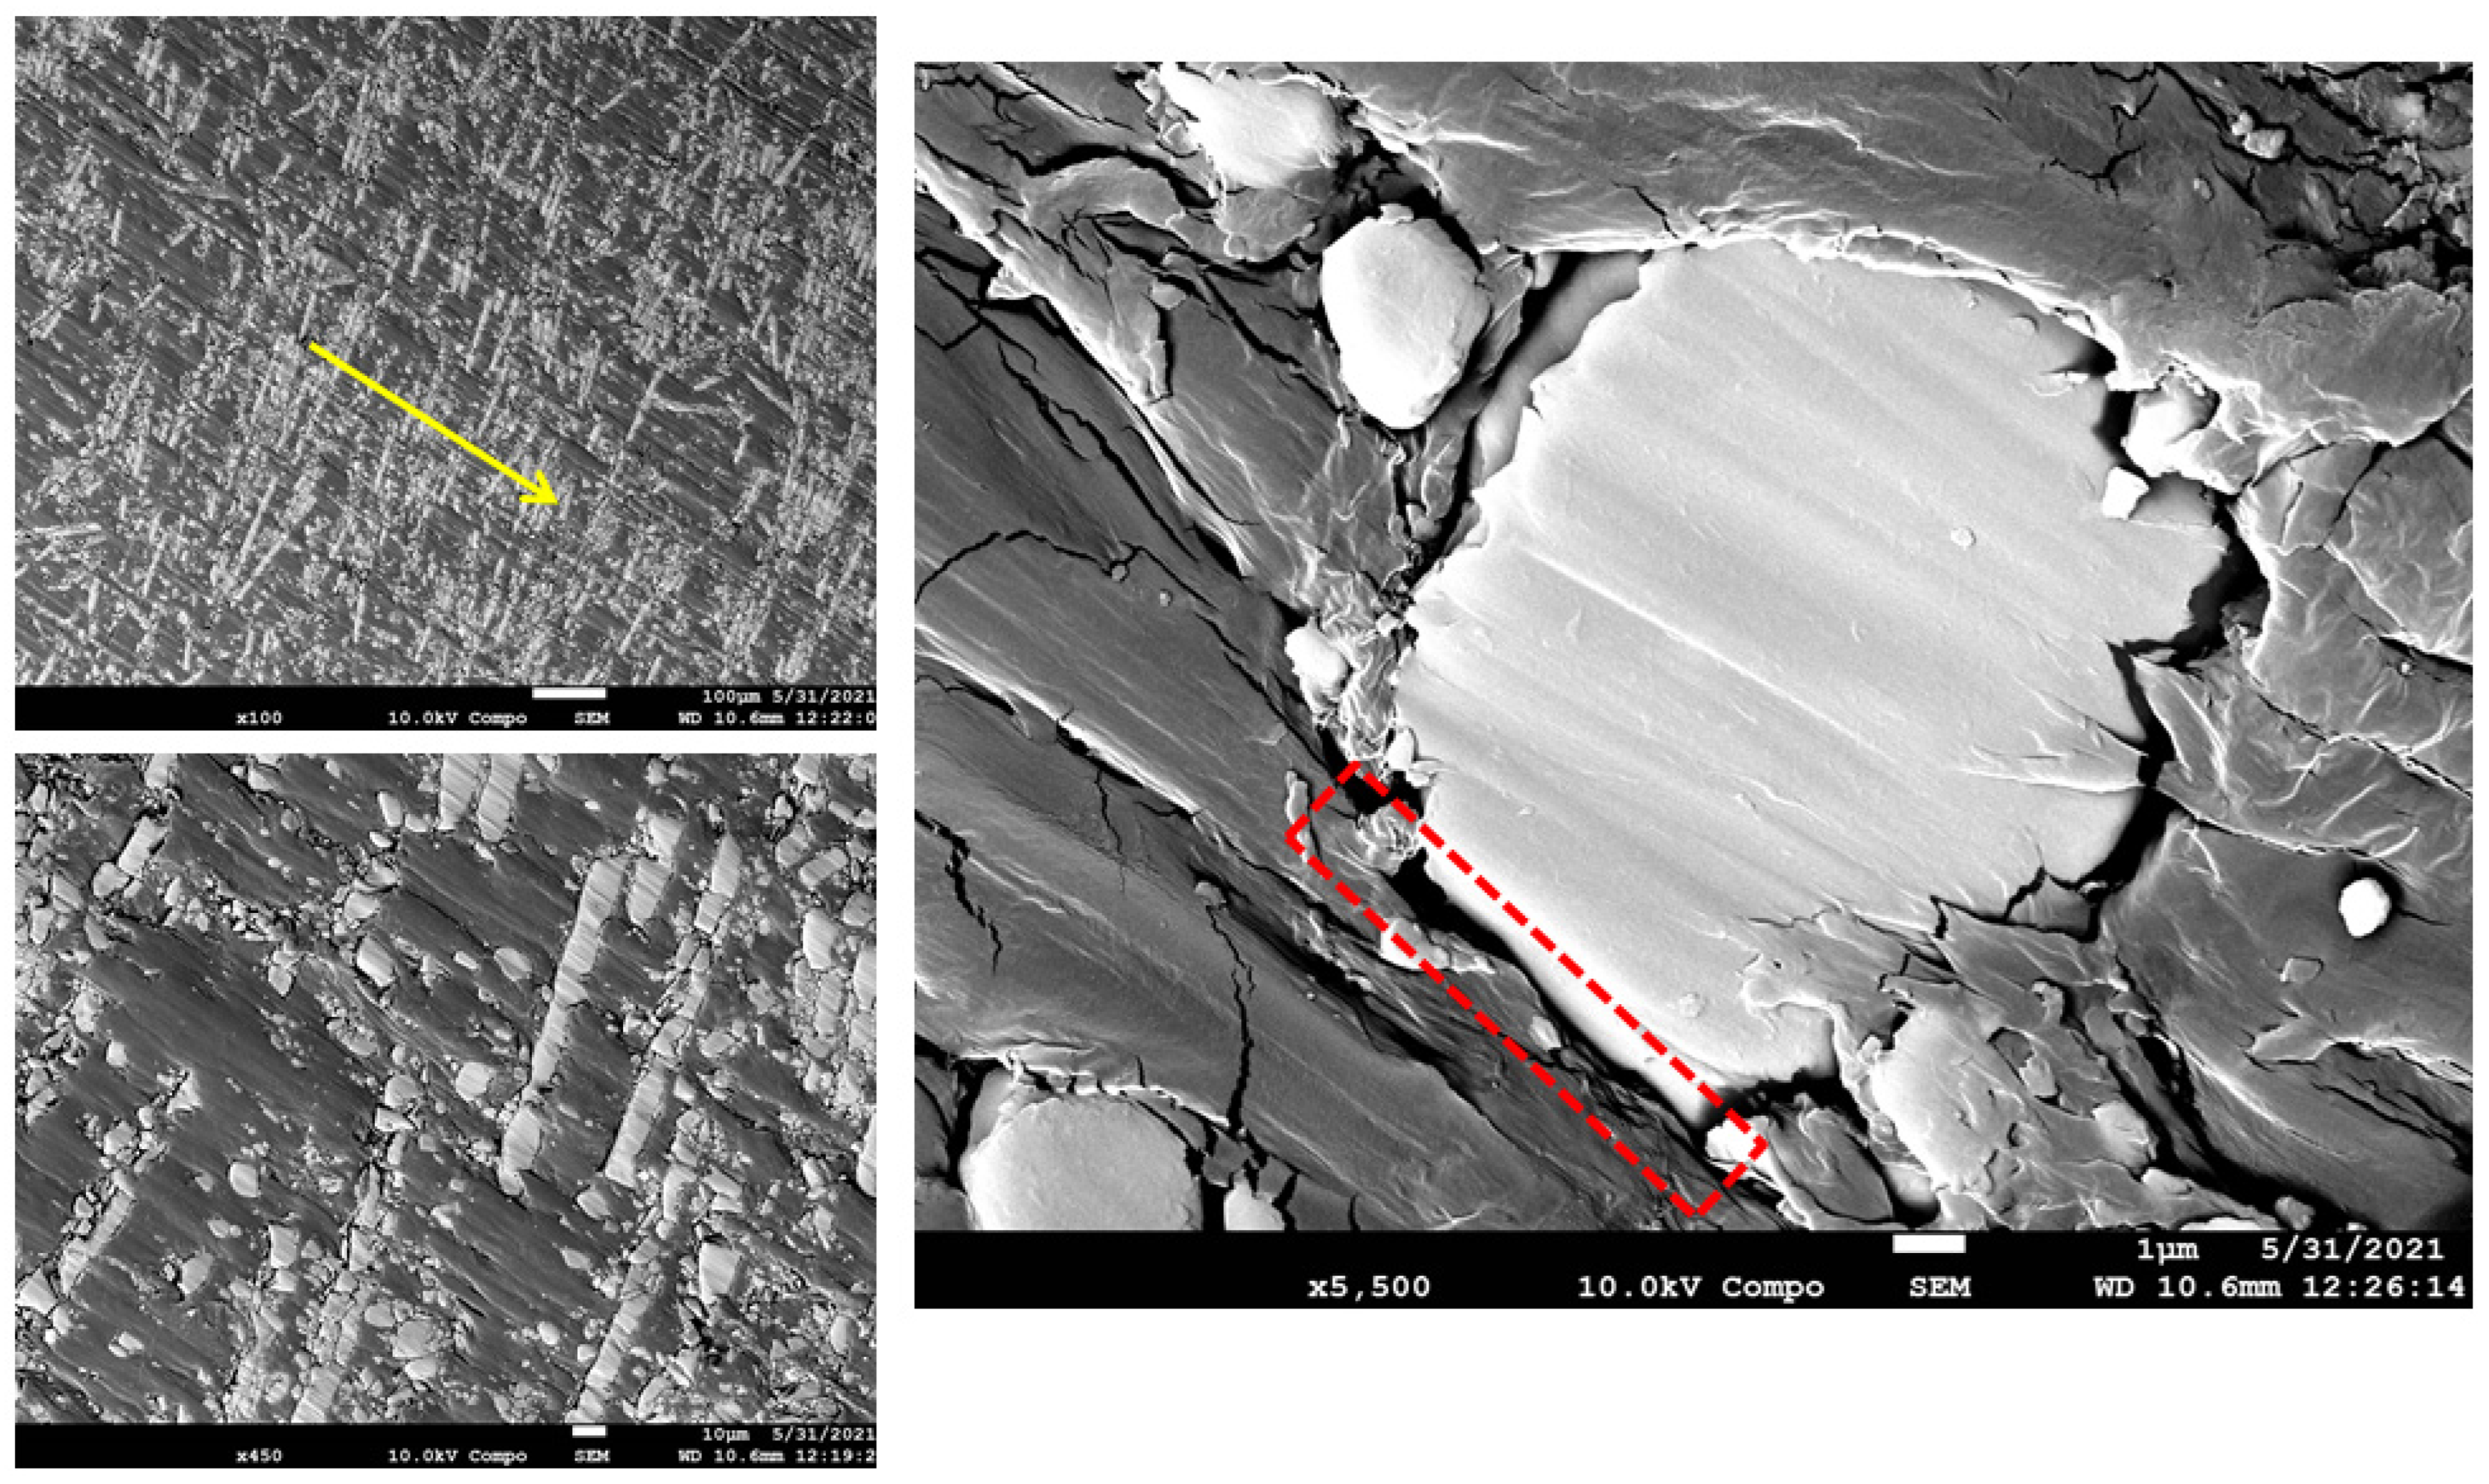
3.7. Surface Morphology of Worn-Out Surfaces
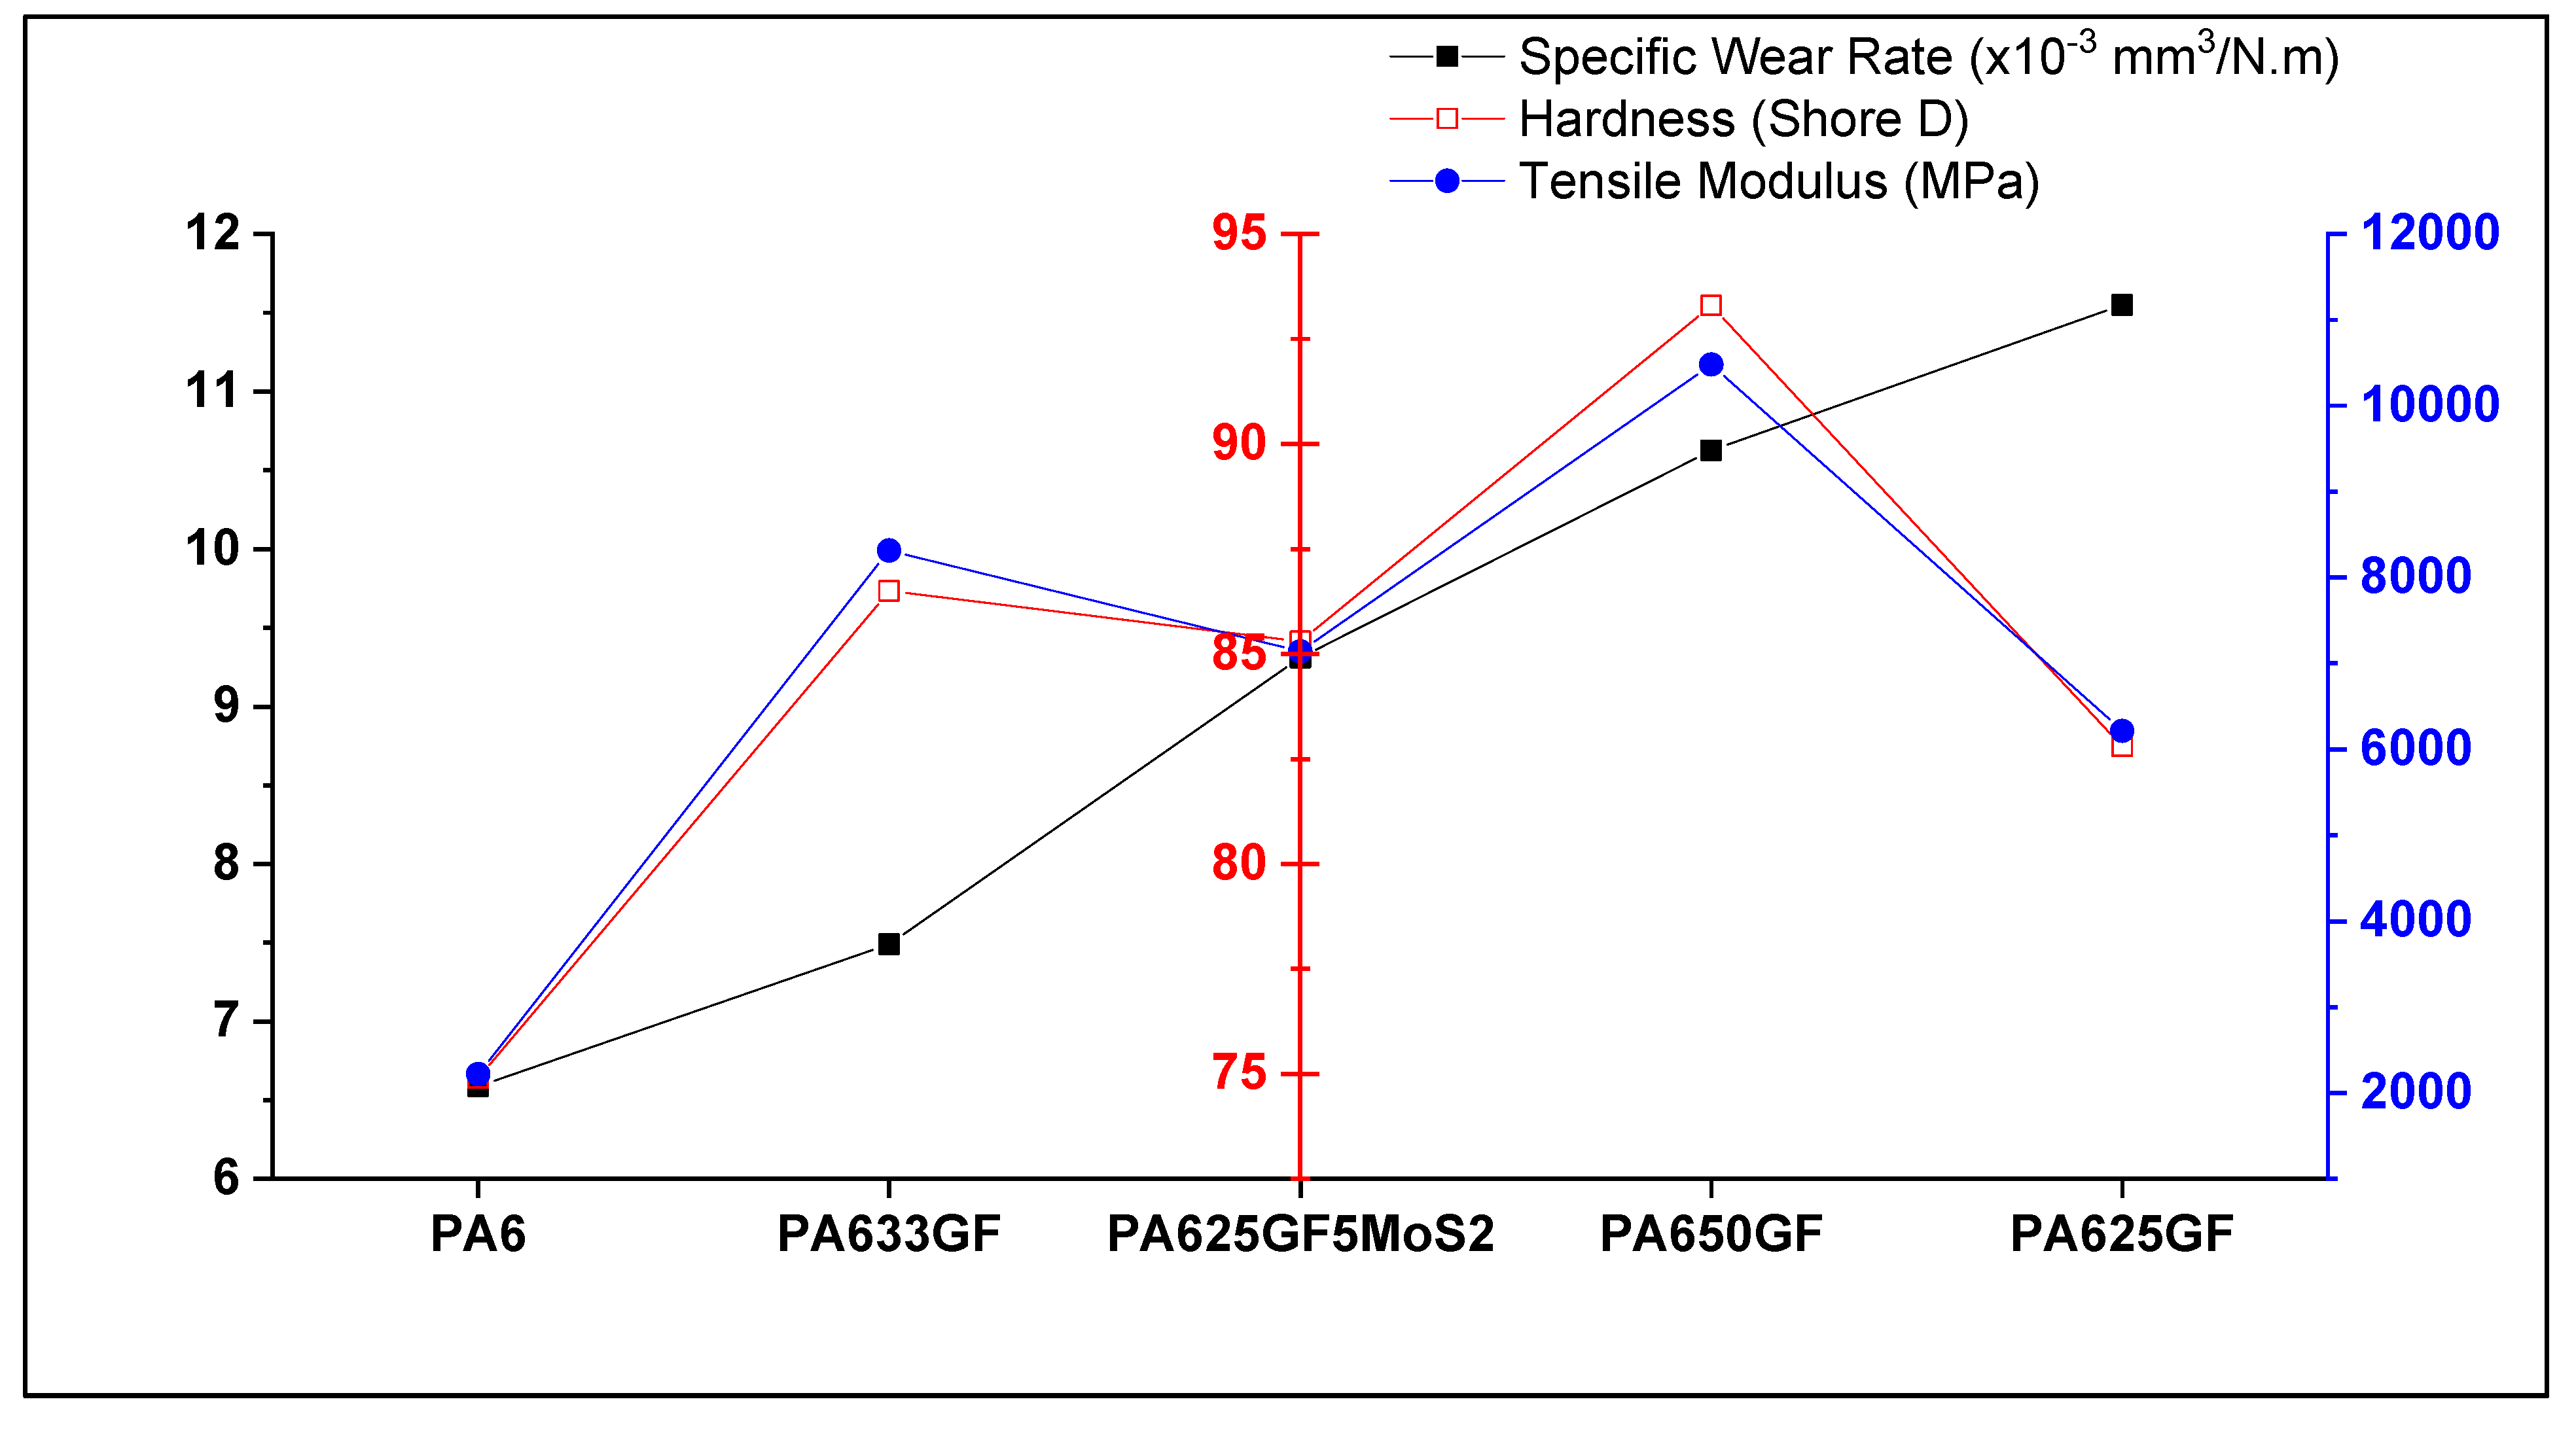
4. Comparative Tribological and Mechanical Properties of Reinforced Polymers
5. Conclusions and Closing Remarks
- The most important conclusion of this study was that there is no correlation between mechanical characteristics with the tribo-performance of thermoplastic composites.
- The tribo-systems’ responses critically depended on the material design (matrix type and fibre volume fraction).
- The reinforcement using glass fibres at 33% fibre volume fraction led to superior wear properties among other volume fractions.
- MoS2 improved the load-carrying capacity and thermal stability of glass fibre-reinforced composites since the addition of MoS2 as a lubricant significantly reduced the wear rates of PA6 composites by 19.87%.
- The increase in fibre volume fraction leads to a decrease in the wear resistance of FRPs.
Author Contributions
Funding
Data Availability Statement
Conflicts of Interest
Nomenclature
| ASTM | American Society for Testing and Materials |
| CF | Carbon Fibre |
| FESEM | Field Emission Scanning Electron Microscopy |
| FRP | Fibre Reinforced Polymer |
| GF | Glass Fibre |
| GFR | Glass Fibre Reinforced |
| Micro-CT | Micro-Computed Tomography |
| MoS2 | Molybdenum Disulphide |
| PA6 | Polyamide 6 |
| PTFE | Polytetrafluoroethylene |
| SiC | Silicon Carbide |
| TiO2 | Titanium Dioxide |
| TPU | Thermoplastic Polyurethane |
| Ws | Specific Wear Rate |
| Xc | Degree of Crystallinity |
References
- Zaghloul, M.M.Y.; Steel, K.; Veidt, M.; Heitzmann, M.T. Wear Behaviour of Polymeric Materials Reinforced with Man-Made Fibres: A Comprehensive Review about Fibre Volume Fraction Influence on Wear Performance. J. Reinf. Plast. Compos. 2021, 41, 215–241. [Google Scholar] [CrossRef]
- Zaghloul, M.Y.; Zaghloul, M.M.Y.; Zaghloul, M.M.Y. Influence of Stress Level and Fibre Volume Fraction on Fatigue Performance of Glass Fibre-Reinforced Polyester Composites. Polymers 2022, 14, 2662. [Google Scholar] [CrossRef] [PubMed]
- Chand, N.; Naik, A.; Neogi, S. Three-body abrasive wear of short glass fibre polyester composite. Wear 2000, 242, 38–46. [Google Scholar] [CrossRef]
- McKeen, L.W. Fatigue and Tribological Properties of Plastics, 2nd ed.; Elsevier: Amsterdam, The Netherlands, 2010. [Google Scholar]
- Stachowiak, G.W.; Batchelor, A.W. Experimental Methods in Tribology; Elsevier: Amsterdam, The Netherlands, 2004. [Google Scholar]
- Zaghloul, M.Y.M.; Zaghloul, M.M.Y.; Zaghloul, M.M.Y. Developments in polyester composite materials—An in-depth review on natural fibres and nano fillers. Compos. Struct. 2021, 278, 114698. [Google Scholar] [CrossRef]
- Zaghloul, M.M.Y.; Zaghloul, M.M.Y. Influence of flame retardant magnesium hydroxide on the mechanical properties of high density polyethylene composites. J. Reinf. Plast. Compos. 2017, 36, 1802–1816. [Google Scholar] [CrossRef]
- Zaghloul, M.M.Y.; Zaghloul, M.Y.M.; Zaghloul, M.M.Y. Experimental and modeling analysis of mechanical-electrical behaviors of polypropylene composites filled with graphite and MWCNT fillers. Polym. Test. 2017, 63, 467–474. [Google Scholar] [CrossRef]
- Soutis, C. Carbon fiber reinforced plastics in aircraft construction. Mater. Sci. Eng. A 2005, 412, 171–176. [Google Scholar] [CrossRef]
- Wang, Z.; Ni, J.; Gao, D. Combined effect of the use of carbon fiber and seawater and the molecular structure on the tribological behavior of polymer materials. Friction 2017, 6, 183–194. [Google Scholar] [CrossRef]
- Zaghloul, M.M.Y.M. Mechanical properties of linear low-density polyethylene fireretarded with melamine polyphosphate. J. Appl. Polym. Sci. 2018, 135, 46770. [Google Scholar] [CrossRef]
- Wang, Q.; Zhang, X.; Pei, X. Study on the synergistic effect of carbon fiber and graphite and nanoparticle on the friction and wear behavior of polyimide composites. Mater. Des. 2010, 31, 3761–3768. [Google Scholar] [CrossRef]
- Chen, Z.; Yan, H.; Liu, T.; Niu, S. Nanosheets of MoS2 and reduced graphene oxide as hybrid fillers improved the mechanical and tribological properties of bismaleimide composites. Compos. Sci. Technol. 2016, 125, 47–54. [Google Scholar] [CrossRef]
- Xue, Y.; Wu, W.; Jacobs, O.; Schädel, B. Tribological behaviour of UHMWPE/HDPE blends reinforced with multi-wall carbon nanotubes. Polym. Test. 2006, 25, 221–229. [Google Scholar] [CrossRef]
- Aderikha, V.N.; Shapovalov, V.A. Effect of filler surface properties on structure, mechanical and tribological behavior of PTFE-carbon black composites. Wear 2010, 268, 1455–1464. [Google Scholar] [CrossRef]
- Latha, P.S.; Rao, M.V. Investigation into effect of ceramic fillers on mechanical and tribological properties of bamboo-glass hybrid fiber reinforced polymer composites. Silicon 2018, 10, 1543–1550. [Google Scholar] [CrossRef]
- Yu, S.; Hu, H.; Yin, J. Effect of rubber on tribological behaviors of polyamide 66 under dry and water lubricated sliding. Wear 2008, 265, 361–366. [Google Scholar] [CrossRef]
- Zaghloul, M.M.Y. Effect of Nano Particles on the Mechanical Properties of Thermosetting Polymeric Materials Reinforced with Glass Fibers. Master’s Thesis, Faculty of Engineering, Alexandria University, Alexandria, Egypt, 2018. [Google Scholar]
- Wang, J.X.; Gu, M.Y.; Bai, S.H.; Ge, S.R. Investigation of the influence of MoS2 filler on the tribological properties of carbon fiber reinforced nylon 1010 composites. Wear 2003, 255, 774–779. [Google Scholar] [CrossRef]
- Zaghloul, M.M.Y.; Zaghloul, M.M.Y.; Zaghloul, M.M.Y. Physical analysis and statistical investigation of tensile and fatigue behaviors of glass fiber-reinforced polyester via novel fibers arrangement. J. Compos. Mater. 2023, 57, 147–166. [Google Scholar] [CrossRef]
- Fuseini, M.; Zaghloul, M.M.Y. Investigation of Electrophoretic Deposition of Pani Nano Fibers as a Manufacturing Technology for Corrosion Protection. Prog. Org. Coat. 2022, 171, 107015. [Google Scholar] [CrossRef]
- Harsha, A.P.; Tewari, U.S. Tribo performance of PEEK composites. Polym. Test. 2002, 21, 697–709. [Google Scholar] [CrossRef]
- Fuseini, M.; Zaghloul, M.M.Y. Statistical and Qualitative Analyses of the Kinetic Models Using Electrophoretic Deposition of Polyaniline. J. Ind. Eng. Chem. 2022, 113, 475–487. [Google Scholar] [CrossRef]
- Han, J.H.; Zhang, H.; Chu, P.F.; Imani, A.; Zhang, Z. Friction and wear of high electrical conductive carbon nanotube buckypaper/epoxy composites. Compos. Sci. Technol. 2015, 114, 1–10. [Google Scholar] [CrossRef]
- Rymuza, Z. Tribology of Polymers. Arch. Civ. Mech. Eng. 2017, 7, 177–184. [Google Scholar] [CrossRef]
- Brostow, W.; Kovačevic, V.; Vrsaljko, D.; Whitworth, J. Tribology of polymers and polymer-based composites. J. Mater. Educ. 2010, 32, 273–290. [Google Scholar]
- Coleman, J.N.; Khan, U.; Blau, W.J.; Gun’ko, Y.K. Small but strong: A review of the mechanical properties of carbon nanotube-polymer composites. Carbon 2006, 44, 1624–1652. [Google Scholar] [CrossRef]
- Rattan, R.; Bijwe, J. Carbon fabric reinforced polyetherimide composites: Influence of weave of fabric and processing parameters on performance properties and erosive wear. Mater. Sci. Eng. A 2006, 420, 342–350. [Google Scholar] [CrossRef]
- Zaghloul, M.M.Y.; Mohamed, Y.S.; El-Gamal, H. Fatigue and Tensile Behaviors of Fiber-Reinforced Thermosetting Composites Embedded with Nanoparticles. J. Compos. Mater. 2019, 53, 709–718. [Google Scholar] [CrossRef]
- Pei, X.Q.; Bennewitz, R.; Schlarb, A.K. Mechanisms of friction and wear reduction by carbon fiber reinforcement of PEEK. Tribol. Lett. 2015, 58, 42. [Google Scholar] [CrossRef]
- Mohamed, Y.S.; El-Gamal, H.; Zaghloul, M.M.Y. Microhardness behavior of fiber reinforced thermosetting composites embedded with cellulose nanocrystals. Alex. Eng. J. 2018, 57, 4113–4119. [Google Scholar] [CrossRef]
- Bijwe, J.; Rattan, R.; Fahim, M. Erosive wear of carbon fabric reinforced polyetherimide composites: Role of amount of fabric and processing technique. Polym. Compos. 2008, 29, 337–344. [Google Scholar] [CrossRef]
- Rajesh, J.J.; Bijwe, J.; Tewari, U.S. Friction and wear studies of short glass fiber reinforced polyetherimide composites. Wear 2002, 252, 769–776. [Google Scholar] [CrossRef]
- ASTM D638-10; Standard Test Method For ‘Tensile Properties of Polymer Matrix Composite Materials’. ASTM International: West Conshohocken, PA, USA, 2000.
- ASTM D695-15; Standard Test Method for Compressive Properties of Rigid Plastics. ASTM International: West Conshohocken, PA, USA, 2015. [CrossRef]
- ASTM D2240-00; Standard Test Method for ‘Rubber Property—Durometer Hardness’. ASTM International: West Conshohocken, PA, USA, 2000.
- ASTM G99-17; Standard Test Method for ‘Wear Testing with a Pin-on-Disk Apparatus’. ASTM International: West Conshohocken, PA, USA, 2017.
- ASTM D792-00; Standard Test Method for ‘Density and Specific Gravity (Relative Density) of Plastics by Displacement’. ASTM International: West Conshohocken, PA, USA, 2000.
- Sahoo, R.R.; Biswas, S.K. Effect of Layered MoS2 Nanoparticles on the Frictional Behavior and Microstructure of Lubricating Greases. Tribol. Lett. 2014, 53, 157–171. [Google Scholar] [CrossRef]
- Chen, B.; Li, X.; Jia, Y.; Li, X.; Yang, J.; Yan, F.; Li, C. MoS2 nanosheets-decorated carbon fiber hybrid for improving the friction and wear properties of polyimide composite. Compos. A Appl. Sci. Manuf. 2018, 109, 232–238. [Google Scholar] [CrossRef]
- Luo, W.; Liu, Q.; Li, Y.; Zhou, S.; Zou, H.; Liang, M. Enhanced mechanical and tribological properties in polyphenylene sulfide/polytetrafluoroethylene composites reinforced by short carbon fiber. Compos. B Eng. 2016, 91, 579–588. [Google Scholar] [CrossRef]
- Basavarajappa, S.; Ellangovan, S. Dry sliding wear characteristics of glass-epoxy composite filled with silicon carbide and graphite particles. Wear 2012, 296, 491–496. [Google Scholar] [CrossRef]
- Chauhan, S.R.; Gaur, B.; Dass, K. Effect of fiber loading on mechanical properties, friction and wear behaviour of vinylester composites under dry and water lubricated conditions. Int. J. Mater. Sci. 2011, 1, 1–8. [Google Scholar]
- Zhang, H.; Zhang, Z.; Friedrich, K. Effect of fiber length on the wear resistance of short carbon fiber reinforced epoxy composites. Compos. Sci. Technol. 2007, 67, 222–230. [Google Scholar] [CrossRef]
- Kumar, S.; Panneerselvam, K. Research on tribological behaviors of pure and glass fiber reinforced Nylon 6 composites against polymer disc. J. Mater. Sci. Mech. Eng. 2015, 2, 24–28. [Google Scholar]
- Xing, Y.; Zhang, G.; Ma, K.; Chen, T.; Zhao, X. Study on the friction and wear behaviors of modified PA66 composites. Polym.-Plast. Technol. Eng. 2009, 48, 633–638. [Google Scholar] [CrossRef]
- Bahadur, S.; Polineni, V. Tribological studies of glass fabric-reinforced polyamide composites filled with CuO and PTFE. Wear 1996, 200, 95–104. [Google Scholar] [CrossRef]
- You, Y.L.; Li, D.X.; Si, G.J.; Lv, R.Y.; Deng, X. Improvement in the tribological properties of polyamide 6: Talc, glass fiber, graphite, and ultrahigh-molecular-weight polyethylene. J. Thermoplast. Compos. Mater. 2016, 29, 494–507. [Google Scholar] [CrossRef]


| Property | Test Method | Material Type | |
|---|---|---|---|
| Thermoplastic Polyurethane (TPU) | Polyamide 6 (PA6) | ||
| Yield Strength (MPa) | ISO 527-2/1A | 35.5 | 77 |
| Flexural Strength (MPa) | ISO 178 | - | 92 |
| Flexural Modulus (MPa) | ISO 178 | - | 2500 |
| Notched Izod Impact (kJ/m2) | ISO 180 | - | 3.5 |
| Specific Gravity | ASTM D-792 | 1.20 | 1.13 |
| Melting Point (°C) | ISO 3146 | - | 220 |
| Serial | Specimen Code | Chemical Composition | ||
|---|---|---|---|---|
| Matrix | Reinforcement (% by Volume) | Lubricant | ||
| 1 | PA6 | 100% PA6 | - | - |
| 2 | PA625GF | 75% PA6 | 25% Glass Fibre | - |
| 3 | PA633GF | 67% PA6 | 33% Glass Fibre | - |
| 4 | PA650GF | 50% PA6 | 50% Glass Fibre | - |
| 5 | PA625GF5MoS2 | 70% PA6 | 25% Glass Fibre | 5% MoS2 |
| 6 | TPU | 100% TPU | - | - |
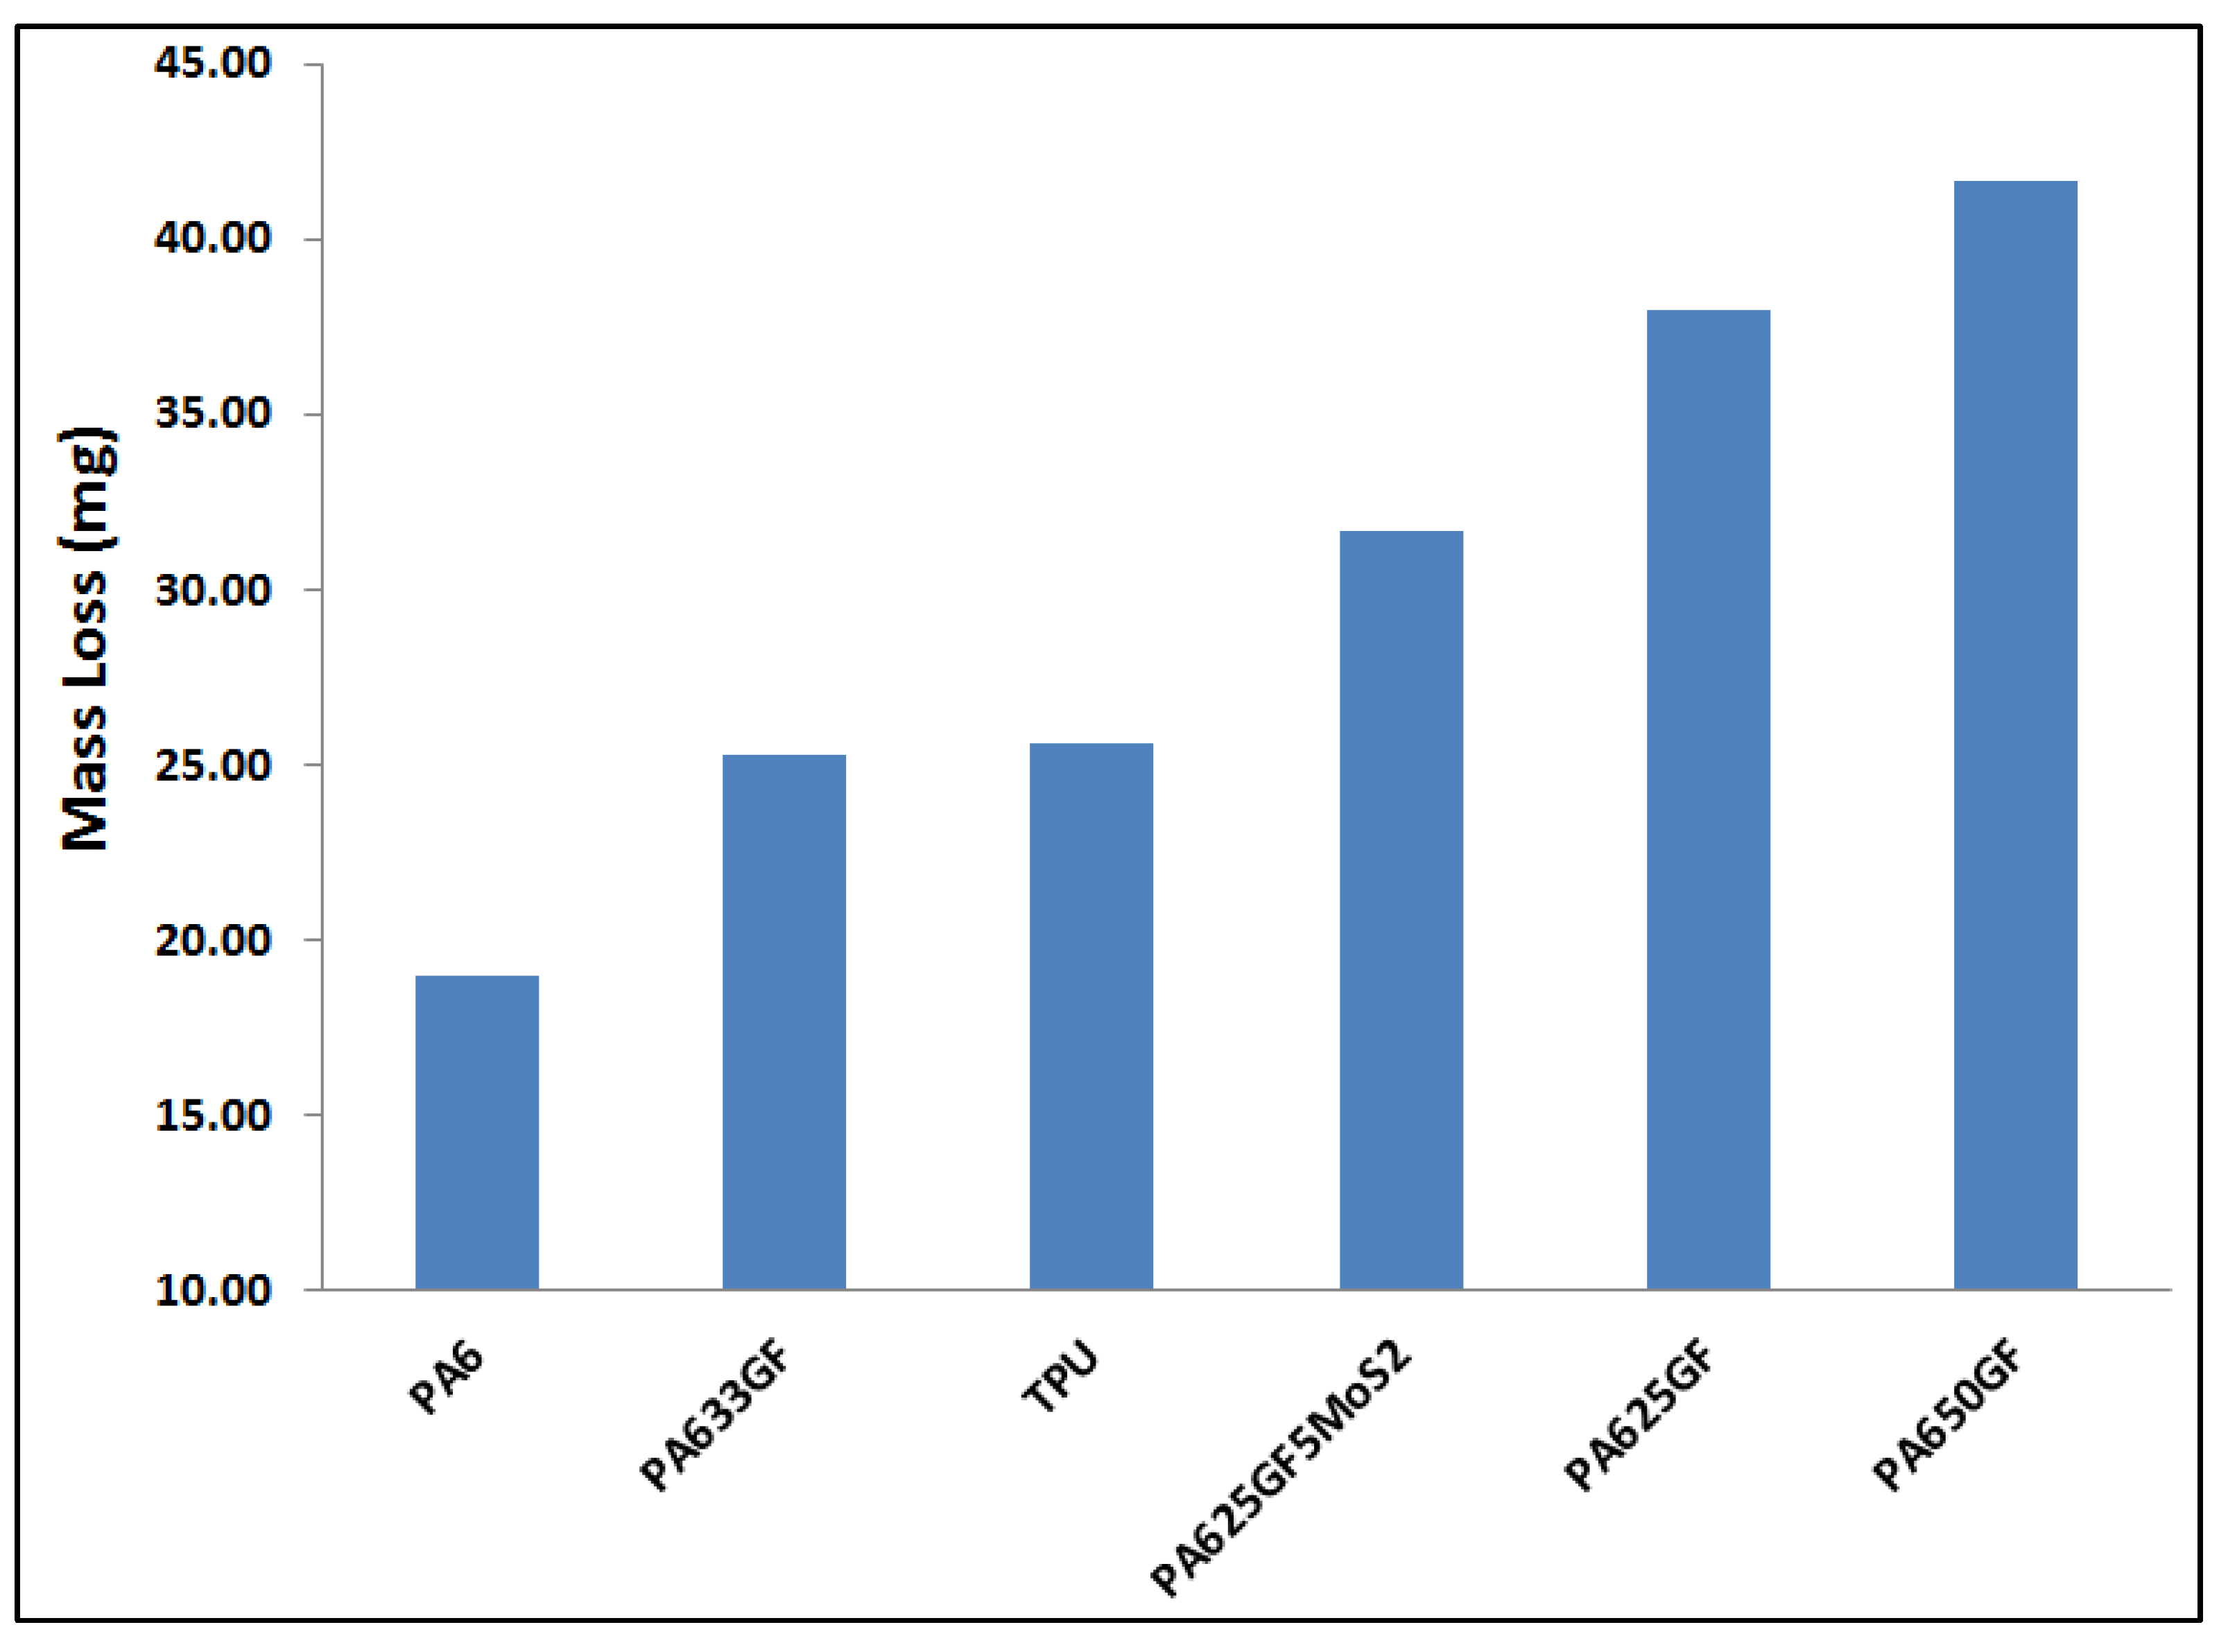
| Sample | Mass Loss (mg) | Mean Value (mg) | ||||
|---|---|---|---|---|---|---|
| PA6 | 18.00 | 19.00 | 19.00 | 20.00 | 19.00 | 19.00 |
| PA633GF | 25.00 | 25.00 | 26.00 | 25.00 | 26.00 | 25.40 |
| TPU | 25.00 | 25.00 | 26.00 | 24.00 | 28.00 | 25.60 |
| PA625GF5MoS2 | 34.00 | 31.00 | 32.00 | 30.00 | 31.00 | 31.60 |
| PA625GF | 39.00 | 37.00 | 39.00 | 38.00 | 37.00 | 38.00 |
| PA650GF | 37.00 | 41.00 | 42.00 | 45.00 | 43.00 | 41.60 |
| Sample | Mass Loss (∆m) [mg] | Density (ρ) [g/cm3] | Volume Loss (∆V) [mm3] |
|---|---|---|---|
| PA6 | 19.00 | 1.128 | 16.84 |
| TPU | 25.67 | 1.196 | 21.46 |
| Sample | Mass Loss (∆m) [mg] | Density (ρ) [g/cm3] | Volume Loss (∆V) [mm3] |
|---|---|---|---|
| PA633GF | 25.33 | 1.319 | 19.20 |
| PA625GF5MoS2 | 33.33 | 1.331 | 25.04 |
| PA650GF | 41.67 | 1.533 | 27.18 |
| PA625GF | 40.00 | 1.286 | 31.10 |
| Serial | Specimen Code | Degree of Crystallinity (Xc%) |
|---|---|---|
| 1 | PA6 | 47.03 |
| 2 | PA625GF | 40.52 |
| 3 | PA633GF | 37.81 |
| 4 | PA650GF | 33.39 |
| 5 | PA625GF5MoS2 | 52.38 |
| Material Composition | Tensile Strength | Compressive Strength | Wear Parameters | Specific Wear Rate | Reference | |||
|---|---|---|---|---|---|---|---|---|
| Matrix | Fibre | Applied Load | Distance | Sliding Velocity | ||||
| Polyamide-6 | - | 76.47 MPa | 83.275 MPa | 10 N | 257.48 m | 0.31 m/s | 6.588 × 10⁻³ mm3/Nm | Current study |
| Polyamide-6 | 33% vol. glass fibres | 286.335 MPa | 163.01 MPa | 10 N | 257.48 m | 0.31 m/s | 7.491 × 10⁻³ mm3/Nm | Current study |
| Polyamide-6 | 50% vol. glass fibres | 360.782 MPa | 228.54 MPa | 10 N | 257.48 m | 0.31 m/s | 10.626 × 10⁻³ mm3/Nm | Current study |
| Poly tetra fluoro ethylene/Poly phenylene sulphide | 15% vol. carbon fibres | 50.2 Mpa | - | 200 N | 15,000 m | 0.42 m/s | 2.3 × 10⁻⁶ mm3/Nm | [41] |
| Epoxy | 50% vol. glass fibres | - | - | 60 N | 5000 m | 5.44 m/s | 9.2 × 10⁻⁶ mm3/Nm | [42] |
| Polyamide-6 | 40% wt. glass fibres | 192 Mpa | - | 10 N | 1000 m | 1.6 m/s | 0.23 × 10⁻⁷ mm3/N | [43] |
| Polyamide-6 | 40% wt. glass fibres | 192 Mpa | - | 10 N | 1000 m | 4.0 m/s | 0.26 × 10⁻⁷ mm3/Nm | [43] |
| Epoxy | 15% vol. carbon fibres | - | - | 40 N | 72,000 m | 1.0 m/s | 16 × 10−7 mm3/Nm | [44] |
| Polyamide-6 | 10% wt. glass fibres | 53.63 Mpa | - | 15 N | 1000 m | 2.0 m/s | 3.0 × 10⁻³ mm3/Nm | [45] |
| Polyamide-6 | 30% wt. glass fibres | 86.01 Mpa | - | 15 N | 1000 m | 1.0 m/s | 1.38 × 10⁻⁴ mm3/Nm | [45] |
| Polyamide 66 | 30% vol. glass fibres | 140.03 Mpa | - | 200 N | 3024 m | 0.42 m/s | 25.3 × 10⁻⁶ mm3/Nm | [46] |
| Polyamide | 11.3% vol. glass fibres | - | - | 19.6 N | 15,000 m | 1.0 m/s | 2.87 × 10⁻⁶ mm3/Nm | [47] |
| Polyamide | 20.7% vol. glass fibres | - | - | 19.6 N | 30,000 m | 1.0 m/s | 1.66 × 10⁻⁶ mm3/Nm | [47] |
| Polyamide-6 | 20% wt. glass fibres | - | - | 40 N | 1800 m | 1500 rpm | 12.0 × 10⁻⁷ mm3/Nm | [48] |
| Polyamide-6 | 20% wt. glass fibres | - | - | 160 N | 1800 m | 1500 rpm | 8.0 × 10⁻⁷ mm3/Nm | [48] |
Disclaimer/Publisher’s Note: The statements, opinions and data contained in all publications are solely those of the individual author(s) and contributor(s) and not of MDPI and/or the editor(s). MDPI and/or the editor(s) disclaim responsibility for any injury to people or property resulting from any ideas, methods, instructions or products referred to in the content. |
© 2023 by the authors. Licensee MDPI, Basel, Switzerland. This article is an open access article distributed under the terms and conditions of the Creative Commons Attribution (CC BY) license (https://creativecommons.org/licenses/by/4.0/).
Share and Cite
Zaghloul, M.M.Y.; Steel, K.; Veidt, M.; Heitzmann, M.T. Mechanical and Tribological Performances of Thermoplastic Polymers Reinforced with Glass Fibres at Variable Fibre Volume Fractions. Polymers 2023, 15, 694. https://doi.org/10.3390/polym15030694
Zaghloul MMY, Steel K, Veidt M, Heitzmann MT. Mechanical and Tribological Performances of Thermoplastic Polymers Reinforced with Glass Fibres at Variable Fibre Volume Fractions. Polymers. 2023; 15(3):694. https://doi.org/10.3390/polym15030694
Chicago/Turabian StyleZaghloul, Moustafa Mahmoud Yousry, Karen Steel, Martin Veidt, and Michael T. Heitzmann. 2023. "Mechanical and Tribological Performances of Thermoplastic Polymers Reinforced with Glass Fibres at Variable Fibre Volume Fractions" Polymers 15, no. 3: 694. https://doi.org/10.3390/polym15030694