Article

Nitrogen-Rich Polyaniline-Based Activated Carbon for Water Treatment: Adsorption Kinetics of Anionic Dye Methyl Orange

by
Abdel-Basit Al-Odayni
1,*,
Faisal S. Alsubaie
2 and
Waseem Sharaf Saeed
1
1
Department of Restorative Dental Sciences, College of Dentistry, King Saud University, P.O. Box 60169, Riyadh 11545, Saudi Arabia
2
Department of Chemistry, College of Science, King Saud University, P.O. Box 2455, Riyadh 11451, Saudi Arabia
*
Author to whom correspondence should be addressed.
Polymers 2023, 15(4), 806; https://doi.org/10.3390/polym15040806
Submission received: 31 December 2022 / Revised: 30 January 2023 / Accepted: 2 February 2023 / Published: 6 February 2023
(This article belongs to the Special Issue Polymeric Materials for Water Management)

Abstract

:
In the present work, a nitrogen-rich activated carbon (PAnAC) was prepared using polyaniline (PAn) as a precursor to represent one possible conversion of nitrogen-containing polymeric waste into a valuable adsorbent. PAnAC was fabricated under the chemical activation of KOH and a PAn precursor (in a 4:1 ratio) at 650 °C and was characterized using FTIR, SEM, BET, TGA, and CHN elemental composition. The structural characteristics support its applicability as an adsorbent material. The adsorption performance was assessed in terms of adsorption kinetics for contact time (0–180 min), methyl orange (MO) concentration (C0 = 50, 100, and 200 ppm), and adsorbent dosages (20, 40, and 80 mg per 250 mL batch). The kinetic results revealed a better fit to a pseudo-second-order, specifically nonlinear equation compared to pseudo-first-order and Elovich equations, which suggests multilayer coverage and a chemical sorption process. The adsorption capacity (qe) was optimal (405.6 mg/g) at MO C0 with PAnAC dosages of 200 ppm and 40 mg and increased as MO C0 increased but decreased as the adsorbent dosage increased. The adsorption mechanism assumes that chemisorption and the rate-controlling step are governed by mass transfer and intraparticle diffusion processes.

1. Introduction

Currently, water pollution has become a serious crisis and a great challenge for humanity. There are several natural and man-made activities that contribute directly or indirectly to water pollution. Water dirtiness may gradually increase as a result of humans’ activities, such as industrialization and civilization-related activities, which generate massive amounts of waste that is commonly discharged into water bodies and, subsequently, causes a lack of fresh water supplies [1]. About 300–400 megatons of industrial wastes are released into water bodies yearly and uncontrollably introduce various pollutants to aquatic environments, most of which are toxic to living creatures [2]. Such wastes may combine solid matter, harmful gases, toxic chemicals, and microbiological organisms. However, regarding their sources and compositions, pollutants affect our health and environment differently [3]. In particular, chemicals are known to be major water pollutants. They are present in various types, including dyes, heavy metals, pesticides, chemical compounds, cosmetics, pharmaceutics, and hormones.
Dyes, however, are among the common chemical substances largely discharged into water bodies and are considered the most dangerous pollutants due to their potential carcinogenic and mutagenic effects. Furthermore, their solubility in water affects the environment aggressively by changing the water chemistry, reducing the amounts of dissolved oxygen by obstructing sunlight penetration into the water, driving unwanted effects on aquatic creatures, and drastically disturbing their biosystems [3].
Industrially, azo dyes, including methyl orange (MO) and mordant black 17, are the most popular category and are used in diverse applications, such as in the textile, paper, and printing industries. Further, they possess the highest production rate among all types, representing about 60% of all dyes. The threat of these dyes arises, as aforementioned, from their solubility in water. In addition, as their molecular weights increase, their distribution in water also increases. Hence, their degradation rate decreases. MO is a well-known colorant, being one of the most used industrial azo-based dyes. Additionally, it is a popular laboratory pH indicator, working as a weak acid with a red-to-yellow color-change range at pH 3.1–4.4 [4].
To eliminate dyes from water, massive studies were carried out to find an efficient solution. Thus, different technologies such as adsorption, filtration, precipitation, ion exchanges, flocculation, coagulation, and ozonation were applied. Adsorption is a highly remarkable method that is used in dye removal due to its simplicity, low costs, and excellent efficiency [5,6,7,8]. Materials such as clays, zeolites, activated carbon, carbon nanomaterials, polymers, biomass, and agricultural wastes were commonly investigated as adsorbent candidates. However, efficient adsorbents must have suitable properties to be applied in the field of dye removal. Thus, materials with high surface areas, low toxicity, renewability, low waste formation, low costs, and high stability are typically favorable [7,9,10,11].
Since the eighteenth century, carbon-based materials have been used to adsorb unwanted constituents from gases and solutions [12]. Activated carbon (AC) is one carbon-based material that has been comprehensively studied and applied in adsorption. It is well known for its high porosity, enormous capacity, and low costs. Such features encourage its use for water treatment. Nevertheless, AC is a reachable material due to its simple preparation methods and multivarious abundant precursors, including wood, biomass, bones, industrial byproducts, and any other carbon-rich materials [12,13]. Basically, AC preparation can be approached by the activation (chemically or physically) of precursors (e.g., biomass). Chemical activation may proceed via the impregnation of the source with oxidizing/hydrating reagents. Then, it is carbonized at between 400 and 900 °C. On the other hand, the physical activation process consists of two stages performed in two different furnaces, starting with carbonization under the ambient atmosphere, followed by activation under an oxidizing atmosphere at between 800 and 1100 °C [13].
This work aimed to synthesize a new, efficient, nitrogen-rich activated carbon (denoted PAnAC) adsorbent based on PAn as a precursor and to investigate its kinetic adsorption process for the removal of MO as an anionic azo-dye model. The PAnAC adsorbent was fully characterized and applied in a batch kinetic adsorption process at various doses and MO concentrations. The performance was assessed using various kinetic models and is discussed in reference to the physicochemical and structural properties of the adsorbents.

2. Materials and Methods

2.1. Materials

Aniline (C6H7N) (Ani, 99%), ammonium persulfate ((NH4)2S2O8) (APS, 98%), and potassium hydroxide (KOH) (pellets, 85%) were procured from Alfa Aesar, Karlsruhe, Germany. Hydrochloric acid (HCl) (~36%) and absolute ethanol (EtOH, 99.5%) were purchased from Fisher Chemical, Loughborough, U.K. Methyl orange sodium salt (C14H14N3NaO3S) (MO, 99.8%) powder was obtained from BDH Chemicals Ltd., Poole, England, UK. All reagents were used as received unless stated otherwise. Distilled water was used throughout the experimental process.

2.2. Preparation of Adsorbents

The adsorbent, PAnAC, was prepared using a previously described method [6]. Typically, a total amount equal to 0.08 mol of aniline monomer was charged into a precooled (in an ice bath of about 5 °C) 1L container of a 0.1 M HNO3 aqueous solution and stirred for 30 min. To the monomer solution, 30 mL of a cold aqueous APS (0.12 mol) solution was added dropwise as an oxidative agent (initiator). The polymeric product immediately appeared; however, the reaction was left overnight, for completeness, at room temperature (23 ± 2 °C). The precipitate was filtered and sequentially washed with ethanol and water to obtain PAn. PAnAC was prepared using KOH as a chemical activating agent. Therefore, PAn was thoroughly mixed with KOH at a mass ratio of 1:4, respectively. Typically, KOH was individually powdered using a pestle and mortar and immediately mixed with the corresponding PAn quantity, with additional homogenization using a plastic spatula. Subsequently, the mixture was subjected to carbonization in a horizontal Carbolite MTF 12/38/250 tube furnace (Walf Laboratories, Hope, England, UK) under the following conditions: nitrogen atmosphere, heating ramp rate of 3 °C/min, activation time of 2 h, and activation temperature of 650 °C. The obtained carbon PAnAC was washed several times using 0.5 M HCl and water until neutrality, followed by drying in an oven at 100 °C overnight.
The surface charges of the adsorbents under investigation were determined using a pH drift method described elsewhere [14]. Initially, a pH series between 1 and 11 was prepared using a buffered solution of 0.1 M NaNO3; the targeted pHs were obtained by the addition of 0.1 M of either HCl or NaOH and denoted as initial pH (pHi). To each 15 mL of these solutions, 15 mg of the adsorbent was added and shaken intermittently for 24 h at room temperature. Adsorbent-free samples were also prepared and treated similarly as references. Subsequently, the adsorbents were filtered and analyzed to determine their final pHs (pHf). The pH measurements were conducted using an Orion 3 Star benchtop pH meter from Thermo Scientific (Beverly, MA, USA). Finally, the pH at which the surface net charge of the adsorbents was zero (pHPZC) was determined by plotting pHi vs. pHf.

2.3. Adsorbate

A stock solution of MO at a concentration of 500 ppm was prepared in distilled water, from which the working solutions were obtained using a dilution method. The pH values of the solutions were determined using a digital pH meter as described above. The concentration of the dye was measured using a U-2910 double-beam ultraviolet/visible (UV/Vis) spectrophotometer (Hitachi, Tokyo, Japan) at room temperature. The wavelength at which the dye adsorption was highest (λmax) was determined first by scanning the full spectrum between 200 and 800 nm against distilled water as a blank, and it was found to be 465 nm. All colorimetric measurements were performed at this λmax. Then, the concentrations were calculated based on the Beer–Lambert law, with reference to a standard curve obtained using 5, 10, 15, 20, and 25 ppm (R2 = 0.9815).

2.4. Characterization

The structural and morphological properties of the adsorbent were evaluated using various techniques. The Brunauer–Emmett–Teller (BET) specific surface area was obtained based on the nitrogen physisorption capacity at 77 K using a Gemini VII2390 V1.03 apparatus (Micromeritics, Norcross, GA, USA), with the instrument operating in single-point and multipoint modes. Prior to analysis, the samples were degassed for 3 h at 150 °C. The electron micrographs were acquired using a scanning electron microscope (SEM) (JSM-6360 LV, JEOL, Tokyo, Japan). A thermogravimetric analysis (TGA) was performed using a Mettler Toledo TGA/DSC 1 Star system (Columbus, OH, USA). The sample was heated from 25 to 800 °C at 25 °C/min under a nitrogen flow of 20 mL/min. The Fourier transform infrared (FTIR) spectra of the adsorbents before and after adsorption were recorded using a Nicolet iS10 (Thermo scientific, Madison, WI, USA) with an attenuated total reflection (ATR) diamond crystal accessory over the range of 4000–500 cm−1, with a resolution of 4 cm−1 and a total of 16 scans per spectrum.

2.5. Modeling of Adsorption Kinetics Processes

Pseudo-first-order (PFO), pseudo-second-order (PSO), Elovich, and intraparticle diffusion (IPD) are the most applied kinetic models for the optimization of sorption process. Thus, in this study, linear and nonlinear forms for MO adsorption onto the targeted activated carbons were adopted to fit the experimental data. The kinetics profiles of the adsorbent PAnAC were compared, with variations in the initial adsorbate MO concentration (C0 = 50, 100, and 200 ppm) and adsorbent dose (20, 40, and 80 mg) at a fixed stirring rate (150 rpm), solution volume (250 mL), and temperature (23 ± 2 °C). The mathematical expressions of the applied models are given in Table 1. The accuracy of the fit of an adsorption model to the experiential data is typically assessed based on the magnitude of correlation coefficient (R2) values. Thus, when approaching unity, the predicted values become closer to the experimental data, which can help in the assessment of the process mechanism and the applicability of the system.

2.5.1. PFO Model

The Lagergren kinetic equation (PFO) is the most widely used for describing a kinetic system. The model is based on the assumption that one site is available for each adsorbate molecule. Moreover, the solute uptake with time is directly proportional to the difference between the equilibrium concentration of the solute and its adsorbed amount with time [15,16]. The linear and nonlinear equations are given in Table 1. The parameters were calculated from the corresponding plot with respect to time, and thus the rate constant k1 (min−1) was determined.

2.5.2. PSO Model

The PSO linear and nonlinear kinetic models are given in Table 1. The models assume two sites on the adsorbent for each adsorbate molecule [17,18] and suggest the dominance of the chemisorption process [19]. Moreover, the reaction rate is dependent on the amount of adsorbate on the surface of the adsorbent [20]. The parameters can be obtained by plotting the experimental qt or t/qt against t. The adsorption rate constant k2, as well as the initial rate (h, mg/(g·min), can be obtained by solving the PSO equations, as shown in Table 1.

2.5.3. Elovich Model

The Elovich equations for linear and nonlinear adsorption kinetics are also given in Table 1. The model assumes that the adsorbent sites are energetically heterogenous and that neither desorption nor interactions between the adsorbed species could substantially affect the kinetics process at low surface coverage [21]. However, the energy of adsorption increases linearly with the surface coverage according to Arrhenius equation [22]. The parameters 𝛼 and 𝛽 are related to the initial rate and the extent of surface coverage, respectively, as given by the model. The latter parameter can be used to assess the chemisorption process.

2.5.4. IPD Model

The adsorbate transfer through the internal porous structure and its actual diffusion in the adsorbate can be followed using the IPD model given by Webber and Morris, as seen in Table 1. The model constants kid and C describe the rate constant and boundary layer, which are useful for identifying the reaction pathway and adsorption mechanism and predicting the rate-controlling step. In short, if the linear slope passes through the origin, the adsorption is entirely governed by the IPD method. Otherwise, the plot may show multilinear regions, which suppose that the adsorption process is controlled by a multistep mechanism [23].

3. Results and Discussion

3.1. Adsorbent Characterization

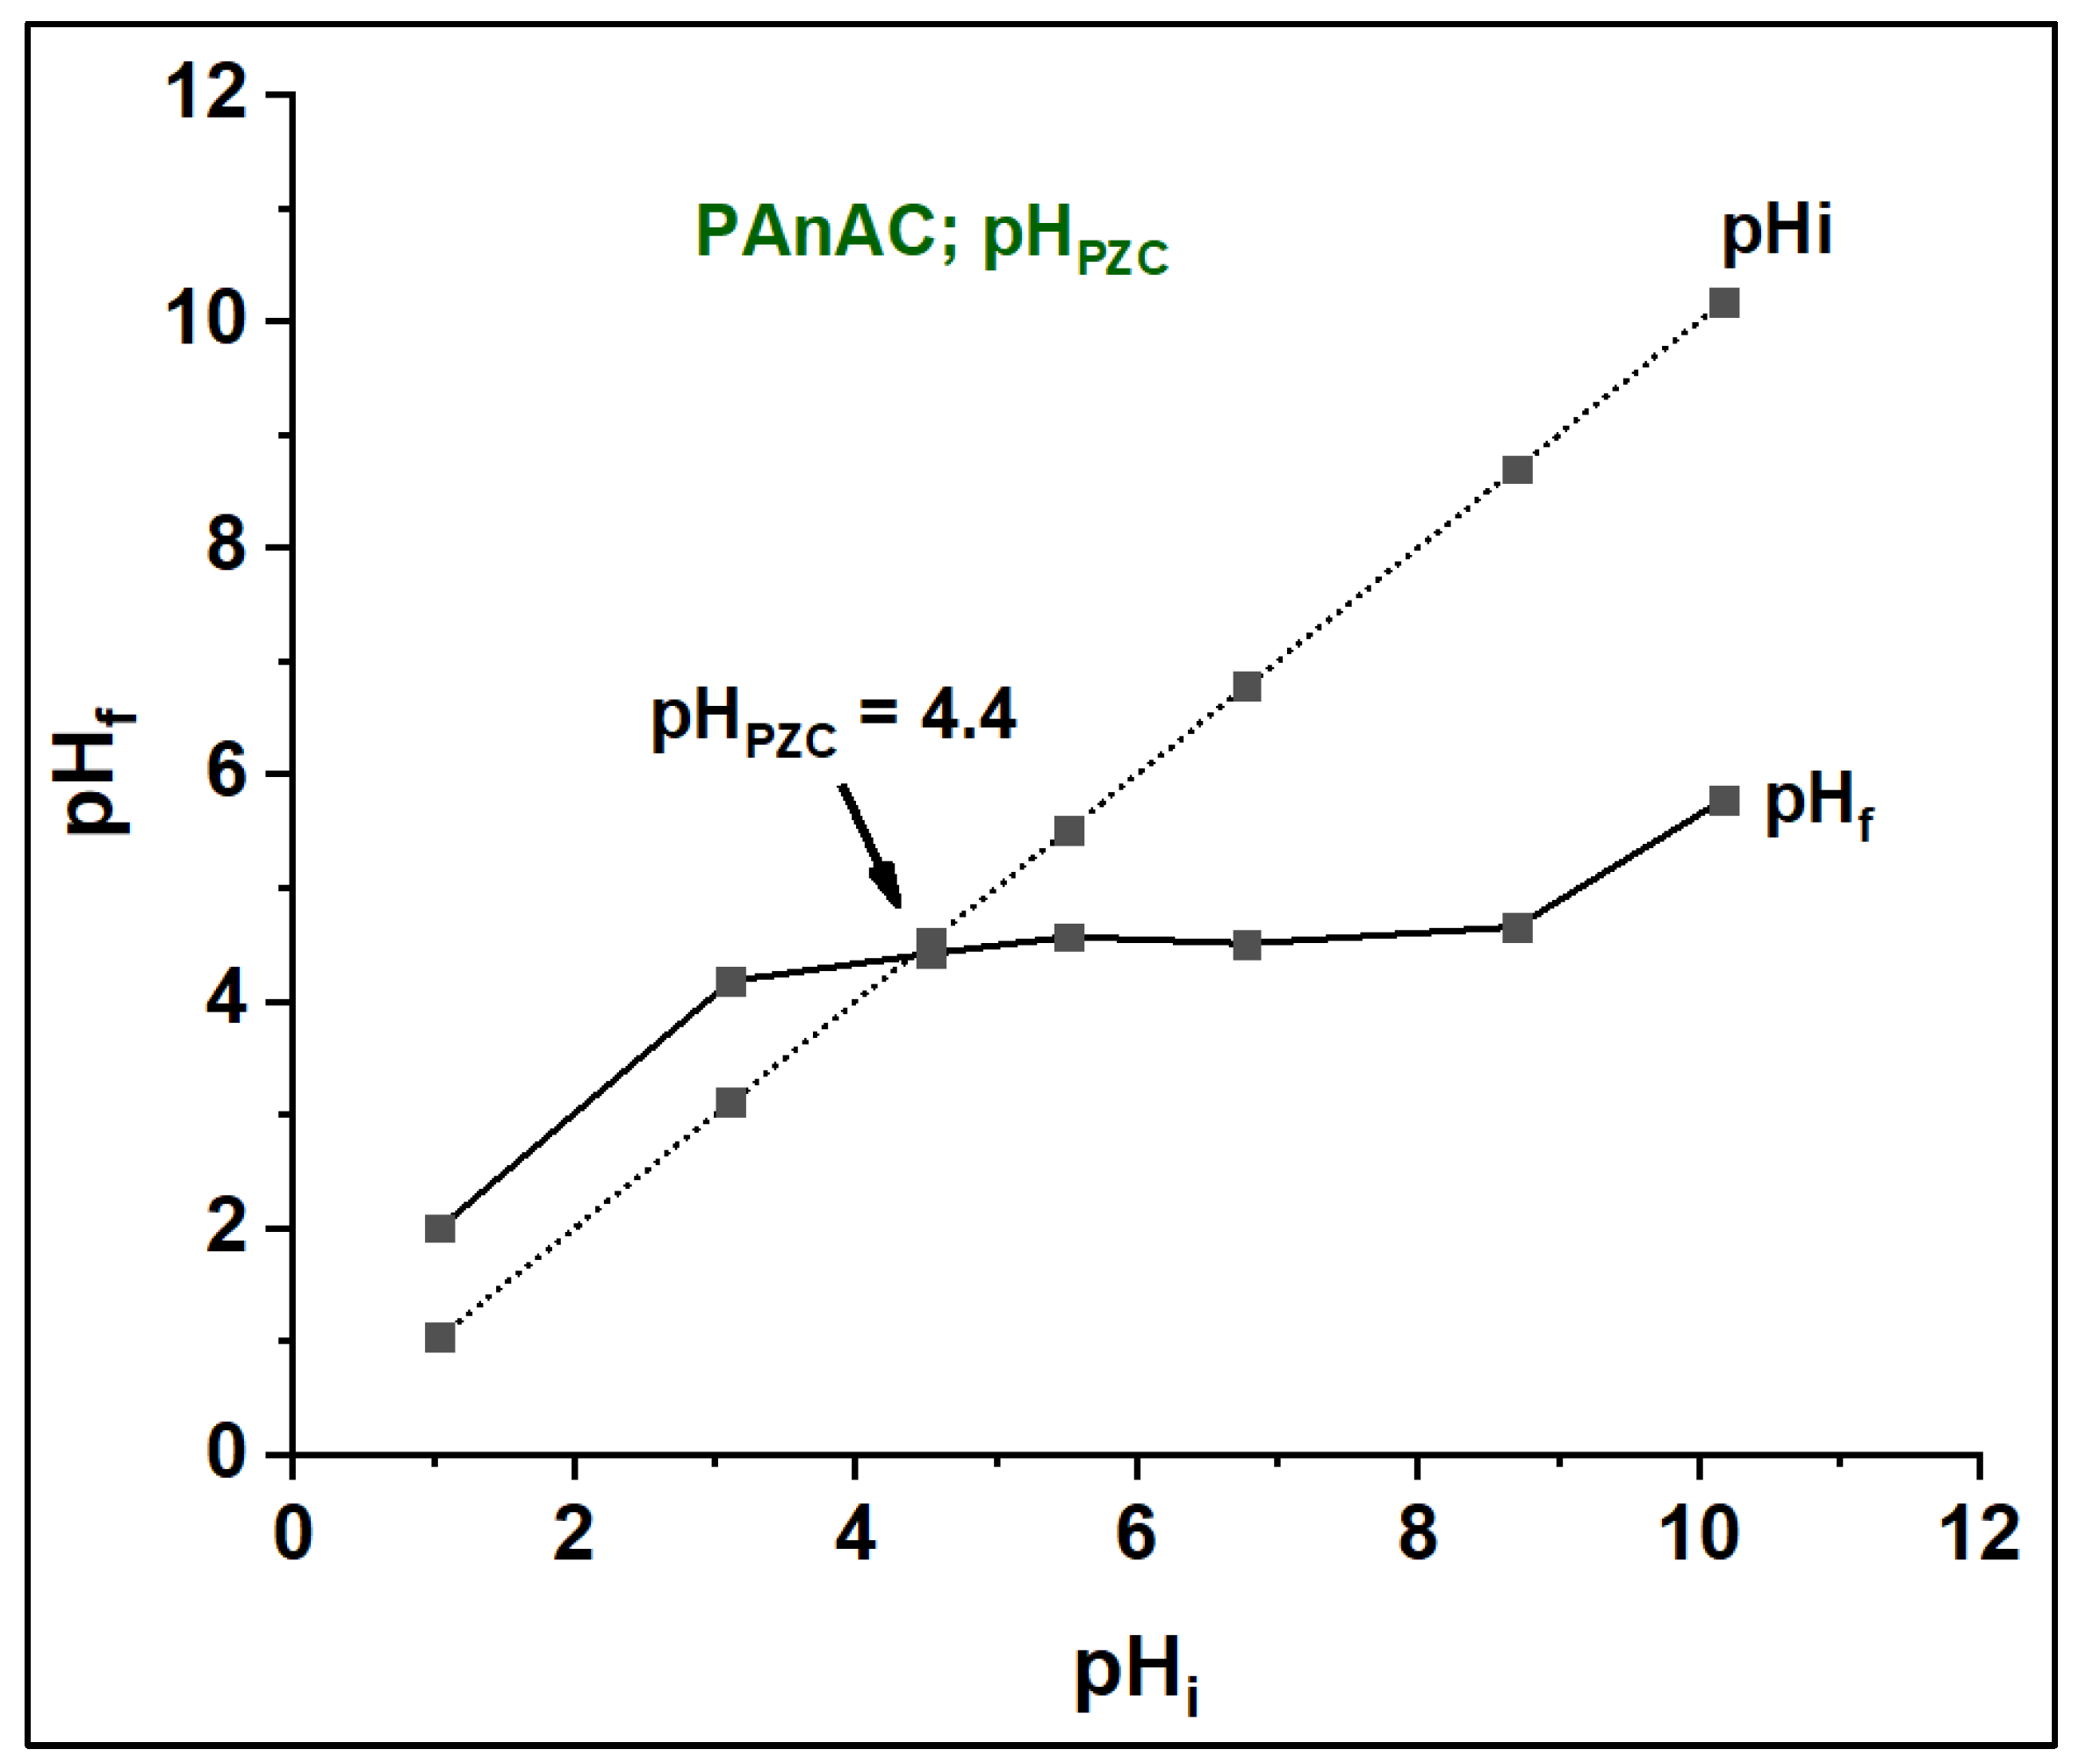
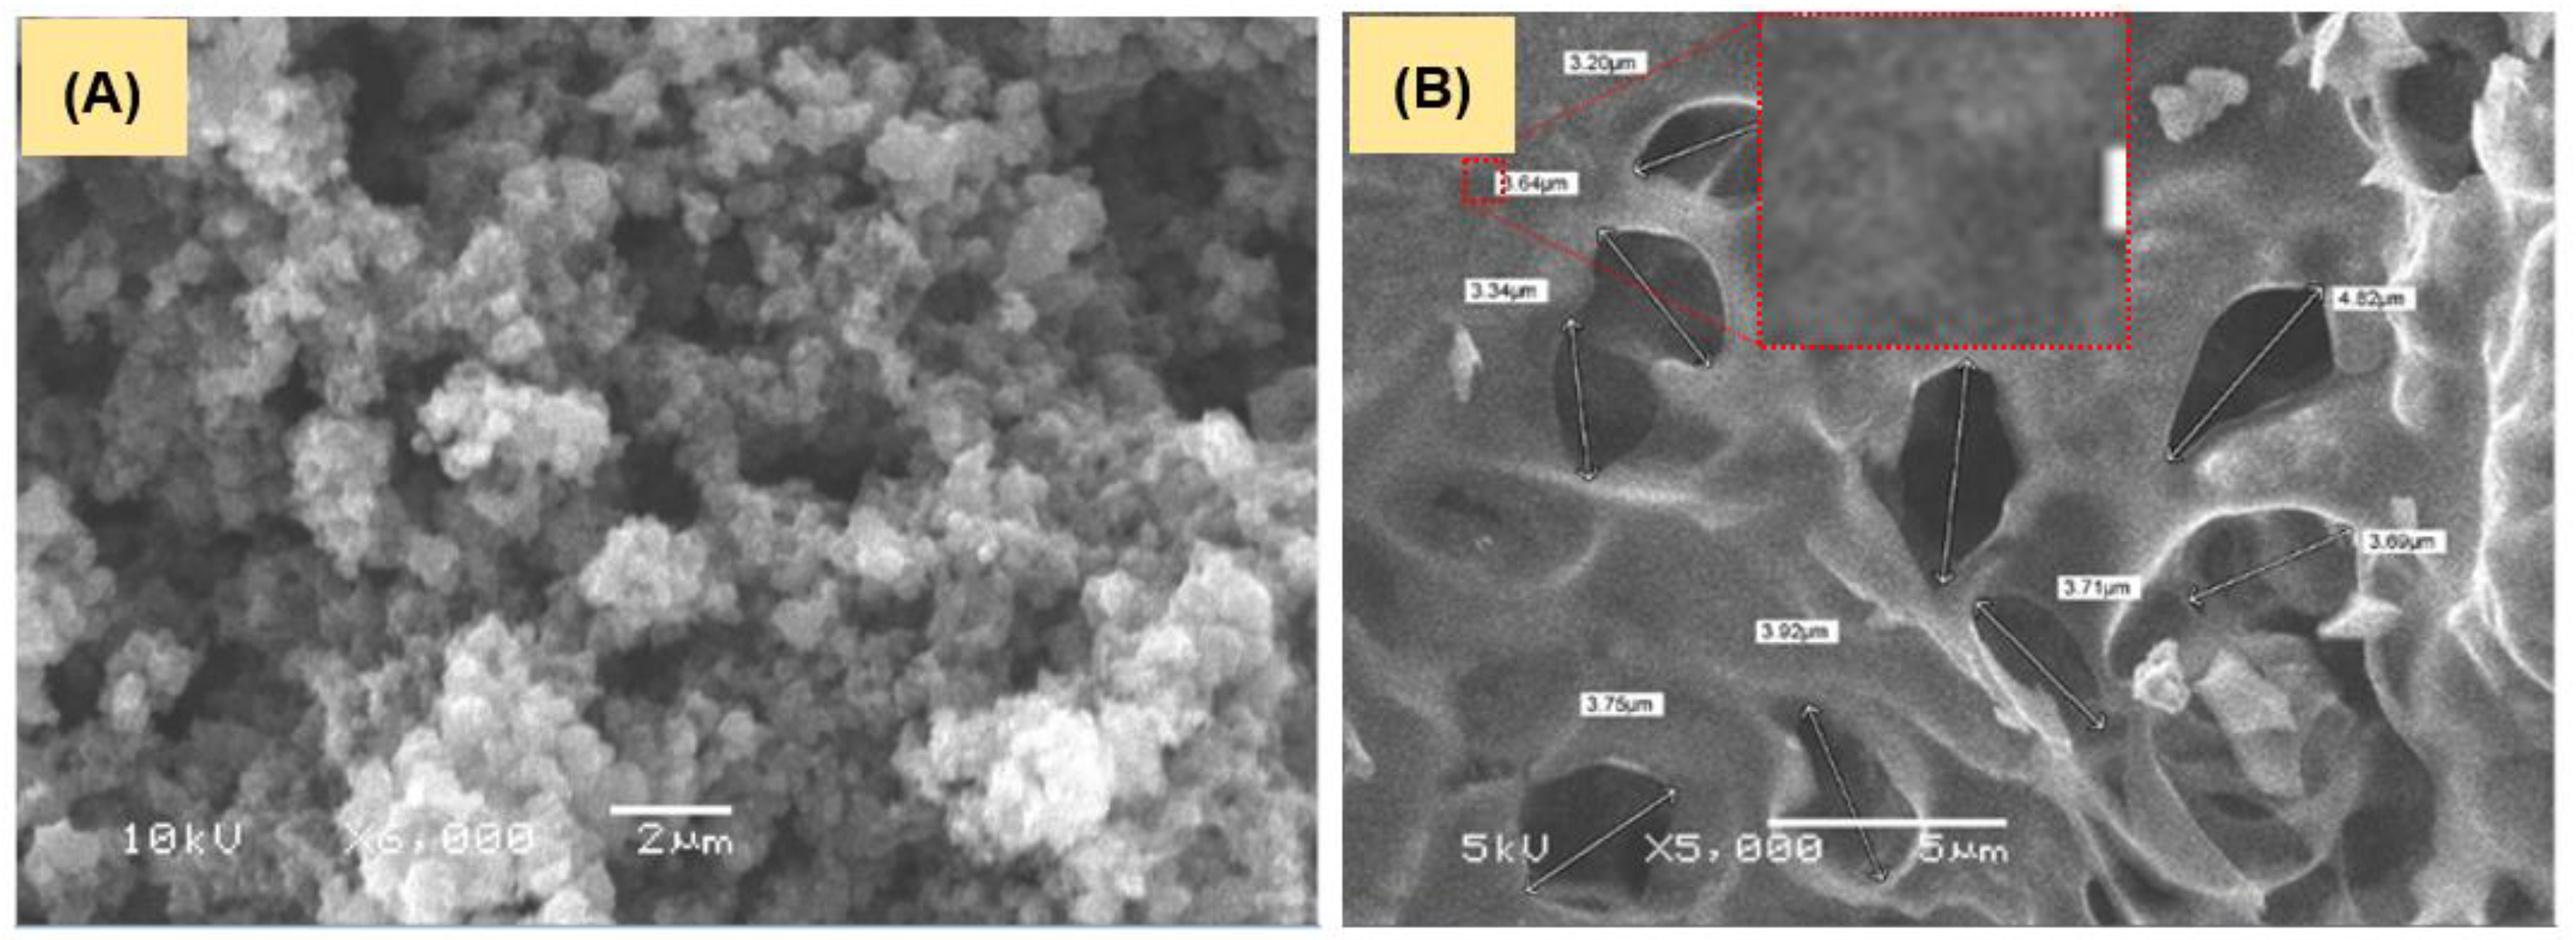
3.1.1. Surface Morphology and Charge

Figure 1 is a schematic presentation of PAn and its corresponding nitrogen-doped graphene oxide (PAnAC) structures. According to the elemental analysis results (Table 2), PAnAC has high amounts of the heteroatoms nitrogen and oxygen, about 18 and 20 wt%, respectively. This suggests the presence of high number of active sites in the adsorbent and thus a high expected adsorption capacity.
The predicted surface charges or, more strictly, the pH at which the estimated surface charge is zero (pHPZC) is shown in Figure 2. This property was analyzed using the basic pH drift method, and accordingly the pHPZC of PAnAC was found to be 4.4. Typically, the surface is neutral at pHPZC, below which the surface charge is positive and above which the surface charge is negative. Basically, MO is a crystalline salt that dissociates in water into an anionic MO moiety and cationic counterparts (commonly Na+). Thus, at a pH below pHPZC, the adsorbent positive surface supported attraction with MO as a negative species, and its efficiency seemingly decreased as the pH value developed up to pHPZC, possibly due to reduced electrostatic repulsion at low pH values. As the adsorption experiments were carried out without pH adjustment (pHs were measured before the addition of the adsorbents at 20 ± 2 °C for MO concentrations of 50, 100, and 200 ppm and were found to be 6.69, 6.25, and 6.13, respectively) and the pHPZC of PAnAC is quite low, its adsorption capacity was high.
Figure 3 shows SEM images of the as-synthesized PAn and PAnAC. The PAn image reveals the typical nanosphere morphology of PAn, which further fused together into microsphere structures, a morphology similar to the previously reported morphology [27]. The SEM micrograph of PAnAC presents a rough structure with a peel with a surface with quite large irregular-shaped pores with a mean internal diameter of 3.7 μm. Despite the low resolution of the adsorbent image in Figure 3B, the zooming shown in the inset could predict a nanocarbon structure and pores.

3.1.2. FTIR Analysis

The spectra of PAn, PAn-based activated carbons before (PAnAC) and after the adsorption of MO (PAnAC-MO), and MO are shown in Figure 4. The spectra of MO, PAn, PPyAC, and PPyAC–MO agreed with the literature [4,28,29]. The MO spectrum displayed peaks at 3626 and 3431 cm−1 for adsorbed water–OH, at 3030 cm−1 (=CH) and 2900–2811 cm−1 (CH3) for stretching vibrations, and at 1519 cm−1 for C–H bending. The aromatic structure of MO was confirmable via ring deformation modes at 1034, 1005, and 846 cm−1, while benzene substitution was assured by the characteristic peak at 816 cm−1 [28]. The Azo moiety was proven by the presence of stretching bands at 1599 (-N=N-) and 1112 cm−1 (-C-N). The sulfonic nature was affirmed by peaks at 1363 and 692 cm−1, assigned to S=O and -C-S- stretching vibrations, respectively. In the spectrum of PAn, the peaks at 1538 and 1456 cm−1 were typical of C=N stretching vibrations.
The characteristic peaks of PAn could be seen at (cm−1) 3219 (NH stretching, reported for protonated form [30]), 3048 (=CH stretching), 2917 (CH3 stretching), 2328 (C=NH-C, immonium), 1569 and 1484 (C=N and C=C stretching in quinoid and benzenoid rings, respectively), 1289 and 1241 cm−1 (C-N-C and C-N stretching), 1036 and 876 cm−1 (C-H bending; its broadening may indicate contributions of peaks from the dopant NO3−), and 792 cm−1 (1,4-disubstituted phenyl ring [31,32]). After adsorption, the absorption of C=N (1557 cm−1) and C-O (1035 cm−1) were shifted to 1539 and 1157 cm−1, respectively, suggesting contributions of nitrogen and oxygen groups in the adsorption mechanism. Furthermore, the additional peaks on the fingerprint region were assigned to MO and supported its attachment to the adsorbent [4].

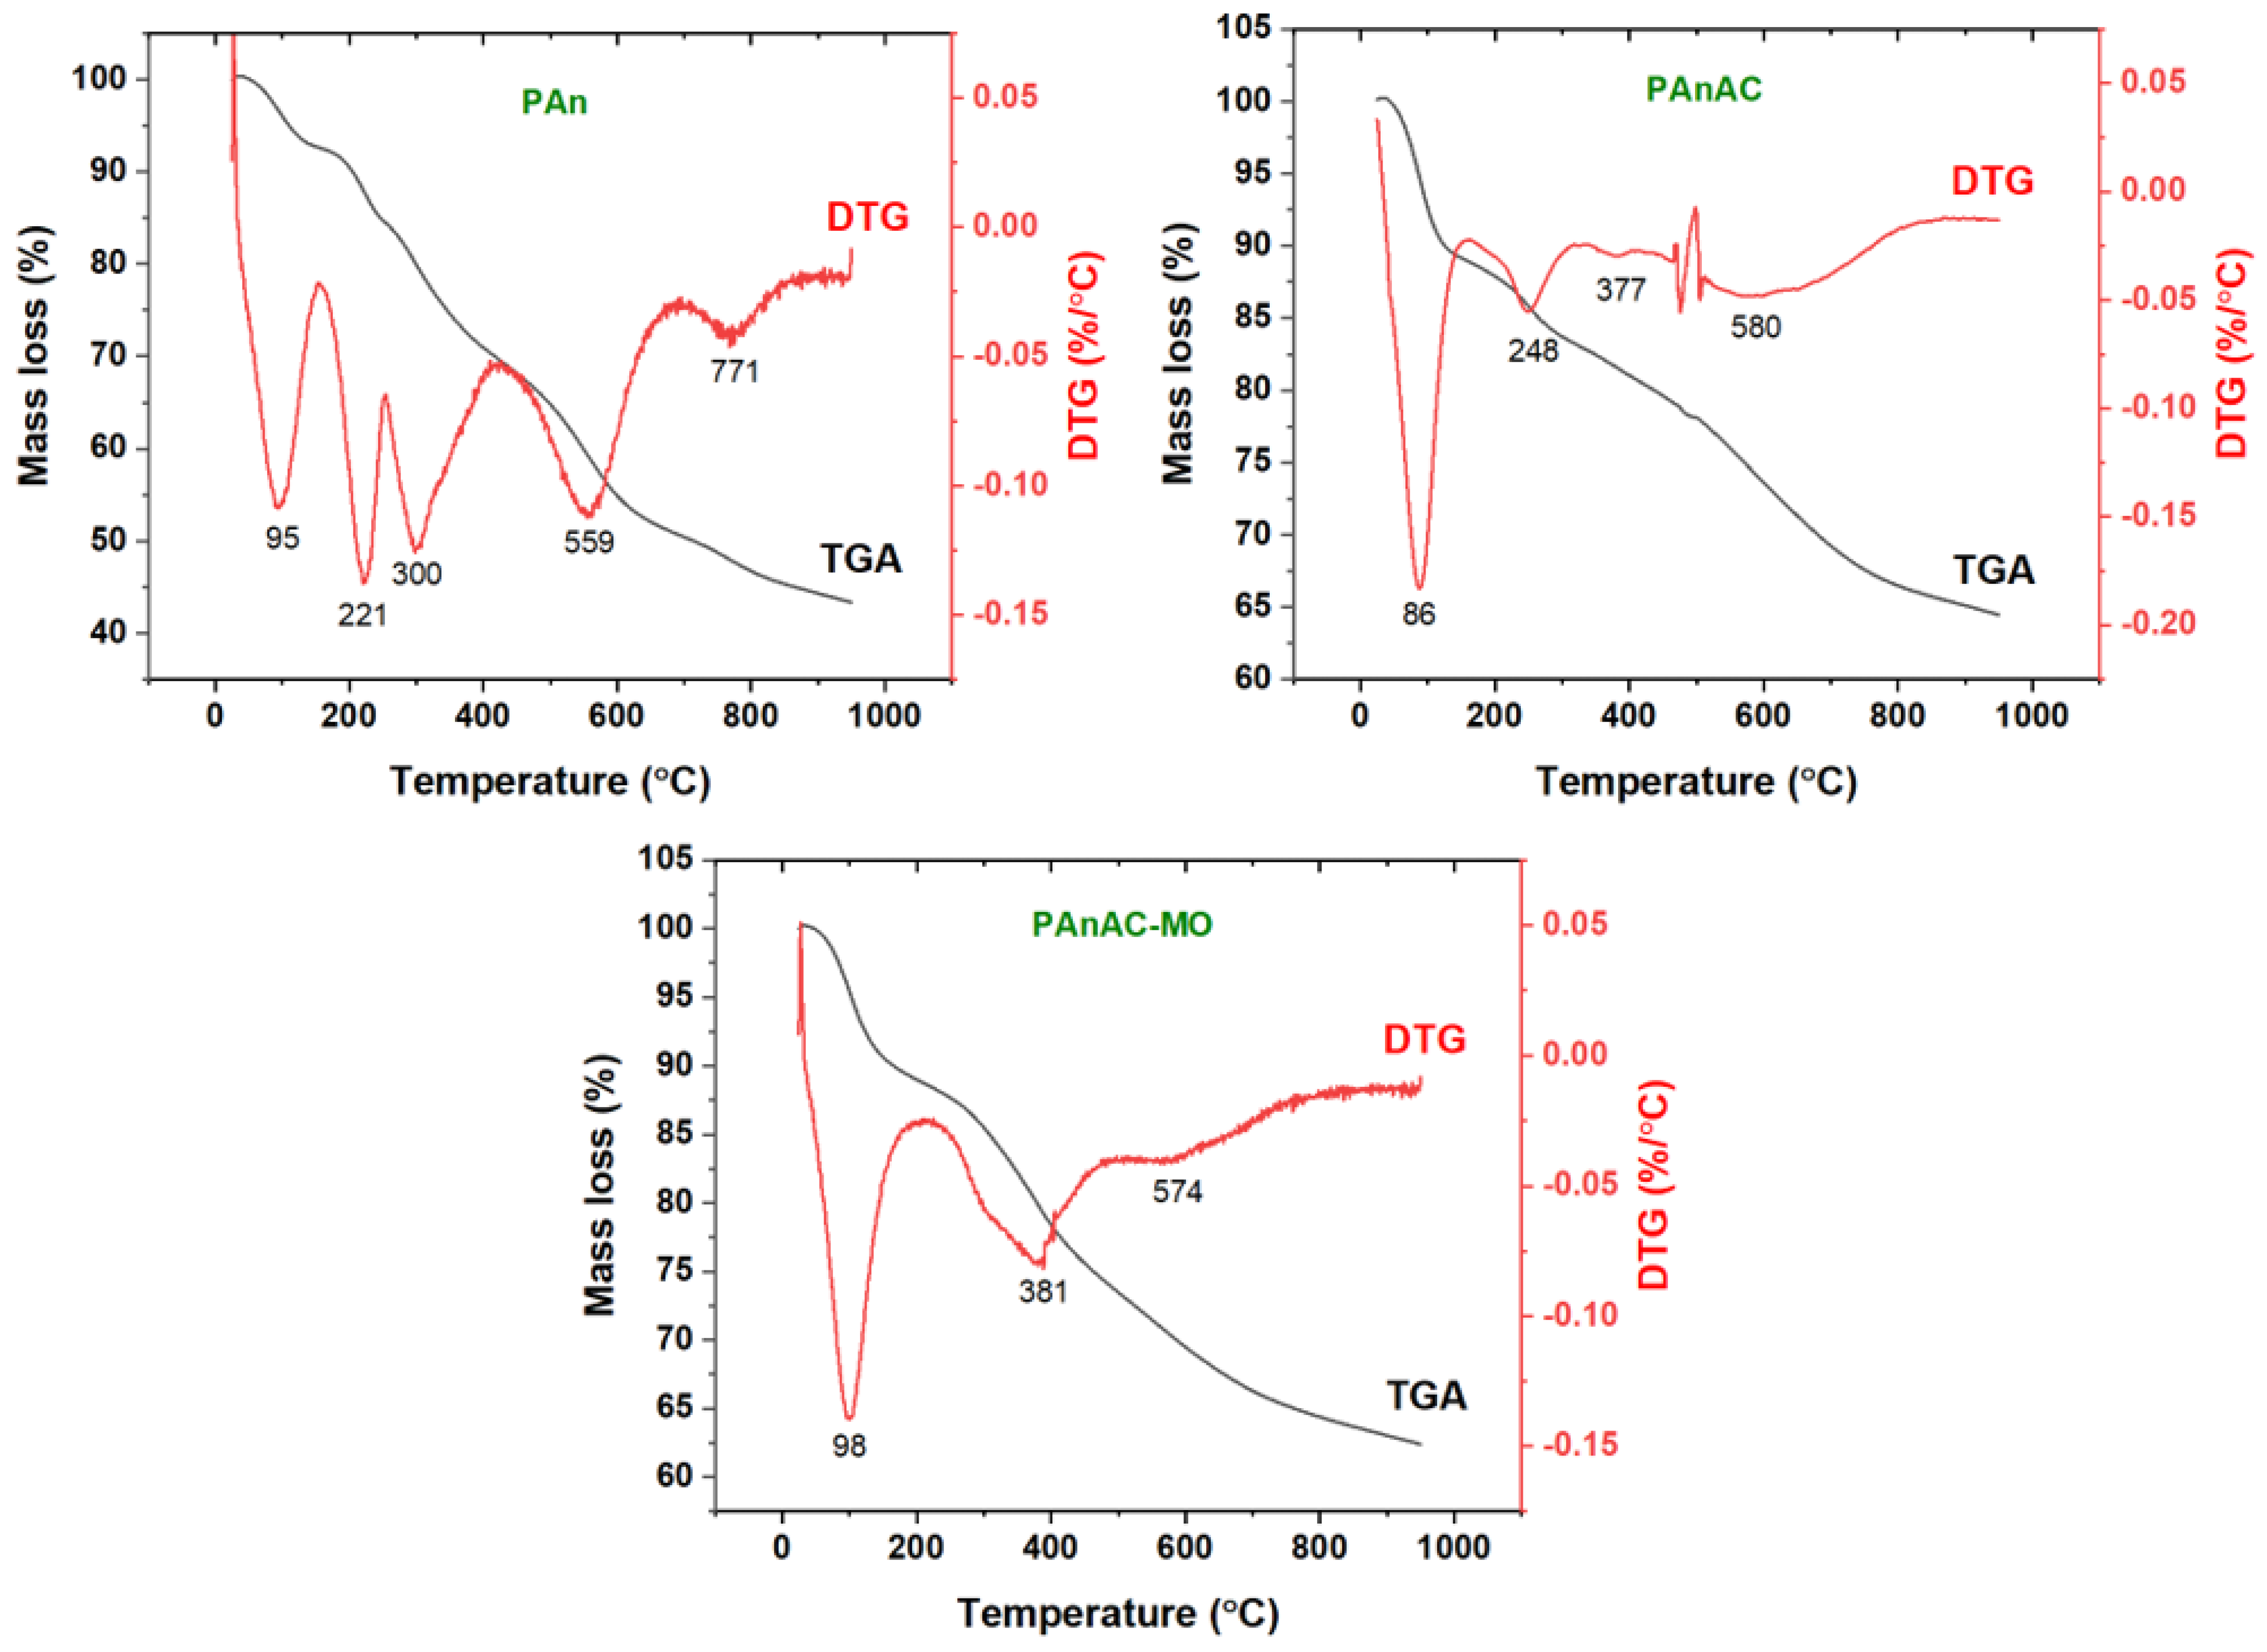
3.1.3. Thermal Analysis

A thermal analysis of PAn, PAnAC, and PAnAC-MO was also carried out. The corresponding thermograms and the predicted decomposition steps are given in Figure 5 and Table 3. As can be seen, the decomposition curves can be generalized in five steps for polymers, four steps for PAnAC, and two steps for MO-loaded PAnAC. The initial TGA decomposition step, with mass losses of 7.4–11.2, was predictably due to the evaporation of volatiles, including adsorbed water and gas molecules, which peaked at 95, 86, and 98 °C in the DTG curves of PAn, PAnAC, and PAnAC-MO, respectively. The next step could be assigned to weak functional groups in the target materials, which were slightly absent in the PAnAC and MO-loaded PAnAC, showing DTG peaks at 221, 248, and 381 °C, respectively, and were supported by the extra steps for PAn. The analysis also revealed residual masses of 43.4, 64.5, and 62.3 %, respectively, at 950 °C, which is consistent with the chemical structures. After adsorption, the trend in the residual carbon content remained the same. However, the values were higher after adsorption, which may have been due to the higher content of adsorbed volatiles in the PAnACs, as assessed by the mass loss percentage in the first step. Additionally, the observed high residue of PAnAC before adsorption may have indicated an incomplete carbonaceous property, suggesting high amounts of heteroatoms.

3.2. Adsorption Studies

3.2.1. Effect of pH

The effect of the solution pH was analyzed under the following conditions: adsorbate MO initial concentration: 200 ppm, MO volume: 25 mL, adsorbent dose: 15 mg, shaking speed: 150 rpm, temperature: 25 °C, and contact time: 24 h. The pH solution was varied between 2 and 10. The results are the averages of two independent experiments. The dependency of the sorption process on the solution pH is depicted in Figure 6. It was found that the adsorption had minimum and maximum values at pHs around 5 and 7, respectively. However, pH 7.1 was close to the untreated pollutant solution (pH 6.4). Therefore, the next experiments were performed without pH adjustments. As can be seen in Figure 6, the adsorption efficiency steadily decreased with a pH increase from 2 to 5.2, then increased and peaked at about pH 7.1 before decreasing rapidly over the remaining pH range of 7.1–10. At a low pH, the adsorbent was highly protonated. Thus, electrostatic attraction with the anionic dye was expected, which decreased as the pH developed up to pHPZC. However, with continued increases in pH, the efficiency increased, and this was mostly due to the contributions of other mechanisms, including physical interactions, rather than electrostatic interactions. This case was again observed beyond the peak of pH 7.1; that is, a drop in efficiency occurred due to the electrostatic repulsion between the negatively charge surface and the anionic dye. Furthermore, it is likely that the competition between dye molecules and hydroxide ions for adsorption onto PAnAC may explain the sharp decline in the adsorption in the basic range of pHs [33].

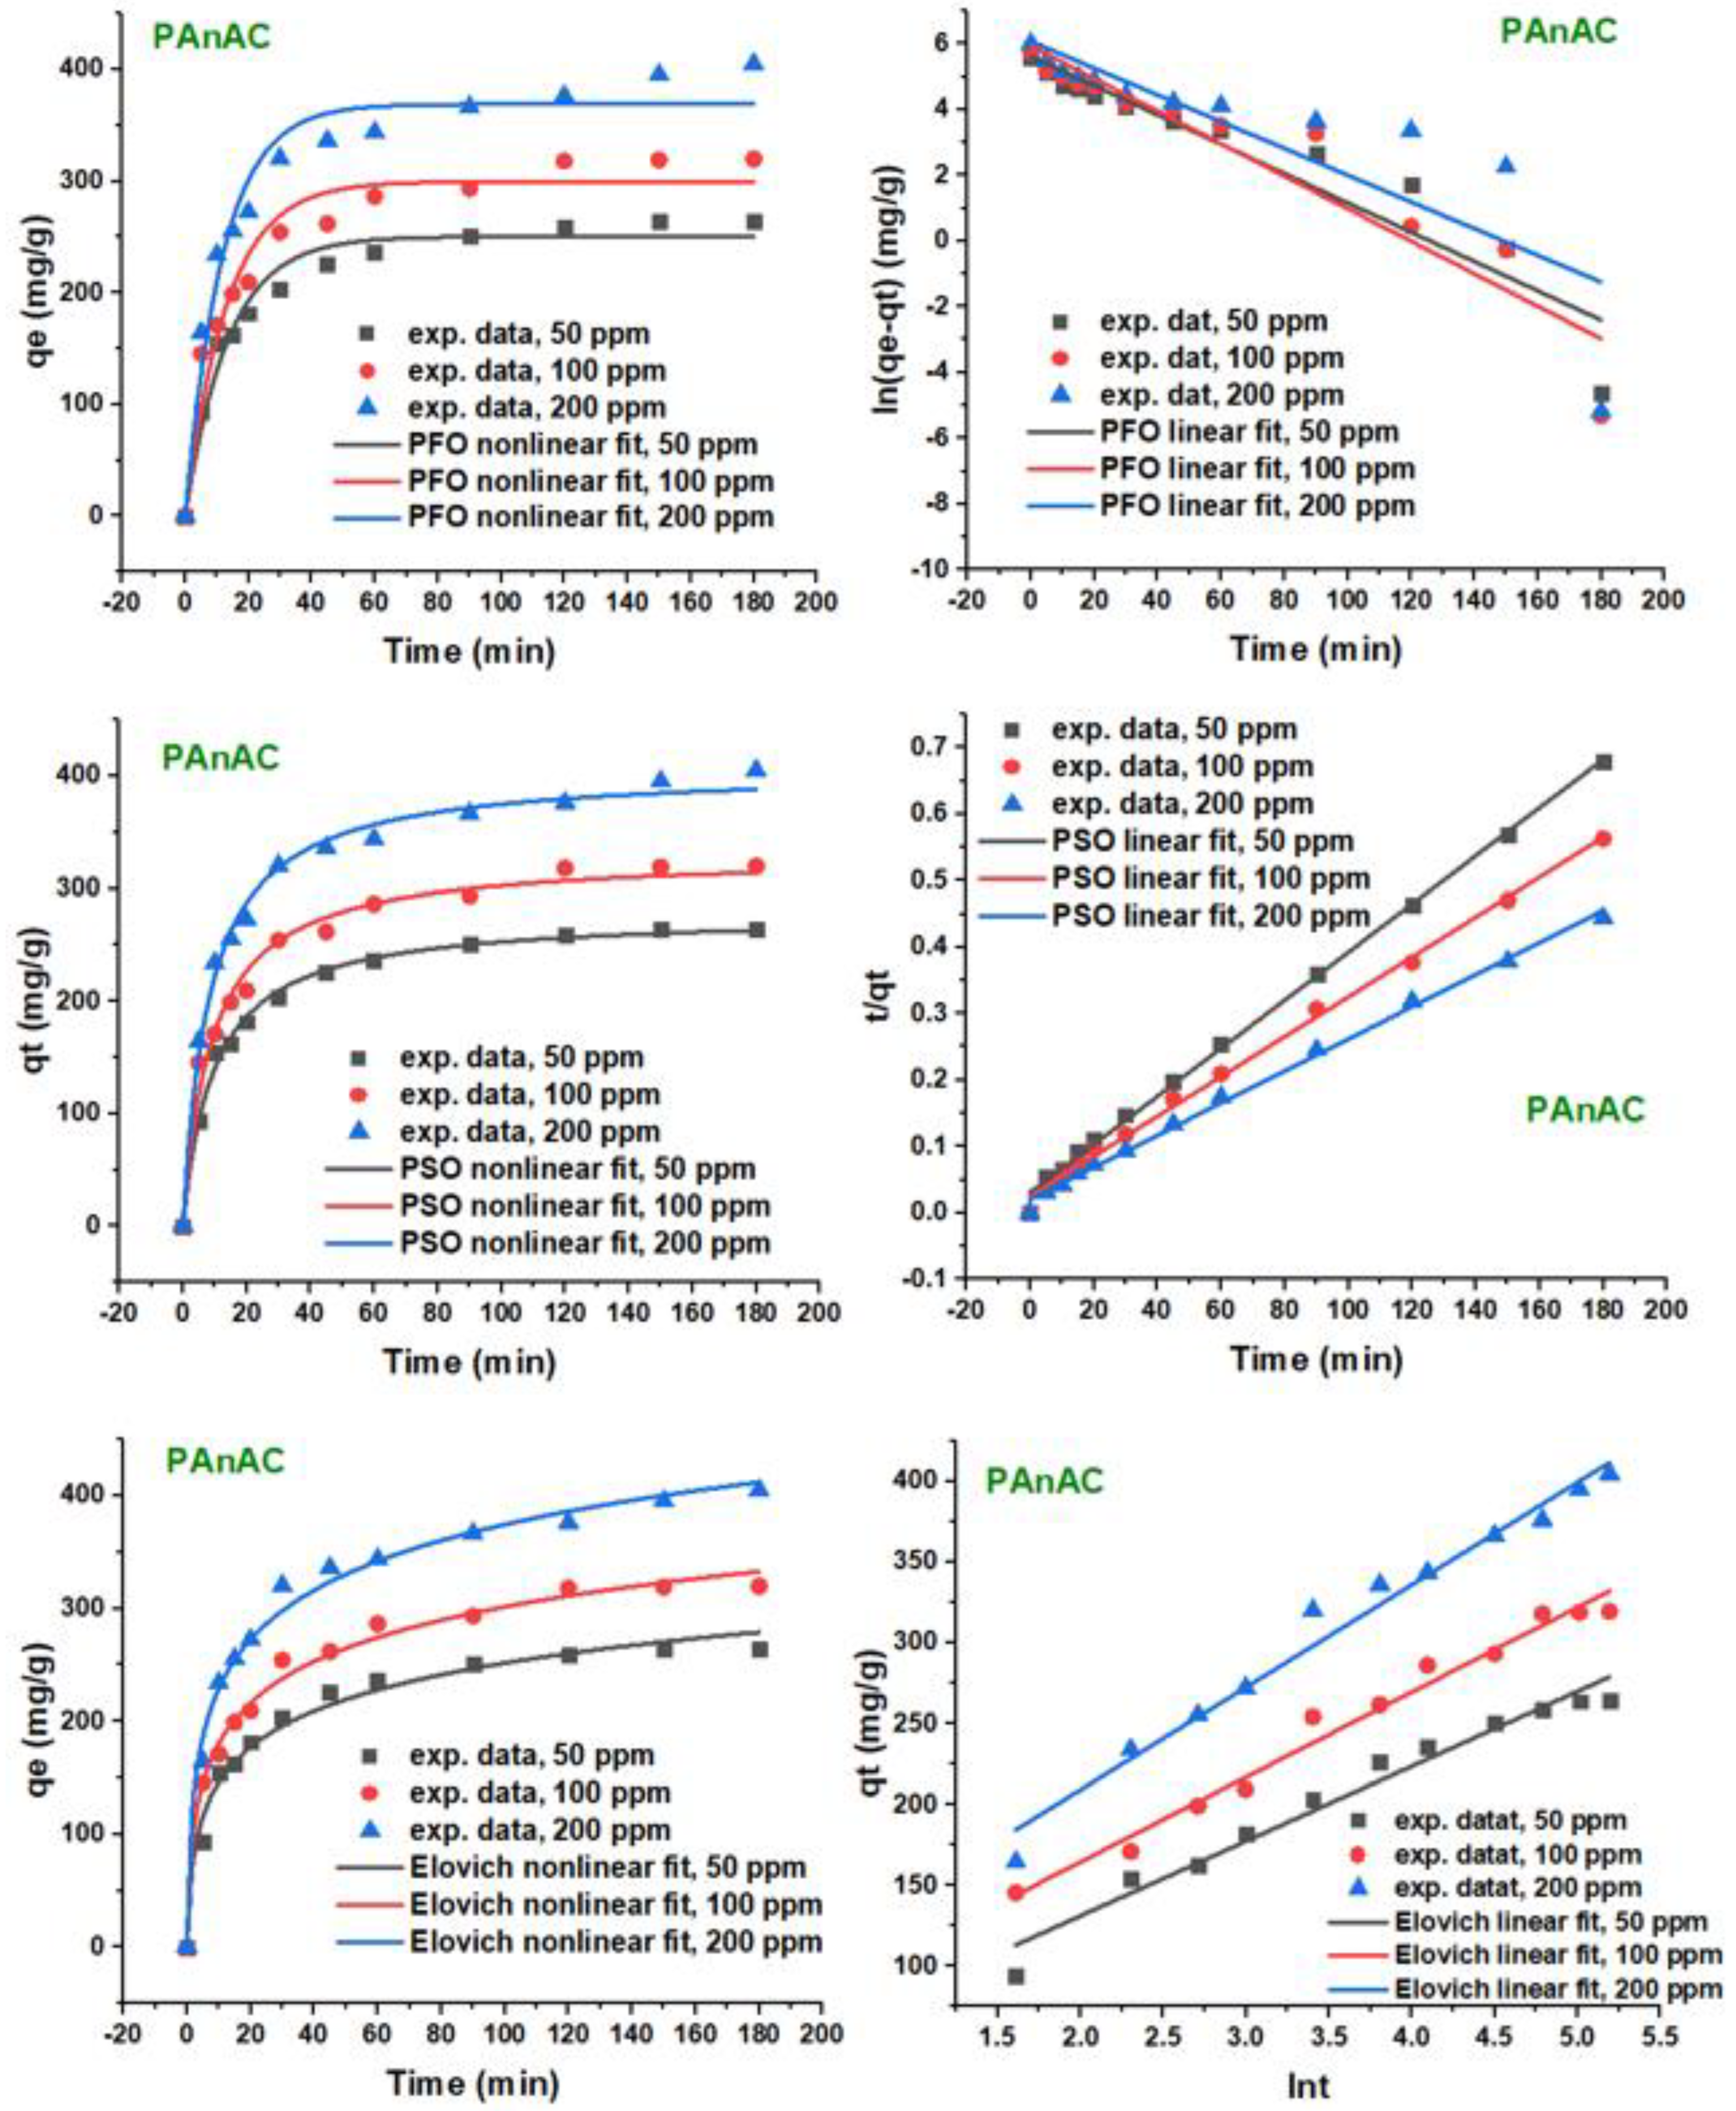
3.2.2. Kinetic Studies: Effect of Adsorbate Concentration

The adsorption kinetic courses of MO at initial concentrations of 50, 100, and 200 ppm onto PAnAC at a dosage of 40 mg were evaluated over the predetermined contact time of 0–180 min at a fixed agitation speed of 150 rpm, a temperature of 23 °C, and a pH of 6.4. In all experiments, 250 mL batches of MO were used, and a 3 mL portion was withdrawn at predefined intervals, then centrifuged, measured for the remaining MO concentration, suspended again, and returned to the main adsorption solution. The results were modeled using the linear and nonlinear equations of PFO, PSO, and Elovich kinetics for comparison. In addition, IPD was utilized to help with the adsorption mechanism assessment.
Figure 7 and Figure 8 show the applied kinetic models at varied MO initial concentrations, and the corresponding parameters are summarized in Table 4 and Table 5. As can be seen, the adsorption rates in the initial period, assessed before 30 min, for the three C0 values were fast, where more than two thirds of the adsorbents were occupied with MO molecules. This reveals that the adsorption occurred on the adsorbent surface and was governed by charge interactions [4]. Following the first stage, the adsorption developed slowly but quickly reached the equilibrium at ca. 60 min.
By increasing the MO adsorbate concentration from 50 to 200, the uptake rate become slower, and the equilibrium point was delayed accordingly. The capacity was found to be increased with an initial MO concentration increase. For example, the experimental capacity (qe,exp) of PAnAC was increased from 264.7 to 405.0 (mg/g) as MO C0 increased from 50 to 200 ppm. These results are in accordance with the physical properties observed for the adsorbent, including the surface area and nitrogen contents. Furthermore, it was found that the lower the dye concentration, the quicker the equilibrium was reached and the lower the capacity of the adsorbent.
As noted in Table 4 and Table 5, in which the kinetic parameters of the four models (PFO, PSO, Elovich, and IPD) are presented, the values of qe,exp were closer to qe,calc from PSO than that from PFO. In addition, the coefficient of determination (R2) indicated the goodness of fit to be in the order of PSO > Elovich > PFO. Comparing the linear and nonlinear models, it was clear that the linear model established a poor R2 and an overestimation of the capacity compared to the nonlinear equations. This suggested that the nonlinear PSO model was more appropriate for describing the experimental data. Further, the k2 constant increased with an MO increase, a result that was consistent with the justified thought that the adsorption rate constants are inversely proportional to the initial adsorbate concentration; however, this was not the case for some results, as previously noted [34].
The IPD model is depicted in Figure 8, and the corresponding data are summarized in Table 5. It is clear that the data linearity is poor, indicating less effect of the model on the rate-controlling step. Furthermore, the intercept deviation from the origin suggests another mechanism, such as film diffusion. The overall pattern of the IPD data supports a two-stage mechanism. A first stage with lower values for the intercepts compared to the second stage indicates adsorption controlled by the boundary layers, while the slower rates in the second stage suggest intraparticle diffusion and an equilibrium process. The effect of the IPD mechanism may be higher at a higher C0 concentration, as revealed by both C1 and C2 values being higher for C2 (Table 5) and increasing as C0 increased.

3.2.3. Kinetic Studies: Effect of Adsorbent Dose

Kinetic studies with variation in the adsorbent dosage (20, 40, and 80 mg per 250 mL of MO solution volume) were also conducted. The adsorption profiles for the kinetic capacity over time are depicted in Figure 9. As can be seen, the adsorption was initially fast in a manner similar to that illustrated in Figure 7, e.g., up to 30 min. Then, adsorption developed slower up to equilibrium. The calculated experimental capacity of PAnAC was found to decrease as the dosage quantity increased, with values of 320.09, 319.73, and 287.73 g/mg when the PAnAC doses were 20, 40, and 80 mg, respectively, as summarized in Table 6.

3.3. Adsorption-Based Mechanism

Adsorption kinetics provide insight into the reaction rate and the sorption mechanism, involving mass transfer, diffusion, and the reaction that occurred on the adsorbent surface during adsorption. It is a time-dependent process that consists of several phases, such as (i) an outer diffusion stage during which the sorbate molecules transfer across the liquid film to the adsorbent exterior surface; (ii) intraparticle diffusion, involving the transportation of adsorbate particles from the adsorbent exterior surface to its internal pores; and (iii) the interaction process, with the formation of physical or chemical bonds at the active centers in the pores. However, the interaction step is commonly fast and cannot be treated as rate-limiting [4,35]. Thus, the mechanism is an important descriptor for better understanding the adsorption process. As supposed by data related to kinetic adsorption, the adsorption was mainly PSO. Thus, multilayer coverage and a chemisorption process are supported. The initial sorption rates could be assessed using the PSO and Elovich models through the constants h and 𝛼, which were calculated to be 28.5–49.5 and 101.2–223.1 (mg/(g·min)), respectively, and their values increased as MO C0 increased. The IPD, according to the Weber–Morris model, illustrated that if it is the rate-controlling factor, the plot of qt vs. t0.5 will go through the origin. However, the IPD deviation from the origin indicated that IPD is not the sole rate-controlling step and that two processes had taken place [35]. As seen in Figure 8, two linear portions can be identified in the IPD plot, which supports the participation of other mechanisms, including the film diffusion mechanism. Furthermore, IPD intercept C showed a faster process in the initial stage of adsorption, as indicated by the smaller C1 compared to C2, and both increased as C0 increased, suggesting a concentration-dependent process. Generally, beside the diffusion process, many other factors can play essential roles in the adsorption process, including the adsorbate structure and the associated functional groups, the textural and surface properties of the adsorbents, and the nature of the adsorbate–adsorbent interaction [36].
The proposed mechanism for MO adsorption onto PAnAC is depicted in Figure 10. As can be seen, the structural properties could support electrostatic attraction the most. The adsorption was performed in the yellow phase of MO at a working solution pH of 7.1. The MO indicator is on its azo-structure, which has a salty structure and is therefore anionic in solution. This is consistent with the results of the pH effect, in which the adsorption decreased as pH increased from 2 to 5. With the solution pH varying from 5 to 7, beside the electrostatics caused by the weak acidic nature of the solution, the molecular form of MO may drive the adsorption capacity increase as well and support the contribution of physical and some other types of adsorption mechanisms (e.g., mechanical) via hydrogen bonding and possible pore tracing events. Above pH 7, the PAnAC surface became more negative, while the OH molecules became dominant and effectively competed with the anionic MO molecules for adsorption onto PAnAC, leading to a substantial drop in the adsorption capacity at the end.
As in Figure 4, additional peaks emerging between 1150 and 820 cm−1 for MO rings confirmed adsorption. The peak at PAnAC 1690 cm−1 assigned to C=O stretching (or OH bending) was down-shifted to 1575 cm−1 due to an interaction with MO. This suggests contributions of such functional groups (e.g., C=O, OH, NH, N=N, and N=C) in the adsorption mechanism, and thus chemosorption cannot be ignored. As the adsorption kinetics supposed a PSO mechanism, some MO–MO interactions could be suggested as well. These types of interactions include ionic and π–π interactions, as shown in Figure 10.
Table 7 compares the adsorption performance of PAn and some of the commercial and synthetic activated carbons reported in the literature with PAnAC in terms of their adsorption capacities. For appropriate and easy comparison, adsorbents from the literature were selected based on their similar structures and close adsorption conditions to PAnAC, and their application was also the removal of azo dyes. It is noteworthy that the listed capacities were primarily based on kinetic data. As can be seen, the adsorption performances of commercial ACs in the removal of azo dyes, e.g., reactive violet 5 [37,38] and MO [39], was enhanced after modification, suggesting better performance for synthetic ACs. Furthermore, Khattabi et al. [40] also demonstrated the moderate performance of commercially obtained activated carbon with a capacity (qe) of 96 mg/g; however, the capacity of PAnAC is seemingly well positioned in the list and surpasses most adsorbents. The adsorption performance of PAn and PAn/metal oxide composites [41,42,43] was low (22–111 mg/g) compared to the listed ACs (commercials: 96–267 mg/g; synthetics: 400–482 mg/g) and PAnAC (406 mg/g). Interestingly, the nitrogen-doped AC revealed a better performance than the undoped one, with capacities of 135 and 120 mg/g, respectively, supporting the argument that activated carbons doped with nitrogen are more active, as nitrogen may provide the AC with additional effective N-based functional groups, thus increasing the number of active sites to adsorb ionic substances, including organic dyes.

4. Conclusions

A nitrogen-rich activated carbon (PAnAC) was prepared from a PAn precursor. Its structural and morphological properties, confirmed by FTIR, SEM, BET, TGA, and elemental analysis, evidently support its applicability as an efficient adsorbent for water treatment. The adsorption performance was evaluated in terms of the kinetic behavior of methyl orange (MO) adsorbing onto PAnAC at various MO C0 values and PAnAC doses. The results indicated better fit to the PSO model than the PFO and Elovich models, suggesting chemisorption and a multilayer process with a rate-limiting step controlled by both film and intraparticle diffusions. Under the applied conditions of pH 7.1, room temperature, and 150 rpm agitation, the kinetic profile revealed fast adsorption over the first 30 min. Then, the rate decreased and reached equilibrium after nearly 60 min. The adsorption capacity (qe) was found to be solute- and sorbent-dependent, being higher at higher MO concentrations and lower PAnAC dosages. It was optimal at a pH of 7.1, an MO C0 of 200 ppm, and a PAnAC dose of 40 mg, with a value of 405.6 mg/g. Data of the kinetics favored PSO rather than PFO or Elovich, assuming a chemisorption process on a heterogenous surface, and IPD supported a partial contribution of mass transfer and IPD mechanisms, with a limiting step partially controlled by mass transfer and IPD processes. Therefore, the method of preparation can be extended to similar polymeric wastes for their conversion into valuable materials, including in the water treatment field.

Author Contributions

Investigation, A.-B.A.-O., F.S.A. and W.S.S.; Methodology, A.-B.A.-O. and F.S.A.; Validation, A.-B.A.-O.; Visualization, A.-B.A.-O.; Writing—original draft, A.-B.A.-O.; Writing—review and editing, A.-B.A.-O. All authors have read and agreed to the published version of the manuscript.

Funding

This research received no external funding.

Institutional Review Board Statement

Not applicable.

Informed Consent Statement

Not applicable.

Data Availability Statement

The data that support the findings of this study are included within the article.

Acknowledgments

The authors would like to extend their sincere appreciation to the Researchers Supporting Project number (RSPD2023R703), King Saud University, Riyadh, Saudi Arabia.

Conflicts of Interest

The authors declare no conflict of interest.

References

  1. Jayaswal, K.; Sahu, V.; Gurjar, B. Water pollution, human health and remediation. In Water Remediation; Springer: Berlin, Germany, 2018; pp. 11–27. [Google Scholar]
  2. Hairom, N.H.H.; Soon, C.F.; Mohamed, R.M.S.R.; Morsin, M.; Zainal, N.; Nayan, N.; Zulkifli, C.Z.; Harun, N.H. A review of nanotechnological applications to detect and control surface water pollution. Environ. Technol. Innov. 2021, 24, 102032. [Google Scholar] [CrossRef]
  3. Iyinbor, A.; Adebesin, B.; Abimbola, O.; Adelani-Akande, A. Water pollution: Effects, prevention and climatic impact. Water Chall. Urban. World 2018, 33, 33–47. [Google Scholar]
  4. Alghamdi, A.A.; Al-Odayni, A.-B.; Saeed, W.S.; Almutairi, M.S.; Alharthi, F.A.; Aouak, T.; Al-Kahtani, A. Adsorption of azo dye methyl orange from aqueous solutions using alkali-activated polypyrrole-based graphene oxide. Molecules 2019, 24, 3685. [Google Scholar] [CrossRef] [PubMed]
  5. Rajabi, M.; Mahanpoor, K.; Moradi, O. Removal of dye molecules from aqueous solution by carbon nanotubes and carbon nanotube functional groups: Critical review. Rsc Adv. 2017, 7, 47083–47090. [Google Scholar] [CrossRef]
  6. Alghamdi, A.A.; Al-Odayni, A.-B.; Saeed, W.S.; Al-Kahtani, A.; Alharthi, F.A.; Aouak, T. Efficient adsorption of lead (II) from aqueous phase solutions using polypyrrole-based activated carbon. Materials 2019, 12, 2020. [Google Scholar] [CrossRef] [PubMed]
  7. Zhou, Y.; Lu, J.; Zhou, Y.; Liu, Y. Recent advances for dyes removal using novel adsorbents: A review. Environ. Pollut. 2019, 252, 352–365. [Google Scholar] [CrossRef] [PubMed]
  8. Zandi-Mehri, E.; Taghavi, L.; Moeinpour, F.; Khosravi, I.; Ghasemi, S. Facile application of OH-ended triazinic dendrimer/halloysite nanotube for removal of methylene blue with a high capacity. Int. J. Environ. Anal. Chem. 2022, 102, 4768–4783. [Google Scholar] [CrossRef]
  9. Iwuozor, K.O.; Ighalo, J.O.; Emenike, E.C.; Ogunfowora, L.A.; Igwegbe, C.A. Adsorption of methyl orange: A review on adsorbent performance. Curr. Res. Green Sustain. Chem. 2021, 4, 100179. [Google Scholar] [CrossRef]
  10. Gupta, V. Application of low-cost adsorbents for dye removal—A review. J. Environ. Manag. 2009, 90, 2313–2342. [Google Scholar] [CrossRef]
  11. Tarmahi, M.H.; Moeinpour, F. Phosphate removal from aqueous solutions using polyaniline/Ni0. 5Zn0. 5Fe2O4 magnetic nanocomposite. Environ. Health Eng. Manag. J. 2017, 4, 65–71. [Google Scholar] [CrossRef]
  12. Nourmoradi, H.; Nikaeen, M.; Khiadani, M. Removal of benzene, toluene, ethylbenzene and xylene (BTEX) from aqueous solutions by montmorillonite modified with nonionic surfactant: Equilibrium, kinetic and thermodynamic study. Chem. Eng. J. 2012, 191, 341–348. [Google Scholar] [CrossRef]
  13. Heidarinejad, Z.; Dehghani, M.H.; Heidari, M.; Javedan, G.; Ali, I.; Sillanpää, M. Methods for preparation and activation of activated carbon: A review. Environ. Chem. Lett. 2020, 18, 393–415. [Google Scholar] [CrossRef]
  14. Doke, K.; Yusufi, M.; Joseph, R.; Khan, E. Comparative adsorption of crystal violet and congo red onto ZnCl2 activated carbon. J. Dispers. Sci. Technol. 2016, 37, 1671–1681. [Google Scholar] [CrossRef]
  15. Dey, A.; Singh, R.; Purkait, M. Cobalt ferrite nanoparticles aggregated schwertmannite: A novel adsorbent for the efficient removal of arsenic. J. Water Process Eng. 2014, 3, 1–9. [Google Scholar] [CrossRef]
  16. López-Luna, J.; Ramírez-Montes, L.E.; Martinez-Vargas, S.; Martínez, A.I.; Mijangos-Ricardez, O.F.; González-Chávez, M.d.C.A.; Carrillo-González, R.; Solís-Domínguez, F.A.; Cuevas-Díaz, M.d.C.; Vázquez-Hipólito, V. Linear and nonlinear kinetic and isotherm adsorption models for arsenic removal by manganese ferrite nanoparticles. SN Appl. Sci. 2019, 1, 950. [Google Scholar] [CrossRef]
  17. Tejada, C.; Herrera, A.; Ruiz, E. Kinetic and isotherms of biosorption of Hg (II) using citric acid treated residual materials. Ing. Y Compet. 2016, 18, 117–127. [Google Scholar] [CrossRef]
  18. Shikuku, V.O.; Zanella, R.; Kowenje, C.O.; Donato, F.F.; Bandeira, N.M.; Prestes, O.D. Single and binary adsorption of sulfonamide antibiotics onto iron-modified clay: Linear and nonlinear isotherms, kinetics, thermodynamics, and mechanistic studies. Appl. Water Sci. 2018, 8, 175. [Google Scholar] [CrossRef]
  19. Belhamdi, B.; Merzougui, Z.; Trari, M.; Addoun, A. A kinetic, equilibrium and thermodynamic study of l-phenylalanine adsorption using activated carbon based on agricultural waste (date stones). J. Appl. Res. Technol. 2016, 14, 354–366. [Google Scholar] [CrossRef]
  20. Tan, K.; Hameed, B. Insight into the adsorption kinetics models for the removal of contaminants from aqueous solutions. J. Taiwan Inst. Chem. Eng. 2017, 74, 25–48. [Google Scholar] [CrossRef]
  21. Ferreira, A.; Mota, A.; Oliveira, A.; Rodrigues, F.; Pacífico, S.; Da Silva, J.; Abagaro, B.; Saraiva, G.; De Castro, A.; Teixeira, R. Equilibrium and kinetic modelling of adsorption: Evaluating the performance of an adsorbent in softening water for irrigation and animal consumption. Rev. Virtual Química 2019, 11, 1752–1766. [Google Scholar] [CrossRef]
  22. Largitte, L.; Pasquier, R. A review of the kinetics adsorption models and their application to the adsorption of lead by an activated carbon. Chem. Eng. Res. Des. 2016, 109, 495–504. [Google Scholar] [CrossRef]
  23. Tran, H.N.; You, S.-J.; Hosseini-Bandegharaei, A.; Chao, H.-P. Mistakes and inconsistencies regarding adsorption of contaminants from aqueous solutions: A critical review. Water Res. 2017, 120, 88–116. [Google Scholar] [CrossRef] [PubMed]
  24. Lagegren, S.; Svenska, B. Zur theorie der sogenannten adsorption geloester stoffe. Vaternskapsakad Handl. 1898, 24, 1–39. [Google Scholar]
  25. Ho, Y.-S.; McKay, G. Pseudo-second order model for sorption processes. Process Biochem. 1999, 34, 451–465. [Google Scholar] [CrossRef]
  26. Weber Jr, W.J.; Morris, J.C. Kinetics of adsorption on carbon from solution. J. Sanit. Eng. Div. 1963, 89, 31–59. [Google Scholar] [CrossRef]
  27. Etorki, A.; Kammashi, M.; Elhabbat, M.; Shaban, I. Application of polyaniline nanoparticles modified screen printed carbon electrode as a sensor for determination of Hg (II) in environmental samples. J. Environ. Anal. Toxicol. 2017, 7, 2161. [Google Scholar]
  28. Kalyani, D.C.; Telke, A.A.; Govindwar, S.P.; Jadhav, J.P. Biodegradation and detoxification of reactive textile dye by isolated Pseudomonas sp. SUK1. Water Environ. Res. 2009, 81, 298–307. [Google Scholar] [CrossRef]
  29. Joshi, S.; Pokharel, B.P. Preparation and characterization of activated carbon from lapsi (Choerospondias axillaris) seed stone by chemical activation with potassium hydroxide. J. Inst. Eng. 2013, 9, 79–88. [Google Scholar] [CrossRef]
  30. Shao, W.; Jamal, R.; Xu, F.; Ubul, A.; Abdiryim, T. The effect of a small amount of water on the structure and electrochemical properties of solid-state synthesized polyaniline. Materials 2012, 5, 1811–1825. [Google Scholar] [CrossRef]
  31. Turczyn, R.; Krukiewicz, K.; Katunin, A.; Sroka, J.; Sul, P. Fabrication and application of electrically conducting composites for electromagnetic interference shielding of remotely piloted aircraft systems. Compos. Struct. 2020, 232, 111498. [Google Scholar] [CrossRef]
  32. Ahmad, S.; Khan, I.; Husain, A.; Khan, A.; Asiri, A.M. Electrical conductivity based ammonia sensing properties of polypyrrole/MoS2 nanocomposite. Polymers 2020, 12, 3047. [Google Scholar] [CrossRef]
  33. Tchuifon, D.; Anagho, S.; Njanja, E.; Ghogomu, J.; Ndifor-Angwafor, N.; Kamgaing, T. Equilibrium and kinetic modelling of methyl orange adsorption from aqueous solution using rice husk and egussi peeling. Int. J. Chem. Sci. 2014, 12, 741–761. [Google Scholar]
  34. Kajjumba, G.W.; Emik, S.; Öngen, A.; Özcan, H.K.; Aydın, S. Modelling of adsorption kinetic processes—Errors, theory and application. Adv. Sorpt. Process Appl. 2018, 1–19. [Google Scholar] [CrossRef]
  35. Cheng, Z.; Liu, X.; Han, M.; Ma, W. Adsorption kinetic character of copper ions onto a modified chitosan transparent thin membrane from aqueous solution. J. Hazard. Mater. 2010, 182, 408–415. [Google Scholar] [CrossRef] [PubMed]
  36. Mashkoor, F.; Nasar, A. Magnetized Tectona grandis sawdust as a novel adsorbent: Preparation, characterization, and utilization for the removal of methylene blue from aqueous solution. Cellulose 2020, 27, 2613–2635. [Google Scholar] [CrossRef]
  37. Ribas, M.C.; Adebayo, M.A.; Prola, L.D.; Lima, E.C.; Cataluña, R.; Feris, L.A.; Puchana-Rosero, M.; Machado, F.M.; Pavan, F.A.; Calvete, T. Comparison of a homemade cocoa shell activated carbon with commercial activated carbon for the removal of reactive violet 5 dye from aqueous solutions. Chem. Eng. J. 2014, 248, 315–326. [Google Scholar] [CrossRef]
  38. Cardoso, N.F.; Lima, E.C.; Royer, B.; Bach, M.V.; Dotto, G.L.; Pinto, L.A.; Calvete, T. Comparison of Spirulina platensis microalgae and commercial activated carbon as adsorbents for the removal of Reactive Red 120 dye from aqueous effluents. J. Hazard. Mater. 2012, 241, 146–153. [Google Scholar] [CrossRef]
  39. Sánchez-Sánchez, Á.; Suárez-García, F.; Martínez-Alonso, A.; Tascón, J. Synthesis, characterization and dye removal capacities of N-doped mesoporous carbons. J. Colloid Interface Sci. 2015, 450, 91–100. [Google Scholar] [CrossRef]
  40. Khattabi, E.H.E.; Rachdi, Y.; Bassam, R.; Mourid, E.; Naimi, Y.; Alouani, M.E.; Belaaouad, S. Enhanced elimination of methyl orange and recycling of an eco-friendly adsorbent activated carbon from aqueous solution. Russ. J. Phys. Chem. B 2021, 15, S149–S159. [Google Scholar] [CrossRef]
  41. Smita, J.; Dipika, J.; Shraddha, K. Polyaniline for removal of methyl orange dye from waste water. Int. J. Sci. Eng. Manag. 2016, 3, 1–6. [Google Scholar]
  42. Duhan, M.; Kaur, R. Adsorptive removal of methyl orange with polyaniline nanofibers: An unconventional adsorbent for water treatment. Environ. Technol. 2020, 41, 2977–2990. [Google Scholar] [CrossRef] [PubMed]
  43. Khairy, M.; Kamar, E.M.; Yehia, M.; Masoud, E.M. High removal efficiency of methyl orange dye by pure and (Cu, N) doped TiO2/polyaniline nanocomposites. Biointerface Res. Appl. Chem 2021, 12, 893–909. [Google Scholar]
Figure 1. Schematic presentation of PAn and PAnAC synthesis and proposed structures.
Polymers 15 00806 g001
Figure 2. Point of zero charge (pHPZC) for PAnAC adsorbents.
Polymers 15 00806 g002
Figure 3. SEM micrographs of (A) PAn and (B) PAnAC.
Polymers 15 00806 g003
Figure 4. FTIR spectra for methyl orange (MO), polyaniline (PAn), activated carbon (PAnAC), and PAnAC-loaded MO (PAnAC-MO).
Polymers 15 00806 g004
Figure 5. TGA and DTG curves of PAn, PAnAC, and PAnAC-MO.
Polymers 15 00806 g005
Figure 6. Solution pH effect on adsorption efficiency of PAnAC adsorbents for MO uptake.
Polymers 15 00806 g006
Figure 7. Linear and nonlinear plots of PFO, PSO, and Elovich. Conditions: MO adsorbate concentrations: 50, 100, and 200 ppm; MO volume: 250 mL; adsorbent PAnAC dose: 40 mg; pH of solutions: 6.4; agitation speed: 150 rpm; temperature: 23 °C; contact time: 0–180 min.
Polymers 15 00806 g007
Figure 8. Intraparticle diffusion plot for adsorption of methyl orange (MO) onto PAnAC adsorbent at MO concentrations of 50, 100, and 200 ppm. Conditions: as given in Figure 7.
Polymers 15 00806 g008
Figure 9. Experimental data plots of adsorption capacity over time at PAnAC dosages of 20, 40, and 80 mg. Conditions: MO adsorbate concentration: 100 ppm; MO volume: 250 mL; adsorbent PAnAC dose: 20, 40, and 80 mg; pH of solutions: 6.4; agitation speed: 150 rpm; temperature: 23 °C; contact time: 0–180 min.
Polymers 15 00806 g009
Figure 10. Proposed mechanism for adsorption of MO dye onto PAnAC adsorbent.
Polymers 15 00806 g010
Table 1. Linear and nonlinear adsorption kinetic models: PFO, PSO, Elovich, and IPD.
Kinetic
Models
NonlinearLinearConstantsRef.
EquationPlotEquationPlot
PFO q t = q e ( 1 e k 1 t   ) qt vs. t ln ( q e q t ) = l n q e k 1 t ln(qeqt) vs. tk1 (min−1)[24]
PSO q t = k 2 q e 2 t 1 + k 2 q e t qt vs. t t q t = 1 k 2 q e t + t q t t/qt vs. tk2 (g/mg·min);
h = k2qe2 (mg/g·min)
[25]
Elovich q t = 1 β ln ( 1 + α β t ) qt vs. t q t = 1 β ln ( α β ) + 1 β l n t qt vs. lnt𝛼 (mg/g·min);
𝛽 (g/mg)
[16]
IPD-- q t = k i d t 0.5 + C qt vs. t0.5kid (mg/g·min0.5);
C (mg/g)
[26]
Table 2. Physicochemical properties of the PAnAC adsorbent.
MaterialBET Surface
Area (m2/g)
Average Pore Width (nm)CO2 Adsorption Capacity (mg/g)Elemental Analysis (wt%)
CHNO *
PAnAC1893163.556.1458.803.2718.0119.92
BET, Brunauer–Emmett–Teller; * calculated values assuming total composition of 100%.
Table 3. TGA degradation steps and DTG peaks of Pan, PAnAC, and PAnAC-MO.
StepsPropertyPAnPAnACPAnAC-MO
Step 1Temperature (°C)25–15325–15325–208
Mass Loss (%)7.410.911.2
DTG (°C)958698
Assig.Adsorbed volatiles
Step 2Temperature (°C)154–255154–326209–474
Mass Loss (%)8.26.014.3
DTG (°C)221248381
Assig.Weak parts and sensitive functional groups
Step 3Temperature (°C)256–419327–417-
Mass Loss (%)14.72.5-
DTG (°C)300377-
Assig.Oxidative process-
Step 4Temperature (°C)420–686418–785-
Mass Loss (%)18.913.8-
DTG (°C)559580-
Assig.Carbonaceous step (C. step)-
Step 5Temperature (°C)687–950--
Mass Loss (%)7.4--
DTG (°C)771--
Assig.C. step--
Residue at 950 °C43.464.562.3
Table 4. Linear and nonlinear plots of PFO, PSO, and Elovich. Conditions: MO adsorbate concentrations: 50, 100, and 200 ppm; MO volume: 250 mL; adsorbent PAnAC dose: 40 mg; pH of solutions: 6.4; agitation speed: 150 rpm; temperature: 23 °C; contact time: 0–180 min.
Conc. (mg/L)qe,exp. (mg/g)PFOPSOElovichBest Fit
10−3k1 (min−1)qe,calc. (mg/g)R210−3 k2 (min−1)qe,calc. (mg/g)h (mg/(g·min))R2𝛼𝛽R2
Linear models
50264.744.6276.50.8940.43276.232.80.998106.70.02160.968PSO
100319.749.5376.50.8960.35333.338.90.997163.20.01900.980PSO
200405.040.7433.70.7060.29413.249.50.997232.50.01580.978PSO
Nonlinear models
50264.773.6250.30.9690.37277.428.50.995101.20.02140.985PSO
100319.776.1299.70.9420.33330.136.00.984152.80.01780.992Elovich
200405.084.4368.90.9570.30405.949.40.992223.10.01570.991PSO
Table 5. The two-stage intraparticle diffusion (IPD) model parameters for the adsorption of MO onto PAnAC adsorbent at MO concentrations of 50, 100, and 200 ppm.
Conc. (mg/L)qe,exp. (mg/g)IPD Model
Stage 1Stage 2
Kid1 (mg/(g·min0.5))C1R2Kid2 (mg/(g·min0.5))C2R2
50264.721.1685.350.9905.91190.400.936
100319.725.7494.390.9666.69235.290.854
200405.037.46101.940.99410.49264.750.992
Table 6. Experimental data plots of adsorption capacity over time at PAnAC dosages of 20, 40, and 80 mg. Conditions: as given in Figure 9.
AdsorbentDose (mg), MO = 100 ppm
20 mg40 mg80 mg
PAnAC; qe,exp. (mg/g)320.09 319.73287.73
Table 7. Adsorption capacities of different adsorbents used for removal of various azo dyes.
AdsorbentAzo Dye UsedDye Conc. (mg/L)Capacity (qe; mg/g)Mixing Time (min)Adsorbent
Dosage (g/L)
pHTemp. (°C)Kinetic ModelRef.
Commercial activated carbon (CAC; Merck)Reactive violet 510002461502.5225Pseudo-second-order[37]
Acidified cocoa shell activated carbon (ACC-1.0)400
Commercial activated carbon (AC; Merck)Reactive red 120502671802.5225General-order [38]
S. platensis microalgae (SP)482
Nitrogen-doped mesoporous carbons (N-OMCs)Methyl orange200135901.0-25-[39]
Nondoped mesoporous carbons (N-OMCs)120
Commercial activated carbon (LOBA Chemie)Methyl orange80962500.75225Pseudo-second-order[40]
Polyaniline Methyl orange131633601.2330-[41]
Polyaniline nanofibersMethyl orange722800.5725Pseudo-second-order[42]
PolyanilineMethyl orange120111201.0725Pseudo-second-order[43]
TiO2/Polyaniline
composite
119
PAnACMethyl orange200406600.166.423Pseudo-second-orderThis work
Disclaimer/Publisher’s Note: The statements, opinions and data contained in all publications are solely those of the individual author(s) and contributor(s) and not of MDPI and/or the editor(s). MDPI and/or the editor(s) disclaim responsibility for any injury to people or property resulting from any ideas, methods, instructions or products referred to in the content.

