Article

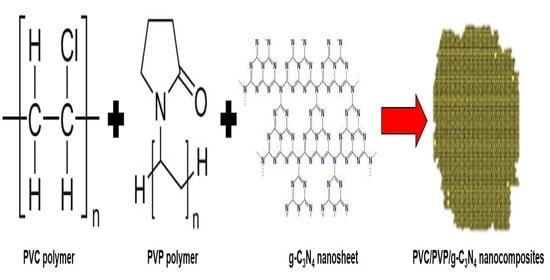
Structural and Optical Characterization of g-C3N4 Nanosheet Integrated PVC/PVP Polymer Nanocomposites

by
Alhulw H. Alshammari
*,
Khulaif Alshammari
,
Majed Alshammari
and
Taha Abdel Mohaymen Taha
Physics Department, College of Science, Jouf University, Sakaka P.O. Box 2014, Saudi Arabia
*
Author to whom correspondence should be addressed.
Polymers 2023, 15(4), 871; https://doi.org/10.3390/polym15040871
Submission received: 29 December 2022 / Revised: 3 February 2023 / Accepted: 4 February 2023 / Published: 9 February 2023
(This article belongs to the Special Issue Advances in Multifunctional Polymer-Based Nanocomposites)

Abstract

:
The present work considers the integration of g-C3N4 nanosheets into PVC/PVP polymer nanocomposites at ratios of 0.0, 0.3, 0.6, and 1.0 wt%. The XRD data scans showed semicrystalline structures for all PVC/PVP/g-C3N4 polymer blend films. The FTIR and Raman measurements revealed intermolecular hydrogen bonding between the g-C3N4 surface and the OH groups of the PVC/PVP network. ESEM morphology analysis for PVC/PVP/g-C3N4 nanocomposite films displayed homogeneous surface textures. The data of TGA showed improved thermal stability as the decomposition temperature increased from 262 to 276 °C with the content of g-C3N4 (0.0–1.0 wt%). The optical absorbance data for PVC/PVP films improved after the addition of g-C3N4. The optical energy gaps showed compositional dependence on the g-C3N4 content, which changed from 5.23 to 5.34 eV at indirect allowed transitions. The refractive index for these blend films enhanced (1.83–3.96) with the inclusion of g-C3N4. Moreover, the optical susceptibility for these nanocomposite films increased as the content of g-C3N4 changed from 0.0 to 1.0 wt%. Finally, the values of the nonlinear refractive index showed improvement with the increased percentage of g-C3N4. When g-C3N4 was added up to 1.0 wt%, the DC conductivity improved from 4.21 × 10⁻⁸ to 1.78 × 10⁻⁶ S/cm. The outcomes of this study prove the suitable application of PVC/PVP/g-C3N4 in optoelectronic fiber sensors.

Graphical Abstract

1. Introduction

Polymers have been widely used in various applications due to outstanding properties such as their low cost, stability, easy fabrication, etc. The advantages of polymer matrix composites include their low cost and straightforward fabrication processes. Furthermore, polymer composites can be used as the primary material to create lightweight, flexible electronics, which is advantageous considering consumer demand. There are different types of polymers, for example, polyvinyl chloride (PVC) and polyvinylpyrrolidone (PVP). Moreover, polymers have different optical properties which are an essential factor to be investigated since these polymers have wide applications, i.e., energy, photonic, and optoelectronics [1,2,3]. In comparison to polymer composites using traditional micron-scale fillers such as carbon fibers or glass, polymer nanocomposites display significant property improvements at considerably lower filler loadings, which can lead to a significantly reduced component weight and simplify manufacturing. Individual nanoparticles homogeneously dispersed in a matrix polymer help compensate the ideal nanocomposite design. The dispersion state of nanoparticles determines the enhancement of properties to their greatest potential. A significant interfacial area between the components of the nanocomposites may result from the homogeneous dispersion of the nanofillers. Several parameters, including polymer matrix properties, nature and type of nanofiller, polymer and filler concentration, particle size, and particle distribution, are believed to contribute to the enhanced action of the filler [4].
A variety of procedures are performed on polymeric materials during polymer processing to maximize their utility. As the properties of polymers differ from one type to another, producing a blend of two polymers within a suitable ratio may lead to a polymer blend with combined properties which do not exist in a single polymer. Polymer blends have been used in various applications such as PVA/PVP/Ag film coating [5], PMMA/PVP/BaTiO3 for optoelectronics [6], and PMMA-PCL-gelatin for biomedical applications [7]. The preparation of a PVC and PVP blend has been reported where PVC acted as a proton donor and PVP with its carbonyl group as a proton acceptor [8]. Doping the polymer blends with appropriate nanosheets is a significant avenue toward the achievement of polymer nanocomposite blends with high performance, because nanoparticles can enhance their physical, chemical, and mechanical properties. Nanosheets have increased mechanical strength, an extremely thin structure, and a high surface-to-volume ratio. They demonstrate improved hydrophobic contact, physical adsorption, van der Waals force, and electrostatic attraction with polymers. In addition, nanoparticles are utilized to reinforce the polymer blends by overcoming their limitations [9], and the selection of these nanosheets as a dopant is controlled by the desirable application. The nanoparticle and polymer PVC/PVP blends are often subjected to hydrogen bonds through the hydroxyl group of PVP and nanoparticle surfaces [10]. Hydrogen bonds cause the enhancement in the optical and thermal properties of polymers nanocomposites [11]. Changing the optical characteristics of polymer materials is one of the most significant consequences of nanoparticles. The full integration of nanosheets with polymers is required for enhanced electron transport between nanosheets and polymers, particularly in electronics applications. For applications such as micro-optics and optical data transmission, changing the refractive index of polymers is particularly crucial [5,6].
When nanosheets or other nanomaterials are added to the polymer matrix, the properties of the polymers can be changed, or frequently, new qualities are added. Nanosheets can either be produced inside the polymer matrix or synthesized previously and integrated to the polymer for homogeneous composite films. Doping the polymer blends with low percentages of nanoparticles is favorable due to excellent influences compared with conventional composites [12]. In this light, the optical property of the PVC/PVP blend was enhanced when doped with SrTiO3 [11]. A previous study reported how the ZnFe2O4 nanoparticles affected the physical properties of similar polymer blends [13].
Graphitic carbon nitride (g-N3C4) has a narrow band gap of 2.7 eV; therefore, it has good light absorption in the visible region [14]. Graphite and g-C3N4 have comparable but distinct structural similarities. One by one, nitrogen and carbon atoms comprise the hexatomic ring. Every carbon atom forms a large planar network structure owing to covalent bonding with three nitrogen atoms. The g-C3N4 is a common kind of carbon nitride that has been extensively utilized in catalysis [15,16,17]. Graphitic carbon nitride is a well-known organic semiconductor with distinct electronic, optical, and mechanical properties. Therefore, g-N3C4 has high potential to be used in optoelectronic applications, as reported in the literature [18,19]. In the literature, the advantage of using g-N3C4 as a polymer dopant was reported. For example, the incorporation of g-N3C4 into the PVA polymer film enhanced its thermal conductivity and electrical insulation [20]. Thus, integrating the polymer blends with such material has high potential to enhance their optical properties. To the best of my knowledge, in the literature, only a few studies have reported on polymers doped with graphitic carbon nitride for optoelectronic applications, leaving a research gap to be studied; therefore, in this work, we concentrate on that aspect.
One of the earliest methods for fabricating polymer films was solution casting. Later, extrusion, pressing, and polymer blowing from the melt assumed the function of this technique. However, high-quality thin-film structures with enhanced optical and physical features are produced by solution casting. The finished product has benefits including features such as dimensional stability and thickness homogeneity. This method requires the low temperature of synthesis. Moreover, this method possesses a low-cost, easy-to-control post-casting drying time and a simple procedure of preparation [21,22,23].
Herein, PVC/PVP polymer blends doped with various g-N3C4 percentages (0.0–1.0 wt%) were prepared via solution casting. The polymer blends’ nanocomposites were characterized by advanced techniques, i.e., XRD, Raman, FTIR, SEM, TGA, and optical absorption as well as dielectric measurements. We determined the linear and nonlinear optical parameters of this polymer blend’s nanocomposites when increasing the g-N3C4 proportions.

2. Experimental Section

The g-C3N4 nanosheets were prepared from high-purity urea (MERK, Darmstadt, Germany) by the polycondensation method at 500 °C at a heating rate of 3.0 °C per minute, and the process took 2.0 h [24]. The product was collected and ground well inside an agate mortar. The PVC/PVP polymer blend was developed using analar-grade PVC (MERK, Darmstadt, Germany) and PVP (LOBACEMIE, Mumbai, India) polymer powders. Moreover, the solvent tetrahydrofuran (THF) was supplied from CARLO ERBA (Cornaredo, Italy). For the preparation of PVC/PVP/g-C3N4 nanocomosite films, 0.9 g of PVC powder was dissolved in 30 mL of THF for 60 min at 300 K. In addition, 0.1 g of PVP powder was dissolved in 5.0 mL of THF and added to the PVC clear solution. The PVC/PVP mixture was stirred for another 60 min with the addition of 0.0, 0.1, 0.3, 0.6, and 1.0 wt% of g-C3N4 nanosheets. The solution mixture was subjected to ultrasonic waves for 30 min. Finally, the PVC/PVP/g-C3N4 nanocomposite solution was poured inside a polypropylene dish. The nanocomposite films were collected after drying inside an electric oven at 50 °C for 48 h.
The Shimadzu XRD 7000 (Kyoto, Japan) diffractometer produced the crystal structure data for the PVC/PVP/g-C3N4 nanocomposite films. The Shimadzu FTIR–Tracer 100 spectrometer (Kyoto, Japan) recorded the transmittance vs. wavenumber for the PVC/PVP/g-C3N4 blend films. Quattro environmental scanning electron microscope (ESEM) produced surface morphology scans of the PVC/PVP/g-C3N4 nanocomposite films. A Shimadzu TGA-51 thermogravimetric (Kyoto, Japan) analyzer was used for TGA measurements at temperatures 30–600 °C, and the heating rate was 10 °C/min. The Cary 60 UV-Vis spectrophotometer recorded the optical absorption data for the PVC/PVP/g-C3N4 films. The DC conductivity data for the polymer films were completed on two-probe setup at 300 K on an MTZ-35 impedance analyzer.

3. Results and Discussion

One of the most effective non-destructive methods for determining the crystallographic structure of polymer nanocomposites is X-ray diffraction. X-ray diffraction (XRD) was used to characterize the polymer PVC/PVP doped with nanosheet g-C3N4, as shown in Figure 1. The highest diffraction peak of g-C3N4 (002) is located at around 27.4° (Figure 1a), which is consistent with the stacking peak of interplanar aromatic systems [25,26], while the reflection peak (100) located at 13.2° is consistent with the inter-layer structure packing of the lattice planes [27]. The XRD data reveal the successful synthesis of the g-C3N4 nanosheet. Due to the small amount of g-C3N4 in the polymer composites, the diffraction peaks of g-C3N4 were not observed in the XRD spectra. Two diffuse peaks at 18.0° and 24.0° in the spectra of PVC/PVP (Figure 1b) reflect the semicrystalline nature. Additionally, there is a slight shift toward a higher angle in the peak position, which is assigned to the strong interaction between the PVC/PVP polymer blend and the g-C3N4 nanosheet.
The Segal equation was used to calculate the crystallinity index (CI) for PVC/PVP/g-C3N4 nanocomposites, as described below [28]:
C I = I 24 I 18 I 24 ×   100
where I24 represents the intensity of the peak at 2θ = 24°, and I18 at 2θ = 18°. Accordingly, the crystallinity index data for PVC/PVP films are 1.01, 1.20, 3.0, and 4.26 at 0.0, 0.3, 0.6, and 1.0 wt% of g-C3N4, respectively. From these data, a slight increase in CI was due to the small content of g-C3N4. The full width at half maximum (β) of a diffraction peak is inversely proportional to the crystallite size (D), as explained by the Scherer equation [29]:
D = 0.9 λ β cos θ
where the X-ray wavelength (λ = 1.54056 Å). As seen in Figure 1b, the peak broadening of PVC/PVP increased with the gradual increase in g-C3N4 content. This, in accordance, led to a decrease in crystallite size.
An efficient method for characterizing polymeric materials is Fourier transform infrared spectroscopy (FTIR). A unique fingerprint is recognized for a sample concerning the measured spectrum. The FTIR spectra of PVC/PVP/g-C3N4 nanocomposites at different concentrations of nanosheet g-C3N4 are shown in Figure 2. The presence of the vibrational frequencies of pure PVC/PVP polymers in the spectrum of the produced blend indicates the formation of hydrogen bonds. PVP and other polymers with electronegative oxygen and ternary amide groups have the potential to be effective proton acceptors due to the nature of the basic functional groups. It is assumed that the interaction will consist of hydrogen bonds between the C–H of CH2 in PVC and the C–O in PVP. A broad absorptions peak at 3370–3420 cm−1 is ascribed to hydroxyl group O–H stretch vibrations, while a sharp absorptions peak at around 1655 cm−1 is assigned to O–H stretch bending vibrations, respectively [30]. The observed peaks at 1324 and 1425 cm−1 are attributed to C-O and C=C vibrations, respectively [31]. The bands at around 692, 833, and 957 cm−1 correspond to C-H bending vibration out-of-plane [31,32]. The bending and stretching vibrations of C-N correspond to the formation of the absorption bands at 1425 and 1290 cm−1, while the C-Cl bonds are ascribed to the bands at 611 and 636 cm−1 [33]. As the concentration of g-C3N4 wt% increases, the position of the broad peak in the pure PVA/PVP spectrum shifts from 3370 to 3420 cm−1. Additionally, the characteristic peak at 1254 cm−1 related to C-N bending vibrations of the pure PVA/PVP shifts to 1290 cm−1. These variations in peak positions are attributed to the intermolecular hydrogen bonding between the g-C3N4 surface and the -OH groups of PVC/PVP, which indicates the success of the interaction between g-C3N4 nanosheets and PVC/PVP polymers. The distribution of potential energy throughout the host polymeric blend’s chains is significantly impacted by this interaction, which also modifies the backbone structure of the blend [34]. This g-C3N4 filling-induced structural modification of the polymeric blend’s chains significantly affects the physical properties of the g-C3N4-filled polymeric nanocomposites [35].
The vibrational, rotational, and other low-frequency modes recorded by Raman spectroscopy allow us to assess the structural properties of materials. Thus, Raman scattering is used in Raman spectroscopy to identify molecular vibrations. The Raman spectra for polymer PVC/PVP doped with different concentrations of g-C3N4 are shown in Figure 3. The stretching vibration of C-Cl bonds causes the high-intensity peaks at 637 and 693 cm−1. Additionally, the intensity peak at 2915 cm−1 is the result of the stretching vibration of the C-H and C-H2 bonds [36]. The stretching vibrations of C=C bonds in conjugated aromatic composites are ascribed to the bands at around 1428 cm−1, while the defect structure of carbon material is related to the bands around 1330 cm−1 [37].
Due to the asymmetric stretching vibration, this intensity of quenching validates the interaction between polymer PVC/PVP and nanosheet g-C3N4 in the C-Cl region [11].
In comparison to an optical microscope, scanning electron microscopy is frequently employed to analyze the sample surface morphology. ESEM images were used to examine the morphology and structure of the synthesized g-C3N4 nanosheets. The 2D sheet structure shown in Figure 4 is consistent with reports for g-C3N4 materials. Moreover, the image shows that g-C3N4 is stacked flakes. The ESEM surface morphology analyses for the PVC/PVP/g-C3N4 nanocomposite films are displayed in Figure 4. All the polymer films showed homogeneous surface morphology and interconnection between g-C3N4 and the PVC/PVP blend network.
Thermogravimetric analysis (TGA) was used to characterize the thermophysical properties and examine the thermal stability of polymer films. Moreover, TGA is used to measure thermal stability of a sample, the amount of solvent still present, and the amount of water absorbed. This technique measures the mass changes in a sample as a function of time and/or temperature. The thermal stability of a copolymer is typically between that of two homopolymers and varies depending on the copolymer composition. Moreover, TGA analysis has also been used to investigate the effect of filler on a polymeric sample’s thermal stability. The TGA and DTG graphs for PVC/PVP/g-C3N4 nanocomposites are displayed in Figure 5a,b. The data describing the mass loss vs. temperature shown in Figure 5a revealed a main degradation stage between 180 and 316 °C, which corresponds to the dehydrochlorination of the PVC/PVP polymer blend [38]. The maximum decomposition temperature correlated with this stage was determined from Figure 5b, which shifted from 262 to 276 °C as the content of g-C3N4 changed from 0.0 to 1.0 wt%. Therefore, the increase in g content resists the dehydrochlorination of the PVC/PVP polymer blend and improves the thermal stability.
A second degradative stage observed at temperatures higher than 400 °C belongs to the scission of covalent bonds in PVC/PVP chains [39]. The decomposition temperature at this stage increased from 509 to 520 °C when the content of g-C3N4 increased from 0.0 to 1.0 wt%. Moreover, the residual mass % at 600 °C were 13.14, 17.50, 18.12, and 19.71% for the content of g-C3N4 (0.0, 0.3, 0.6 and 1.0 wt%). All these outcomes prove the enhanced thermal stability of PVC/PVP/g-C3N4 nanocomposites.
The absorption spectrum of a material is determined using ultraviolet–visible (UV-Vis) spectroscopy in the specified spectral band. This method is especially beneficial for polymers, because both the π-electrons and non-bonding electrons (n-electrons) enclosed in the molecules can absorb from the ultraviolet to visible ranges at the spectrum energy. In this section, we have studied the optical properties of the PVC/PVP polymer blend matrix doped with g-C3N4 concentrations of 0.0, 0.3, 0.6, and 1.0 wt%. The absorbance and optical transmittance curves of PVC/PVP/g-C3N4 nanocomposites have been investigated. Figure 6a represents the absorbance band of PVC/PVP polymer that appears at 280 nm; this could be from the transitions of two unsaturated bonds, C=O and C=C [40,41]. It is notable that a small shift appeared at the absorption band, which is regarded as a redshift. This redshift of absorption bands increases with increasing g-C3N4 concentrations. Figure 6b shows that the optical transmissions gradually reduce with increasing g-C3N4 concentrations. The decrease in optical transmissions may be explained by an increase in the photon scattering due to the dense nanoparticles of the polymer blend [14].
The vertical excitation energy from the ground state to the first dipole-allowed excited state corresponds to the optical energy gap, which is the lowest energy transition identified in the experimental absorption spectra [42]. We have estimated the optical band gap (Eopt) from the variation in ( α h υ ) vs. photon energy (h υ ) via the Tauc formula [43,44];
α h υ = k ( h v E g ) x
where k is a constant. The direct Edir and indirect Eind band gap for allowed transitions are represented by two values: x = 2 and x = 0.5, respectively. To estimate the optical band gap energy Eopt, we have extrapolated the linear part at zero photon absorption, as represented in Figure 7a,b. The values of the Edir and Eind are reduced for 0.3 and 0.6 wt%, while they are improved for 1 wt%. The decrease in band gap corresponds to the formation of new energy levels between the valence and conduction band.
Figure 8a shows the variation in optical reflectance (R) vs. wavelength for the PVC/PVP/g-C3N4 blend matrix at different g-C3N4 concentrations. The values of R enhanced when we added 1.0 wt% of g-C3N4, while they reduced for 0.3 and 0.6 wt% of g-C3N4, respectively. We also estimated the refractive index (n) from the optical reflectance shown in Figure 8a. To calculate the n, we use the following Equation [45]:
n = ( 1 + R 1 R ) + 4 R ( 1 R ) 2 k 2
where k represents the extinction coefficient, and it is determined from k = α λ / 4 π . Figure 8b shows that the estimated values of n increased when we doped different g-C3N4 concentrations (0.3, 0.6, and 1.0 wt%) to the PVC/PVP polymer.
The integration of g-C3N4 nanosheets enhanced the refractive index (n), as shown in Figure 8b. This increase resulted from the higher absorption of g-C3N4 in the visible light range [14]. Many applications, such as optical sensors, solar cells [46,47], emissive displays, and light emitting diodes (LEDs) [48] require materials with a refractive index ≥ 1.65 [49]. As the present PVC/PVP/g-C3N4 films have a refractive index 1.83–3.96, they are therefore suitable for optical sensors, LEDs, and cladding in optical frequency modulators.
Equation (3) represents the refractive index dispersion as a function of photon energy [50]:
( n 2 1 ) 1 = E 0 E d 1 E 0 E d   ( h υ ) 2
where n, E0, Ed, and h υ are the refractive index, the single-oscillator energy, dispersion energy, and the energy of the incident photons, respectively [51]. Table 1 represents the values of E0 and Ed which are calculated from the slope and the intercept of the plots in Figure 9. The E0 values decrease from 4.21 to 3.14 eV with an increase in the g-C3N4 concentrations (0.0–1.0 wt%), while the Ed values enhance (9.88–46.08 eV) with the increase in g-C3N4.
From Equation (4), the static refractive index (n0) is evaluated at h v 0   as follows [47]:
n 0 2 = ( 1 + E d E 0 )
The refractive index values are enhanced when we add different ratios of g-C3N4, as listed in Table 1. The estimated values of n0 are 1.83, 2.90, 3.67, and 3.96 for 0.0, 0.3, 0.6, and 1.0 wt%, respectively.
The oscillator strength (f) is presented as follows [52]:
f = E d E 0
where Ed is the dispersion energy, and E0 is the single oscillator energy. Table 1 shows the f values improved when different g-C3N4 concentrations increased.
Nonlinear effects result from high-intensity light propagating across a material. The most basic of these is the Kerr effect, which is defined as a change in the refractive index in proportion to the optical intensity. Moreover, the nonlinear optical parameters such as linear optical susceptibility ( χ ( 1 ) ) and the third-order nonlinear optical susceptibility ( x ( 3 ) ) were analyzed for the PVC/PVP/g-C3N4 nanocomposite films. The estimations of χ ( 1 ) and x ( 3 ) were completed via the following relations [53]:
χ ( 1 ) = E d / E 0 4 π ;   x ( 3 ) = 6.82 × 10 15 ( E d / E 0 ) 4
The data calculations are listed in Table 2 and showed higher values of χ ( 1 ) and x ( 3 ) for the PVC/PVP/g-C3N4 films concerning the pure PVC/PVP. The enhanced optical susceptibility performance of these nanocomposite films after the addition of g-C3N4 nanosheet increase the applicability in optoelectronic devices.
The data of the nonlinear refractive index (n2) are estimated depending on the third-order nonlinear optical susceptibility ( x ( 3 ) ) as follows [14,49]:
n 2 = 12 π x ( 3 ) n 0
The values of n2 recorded in Table 2 show a large increase with an increase in the content of the g-C3N4 nanosheet. These data of n2 for the present PVC/PVP/g-C3N4 are higher than those listed in the literature [54,55,56].
Many factors influence the electrical conductivity of materials. The nature of the materials, their dimensions, the temperature, and frequency of electrical fields are the main factors affecting electrical conductivity. Moreover, the polymer–nanofiller interface contributes to the variation in electrical conductivity. The DC conductivity (σDC) of the PVC/PVP/g-C3N4 films was measured at 300 K and is plotted in Figure 10. When g-C3N4 was added up to 1.0 wt%, the DC conductivity improved from 4.21 × 10⁻⁸ to 1.78 × 10⁻⁶ S/cm. These findings indicate that the g-C3N4 nanosheet contributes more free ions and ion pairs to the PVC/PVP polymer blend. Higher charge carriers are observed in the polymer film containing 1.0 wt% of g-C3N4 due to the presence of more π-π∗ bonds. The reduced band gap in the g-C3N4 nanosheet accounts for the increased conductivity [57].

4. Conclusions

The current work investigated the preparation, structural, and optical properties of g-C3N4 integrated PVC/PVP blend nanocomposites. The data of XRD showed two diffuse peaks at 18.0° and 24.0° in the spectra of blend films which correspond to a semicrystalline structure. FTIR and Raman spectra showed that the g-C3N4 filling-induced structural modification of the polymeric blend chains significantly affects the physical properties of the g-C3N4-filled polymeric nanocomposites. From ESEM micrographs, all the polymer films showed homogeneous surface morphologies and strong interconnections between g-C3N4 and the PVC/PVP blend network. The thermal stability of the PVC/PVP blend nanocomposites improved with the inclusion of g-C3N4 nanosheets. The refractive index showed higher values (1.83–3.96) after the addition of g-C3N4. Moreover, the optical band gaps for the PVC/PVP/g-C3N4 blend films changed with the integration of g-C3N4 nanosheets. Finally, the data of the nonlinear refractive index (n2) and the third-order nonlinear optical susceptibility ( x ( 3 ) ) for these nanocomposite films showed higher performance and thus are suitable for optoelectronic frequency modulators.

Author Contributions

Conceptualization, A.H.A. and T.A.M.T.; validation, formal analysis, K.A., M.A. and T.A.M.T.; investigation, A.H.A.; resources, A.H.A.; writing—original draft preparation, K.A., M.A. and A.H.A.; writing—review and editing, A.H.A. and T.A.M.T.; supervision, T.A.M.T.; funding acquisition, A.H.A. All authors have read and agreed to the published version of the manuscript.

Funding

This work was funded by the Deanship of Scientific Research at Jouf University under grant Number (DSR-2021-03-0235).

Institutional Review Board Statement

Not applicable.

Informed Consent Statement

Not applicable.

Data Availability Statement

Data available on request from the corresponding author.

Acknowledgments

The authors would like to extend their sincere appreciation to the central laboratory at Jouf University for support this study.

Conflicts of Interest

The authors declare no conflict of interest.

References

  1. Safarpour, M.; Safikhani, A.; Vatanpour, V. Polyvinyl chloride-based membranes: A review on fabrication techniques, applications and future perspectives. Sep. Purif. Technol. 2021, 279, 119678. [Google Scholar] [CrossRef]
  2. Aghamohammadi, H.; Amousa, N.; Eslami-Farsani, R. Recent advances in developing the MXene/polymer nanocomposites with multiple properties: A review study. Synth. Met. 2021, 273, 116695. [Google Scholar] [CrossRef]
  3. Kouser, S.; Prabhu, A.; Prashantha, K.; Nagaraja, G.; D’Souza, J.N.; Navada, K.M.; Qurashi, A.; Manasa, D. Modified halloysite nanotubes with Chitosan incorporated PVA/PVP bionanocomposite films: Thermal, mechanical properties and biocompatibility for tissue engineering. Colloids Surf. A Physicochem. Eng. Asp. 2022, 634, 127941. [Google Scholar] [CrossRef]
  4. Sudharsan, J.; Khare, S.K. Role of nanocomposite additives in well bore stability during shale formation drilling with water based mud–A comprehensive review. Mater. Today Proc. 2022, 62, 6412–6419. [Google Scholar] [CrossRef]
  5. Raj, D.R.; Prasanth, S.; Vineeshkumar, T.V.; Sudarsanakumar, C. Ammonia sensing properties of tapered plastic optical fiber coated with silver nanoparticles/PVP/PVA hybrid. Opt. Commun. 2015, 340, 86–92. [Google Scholar]
  6. Najafi-Ashtiani, H. Low temperature processing of BaTiO3-PMMA-PVP hybrid films as transparent dielectric gate. J. Mater. Sci. Mater. Electron. 2019, 30, 7087–7094. [Google Scholar] [CrossRef]
  7. Munj, H.R.; Nelson, M.T.; Karandikar, P.S.; Lannutti, J.J.; Tomasko, D.L. Biocompatible electrospun polymer blends for biomedical applications. J. Biomed. Mater. Res. Part B Appl. Biomater. 2014, 102, 1517–1527. [Google Scholar] [CrossRef] [PubMed]
  8. Bhavsa, V.; Tripathi, D. Structural, optical, and aging studies of biocompatible PVC-PVP blend films. J. Polym. Eng. 2018, 38, 419–426. [Google Scholar] [CrossRef]
  9. Li, J.; Liu, X.; Feng, Y.; Yin, J. Recent progress in polymer/two-dimensional nanosheets composites with novel performances. Prog. Polym. Sci. 2022, 126, 101505. [Google Scholar]
  10. Al-Muntaser, A.A.; Pashameah, R.A.; Sharma, K.; Alzahrani, E.; Hameed, S.T.; Morsi, M.A. Boosting of structural, optical, and dielectric properties of PVA/CMC polymer blend using SrTiO3 perovskite nanoparticles for advanced optoelectronic applications. Opt. Mater. 2022, 132, 112799. [Google Scholar] [CrossRef]
  11. Alshammari, A.H.; Alshammari, M.; Alshammari, K.; Allam, N.K.; Taha, T. PVC/PVP/SrTiO3 polymer blend nanocomposites as potential materials for optoelectronic applications. Results Phys. 2022, 44, 106173. [Google Scholar] [CrossRef]
  12. Taha, T.A.; Mahmoud, M.H.; Hayat, A. Dielectric relaxation studies on PVC-Pb3O4 polymer nanocomposites. J. Mater. Sci. Mater. Electron. 2021, 32, 27666–27675. [Google Scholar] [CrossRef]
  13. Alshammari, A.H.; Taha, T.A. Structure, thermal and dielectric insights of PVC/PVP/ZnFe2O4 polymer nanocomposites. Eur. Phys. J. Plus 2021, 136, 1201. [Google Scholar] [CrossRef]
  14. Vaya, D.; Kaushik, B.; Surolia, P.K. Recent advances in graphitic carbon nitride semiconductor: Structure, synthesis and applications. Mater. Sci. Semicond. Process. 2022, 137, 106181. [Google Scholar]
  15. Liu, X.; Zhao, C.; Muhmood, T.; Yang, X. Regulating the Assembly of Precursors of Carbon Nitrides to Improve Photocatalytic Hydrogen Production. Catalysts 2022, 12, 1634. [Google Scholar] [CrossRef]
  16. Muhmood, T.; Uddin, A. Fabrication of spherical-graphitic carbon nitride via hydrothermal method for enhanced photo-degradation ability towards antibiotic. Chem. Phys. Lett. 2020, 753, 137604. [Google Scholar] [CrossRef]
  17. Muhmood, T.; Cai, Z.; Lin, S.; Xiao, J.; Hu, X.; Ahmad, F. Graphene/graphitic carbon nitride decorated with AgBr to boost photoelectrochemical performance with enhanced catalytic ability. Nanotechnology 2020, 31, 505602. [Google Scholar] [CrossRef] [PubMed]
  18. Hoh, H.Y.; Zhang, Y.; Zhong, Y.L.; Bao, Q. Harnessing the Potential of Graphitic Carbon Nitride for Optoelectronic Applications. Adv. Opt. Mater. 2021, 9, 2100146. [Google Scholar] [CrossRef]
  19. Yuan, B.; Wang, Y.; Elnaggar, A.Y.; El Azab, I.H.; Huang, M.; Mahmoud, M.H.H.; El-Bahy, S.M.; Guo, M. Physical vapor deposition of graphitic carbon nitride (g-C3N4) films on biomass substrate: Optoelectronic performance evaluation and life cycle assessment. Adv. Compos. Hybrid Mater. 2022, 5, 813–822. [Google Scholar] [CrossRef]
  20. Zhang, H.; Wu, K.; Jiao, E.; Chen, B.; Shi, J.; Lu, M. Greatly improved thermal conductivity and electrical insulation for PVA composites via introducing functional carbon nitride nanosheets. Eur. Polym. J. 2021, 159, 110718. [Google Scholar] [CrossRef]
  21. Shikinaka, K.; Aizawa, K.; Fujii, N.; Osada, Y.; Tokita, M.; Watanabe, J.; Shigehara, K. Flexible, transparent nanocomposite film with a large clay component and ordered structure obtained by a simple solution-casting method. Langmuir 2010, 26, 12493–12495. [Google Scholar] [CrossRef]
  22. Ahmed, F.; Kumar, S.; Arshi, N.; Anwar, M.S.; Su-Yeon, L.; Kil, G.S.; Park, D.W.; Koo, B.H.; Lee, C.G. Preparation and characterizations of polyaniline (PANI)/ZnO nanocomposites film using solution casting method. Thin Solid Film. 2011, 519, 8375–8378. [Google Scholar] [CrossRef]
  23. Bidadi, H.; Olad, A.; Parhizkar, M.; Aref, S.M.; Ghafouri, M. Nonlinear properties of ZnO-polymer composites prepared by solution-casting method. Vacuum 2013, 87, 50–54. [Google Scholar] [CrossRef]
  24. Hayat, A.; Taha, T.A.; Alenad, A.M.; Ullah, I.; Shah, S.J.A.; Uddin, I.; Ullah, I.; Hayat, A.; Khan, W.U. A simplistic molecular agglomeration of carbon nitride for optimized photocatalytic performance. Surf. Interfaces 2021, 25, 101166. [Google Scholar] [CrossRef]
  25. Mahmood, A.; Muhmood, T.; Ahmad, F. Carbon nanotubes heterojunction with graphene like carbon nitride for the enhancement of electrochemical and photocatalytic activity. Mater. Chem. Phys. 2022, 278, 125640. [Google Scholar] [CrossRef]
  26. Muhmood, T.; Xia, M.; Lei, W.; Wang, F. Erection of duct-like graphitic carbon nitride with enhanced photocatalytic activity for ACB photodegradation. J. Phys. D Appl. Phys. 2018, 51, 065501. [Google Scholar] [CrossRef]
  27. Lu, X.; Xu, K.; Chen, P.; Jia, K.; Liu, S.; Wu, C. Facile one step method realizing scalable production of g-C3N4 nanosheets and study of their photocatalytic H 2 evolution activity. J. Mater. Chem. A 2014, 2, 18924–18928. [Google Scholar] [CrossRef]
  28. French, A.D.; Santiago Cintrón, M. Cellulose polymorphy, crystallite size, and the Segal Crystallinity Index. Cellulose 2013, 20, 583–588. [Google Scholar] [CrossRef]
  29. Taha, T.A.; Saad, R.; Zayed, M.; Shaban, M.; Ahmed, A.M. Tuning the surface morphologies of ZnO nanofilms for enhanced sensitivity and selectivity of CO2 gas sensor. Appl. Phys. A 2023, 129, 115. [Google Scholar] [CrossRef]
  30. Abbasian, A.R.; Shafiee Afarani, M. One-step solution combustion synthesis and characterization of ZnFe2O4 and ZnFe1.6O4 nanoparticles. Appl. Phys. A 2019, 125, 721. [Google Scholar] [CrossRef]
  31. Bhran, A.; Shoaib, A.; Elsadeq, D.; El-gendi, A.; Abdallah, H. Preparation of PVC/PVP composite polymer membranes via phase inversion process for water treatment purposes. Chin. J. Chem. Eng. 2018, 26, 715–722. [Google Scholar] [CrossRef]
  32. Rani, P.; Ahamed, M.B.; Deshmukh, K. Significantly enhanced electromagnetic interference shielding effectiveness of montmorillonite nanoclayand copper oxide nanoparticles basedpolyvinylchloride nanocomposites. Polym. Test. 2020, 91, 106744. [Google Scholar] [CrossRef]
  33. Taha, T.A.; Alzara, M.A.A. Synthesis, thermal and dielectric performance of PVA-SrTiO3 polymer nanocomposites. J. Mol. Struct. 2021, 1238, 130401. [Google Scholar] [CrossRef]
  34. Zidan, H.M.; Abdelrazek, E.M.; Abdelghany, A.M.; Tarabiah, A.E. Characterization and some physical studies of PVA/PVP filled with MWCNTs. J. Mater. Res. Technol. 2019, 8, 904–913. [Google Scholar] [CrossRef]
  35. Darkwah, W.K.; Ao, Y. Mini review on the structure and properties (photocatalysis), and preparation techniques of graphitic carbon nitride nano-based particle, and its applications. Nanoscale Res. Lett. 2018, 13, 388. [Google Scholar] [CrossRef] [PubMed]
  36. Solodovnichenko, V.S.; Polyboyarov, V.A.; Zhdanok, A.A.; Arbuzov, A.B.; Zapevalova, E.S.; Kryazhev, Y.G.; Likholobov, V.A. Synthesis of carbon materials by the short-term mechanochemical activation of polyvinyl chloride. Procedia Eng. 2016, 152, 747–752. [Google Scholar] [CrossRef]
  37. Smith, M.W.; Dallmeyer, I.; Johnson, T.J.; Brauer, C.S.; McEwen, J.-S.; Espinal, J.F.; Garcia-Perez, M. Structural analysis of char by Raman spectroscopy: Improving band assignments through computational calculations from first principles. Carbon 2016, 100, 678–692. [Google Scholar] [CrossRef]
  38. Dong, J.; Fredericks, P.M.; George, G.A. Studies of the structure and thermal degradation of poly (vinyl chloride)—Poly (N-vinyl-2-pyrrolidone) blends by using Raman and FTIR emission spectroscopy. Polym. Degrad. Stab. 1997, 58, 159–169. [Google Scholar] [CrossRef]
  39. Moustapha, M.E.; Friedrich, J.F.; Farag, Z.R.; Krüger, S.; Geesi, M. Potentiometric studies on the influence of poly (N-vinylpyrrolidone) on the thermal degradation behavior of poly (vinyl chloride) blends. Mater. Test. 2019, 61, 179–184. [Google Scholar] [CrossRef]
  40. Haque, M.A.; Paliwal, L.J. Synthesis, spectral characterization and thermal aspects of coordination polymers of some transition metal ions with adipoyl bis (isonicotinoylhydrazone). J. Mol. Struct. 2017, 1134, 278–291. [Google Scholar] [CrossRef]
  41. Baraker, B.M.; Lobo, B. Spectroscopic analysis of CdCl2 doped PVA–PVP blend films. Can. J. Phys. 2017, 95, 738–747. [Google Scholar] [CrossRef]
  42. Zirzlmeier, J.; Schrettl, S.; Brauer, J.C.; Contal, E.; Vannay, L.; Brémond, É.; Jahnke, E.; Guldi, D.M.; Corminboeuf, C.; Tykwinski, R.R.; et al. Optical gap and fundamental gap of oligoynes and carbyne. Nat. Commun. 2020, 11, 4797. [Google Scholar] [CrossRef] [PubMed]
  43. Horti, N.C.; Kamatagi, M.D.; Patil, N.R.; Nataraj, S.K.; Sannaikar, M.S.; Inamdar, S.R. Synthesis and photoluminescence properties of titanium oxide (TiO2) nanoparticles: Effect of calcination temperature. Optik 2019, 194, 163070. [Google Scholar] [CrossRef]
  44. Qasem, A.; Mostafa, M.S.; Yakout, H.; Mahmoud, M.; Shaaban, E.R. Determination of optical bandgap energy and optical characteristics of Cd30Se50S20 thin film at various thicknesses. Opt. Laser Technol. 2022, 148, 107770. [Google Scholar] [CrossRef]
  45. El-naggar, A.M.; Heiba, Z.K.; Mohamed, M.B.; Kamal, A.M.; Osman, M.M.; Albassam, A.A.; Lakshminarayana, G. Improvement of the optical characteristics of PVA/PVP blend with different concentrations of SnS2/Fe. J. Vinyl Addit. Technol. 2022, 28, 82–93. [Google Scholar] [CrossRef]
  46. Taha, T.A.; Hendawy, N.; El-Rabaie, S.; Esmat, A.; El-Mansy, M.K. Effect of NiO NPs doping on the structure and optical properties of PVC polymer films. Polym. Bull. 2019, 76, 4769–4784. [Google Scholar] [CrossRef]
  47. Aziz, S.B.; Rasheed, M.A.; Hussein, A.M.; Ahmed, H.M. Fabrication of polymer blend composites based on [PVA-PVP](1 − x):(Ag2S) x (0.01≤ x ≤ 0.03) with small optical band gaps: Structural and optical properties. Mater. Sci. Semicond. Process. 2017, 71, 197–203. [Google Scholar] [CrossRef]
  48. Dhatarwal, P.; Sengwa, R.J. Investigation on the optical properties of (PVP/PVA)/Al2O3 nanocomposite films for green disposable optoelectronics. Phys. B Condens. Matter 2021, 613, 412989. [Google Scholar] [CrossRef]
  49. Sakr, G.B.; Yahia, I.S.; Fadel, M.; Fouad, S.S.; Romčević, N. Optical spectroscopy, optical conductivity, dielectric properties and new methods for determining the gap states of CuSe thin films. J. Alloys Compd. 2010, 507, 557–562. [Google Scholar] [CrossRef]
  50. Aly, K.A. Optical band gap and refractive index dispersion parameters of As x Se70Te30− x (0≤ x ≤ 30 at.%) amorphous films. Appl. Phys. A 2010, 99, 913–919. [Google Scholar] [CrossRef]
  51. Taha, T.A. Optical properties of PVC/Al2O3 nanocomposite films. Polym. Bull. 2019, 76, 903–918. [Google Scholar] [CrossRef]
  52. Mondal, R.; Biswas, D.; Paul, S.; Das, A.S.; Chakrabarti, C.; Roy, D.; Bhattacharya, S.; Kabi, S. Investigation of microstructural, optical, physical properties and dielectric relaxation process of sulphur incorporated selenium–tellurium ternary glassy systems. Mater. Chem. Phys. 2021, 257, 123793. [Google Scholar] [CrossRef]
  53. Soliman, T.S.; Vshivkov, S.A.; Elkalashy, S.I. Structural, linear and nonlinear optical properties of Ni nanoparticles–Polyvinyl alcohol nanocomposite films for optoelectronic applications. Opt. Mater. 2020, 107, 110037. [Google Scholar] [CrossRef]
  54. Emshary, C.A.; Ali, I.M.; Hassan, Q.M.; Sultan, H.A. Linear and nonlinear optical properties of potassium dichromate in solution and solid polymer film. Phys. B Condens. Matter 2021, 613, 413014. [Google Scholar] [CrossRef]
  55. Ali, H.E.; Khairy, Y. Synthesis, characterization, refractive index-bandgap relations, and optical nonlinearity parameters of CuI/PVOH nanocomposites. Opt. Laser Technol. 2021, 136, 106736. [Google Scholar]
  56. Alrowaili, Z.A.; Taha, T.A.; El-Nasser, K.S.; Donya, H. Significant enhanced optical parameters of PVA-Y2O3 polymer nanocomposite films. J. Inorg. Organomet. Polym. Mater. 2021, 31, 3101–3110. [Google Scholar] [CrossRef]
  57. Krishnaswamy, S.; Panigrahi, P.; Kala, P.P.; Sofini, S.; Nagarajan, G.S. Smart apparel using nano graphitic carbon nitride/PVA in a cotton cloth for military application. Heliyon 2022, 8, e10345. [Google Scholar] [CrossRef] [PubMed]
Figure 1. XRD diffraction patterns of (a) g-C3N4, (b) XRD diffraction patterns of PVC/PVP doped with different concentrations of g-C3N4.
Polymers 15 00871 g001
Figure 2. FTIR spectra for the PVC/PVP/g-C3N4 nanocomposite films.
Polymers 15 00871 g002
Figure 3. Raman spectra for the PVC/PVP/g-C3N4 nanocomposite films.
Polymers 15 00871 g003
Figure 4. ESEM micrograph surface morphology scans for the PVC/PVP/g-C3N4 nanocomposite films.
Polymers 15 00871 g004
Figure 5. TGA (a) and DTG (b) graphs for the PVC/PVP/g-C3N4 nanocomposite films.
Polymers 15 00871 g005
Figure 6. Graphs of (a) absorbance against wavelength and (b) transmittance against wavelength for the PVC/PVP/g-C3N4 nanocomposite films.
Polymers 15 00871 g006
Figure 7. Graphs of (a) (αh υ ) 0.5 against h υ and (b) (αh υ ) 2 against h υ for the PVC/PVP/g-C3N4 nanocomposite films.
Polymers 15 00871 g007
Figure 8. Variation in (a) reflectance against wavelength, (b) refractive index against wavelength for the PVC/PVP/g-C3N4 nanocomposite films.
Polymers 15 00871 g008
Figure 9. Variation in (n2 − 1)−1 against h υ 2 for the PVC/PVP/g-C3N4 nanocomposite films.
Polymers 15 00871 g009
Figure 10. Variation in DC conductivity against g-C3N4 content for the PVC/PVP nanocomposite films.
Polymers 15 00871 g010
Table 1. Variation in optical parameters vs. g-C3N4 concentration for the PVC/PVP/g-C3N4 blend nanocomposites.
g-C3N4 Content (wt%)Edir (eV)Eind (eV)E0 (eV)Ed (eV)n0f (eV2)
0.05.295.274.219.881.8341.56
0.35.255.233.6226.792.9096.90
0.65.255.233.1639.413.67124.69
15.375.343.1446.083.96144.51
Table 2. Nonlinear optical parameters for PVC/PVP/g-C3N4 nanocomposites.
g-C3N4 (wt%)χ(1) (esu)χ(3) × 10−13 (esu) n2 × 10−12 (esu)
0.00.192.074.26
0.30.59204.6266.1
0.60.9916501695
1.01.1731633012
Disclaimer/Publisher’s Note: The statements, opinions and data contained in all publications are solely those of the individual author(s) and contributor(s) and not of MDPI and/or the editor(s). MDPI and/or the editor(s) disclaim responsibility for any injury to people or property resulting from any ideas, methods, instructions or products referred to in the content.

