Article

Influence of Mechanical Properties on the Piezoelectric Response of UV-Cured Composite Films Containing Different ZnO Morphologies

by
Donatella Duraccio
1,2,*,
Pier Paolo Capra
2,
Ambra Fioravanti
3 and
Giulio Malucelli
4
1
Istituto di Scienze e Tecnologie per l’Energia e la Mobilità Sostenibili (STEMS), Consiglio Nazionale Delle Ricerche, Strada delle Cacce 73, 10135 Torino, Italy
2
Istituto Nazionale di Ricerca Metrologica (INRIM), Strada delle Cacce 91, 10135 Torino, Italy
3
Istituto di Scienze e Tecnologie per l’Energia e la Mobilità Sostenibili (STEMS), Consiglio Nazionale Delle Ricerche, Via Canal Bianco, 28, 44124 Ferrara, Italy
4
Politecnico di Torino—Dipartimento di Scienza Applicata e Tecnologia, Viale Teresa Michel 5, 15121 Alessandria, Italy
*
Author to whom correspondence should be addressed.
Polymers 2023, 15(5), 1159; https://doi.org/10.3390/polym15051159
Submission received: 31 January 2023 / Revised: 21 February 2023 / Accepted: 23 February 2023 / Published: 25 February 2023
(This article belongs to the Special Issue Surface and Interface of Polymer Nanocomposites)

Abstract

:
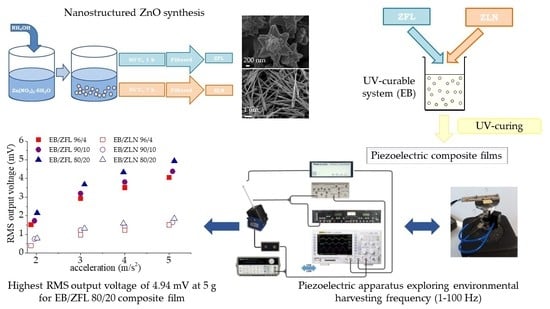
ZnO flower-like (ZFL) and needle (ZLN) structures were synthesized and embedded into UV-curable acrylic resin (EB), with the aim to study the effect of filler loading on the piezoelectric properties of the resulting composite films. The composites showed uniform dispersion of fillers within the polymer matrix. However, by increasing the filler amount, the number of aggregates increased, and ZnO fillers appeared not to be perfectly embedded in polymer film, indicating poor interaction with acrylic resin. The filler content increase caused an increase in glass transition temperature (Tg) and a decrease in storage modulus in the glassy state. In particular, compared with pure UV-cured EB (Tg = 50 °C), 10 wt.% ZFL and ZLN presented Tg values of 68 and 77 °C, respectively. The piezoelectric response generated by the polymer composites was good when measured at 19 Hz as a function of the acceleration; the RMS output voltages achieved at 5 g were 4.94 and 1.85 mV for the composite films containing ZFL and ZLN, respectively, at their maximum loading levels (i.e., 20 wt.%). Further, the RMS output voltage increase was not proportional to the filler loading; this finding was attributable to the decrease in the storage modulus of the composites at high ZnO loading rather than the dispersion of filler or the number of particles on the surface.

Graphical Abstract

1. Introduction

The process by which wind, thermal, solar, and mechanical sources are converted into electrical energy and stored for making self-powered systems is known as energy harvesting. Research and development on energy harvesting devices have rapidly grown in recent years, driven by quickly increasing energy consumption and further accelerated by concerns about carbon emissions from fossil fuel-based energy sources. Among the variety of renewable energy sources, mechanical energy (e.g., pressure, bending, stretching, and vibrational motions) is preferred over other types because of its ubiquity and accessibility from the surroundings [1,2]. The conversion of mechanical energy into electricity has been proposed by means of piezoelectric materials by several research groups [3,4].
A piezoelectric material is able to create a potential when subjected to mechanical stress due to the absence of a symmetry center in its crystals (dipole structure). More precisely, when vibration, tension, bending, or compression [5] results in a deformation of the dipole moment, a polarization phenomenon occurs, which is able to induce an external electric potential difference. There are two piezoelectric effects: the first is the so-called direct piezoelectric effect, which represents the material capability to convert mechanical strain into electricity. This effect can be exploited for designing sensors. The second one is the converse effect, which assesses that material capability to transform an applied electrical potential into mechanical energy (thus behaving as an actuator). Piezoelectric materials are ferroelectric systems in which the peculiar orientation of their molecular structure results in an electric dipole [6,7,8,9,10].
There already exist a number of excellent reviews in the field of energy harvesting describing not only the wide range of possible exploitable materials (namely, lead zirconate titanate (PZT), BaTiO3 (BTO), (Na,K,Li)NbO3, GaN, zinc oxide (ZnO) nanowires, organic films (poly(vinylidene fluoride); PVDF), cellulose, and a combination of them, all deposited on almost all imaginable substrates) but also the survey of potential devices [11,12,13,14,15,16].
Although inorganic materials have been fairly successfully used in energy harvesting, the high cost, as well as the difficult integrability in a device, hinder their true potential. Further, although inorganic materials possess higher piezoelectric coefficients than polymers, they also exhibit higher elastic moduli (i.e., higher stiffness) [17], which makes them less sensitive to small vibrations and more prone to stress failure [18]. However, polymer-based generators represent a relatively small proportion of the total research field and are almost exclusively based on PVDF and cellulose, which need to be polarized under high electrical fields before use [19,20]. In addition, many of the technologies present in the literature involve long and complex manufacturing processes with high cost/benefit ratios.
Among the inorganic components, ZnO has attracted great attention in recent years, because it possesses several key advantages; among them, there is being a biologically safe piezoelectric semiconductor occurring in a wide range of nanostructured forms. Additionally, it is a potential candidate for commercial purposes, due to its inexpensiveness, relative abundance, and chemical stability in air atmosphere. Further, ZnO nanorods can easily grow in aligned arrays on plastic substrates [21]. Moreover, the use of ZnO dispersed in films has been considered for MEMSs/NEMSs (micro- and nanoelectromechanical systems), sensors, and energy harvesting devices [22].
Some pioneering works have explored the possibility to integrate ZnO spherical nanoparticles (at the maximum filler loading of 20 wt.%) into a UV-curable polymer matrix (namely, SU-8) for producing more flexible devices based on cheap and easy-to-be-scaled technologies [23,24]. All the films showed a good response in terms of root mean square (RMS) voltage measured as a function of the applied waveform, both at low and resonance frequencies, notwithstanding that only spherical nanoparticles were investigated.
It is noteworthy that compared with thermal curing, UV curing is more economical, faster, and environmentally friendly. In fact, it does not involve the use of organic solvents, thus lowering volatile organic compound (VOC) emissions [25,26,27].
Acrylic UV-curable systems undergo radical reactions. Primary radicals are generated through the homolytic scission of the photoinitiator, under exposure to UV radiation; the photoinitiator is added to the reacting system at catalyst concentration (at low weight percentages, usually not exceeding 5 wt.%). These primary radicals propagate the reactions by attacking the acrylic double bonds, thus leading to the formation of propagating macroradicals and finally to the formation of a highly cured 3D network in a very short time (tens of seconds are sufficient).
Based on these considerations, we first prepared UV-cured composite films based on acrylic resin filled with different ZnO morphologies (namely, spherical nanoparticles, bipyramidal structures, flower-like structures, and long needles) [28]. These nanostructures were incorporated at constant loading (4 wt.%) into UV-curable resin. It was found that flower-like morphologies exhibited the best piezoelectric performance both at 150 Hz and at resonance frequency, gaining the maximum normalized root mean square (RMS) voltage of 0.914 mV when 5.79 g acceleration was applied. At variance, ZnO needles showed the lowest RMS voltage values; this finding was interpreted based on the possible direction of the (002) crystallographic planes, which was perpendicular to mechanical solicitation and thus less effective from a piezoelectric point of view.
Supported by these preliminary results, in the present work, we decided to prepare UV-cured composite films made of the same acrylic resin filled with flower-like (ZFL) and needle-like (ZLN) zinc oxide (i.e., corresponding to the highest and lowest piezoelectric performances) in different amounts (i.e., 4, 10, and 20 wt.%). In this way, it was possible to thoroughly study the influence of the filler amount on the piezoelectric response of UV-curable films. In particular, we explored a much lower frequency range (namely, from 1 to 100 Hz), corresponding to the environmental harvesting conditions. This was possible because of the use of a new, reliable piezoelectric apparatus, designed on purpose, which allowed us to work under the aforementioned frequency conditions. Further, instead of RH sputtering, a simpler and, at the same time, effective methodology (i.e., silver painting) was employed for providing the UV-cured composite films with the envisaged electrical conductivity.
The completeness of the UV curing process was assessed by means of FTIR-ATR and DSC analyses. SEM analyses of both film surface and cross-section were performed to evaluate the charge density and homogeneity of distribution of ZnO within the polymer matrix. The piezoelectric behavior of the films was investigated at typical environmental vibration energy for harvesting applications (<100 Hz) and correlated with the mechanical properties of the films measured using dynamic–mechanical analyses.

2. Materials and Methods

2.1. Materials

Zinc oxide samples were expressly prepared using wet chemistry processes, obtaining powders of two different morphologies: flower-like (ZFL) and needle-like (ZLN) structures [28]. UV-curable resin was commercial bis-phenol A ethoxylate diacrylate (Ebecryl 150; hereinafter coded as EB), kindly supplied by Cytec Industries BV (Vlaardingen, The Netherlands). 2,2-dimethyl-2-hydroxy acetophenone (Irgacure 1173) from BASF (Cesano Maderno-Monza Brianza, Italy) was used as the photoinitiator.

2.1.1. Synthesis of ZnO Morphologies

The synthesis of both ZnO forms was performed starting from the same amount of Zn precursor, namely, zinc nitrate hexahydrate (Zn(NO3)2•6H2O; ≥99.0%; purchased from Merck) dissolved in water to reach the solution molarity of 0.05 M. Subsequently, the proper amount of ammonium hydroxide (28%; Carlo Erba Reagents, Italy) was added under continuous stirring for adjusting the solution pH to 10. In the case of flower-like powder, the hydrolysis temperature was 60 °C, and the solution temperature was kept constant for one hour. Needle-like powder was obtained by performing hydrolysis at room temperature and treating the mixture at 95 °C for about 7 h. The ZnO precipitates were filtered, washed several times with deionized water and then with diethyl ether (Merck), and dried in an oven overnight. Figure 1 reports a schematic representation of the synthesis of the two different ZnO morphologies.

2.1.2. Preparation of the Nanocomposite Films

Photoinitiator at 4% wt. (Irgacure 1173) was added to acrylic UV-curable resin; then, ZnO fillers were dispersed in resin and ultrasonicated for 30 min at room temperature. ZnO was dried before being mixed in a vacuum oven for 24 h at 80 °C. The mixing ratios of EB/ZnO (wt/wt) were 100/0, 96/4, 90/10, and 80/20. The dispersions composed of photoinitiator, acrylic resin, and ZnO were coated on glass slides, using a wire wound applicator (nominal thickness: 150 μm) and then exposed to UV radiation provided by a UV oven, namely, an F300 S apparatus (Heraeus Noblelight, USA), working under static conditions. The radiation intensity on the sample surface, measured with a UV meter, was about 800 mW/cm2; two not-consecutive exposure periods of 15 s were enough for completing the photopolymerization reaction, also in the presence of the different fillers. The obtained UV-cured films (120 μm thick) were peeled off from the glass substrates and used for the different characterizations and for the fabrication of cantilevers for piezoelectric tests.

2.2. Characterization Techniques

2.2.1. Fourier Transform Infrared (FTIR)-Attenuated Total Reflection (ATR) Spectroscopy

The FTIR-ATR spectra of the obtained films were recorded using a Perkin-Elmer FTIR spectrometer (model Paragon 500 equipment) with the aim to assess the completeness of the photopolymerization process. The spectra (32 scans) were recorded in a 4000–400 cm−1 wavelength range at 4 cm−1 resolution.

2.2.2. Scanning Electron Microscopy (SEM)

The morphology of ZnO powders was investigated using field-emission scanning electron microscopy (FE-SEM), using a Carl Zeiss Sigma microscope equipped with a Schottky field emitter (tip made of <100> tungsten crystal and a ZrO2 reservoir). Additionally, a scanning electron microscope (SEM Zeiss Evo 50 XVP with LaB6 source) was employed for analyzing the surface and the cross-section of the composite films. SEM analysis was also employed for the observation of the laser cut exploited for preparing cantilevers to be used in the piezoelectric tests. For cross-section observation, the samples were fractured in liquid nitrogen. Backscattered electrons were employed for surface analysis. All the films were gold-metalized using an E5 150 SEM coating unit.

2.2.3. Wide-Angle X-ray Diffraction (WAXD)

Wide-angle X-ray diffraction was carried out using a Philips PW 1830 vertical diffractometer with Bragg–Brentano geometry (Cu Kα radiation, 40 kV, 30 mA). Diffraction patterns of ZnO were collected over the range of 2θ = 10–120°, with steps of 0.02° and 10 s of dwell time and were processed using the Rietveld refinement technique using FullProf software (2011 release) [29]. The average crystallite size was calculated by applying the Scherrer formula [30] on the (101) diffraction peak. Diffraction patterns of the composites were collected under the same conditions as the previous ones, over the range of 2θ = 10–60°.

2.2.4. Differential Scanning Calorimetry

The thermal behavior of the composite films was assessed using a Mettler DSC-822 apparatus. DSC analyses were carried out according to the following cycle: (1) heating from 0 °C to 160 °C at 10 °C/min; (2) cooling down to 0 °C at −10 °C/min; and (3) heating from 0 °C to 160 °C at 10 °C/min. The glass transition temperature (Tg) was taken at the midpoint of heat capacity changes. Calibration was performed using indium as the standard (Tm = 156.4 °C; ΔHm = 28.15 J/g).

2.2.5. Dynamic–Mechanical Analyses

Dynamic–mechanical (DMTA) analyses were performed using DMA Q800 (TA Instruments) in tensile configuration on all the composite films. The following experimental conditions were adopted: temperature range from 25 to 120 °C, heating rate of 3 °C/min, 1 Hz frequency, and 0.05% of oscillation amplitude in strain-controlled mode. Storage modulus (E’) and tanδ curves were recorded. Tg values were calculated from the peak value of the tanδ curves. For each formulation, the tests were repeated four times, and the experimental error was calculated as standard deviation for all the measured parameters.

2.2.6. Piezoelectric Measurement Setup

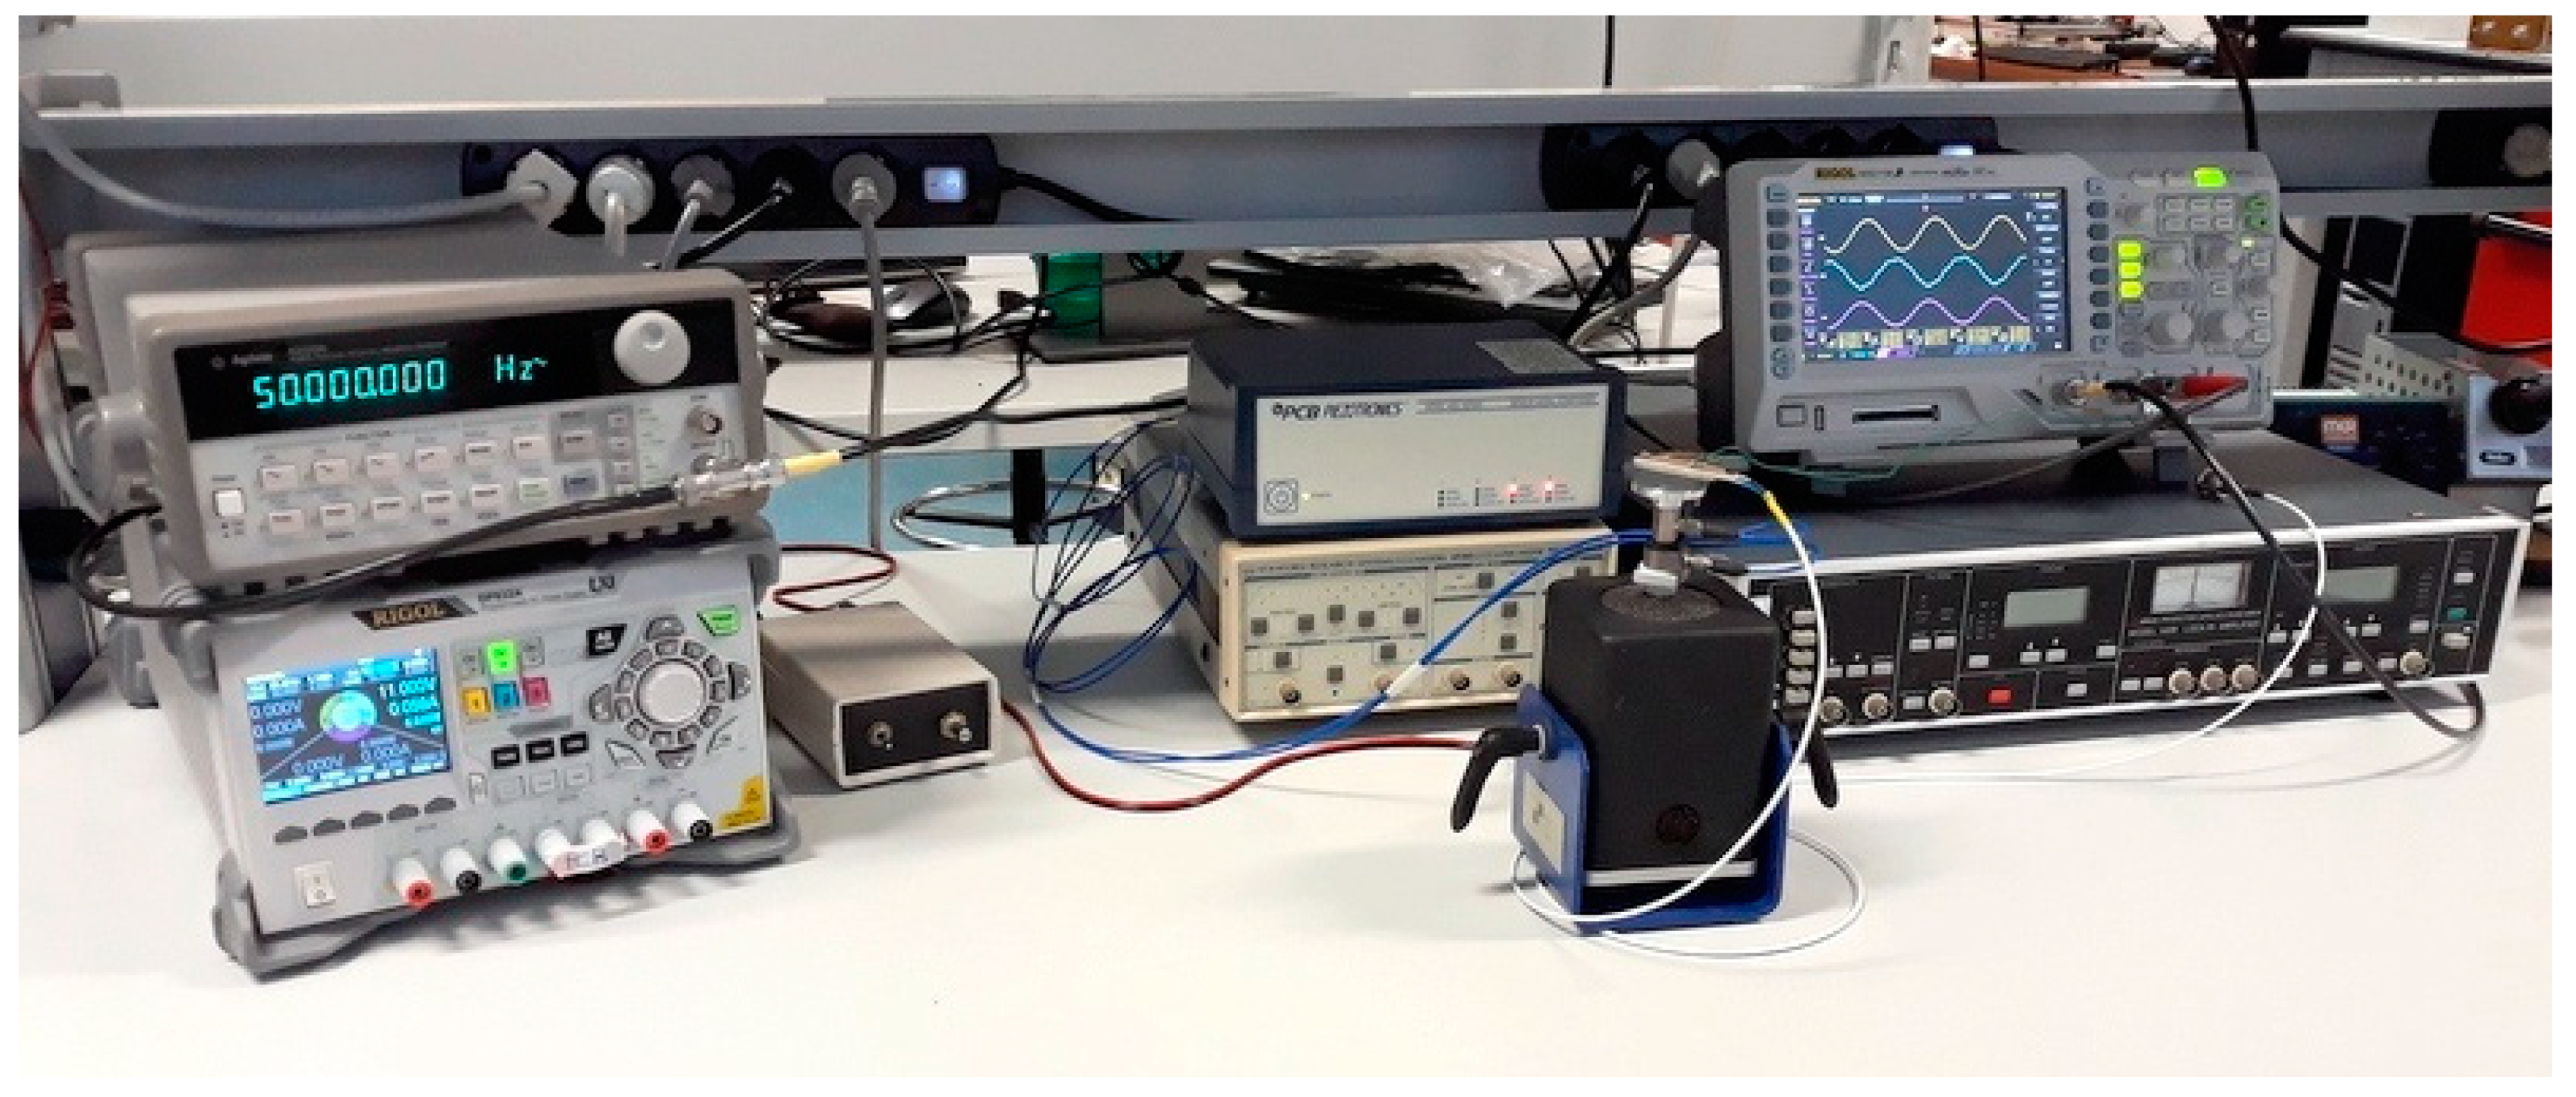
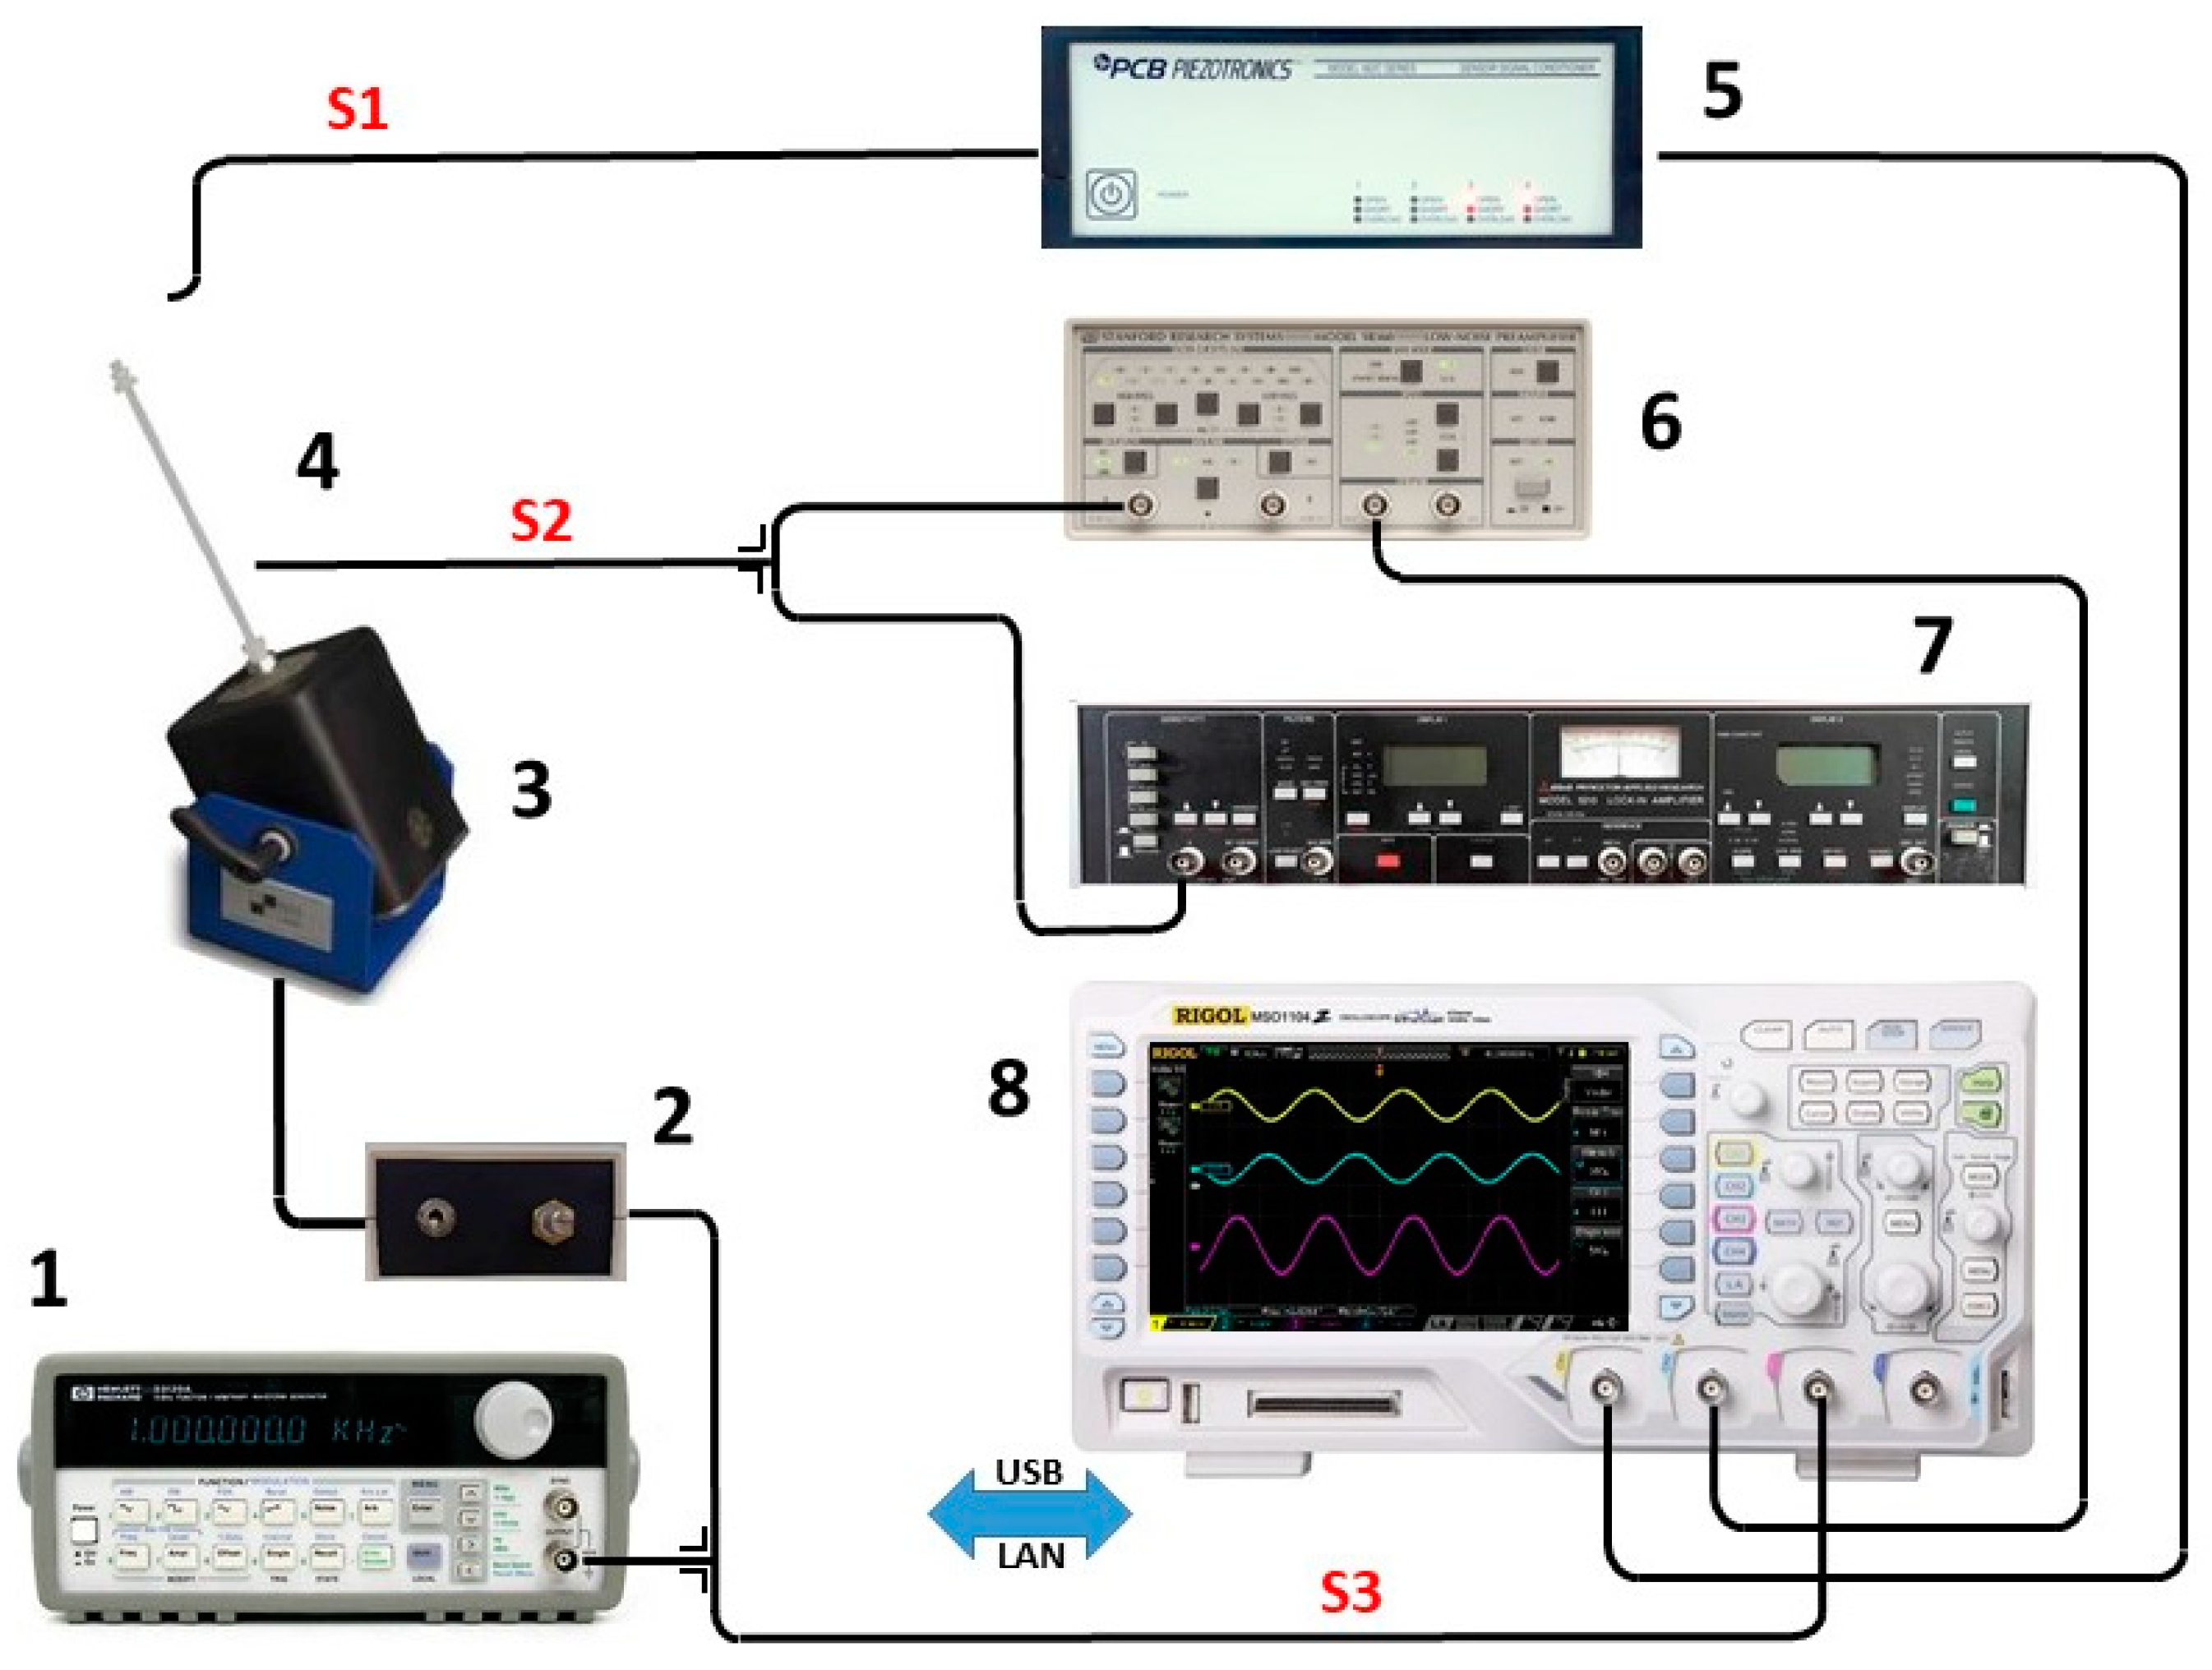
Cantilevers (devices under test; DUTs) of about 10 × 15 mm2 were fabricated by cutting the UV-cured nanocomposite films using a CO2 laser. An SEM image of cut film is reported in Figure 2, evidencing that the laser did not compromise the DUTs. A silver film, working as the electrode to collect the generated charges, was deposited at room temperature on both cantilever sides with a paint brush, using conductive paint. The samples, once positioned in the sample holder, had a free square surface of 1 cm2, which was mechanically stressed to obtain piezoelectric signals (Figure 2). All the materials were tested at typical environmental vibration energy of harvesting applications (<100 Hz) using the experimental measurement system shown in Figure 3. The block diagram of the measurement system developed for the electrical measurements is shown in Figure 4. The sinusoidal excitation signal was generated by a programmable function generator (1) at the chosen frequencies and amplitude.
The generator was connected to an audio frequency amplifier (2), which drove the shaker actuator (3) with a power of about 15 W, enough to move the whole test group (4) consisting of the sample itself, the sample holder, and two calibrated sensors, in the full operative frequency range. The original excitation signal was also fed to both the CH 3 input of the oscilloscope (8) for monitoring and synchronization purposes and the lock-in amplifier (7) as a reference signal for demodulation. The CH 1 input of the oscilloscope was connected to the accelerometer amplifier and conditioned the signals from both the accelerometer and the force sensor for the correct measurement. The piezoelectric signal generated by the DUT was connected to a low-noise amplifier (6), equipped with a series of selectable input filters, through a coaxial cable. The amplifier output was connected to the oscilloscope CH 2 input, which clearly showed, at the same frequency, the amplitude and shape of all measured signals. The piezoelectric characterization measurements were performed in a shielded laboratory for electrical measurements at a nominal temperature of 23.0 °C and 50% humidity.

3. Results and Discussion

3.1. Morphological Analysis of ZnO Powders

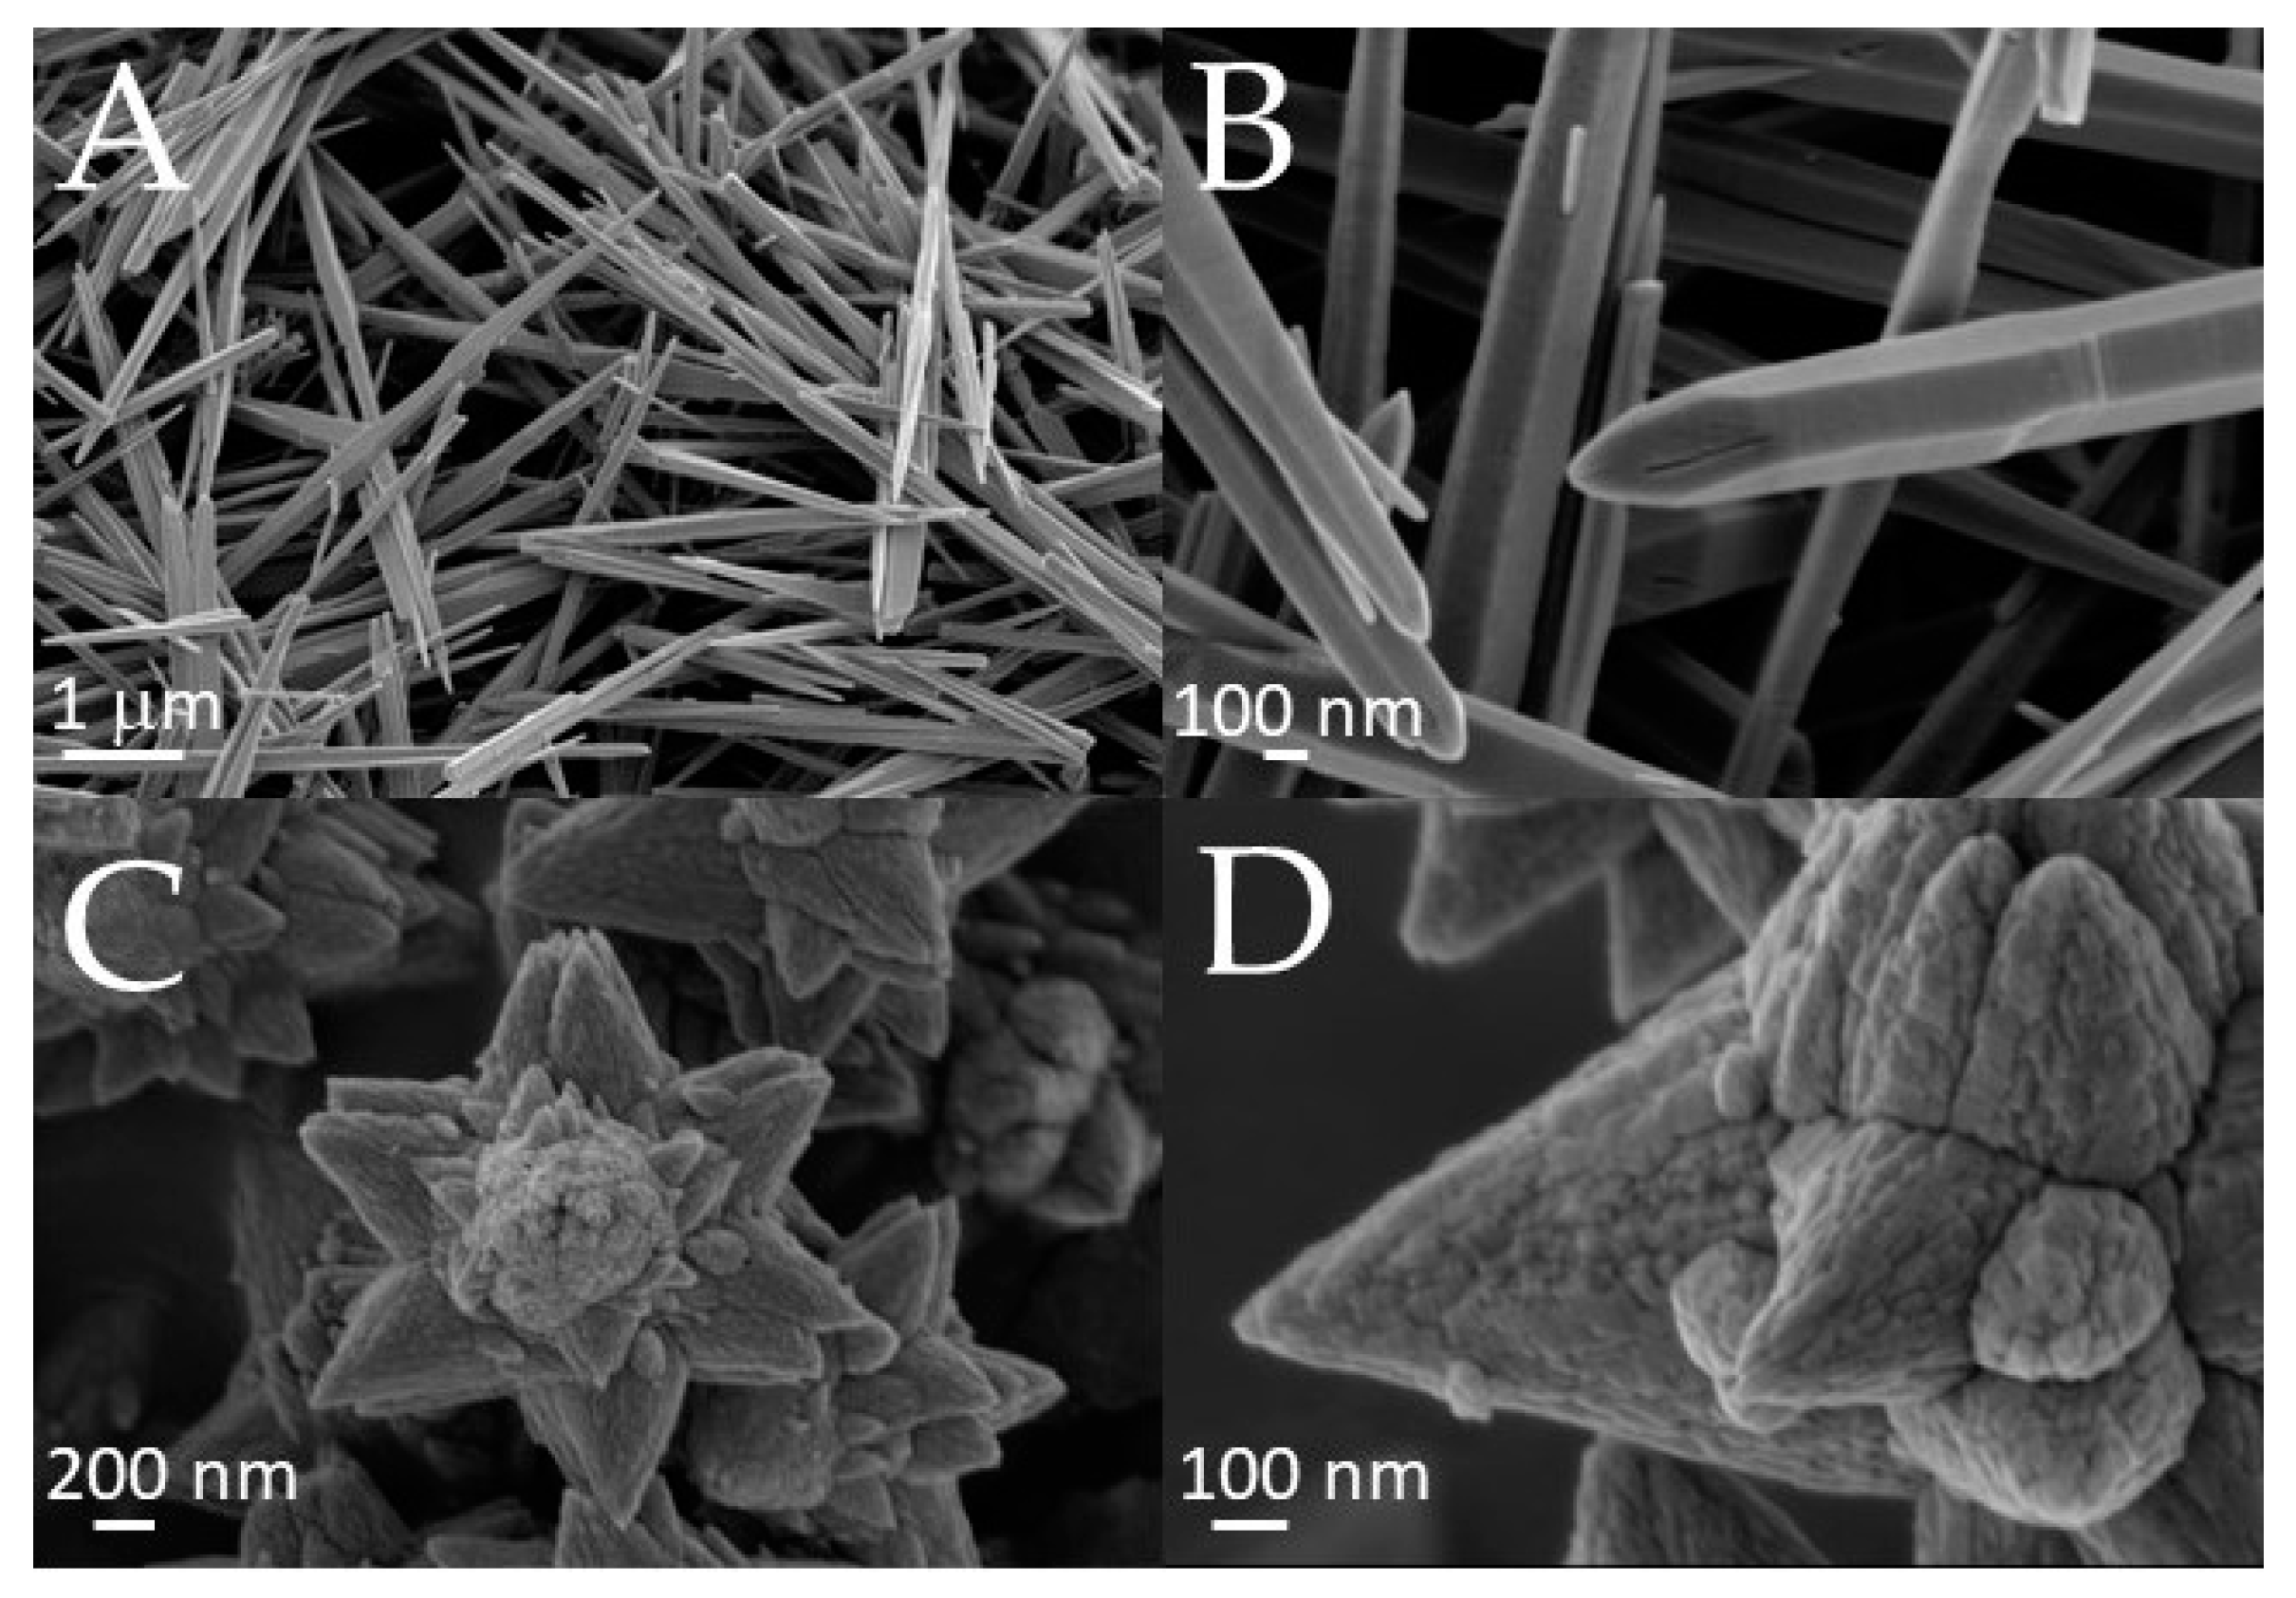
Typical SEM micrographs of the two different ZnO morphologies considered in this work are shown in Figure 5; different magnifications are reported to highlight the features of each different morphology. The ZLN samples (Figure 5A,B) consisted of bi-dimensional nanocrystals shaped as long needles (about 100 nm wide and 7–8 μm long). ZFL powder was characterized by nanoparticles of about 30 nm (Figure 5D) in size assembled in flowers of 1 μm in size (Figure 5C).

3.2. WAXD Analysis of ZnO Nanostructures

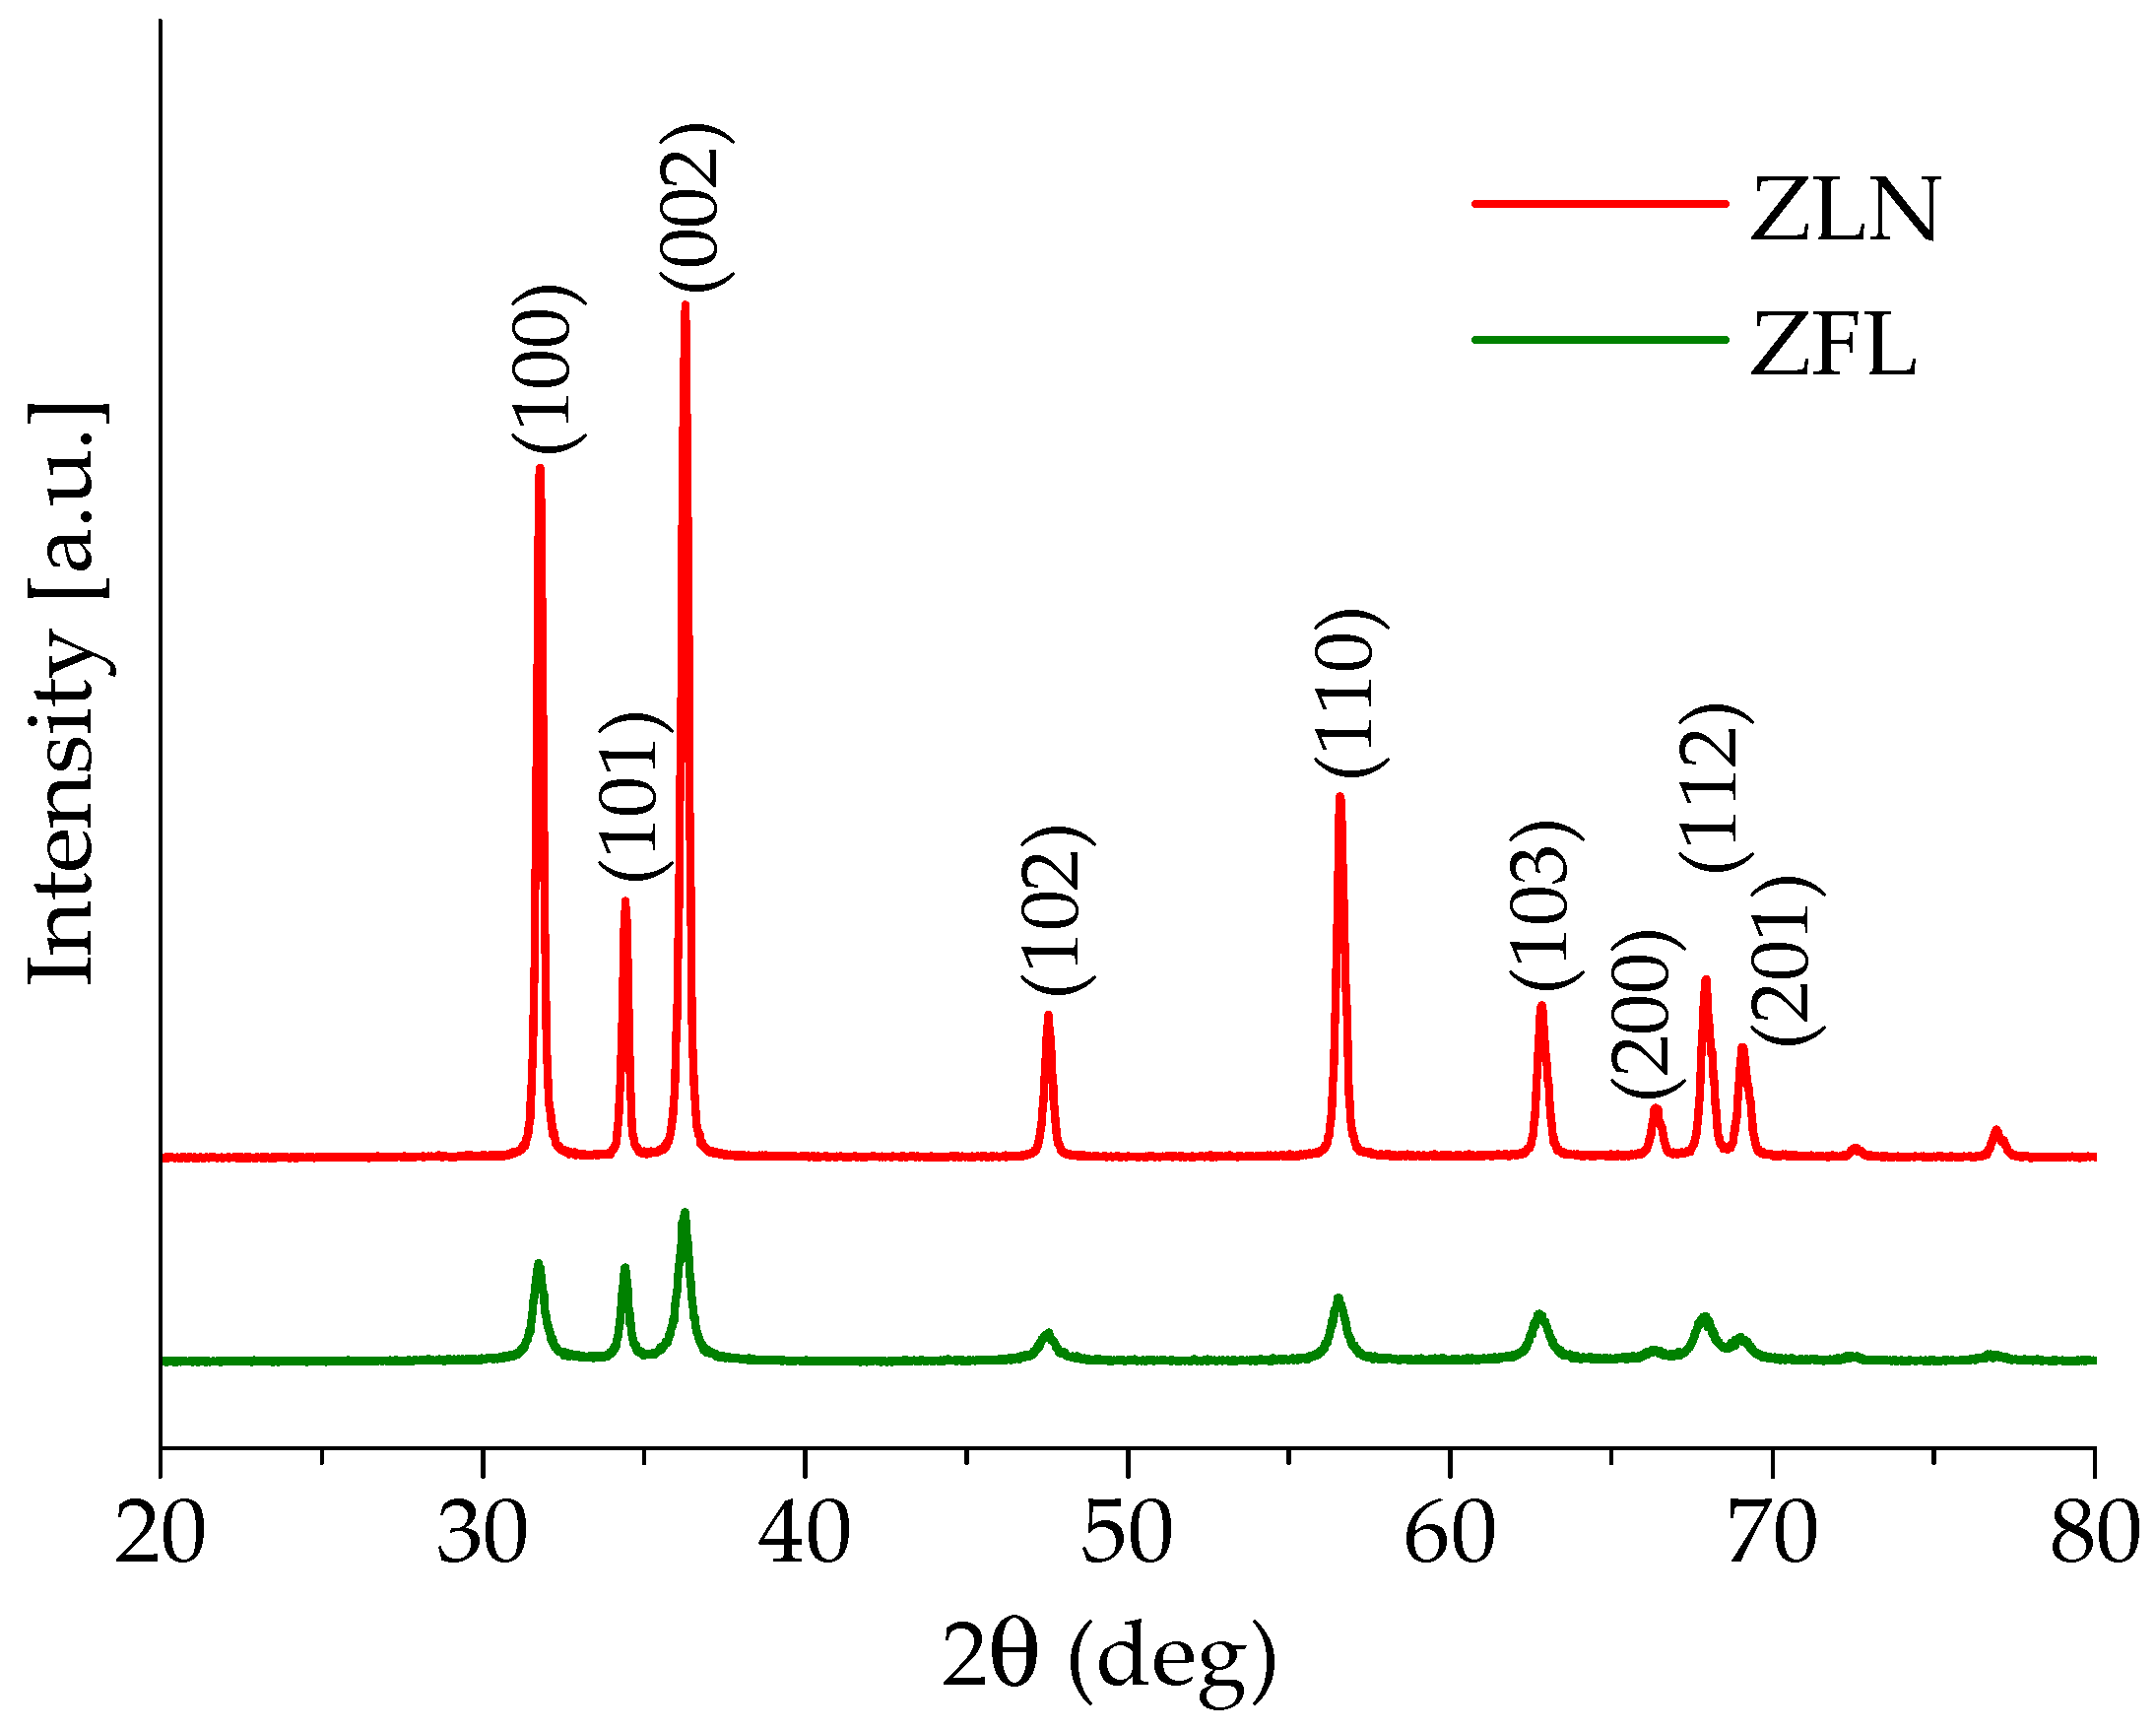
According to the diffraction patterns shown in Figure 6, both synthesized morphologies exhibited a hexagonal wurtzite structure (space group P63mc), irrespective of both the synthesis process and the morphology. The XRD spectra show the typical peaks of zinc oxide, in agreement with those reported in JCPDS card No. 36-1451. The average crystallite sizes, evaluated using the Scherrer formula on the (101) diffraction peaks, resulted to be 30 nm for the ZFL samples and 39 nm for the ZLN samples.

3.3. Structural and Morphological Characterization of Composites

3.3.1. Assessment of the Completeness of the UV Curing Process with FTIR-ATR Spectroscopy

Ebecryl 150 is a commercially available acrylate with high reactivity, especially in combination with suitable photoinitiators. It is well known that the UV curing of acrylate systems occurs at room temperature, providing the system with the ultimate achievable cross-linking density, i.e., with the maximum conversion of double bonds [31]. However, to assess whether the adopted experimental conditions employed for the photocuring process were suitable for achieving the completeness of the double-bond conversion also at high filler loading, attenuated total reflectance-Fourier transform infrared spectroscopy (ATR- FTIR) was employed. As an example, Figure 7 shows the typical spectra, in the range between 1800 and 1550 cm−1, of systems containing ZLN and ZFL morphologies (ZFL in different amounts), before (Figure 7A) and after (Figure 7B) exposure to UV radiation.
In all cases, the complete disappearance of the band at 1635 cm−1 is evident, indicating that all the acrylic double bonds [32] participated in the curing reaction. This finding, as reported in the next paragraph, is further supported by the absence of exothermal peaks in the first-heating-stage DSC thermogram traces.

3.3.2. DSC Characterization of Composite Films

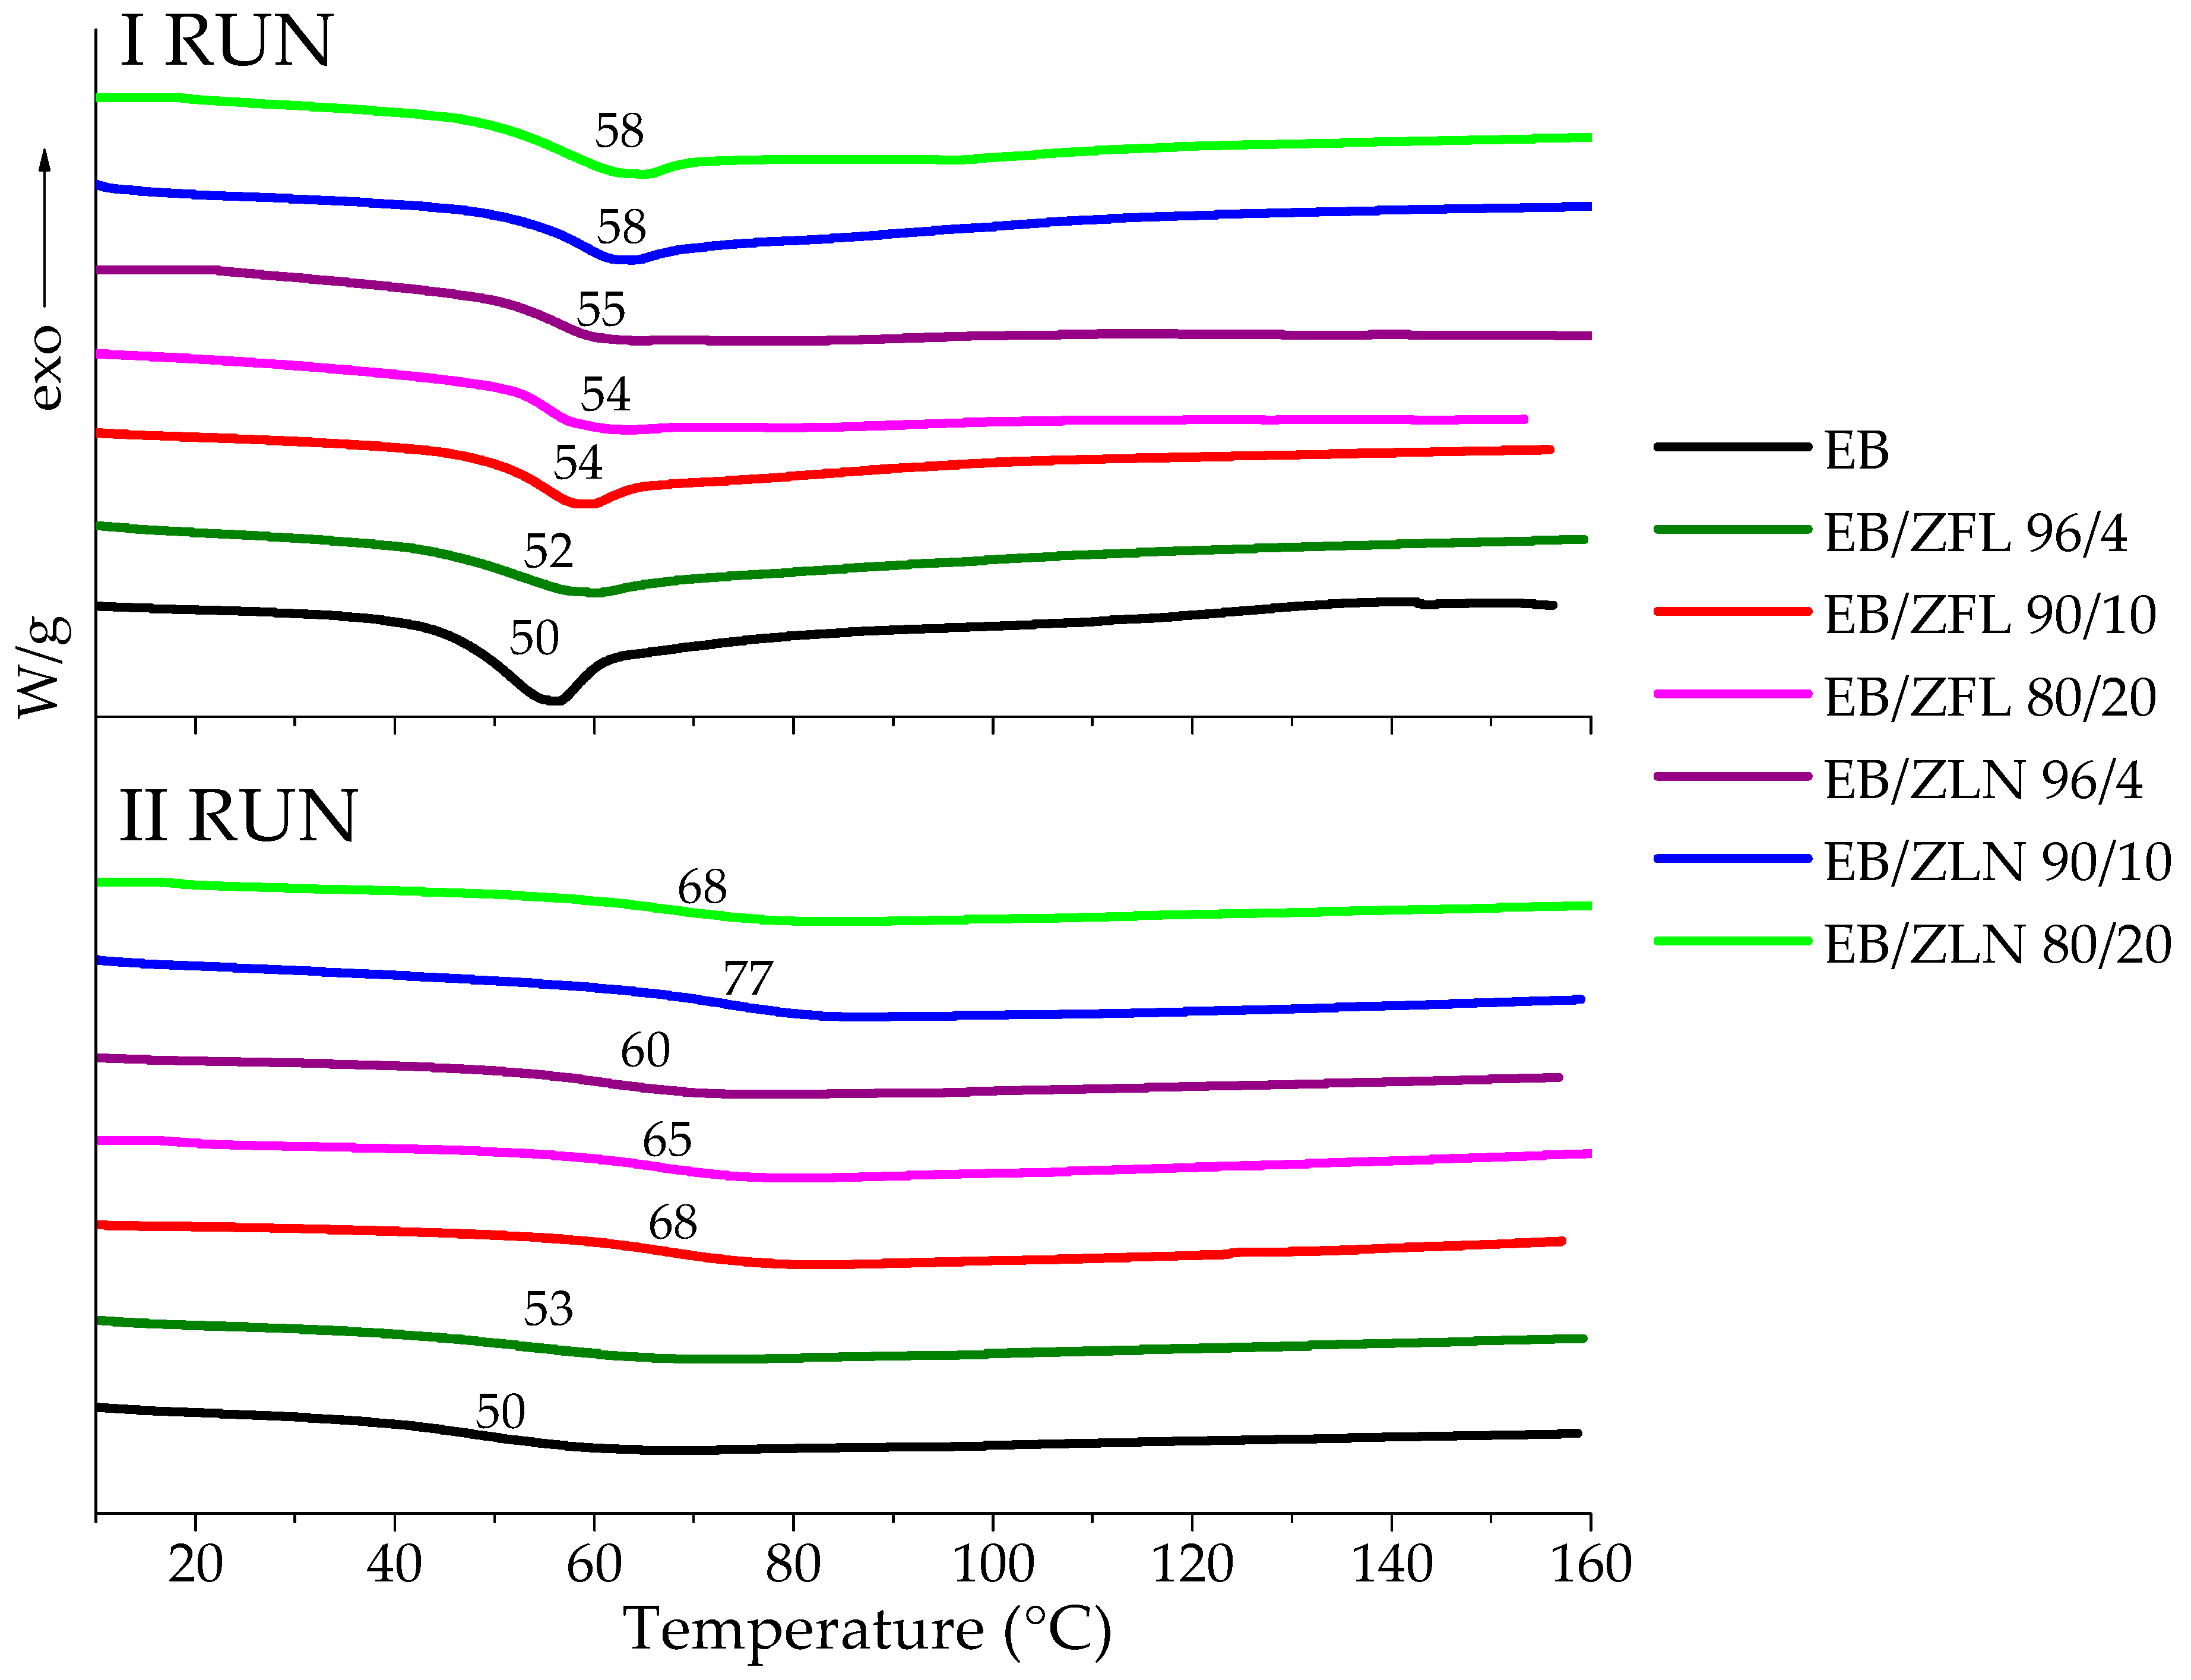
DSC measurements were performed to both confirm the completeness of the curing process and to investigate the influence of fillers on the glass transition temperature of the EB matrix. In Figure 8, the first and second heating DSC runs for the ZFL and ZLN composite films are presented. For all the samples, in the first run, the enthalpy relaxation superimposed on the specific heat changes associated with the glass transition of the polymer was ascribed to the fast UV curing process used for preparing the composite films; the process freezes the macromolecules in a non-equilibrium thermodynamic state. Furthermore, in the first run, no exothermic phenomena were observed aside from enthalpy relaxation, thus indicating that the completeness of the curing process was achieved under the adopted experimental conditions, even in the presence of different fillers and different filler loading levels. The different amounts of filler did not significantly modify the Tg (I RUN) of resin (i.e., Tg = 52 °C, 54, and 54 °C for EB/ZFL 96/4, EB/ZFL 90/10, and EB/ZFL 80/20; Tg = 55 °C, 58, and 58 °C for EB/ZLN 96/4, EB/ZLN 10, and EB/ZLN 20, respectively).
In the second run, enthalpy relaxation disappeared, and only glass transition was detectable, which was higher than that in the first run. All the composites had significantly higher Tg than unfilled resin, indicating that the fillers limited the mobility of the EB macromolecules, which re-arranged in a more stable conformational structure after the first heating-and-cooling cycle [33].

3.3.3. Morphological Analysis of EB-ZnO Surfaces

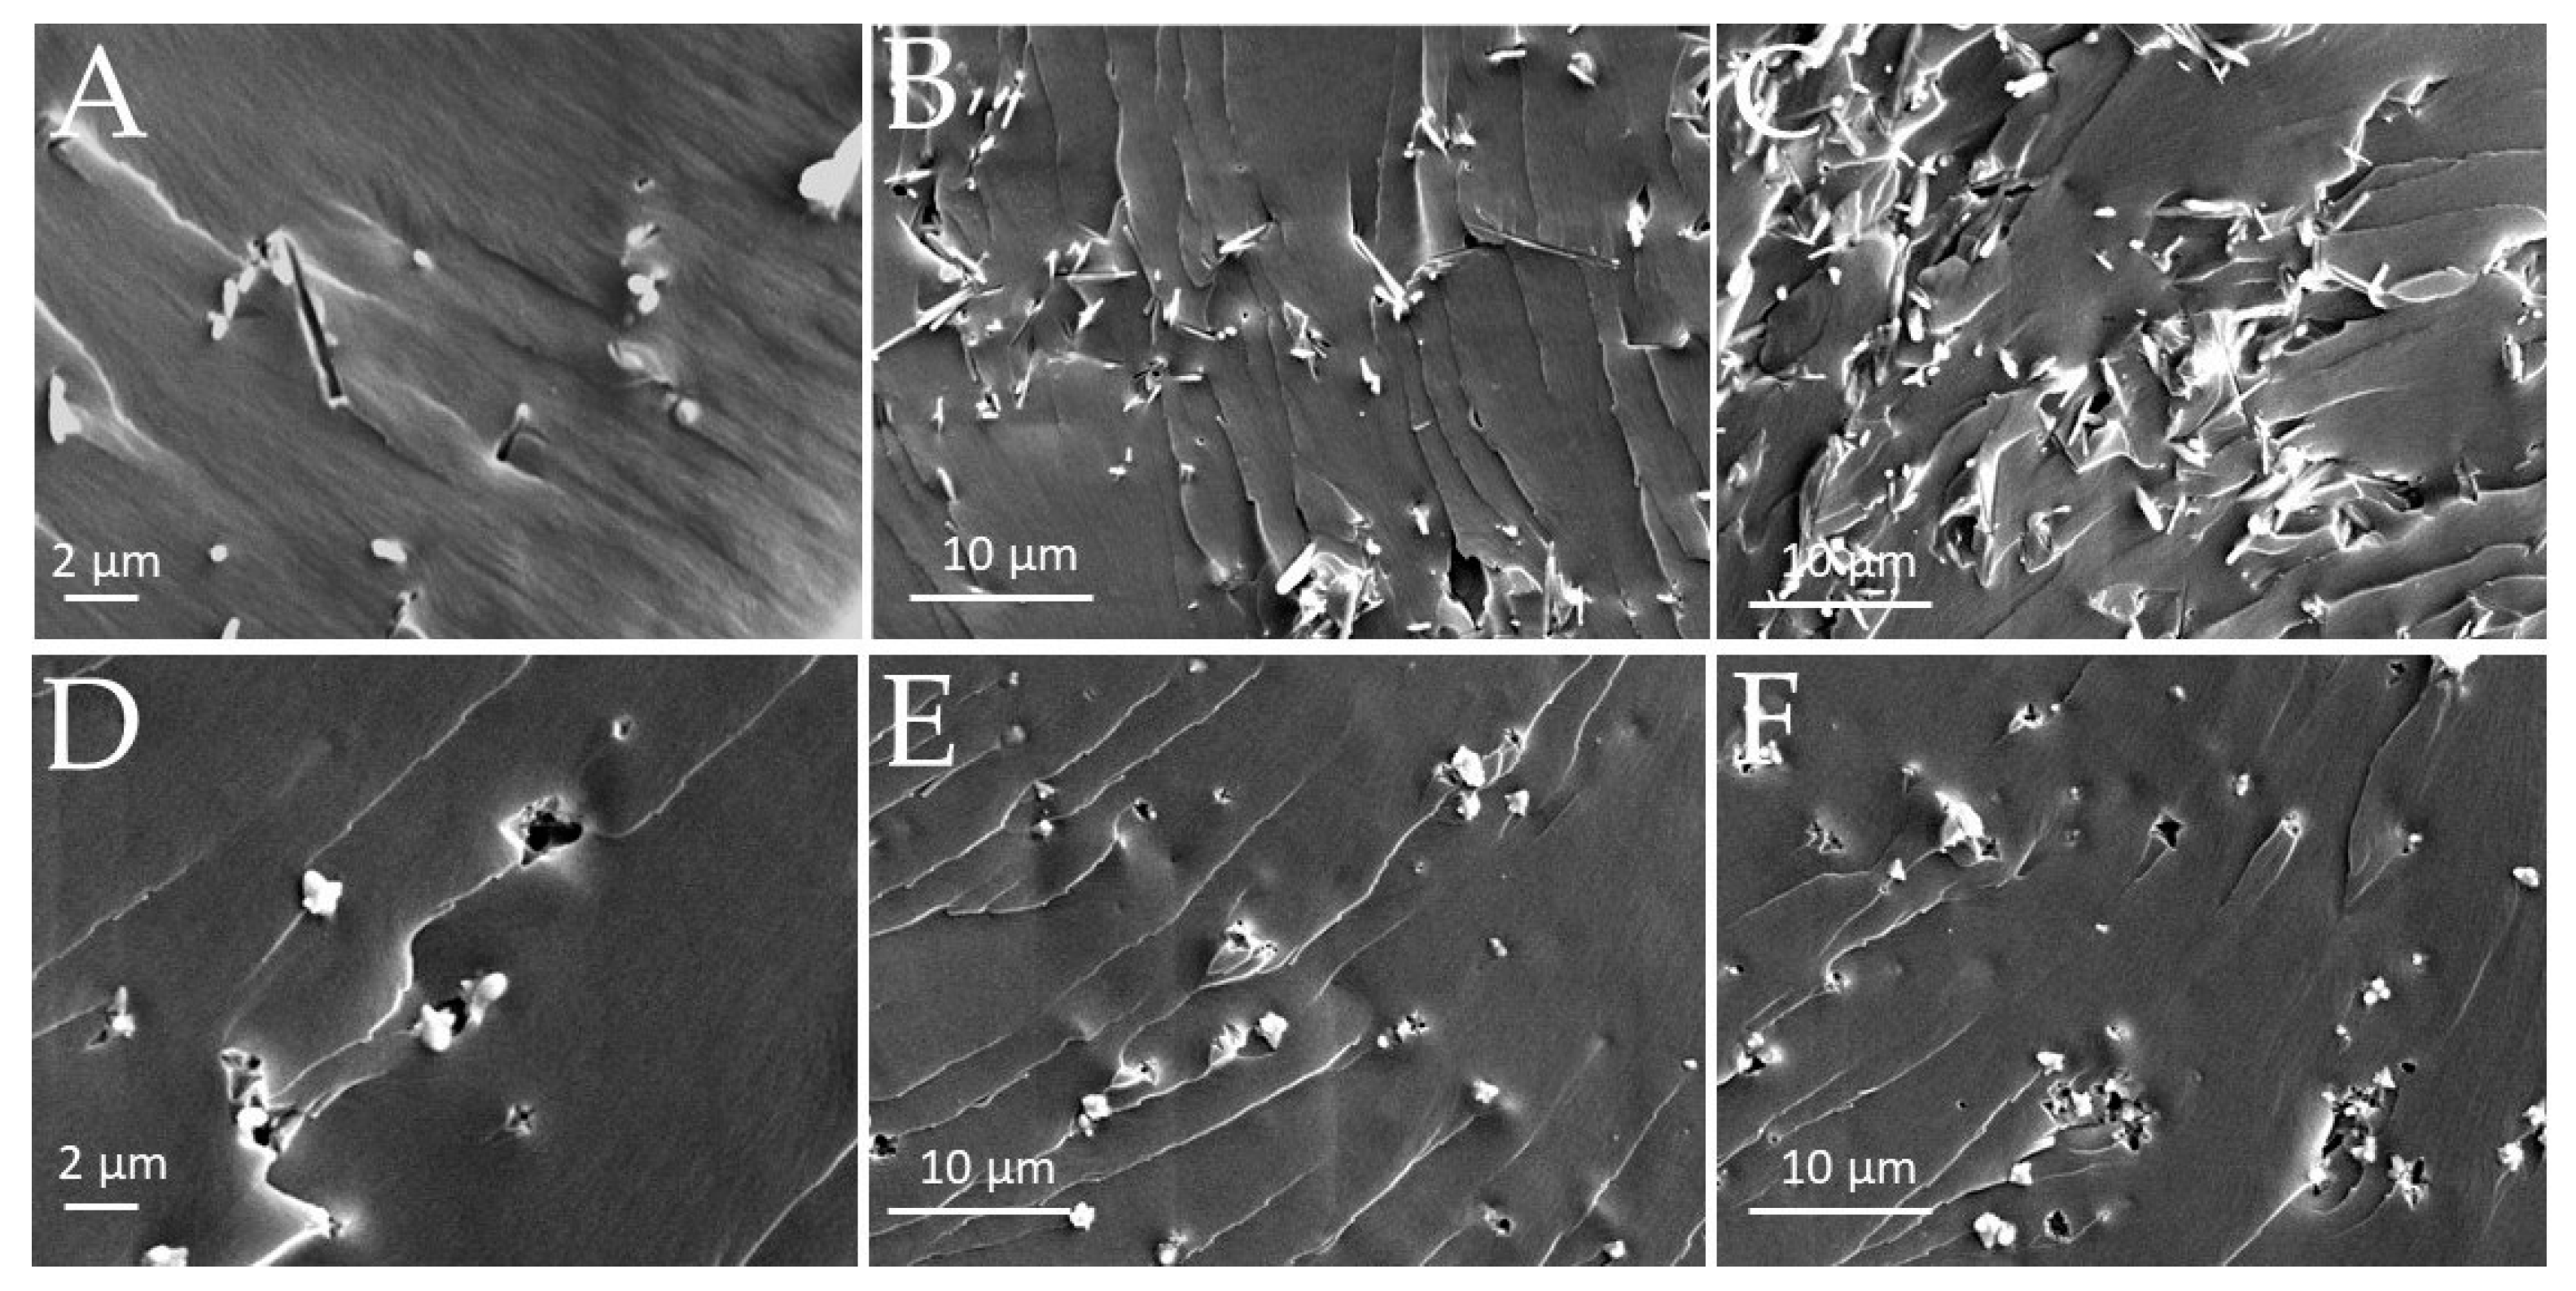
The SEM micrographs of cryogenically fractured surfaces of ZnO composite films are shown in Figure 9. Different magnifications are reported to evidence the morphological features of each composite. In both series of ZnO composites, ZLN and ZFL particles maintained their morphology and showed an almost uniform distribution within the polymer matrix. By increasing the filler amount, the number of aggregates increased. In some points, both ZLN and ZFL fillers appeared not to be perfectly embedded in the polymer matrix (evidencing the presence of voids) and/or to have been pulled out during fracturing, indicating poor interaction with acrylic resin.
The piezoelectric response of composites, which will be discussed in the next section, could be interpreted in terms of the piezoelectric element density present on the surface of the films. For this reason, the SEM micrographs of ZFL and ZLN composite surfaces containing 4, 10, and 20 wt.% of filler are compared in Figure 10. It is clear that, independently from the analyzed morphology, all the composite surfaces showed a good distribution of piezoelectric filler, and that the element density increased with the increase in filler loading.

3.3.4. Structural Analysis of ZnO Composites

The X-ray diffraction patterns of ZnO composites were characterized by the presence of the broad amorphous halo centered at about 2θ = 19° due to the acrylic polymer matrix. The most interesting result provided by these measurements is the different orientation of the characteristic crystallographic plane of ZFL and ZLN in the composite films. In Figure 11A,B, the diffraction patterns of ZLN and ZFL composites, respectively, at different filler loading levels, are reported in the range between 30 and 37°. The curves were normalized with respect to the (110) crystallographic peak. As expected, no variations in the relative intensity of the peaks occurred by changing the ZnO loading. Furthermore, by comparing ZFL and ZLN composites (Figure 11C), it is noteworthy that the composite containing ZLN had a low amount of (002) planes oriented according to the plane of the film, whereas these planes were more abundant in the films incorporating ZFL. This result is important because it could help to understand the different behavior in terms of piezoelectric response.

3.3.5. Dynamical–Mechanical Thermal Analyses of EB Composite Films

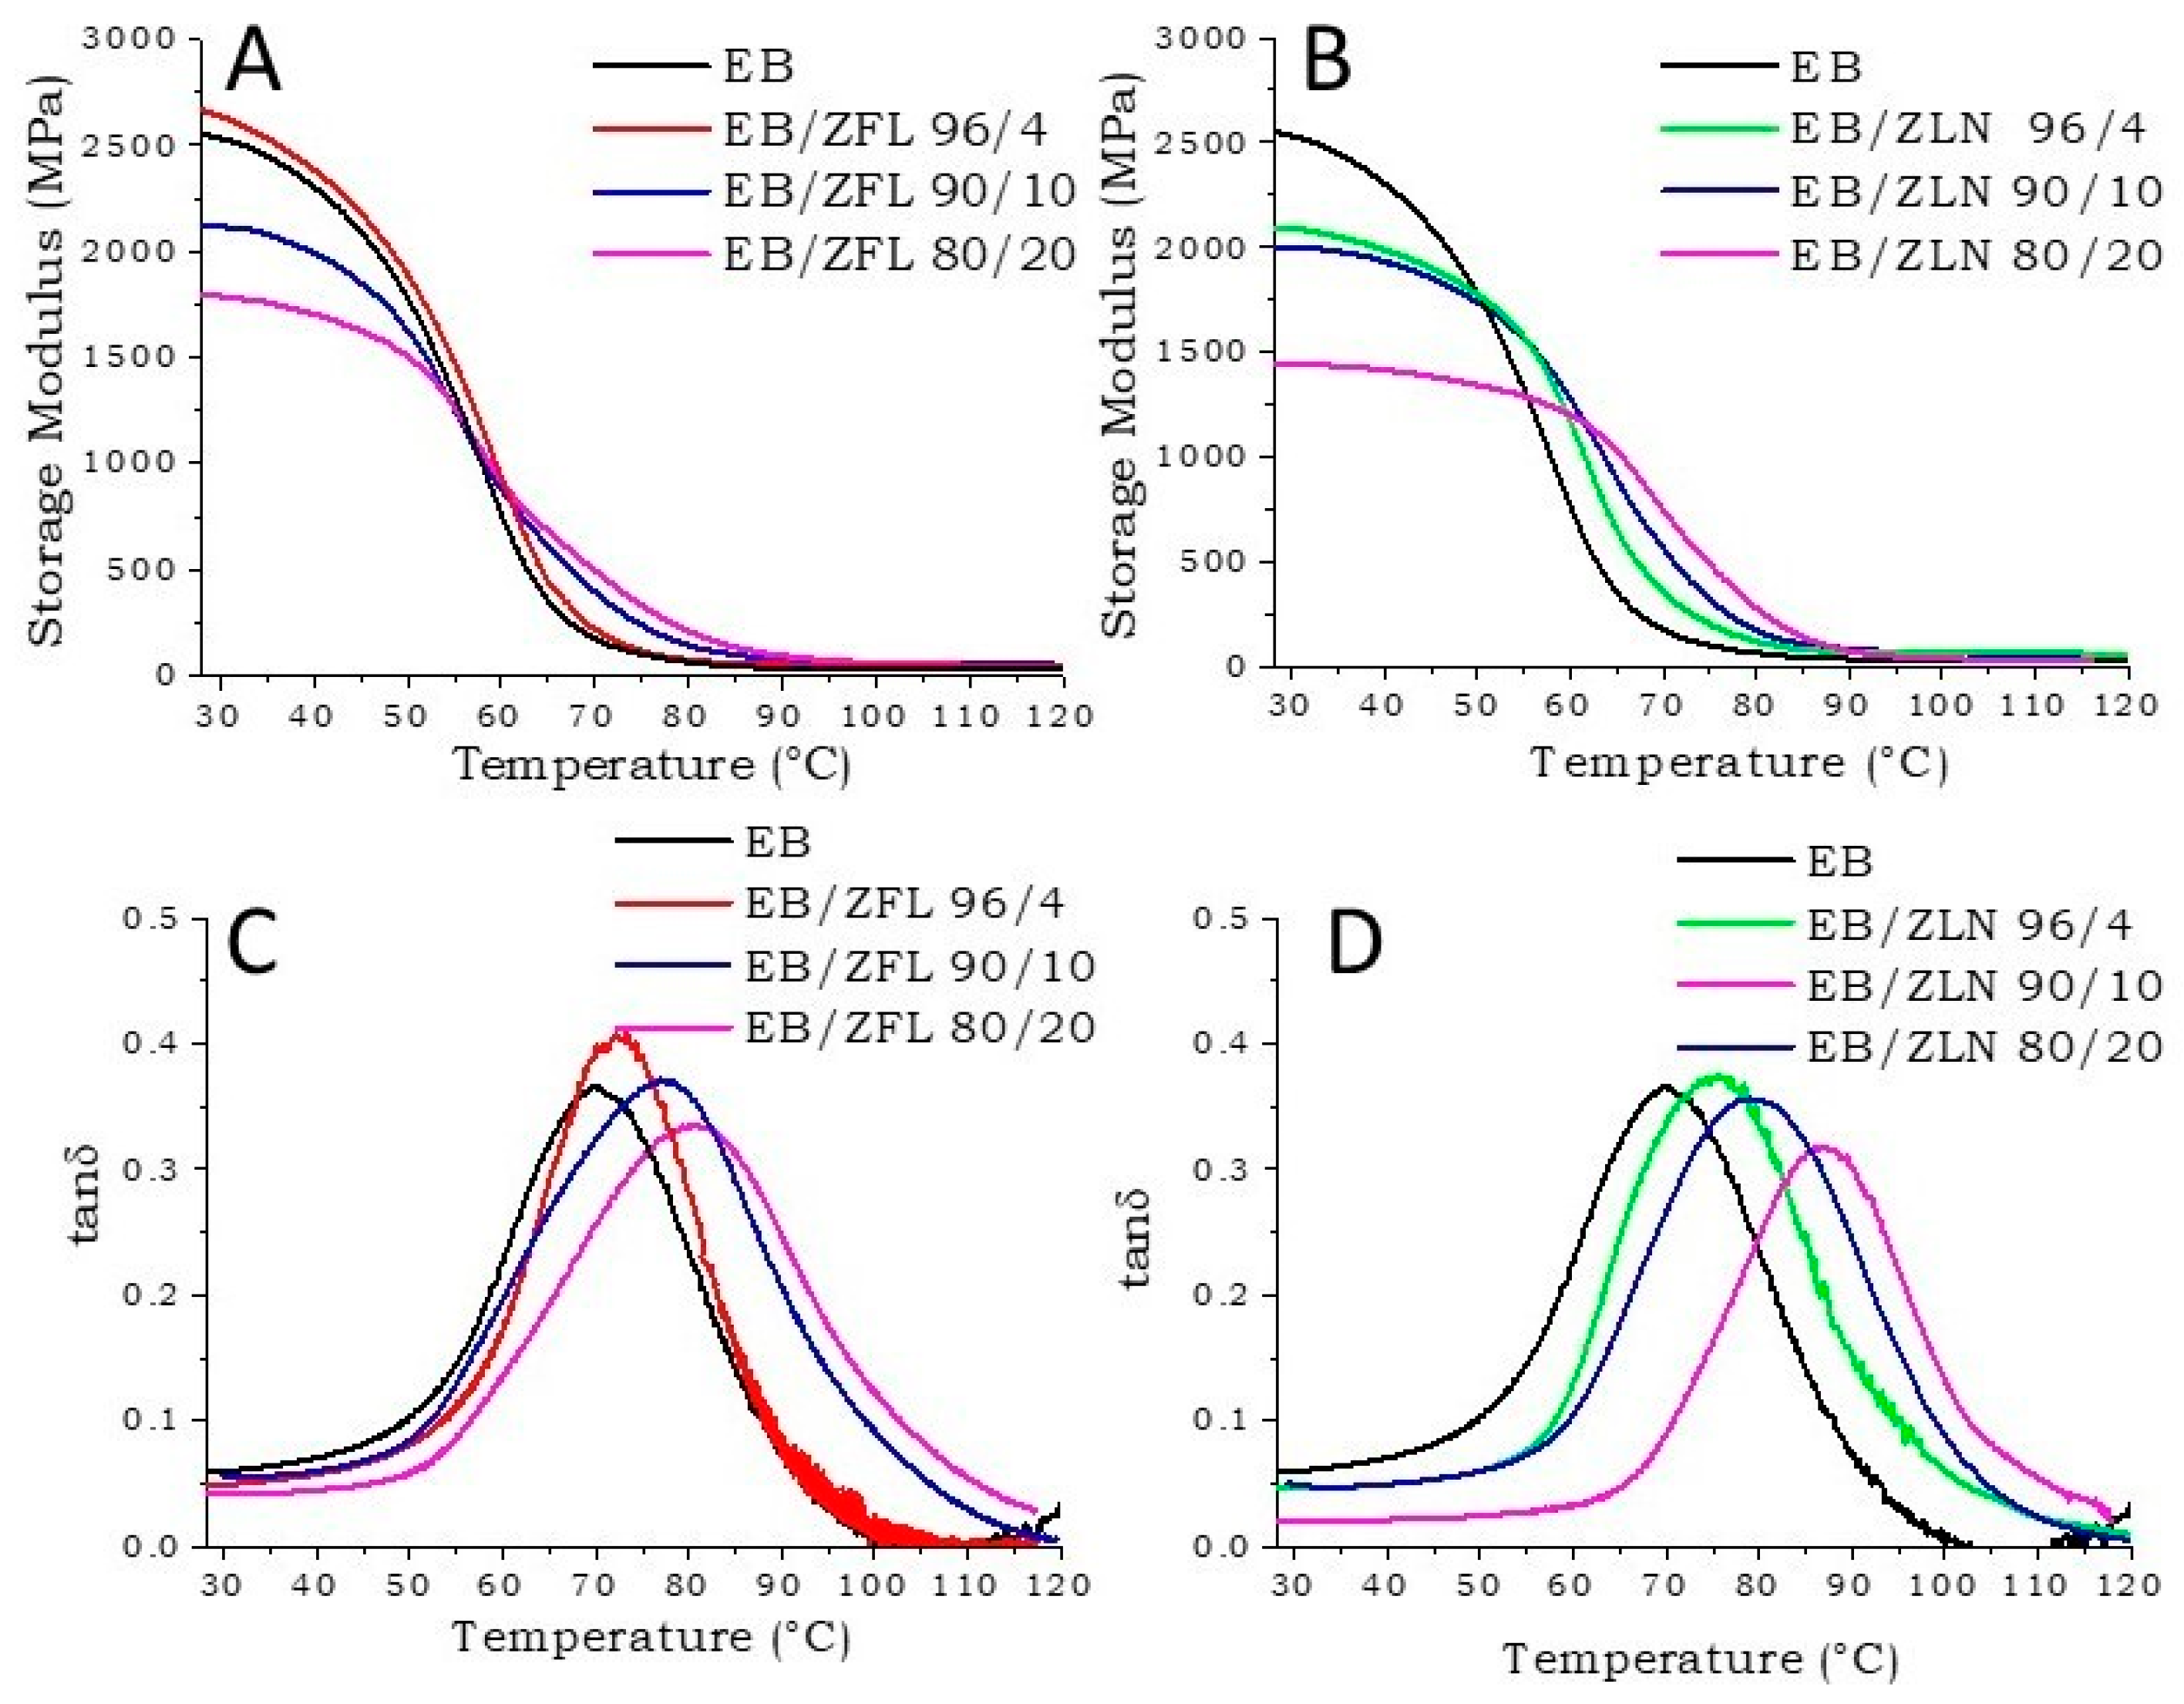
Figure 12A,C show the storage modulus and tanδ of EB composites with different amounts of ZFL, respectively. From a general point of view, it is possible to observe that by increasing the ZFL loading, (i) the storage modulus (Figure 12A) in the glassy state decreased, probably due to the presence of poor interaction and/or voids (also evidenced by SEM analyses) between polymer chains and fillers, and (ii) Tg increased (peak of tanδ in Figure 12C), because as already observed using DSC, ZnO acted as a reinforcement of the polymer network [34,35]. Further, the tanδ curves broadened due to restriction effects, suggesting a slight suppression of the glass transition by the presence of ZnO particles [36].
The same behavior was shown by EB/ZLN composites, as shown in Figure 12B,D. However, the composites containing ZLN filler had higher Tg and lower storage modulus in the glassy state than those containing ZFL at equal filler loading (Table 1). The most remarkable effect of ZLN with respect to ZFL particles can be probably ascribed to the different sizes of the two fillers; in fact, ZLN nanoparticles were about 100 nm wide and 7–8 μm long, while ZFL particles were 1 µm large.

3.3.6. Piezoelectric Behavior at Low Frequencies (≤100 Hz)

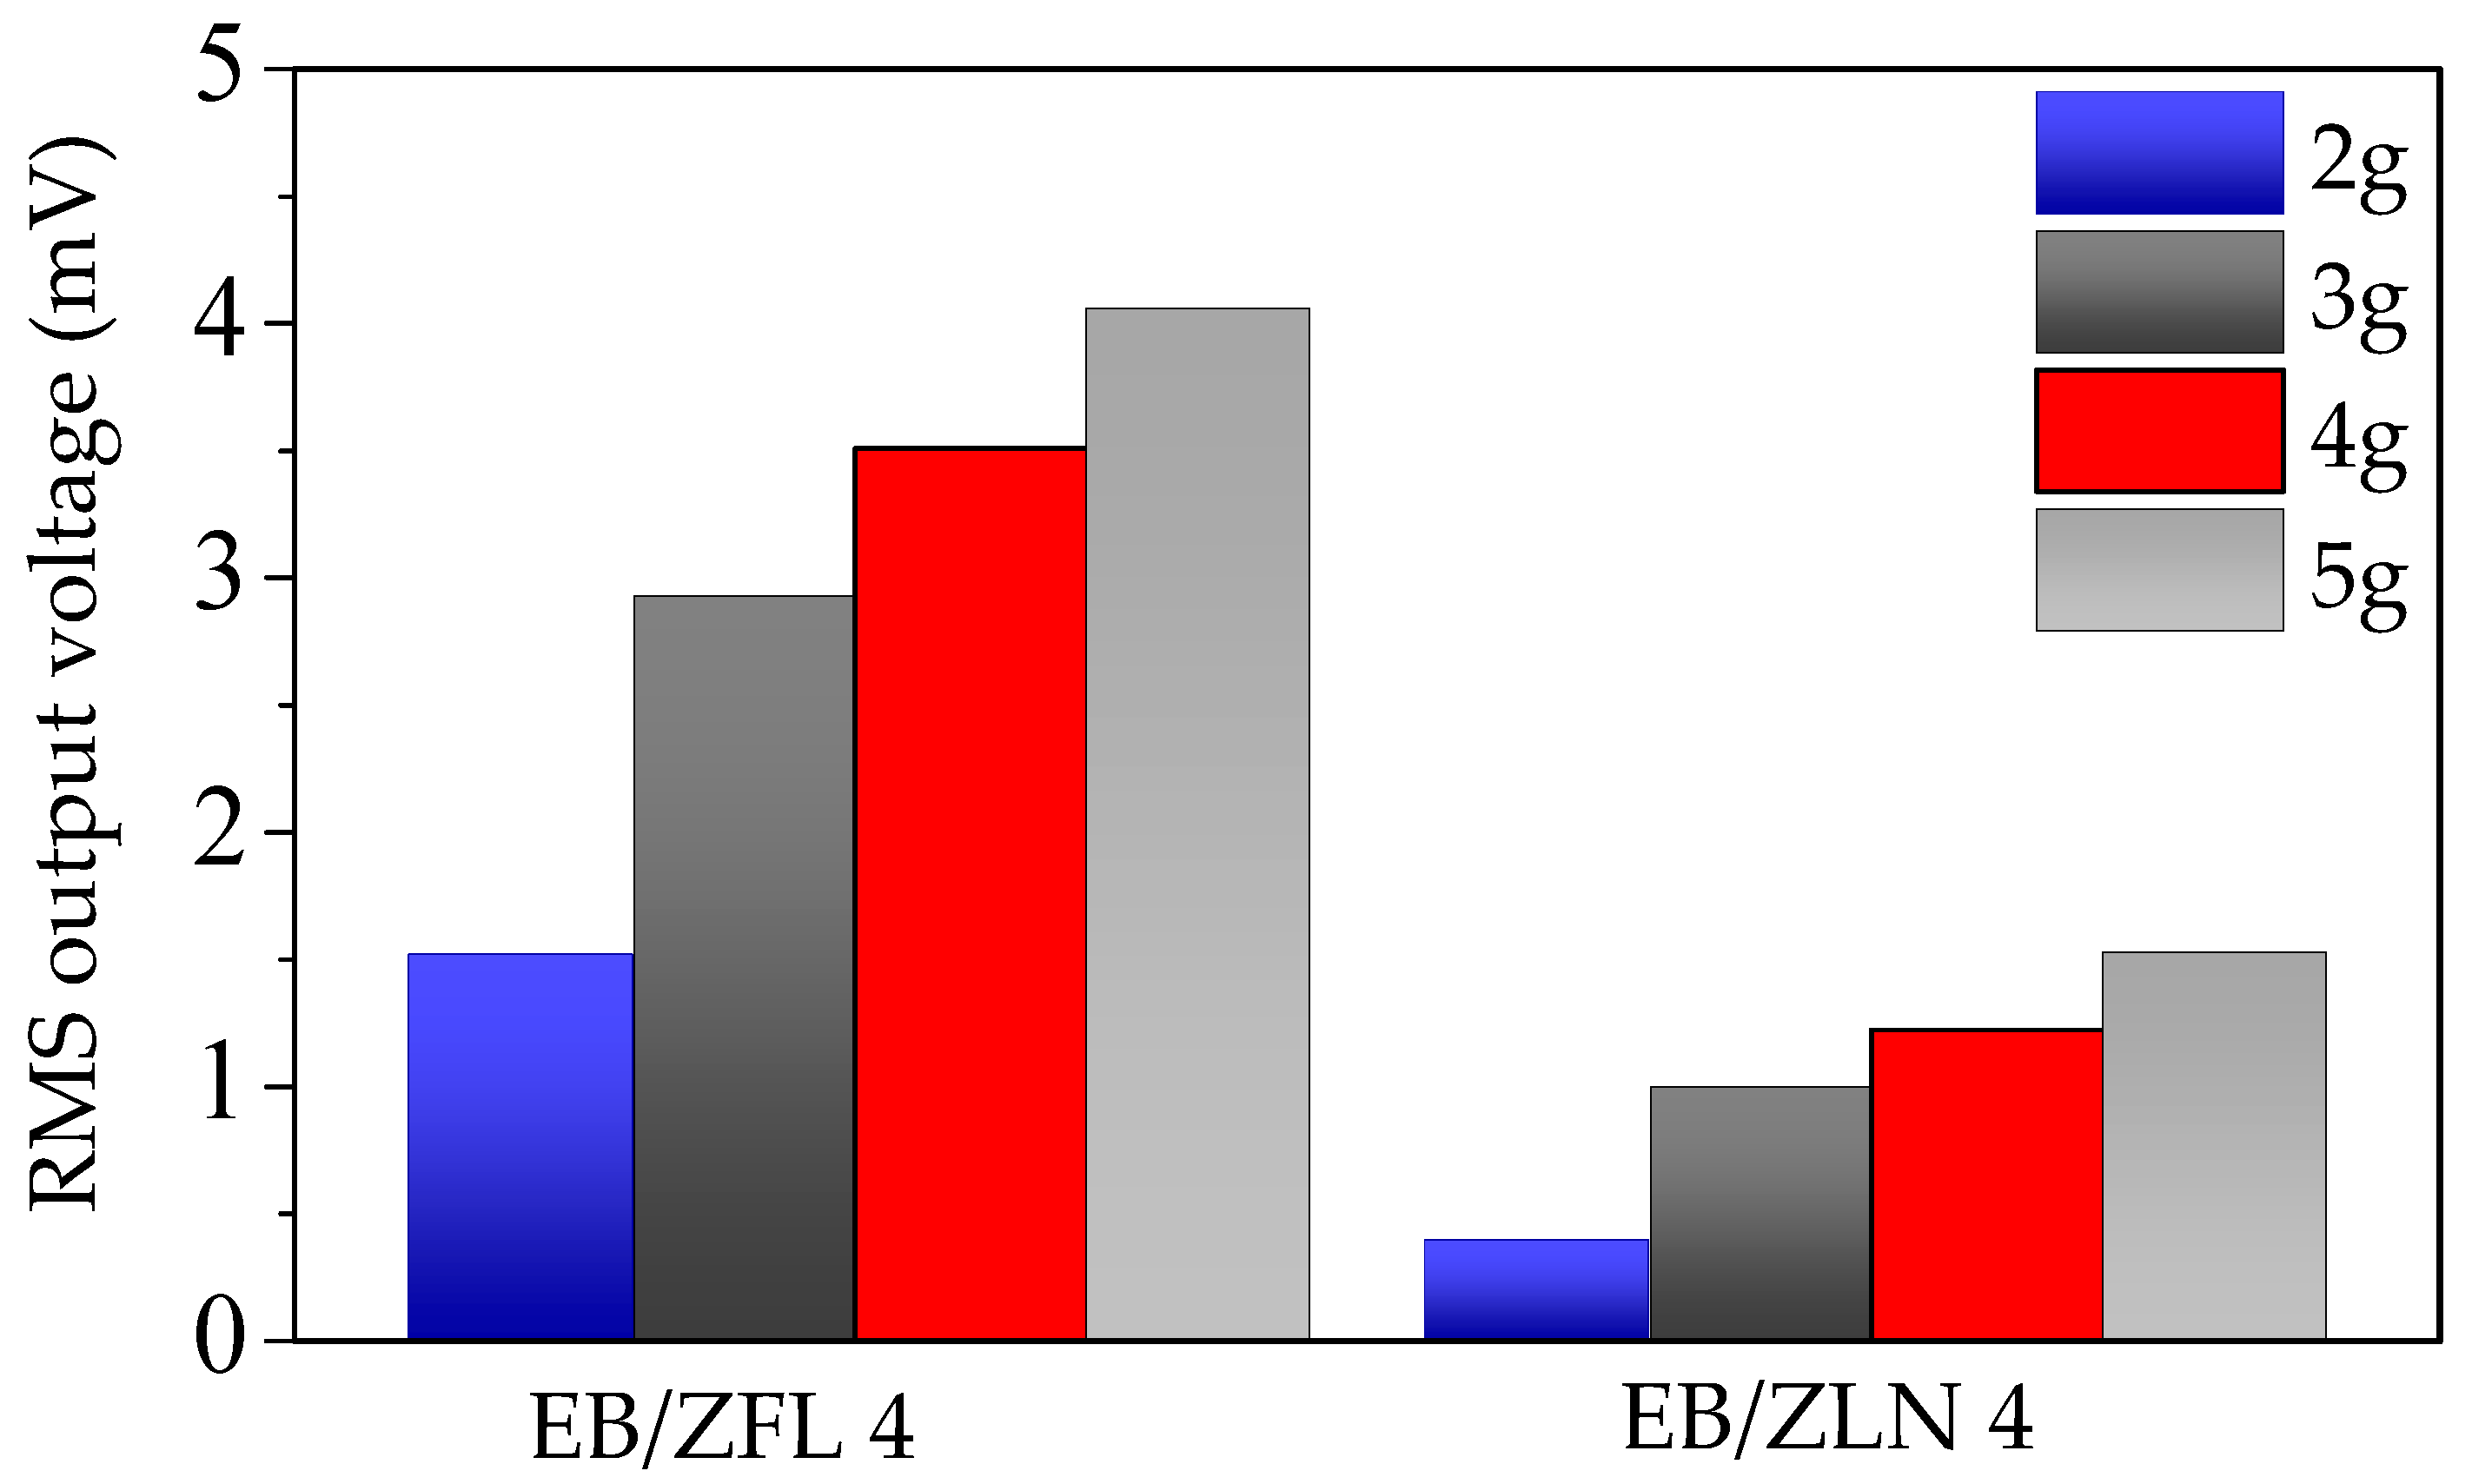
The effective piezoelectric properties of composite films were examined with a specific investigation on similar samples made of unfilled UV-cured resin. The generated voltages vs. excitation frequency were normalized to maximum acceleration, and the obtained values were elaborated as root mean square (RMS) to compare the results with the filled systems. The normalized generated voltages of EB film at low frequencies (below 100 Hz) were close to the noise limit, without any correlation with the excitation frequency. This result clearly indicates that bare resin is not able to generate any electrical signal when solicited at frequencies below 100 Hz, as already found at higher frequencies and acceleration values [28]. Conversely, EB/ZnO composite films displayed enhanced generation properties. Figure 13 shows the normalized voltage RMS values (of samples containing 4 wt.% of ZnO) at 19 Hz and different accelerations (2, 3, 4, and 5 g) as an example.
The highest RMS voltage was registered in EB/ZFL across all the range of analyzed frequencies and irrespective of the loading. To explain the different particle behavior, it is important to consider that the piezoelectric effect of ZnO is linked to the orientation of the (002) crystallographic planes; if these planes are oriented perpendicularly to the applied solicitation, piezoelectricity can be detected [37]. In EB/ZFL films, even if ZFL particles have random orientations, their peculiar geometry justifies the possibility that a portion of (002) planes are oriented in the desired direction, thus giving rise to voltage generation upon solicitation. Conversely, in EB/ZLN films, the z-direction of needles mainly lies on the plane of the film (as also evidenced by the SEM images shown in Figure 9 and Figure 10). This means that (002) planes, being perpendicular to their z-direction [38,39], are mainly parallel to mechanical solicitation, thus determining lower RMS voltages. The increase in ZnO positively affects the piezoelectric response of the composites; as shown in Figure 14, the RMS voltage generated at 19 Hz as a function of the acceleration increased in the presence of the highest amount of ZFL and ZLN used (i.e., 20 wt.%). However, the increase was not proportional to the amount of filler and was even worse for ZLN composites.
These results do not depend on the dispersion of filler or on the number of particles, which increased with the increase in filler loading, as observed using SEM (Figure 10). The piezoelectric response as a function of the filler amount seems more linked to the decrease in storage modulus of the composites at higher ZnO concentrations. The presence of voids and poor interaction between filler and matrix was probably responsible for the reduction in the crystallographic distortion induced in ZnO particles by mechanical solicitation during the tests.
Finally, it is worthy to underline that despite the large gap between the measured voltage values in this work and those related to fully inorganic piezoelectric systems (which are two–three orders of magnitude higher) [38,39], the proposed piezoelectric films show two main advantages, i.e., flexibility and cost-effective scalability, which represent key elements in the design and development of innovative devices in the field of green technologies [40,41,42].

4. Conclusions

ZnO in the shape of flowers (ZFL) and needles (ZLN) was synthesized and embedded into UV-curable acrylic resin (EB), with the aim to study the effect of filler loading on the piezoelectric properties of the resulting composite films. As a result, 120 μm thick films were obtained with the highest achievable cross-linking density.
The composites showed uniform dispersion of fillers within the polymer matrix. However, by increasing the filler amount, the number of aggregates increased. In some points, both ZLN and ZFL fillers appeared not to be perfectly embedded in the polymer matrix (presence of voids) and/or to have been pulled out during fracturing, indicating poor interaction with acrylic resin.
By increasing the filler content, the glass transition temperature (Tg) increased, and the storage modulus in the glassy state decreased. The piezoelectric response generated by the polymer composite films was good in terms of RMS (root mean squared) voltage measured at 19 Hz as a function of the acceleration; it was higher when the highest amount of ZFL was used (i.e., 20 wt.%), though the increase was not proportional to the filler loading. This did not depend on the dispersion of filler or on the number of particles on the surface. The piezo-behavior seemed more related to the decrease in storage modulus of the composites at high ZnO loading.

Author Contributions

Conceptualization, D.D.; methodology, D.D.; software, P.P.C., A.F. and D.D. validation, G.M. and D.D.; formal analysis, D.D.; investigation, A.F., D.D. and P.P.C.; resources, G.M.; data curation, D.D.; writing—original draft preparation, D.D.; writing—review and editing, D.D.; supervision, G.M.; funding acquisition, G.M. and P.P.C. All authors have read and agreed to the published version of the manuscript.

Funding

This research received no external funding.

Institutional Review Board Statement

Not applicable.

Data Availability Statement

Not applicable.

Conflicts of Interest

The authors declare no conflict of interest.

References

  1. Maamer, B.; Boughamoura, A.; Fath El-Bab, A.M.R.; Francis, L.A.; Tounsi, F. A review on design improvements and techniques for mechanical energy harvesting using piezoelectric and electromagnetic schemes. Energy Convers. Manag. 2019, 199, 111973. [Google Scholar] [CrossRef]
  2. Bowen, C.R.; Kim, H.A.; Weaver, P.M.; Dunn, S. Piezoelectric and ferroelectric materials and structures for energy harvesting applications. Energy Environ. Sci. 2014, 7, 25–44. [Google Scholar] [CrossRef] [Green Version]
  3. Chang, C.; Tran, V.H.; Wang, J.; Fuh, Y.-K.; Lin, L. Direct-write piezoelectric polymeric nanogenerator with high energy conversion efficiency. Nano Lett. 2010, 10, 726–731. [Google Scholar] [CrossRef] [PubMed]
  4. Beeby, S.P.; Tudor, M.J.; White, N.M. Energy harvesting vibration sources for microsystems applications. Meas. Sci. Technol. 2006, 17, R175–R195. [Google Scholar] [CrossRef] [Green Version]
  5. Kim, H.S.; Kim, J.-H.; Kim, J. A review of piezoelectric energy harvesting based on vibration. Int. J. Precis. Eng. Manuf. 2011, 12, 1129–1141. [Google Scholar] [CrossRef]
  6. Dineva, P.; Gross, D.; Müller, R.; Rangelov, T. Piezoelectric Materials. In Dynamic Fracture of Piezoelectric Materials. Solid Mechanics and Its Applications; Springer: Cham, Switzerland, 2014; Volume 212. [Google Scholar]
  7. Steven, R.A.; Sodano, H.A. A review of power harvesting using piezoelectric materials. Smart Mater. Struct. 2007, 16, R1. [Google Scholar]
  8. Uchino, K. Advanced Piezoelectric Materials: Science and Technology; Woodhead Publishing: Cambridge, MA, USA, 2017. [Google Scholar]
  9. Sodano, H.A.; Inman, D.J.; Park, G. A Review of Power Harvesting from Vibration using Piezoelectric Materials. Shock. Vib. Dig. 2004, 36, 197–205. [Google Scholar] [CrossRef] [Green Version]
  10. Vijaya, M.S. Piezoelectric Materials and Devices: Applications in Engineering and Medical Sciences; CRC Press: Boca Raton, FL, USA, 2012. [Google Scholar]
  11. Panda, P.K.; Sahoo, B. PZT to Lead Free Piezo Ceramics: A Review. Ferroelectrics 2015, 474, 128–143. [Google Scholar] [CrossRef]
  12. Priya, S.; Song, H.-C.; Zhou, Y.; Varghese, R.; Chopra, A.; Kim, S.-G.; Kanno, I.; Wu, L.; Ha, D.S.; Ryu, J.; et al. A review on piezoelectric energy harvesting: Materials, methods, and circuits. Energy Harvest. Syst. 2019, 4, 3–39. [Google Scholar] [CrossRef]
  13. Nechibvute, A.; Chawanda, A.; Luhanga, P. Wireless sensor networks for scada and industrial control systems. Smart Mater. Res. 2013, 3, 853481. [Google Scholar]
  14. Wang, Z.L.; Zhu, G.; Yang, Y.; Wang, S.; Pan, C. Progress in nanogenerators for portable electronics. Mater. Today 2012, 15, 532–543. [Google Scholar] [CrossRef]
  15. Hiralal, P.; Unalan, H.; Amaratunga, G.A.J. Nanowires for energy generation. Nanotechnology 2012, 23, 194002. [Google Scholar] [CrossRef] [PubMed]
  16. Covaci, C.; Gontean, A. Piezoelectric Energy Harvesting Solutions: A Review. Sensors 2020, 20, 3512. [Google Scholar] [CrossRef] [PubMed]
  17. Soin, N.; Shah, T.H.; Anand, S.C.; Geng, J.; Pornwannachai, W.; Mandal, P.; Reid, D.; Sharma, S.; Hadimani, R.L.; Bayramol, D.V.; et al. Novel ‘‘3-D spacer’’ all fibre piezoelectric textiles for energy harvesting applications. Energy Environ. Sci. 2014, 7, 1670–1679. [Google Scholar] [CrossRef]
  18. Cha, S.N.; Kim, S.M.; Kim, H.; Ku, J.; Sohn, J.I.; Park, Y.J.; Song, B.G.; Jung, M.H.; Lee, E.K.; Choi, B.L.; et al. Porous PVDF as effective sonic wave driven nanogenerators. Nano Lett. 2011, 11, 5142–5147. [Google Scholar] [CrossRef] [PubMed]
  19. Signore, M.A.; De Pascali, C.; Duraccio, D.; Malucelli, G.; Fioravanti, A.; Melissano, E.; Martucci, M.C.; Masieri, M.; Siciliano, P.; Francioso, L. Synthesis and characterization of UV-curable nanocellulose/ZnO/AlN acrylic flexible films: Thermal, dynamic mechanical and piezoelectric response. J. Polym. Sci. 2021, 138, 49731. [Google Scholar] [CrossRef]
  20. Wang, Y.; Zhu, L.; Du, C. Progress in Piezoelectric Nanogenerators Based on PVDF Composite Films. Micromachines 2021, 12, 1278. [Google Scholar] [CrossRef]
  21. Choi, M.-Y.; Choi, D.; Jin, M.-J.; Kim, I.; Kim, S.-H.S.-W.; Choi, J.-Y.; Lee, S.Y.; Kim, J.M. Mechanically Powered Transparent Flexible Charge-Generating Nanodevices with Piezoelectric ZnO Nanorods. Adv. Mater. 2009, 21, 2185. [Google Scholar] [CrossRef]
  22. Ali, B.; Ashraf, M.W.; Tayyaba, S. Simulation, Fuzzy Analysis and Development of ZnO Nanostructure-based Piezoelectric MEMS Energy Harvester. Energies 2019, 12, 807. [Google Scholar] [CrossRef] [Green Version]
  23. Prashanthi, K.; Zhang, H.; Rao, V.R.; Thundat, T. Local piezoelectric response of ZnO nanoparticles embedded in a photosensitive polymer. Phys. Status Solidi RRL 2012, 6, 77–79. [Google Scholar] [CrossRef]
  24. Kandpal, M.; Sharan, C.; Poddar, P.; Prashanthi, K.; Apte, P.R.; Rao, V.R. Photopatternable nano-composite (SU-8/ZnO) thin films for piezoelectric applications. Appl. Phys. Lett. 2012, 101, 104102–104105. [Google Scholar] [CrossRef]
  25. Andrzejewska, E. Photopolymerization kinetics of multifunctional monomers. Prog. Polym. Sci. 2001, 26, 605–665. [Google Scholar] [CrossRef]
  26. Decker, C. Photoinitiated crosslinking polymerization. Prog. Polym. Sci. 1996, 21, 593–650. [Google Scholar] [CrossRef]
  27. Shukla, V.; Bajpai, M.; Singh, D.K.; Singh, M.; Shukla, R. Review of basic chemistry of UV-curing technology. Pigment. Resin Technol. 2004, 33, 272–279. [Google Scholar] [CrossRef]
  28. Malucelli, G.; Fioravanti, A.; Francioso, L.; De Pascali, C.; Signore, M.A.; Carotta, M.C.; Bonanno, A.; Duraccio, D. Preparation and characterization of UV-cured composite films containing ZnO nanostructures: Effect of filler geometric features on piezoelectric response. Prog. Org. Coat. 2017, 109, 45–54. [Google Scholar] [CrossRef]
  29. Rietveld, H.M. Line profiles of neutron powder-diffraction peaks for structure refinement. Acta Crystallogr. 1967, 22, 151–152. [Google Scholar] [CrossRef]
  30. Holzwart, U.; Gibson, N. The Scherrer equation versus the ‘Debye-Scherrer equation. Nat. Nanotechnol. 2011, 6, 534. [Google Scholar] [CrossRef] [PubMed]
  31. Jafarzadeh, S.; Johansson, M.; Sundell, P.E.; Claudino, M.; Pan, J.; Claesson, P.M. UV-curable acrylate-based nanocomposites: Effect of polyaniline additives on the curing performance. Polym. Adv. Technol. 2013, 24, 668–678. [Google Scholar] [CrossRef]
  32. Socrates, G. Infrared and Raman Characteristic Group Frequencies: Tables and Charts, 3rd ed.; Wiley: New York, NY, USA, 2004. [Google Scholar]
  33. Dorigato, A.; Pegoretti, A.; Dzenis, Y. Filler aggregation as a reinforcement mechanism in polymer nanocomposites. Mech. Mater. 2013, 61, 79–90. [Google Scholar] [CrossRef]
  34. Zabihia, O.; Mostafavi, S.M.; Ravari, F.; Khodabandeh, A.; Hooshafza, A.; Zare, K.; Shahizadeh, M. The effect of zinc oxide nanoparticles on thermo-physical properties of diglycidyl ether of bisphenol A/2,2′-diamino-1,1′-binaphthalene nanocomposites. Thermochim. Acta 2011, 521, 49–58. [Google Scholar] [CrossRef]
  35. Nielsen, L.E.; Landel, R.F. Mechanical Properties of Polymers and Composites; Marcel Dekker: New York, NY, USA, 1994. [Google Scholar]
  36. Jimenez, G.; Ogata, N.; Hawai, H.; Ogihara, T. Structure and thermal/mechanical properties of poly (ϵ-caprolactone)-clay blend. J. Appl. Polym. Sci. 1997, 64, 2211–2220. [Google Scholar] [CrossRef]
  37. Rahman, M.A.; Lee, B.-C.; Phan, D.-T.; Chung, G.-S. Fabrication and characterization of highly efficient flexible energy harvesters using PVDF–graphene nanocomposites. Smart Mater. Struct. 2013, 22, 085017. [Google Scholar] [CrossRef]
  38. Wang, X. Piezoelectric nanogenerators-harvesting ambient mechanical energy at the nanometer scale. Nano Energy 2012, 1, 13–24. [Google Scholar] [CrossRef]
  39. Slimani Tlemcani, T.; Justeau, C.; Nadaud, K.; Alquier, D.; Poulin-Vittrant, G. Fabrication of Piezoelectric ZnO Nanowires Energy Harvester on Flexible Substrate Coated with Various Seed Layer Structures. Nanomaterials 2021, 11, 1433. [Google Scholar] [CrossRef] [PubMed]
  40. Lee, M.; Bae, J.; Lee, J.; Lee, C.-S.; Hong, S.; Wang, Z.L. Self-powered environmental sensor system driven by nanogenerators. Energy Environ. Sci. 2011, 4, 3359–3363. [Google Scholar] [CrossRef]
  41. Zhang, G.; Zhao, P.; Zhang, X.; Han, K.; Zhao, T.; Zhang, Y.; Jeong, C.K.; Jiang, S.; Zhang, S.; Wang, Q. Flexible three-dimensional interconnected piezoelectric ceramic foam based composites for highly efficient concurrent mechanical and thermal energy harvesting. Energy Environ. Sci. 2018, 11, 2046–2056. [Google Scholar] [CrossRef]
  42. Fan, F.R.; Tang, W.; Wang, Z.L. Flexible Nanogenerators for Energy Harvesting and Self-Powered Electronics. Adv. Mater. 2016, 28, 4283–4305. [Google Scholar] [CrossRef]
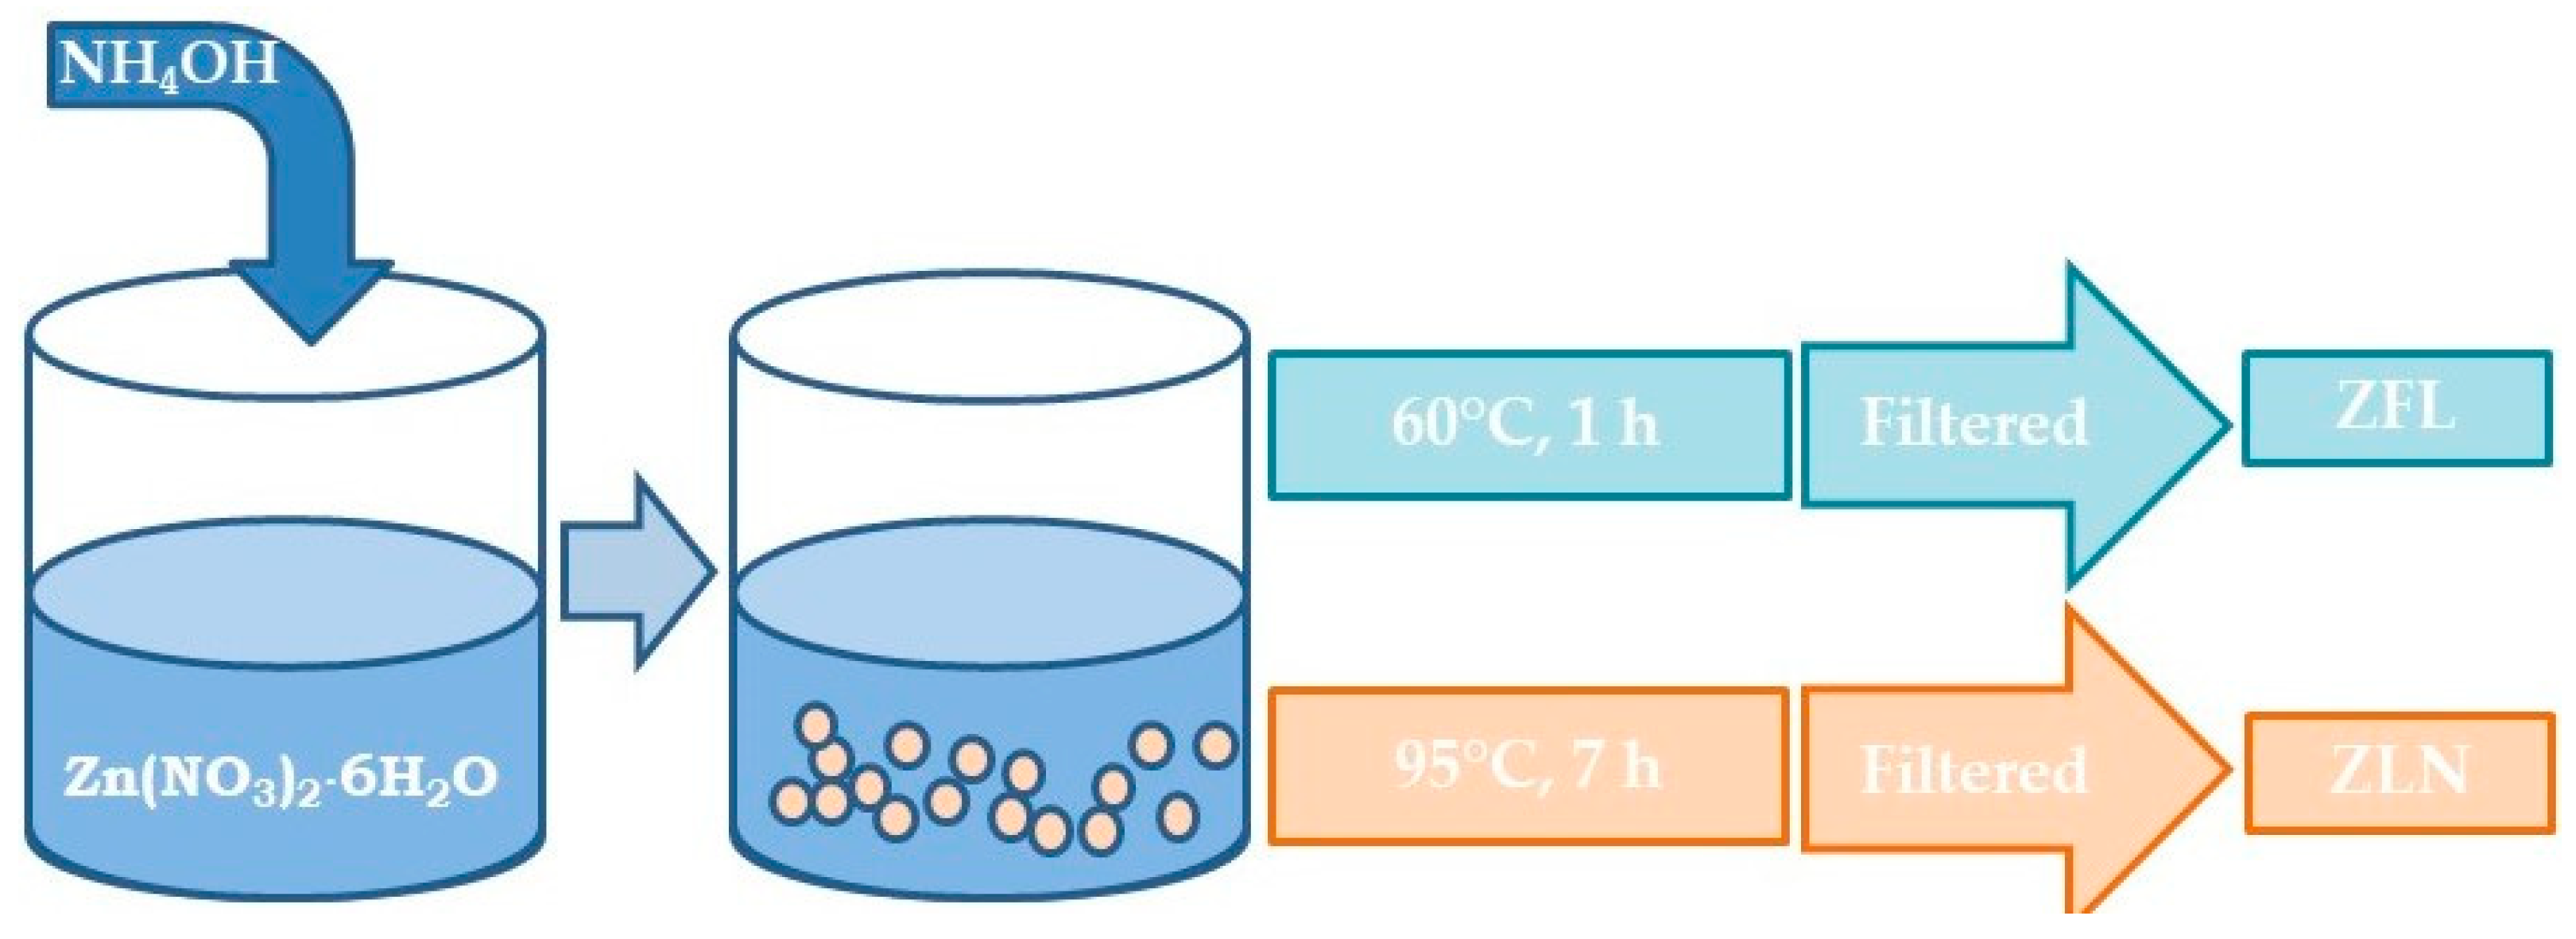
Figure 1. Schematic representation of nanostructured ZnO synthesis. ZFL = ZnO flower-like and ZLN = ZnO needle-like morphologies.
Polymers 15 01159 g001
Figure 2. (Left, up) SEM micrograph of a typical laser-cut EB/ZFL film sample. (Left, down) Sample of EB/ZFL after the silver painting with a brush. The rectangular part on the left is clamped into the sample holder. (Right) View of the system used to clamp the sample under test (1,2) and the two sensors (3,4).
Polymers 15 01159 g002
Figure 3. Experimental system for measuring the piezoelectric behavior of EB composite films.
Polymers 15 01159 g003
Figure 4. (1) Function generator; (2) audio frequency amplifier; (3) shaker; (4) detector head and sample holder; (5) accelerometer amplifier; (6) low-noise amplifier; (7) lock-in amplifier; (8) oscilloscope. The three signals acquired and processed are: S1—accelerometer signal from the oscillating head; S2—piezoelectric signal generated by the cantilever (DUT); S3—sinusoidal shaker excitation signal with adjustable amplitude and frequency.
Polymers 15 01159 g004
Figure 5. SEM micrographs of ZnO morphologies: (A,B) long needles (ZLN) and (C,D) nanoflowers (ZFL).
Polymers 15 01159 g005
Figure 6. WAXD patterns of needle-like (ZLN) and flower-like nanoparticles (ZFL).
Polymers 15 01159 g006
Figure 7. FTIR-ATR spectra of EB-ZnO composites, before (A) and after (B) exposure to UV radiation. The absence of the band at about 1635 cm−1 after exposure to UV radiation is a clear indication of the completeness of the UV curing process.
Polymers 15 01159 g007aPolymers 15 01159 g007b
Figure 8. DSC thermograms (1st and 2nd runs) of ZnO composite films (heating rate: 10 °C/min). The arrow indicates the direction of the exothermic flux.
Polymers 15 01159 g008
Figure 9. Typical SEM micrographs of fracture surfaces of EB/ZFL 96/4 (A), EB/ZFL 90/10 (B), EB/ZFL 80/20 (C), EB/ZLN 96/4 (D), EB/ZLN 90/10 (E), and EB/ZLN 80/20 (F).
Polymers 15 01159 g009
Figure 10. SEM micrographs obtained using backscattered electrons of EB/ZFL and EB/ZLN 96/4, 90/10, and 80/20 surfaces.
Polymers 15 01159 g010
Figure 11. The typical WAXD patterns of ZnO composites in the range between 30 and 37° highlight the preferential orientation of crystallographic planes of ZFL and ZLN particles in the composite films. Spectra were normalized with respect to the (110) crystallographic peak. Spectra of EB/ZLN (A) and EB/ZFL (B) composites at different filler loadings. Comparison of EB/ZLN and EB/ZFL 90/10 spectra (C).
Polymers 15 01159 g011
Figure 12. Storage modulus of EB/ZFL (A) and EB/ZLN (B) composite films containing different amounts of ZnO. Tanδ of EB/ZFL (C) and EB/ZLN (D) composite films containing different amounts of ZnO.
Polymers 15 01159 g012
Figure 13. RMS output voltage values produced by composites containing 4 wt.% of ZnO (flower-like (ZFL) and needle (ZLN) structures) at the frequency of 19 Hz and different acceleration values (namely, 2, 3, 4, and 5 g).
Polymers 15 01159 g013
Figure 14. RMS output voltage of EB-ZFL samples with different ZFL amounts at the frequency of 19 Hz vs. the acceleration value.
Polymers 15 01159 g014
Table 1. Tg and storage modulus at 30 °C of EB and its composites.
TgE’ @ 30 °C
EB70 ± 22537 ± 52
EB/ZFL 96/473 ± 12637 ± 62
EB/ZFL 90/1078 ± 32111 ± 87
EB/ZFL 80/2081 ± 31791 ± 110
EB/ZLN 96/475 ± 22089 ± 49
EB/ZLN 90/1080 ± 21984 ± 64
EB/ZLN 80/2086 ± 11439 ± 74
Disclaimer/Publisher’s Note: The statements, opinions and data contained in all publications are solely those of the individual author(s) and contributor(s) and not of MDPI and/or the editor(s). MDPI and/or the editor(s) disclaim responsibility for any injury to people or property resulting from any ideas, methods, instructions or products referred to in the content.