Article

Effects of Vinyl Functionalized Silica Particles on Thermal and Mechanical Properties of Liquid Silicone Rubber Nanocomposites

1
China North Industry Advanced Technology Generalization Institute, Beijing 100089, China
2
Ordnance Science and Research Academy of China, Beijing 100089, China
3
National Special Superfine Powder Engineering Research Center of China, Nanjing University of Science and Technology, Nanjing 210014, China
4
College of Materials Science and Engineering, Nanjing Tech University, Nanjing 211816, China
*
Authors to whom correspondence should be addressed.
Polymers 2023, 15(5), 1224; https://doi.org/10.3390/polym15051224
Submission received: 5 February 2023 / Revised: 26 February 2023 / Accepted: 27 February 2023 / Published: 28 February 2023

Abstract

:
It is very important to develop a new method of preparing high-performance liquid silicone rubber-reinforcing filler. Herein, the hydrophilic surface of silica (SiO2) particles was modified by a vinyl silazane coupling agent to prepare a new type of hydrophobic reinforcing filler. The structures and properties of modified SiO2 particles were confirmed using Fourier-transform infrared spectroscopy (FT-IR), X-ray photoelectron spectrometer (XPS), specific surface area and particle size distribution and thermogravimetric analysis (TGA), the results of which demonstrated that the aggregation of hydrophobic particles is greatly reduced. Additionally, the effects of the vinyl-modified SiO2 particle (f-SiO2) content on the dispersibility, rheology, and thermal and mechanical properties of liquid silicone rubber (SR) composites were studied for application toward high-performance SR matrix. The results showed that the f-SiO2/SR composites possessed low viscosity and higher thermal stability, conductivity, and mechanical strength than of SiO2/SR composites. We believe that this study will provide ideas for the preparation of high-performance liquid silicone rubber with low viscosity.

1. Introduction

Liquid silicone rubber (SR) is a type of organic–inorganic hybrid material and possess many advantages that cannot be replaced by other materials [1]. Compared to ordinary organic rubbers, it has better thermal stability, chemical stability, electrical insulation, and lower surface tension [2]. Based on these unique performances, silicone rubber is widely used in the aerospace, military, construction, electrical, medical, and other industries [3,4]. However, the research on its thermal and mechanical enhancement has never stopped [5,6,7]. The addition of inorganic fillers and chemical modification of the polysiloxane matrix are two effective methods of enhancing the properties of polymers [7,8,9].
Inorganic fillers, including silica particles (SiO2), are commonly found to be a simple and effective way to improve thermal stability and mechanical properties, such as tensile and compressive strengths [10,11,12,13]. However, the surface of SiO2 is usually rich in hydroxyl groups (Si-OH), which tend to adsorb moisture from the air and cause agglomeration, further leading to the degradation of SR composite properties [14,15]. Currently, surface modification has been validated as an effective method of solving agglomeration problems and improving the affinity between silica particles and the matrix [16,17]. At present, the surface modification methods of SiO2 can be divided into two categories: ex situ and in situ modification. For the in situ modification method, typically, Rangsunvigit et al. prepared the modified SiO2 through ionic interaction between the SiO2 particles with two surfactants. It was effectively demonstrated that the improved affinity between rubber and modified silica enhanced the mechanical properties of rubber [18]. An et al. prepared modified hydrophobic SiO2 through a hydrogen bonding interaction between hydroxyl groups on the surfaces of SiO2 particles and hydroxyl groups of alcohols [19]. For the ex situ modification method, typically, the most commonly used modifier is hexamethyldisilazane (HMDS), which contributes to the formation of effective chemical bonding between the Si-OH groups on the surface of SiO2 particles and the hydrolyzable silicon–nitrogen bond of HMDS [20,21]. All of the above modification methods can increase the dispersion of SiO2 particles in SR matrix, thus contributing to the improvement the performance of SR in different degrees. However, the interface force between SR and the SiO2 particles obtained by these methods is only the weak van der Waals force, not the strong chemical bond force. Recently, Park et al. reported a new modification method of SiO2 particles [22]. The modified SiO2 particles were prepared by introducing vinyl groups to the surface of SiO2 particles with vinyl-containing silane coupling agent, which can improve the performance of SR via in situ polymerization with SR molecular chains. However, the effect of modifier on BET specific surface area, particle size distribution, and the rheology of the uncured composites before and after particle modification has not been systematically described, which is very important for applications. Additionally, the results show that a large amount of nanosilica (30 wt.%) is needed to obtain high-tensile-strength (6.15 MPa) silicone rubber, but the high content of added nanofillers may imply the poor fluidity of the blend.
On the basis of previous studies, the effects of SiO2 particles modified by tetramethyldivinyldisilazane (TMDVS) on the BET specific surface area, morphology, particle size distribution, and SR enhancement of SiO2 particles were systematically studied. This study revealed the relationship between modification methods, particle characteristics, and properties of composites, which is of great significance to the study of reinforcement mechanism of fillers. We also believe that this work will provide a new perspective for the design and preparation of high-performance polymer composites.

2. Experimental

2.1. Materials

The polydimethyl-vinyl siloxane (PDVS; vinyl content = 0.14%; 10,000 mPa·s) was purchased from Zhonglan Chengguang Co., Hangzhou, China. Vinyl MQ resin (VMQ, vinyl content = 1.28%; 6500 mPa·s) was provided by Zhejiang Runhe Co., Hangzhou, China. The crosslinking agent (polymethylhydrosiloxane (PHDS); hydrogen content = 0.5%; 80 mPa·s) was purchased from Shandong Dayi Co., Yantai, China. Silicone rubber (SR) was prepared by mixing PDVS and VMQ in proportion (Si-H/CH=CH2 = 1.5). The Karstedt’s catalyst (3000 ppm) was purchased from Zhonglan Chengguang Co., Ltd. The tetramethyldivinyldisilazane (TMDVS, China, purity 99.8%) was purchased from Maclean. The silica (SiO2) was purchased from Cabot (the specific surface = 250 cm2/g, ⍴ = 30 g/L). The ethanol (99.9%) was purchased from Beijing Chemical Works, Beijing, China and the deionized water was manufactured in our lab.

2.2. Surface Modification of Silica Particles

In order to modify the hydrophilic surface of silica particles (SiO2) and obtain hydrophobic properties, the TMDVS was used to treat the surface. Firstly, the TMDVS was hydrolyzed under acidic conditions. Amounts of 2 g TMDVS, 50 g, ethanol and 2 g ammonia solution were added into a three beaker, and the mixture was kept stirring for 2 h at 25 °C to completely hydrolyze the TMDVS. Then, 5 g SiO2 was added into the hydrolysate obtained from the first step, and the mixture was dispersed by ultrasound for 2 h at 80 °C. The ultrasonic energy can efficiently remove microbubbles on the surface of the SiO2, which facilitated the complete reaction between hydrolysate and SiO2 [22]. Finally, after the coupling reaction was completed, the modified SiO2 was washed three times with ethanol and then freeze dried to remove the solvent, and the modified silica was labeled as f-SiO2. The modification process of SiO2 by TMDVS is shown in Figure 1a.

2.3. Preparation of SR Nanocomposites

The f-SiO2 particles were dispersed in liquid PDVS and VMQ using a kneading machine to prepare SR nanocomposites. The mixing ratios of the f-SiO2 in the SR composites were 2, 4, 6, 8, and 10 wt.%, respectively. After dispersion of the f-SiO2 for 6 h, the curing agent PHDS, reaction inhibitor and Karstedt’s catalyst were sequentially mixed. After mixing evenly, the mixture was placed in a vacuum box for defoaming. Finally, the SR/f-SiO2 compound was poured into a PTFE mold and cured at 80 °C for 2 h and further cured at 120 °C for 3 h. The typical cured mechanism of in situ polymerization between f-SiO2 and SR matrix is shown in Figure 1b. The SR nanocomposites prepared for nonfunctionalized silica were fabricated in the same way as the SR/f-SiO2 nanocomposites.

2.4. Characterization

The Fourier-transform infrared spectroscopy (FT-IR) of the modified SiO2 particles was determined using a VERTEX 70 spectrometer (Bruker, Ettlingen, Germany) in range of 400–4000 cm−1. The surface elemental chemical state of SiO2 particles was analyzed using an X-ray photoelectron spectrometer (XPS, EscaLab 250Xi, Thermo Fisher Scientific, Waltham, MA, USA) with a monochromatic Al Kα X-ray source, and the acquired data were quantified and analyzed using the XPSPEAK 4.1 program. The surface morphology of SiO2 particles was observed using a cold-field emission scanning electron microscope (FE-SEM, S4800, Hitachi, Japan) with an acceleration voltage of 15 kV after being sputtered with a thin layer of gold. The BET surface areas are determined by N2 physisorption at liquid N2 temperature on a Miraesi KICT-SPA 3000 instrument. The particles’ size distribution was tested using a Mastersizer 2000 Laser Particle Sizer (Malvern, Malvern, UK) in ethanol dispersion phase. TG analysis of the particles and composites was performed with a heating range from 30 to 1000 °C at the heating rate of 10 K/min under argon atmosphere. The grafting ratio of the modified product was calculated by the following Equation (1).
G f = [ ( W 1 W 0 ) / W 0 ] × 100 %
In the formula, G f is the grafting rate of the modified product ( % ), W 1 is the mass of the product after grafting (g), and W 0 is the initial mass before modification (g).
The rheological characteristic of liquid VP-PBSi/SR (system without crosslinking agent) was conducted on a rheometer (MCR92, Anton Paar) with a shear rate between 0.01 and 600 s−1. The dispersion state of the modified SiO2 particles in SR matrix was observed using a high-resolution transmission electron microscope (HR-TEM, Hitachi HF5000) with 100–120 nm thickness at an accelerating voltage of 200 kV. The thermal conductivities of composites were measured through transient plane sources method using a thermal analyzer (TPS 2500S, Hot Disk, Sweden) with a sensor diameter of 3 mm placed between two identical samples of Φ20 × 5 mm at room temperature. The tensile property of all samples was tested using an electronic universal drawing machine (AGS-X, Shimadzu) at tensile rate of 100 mm/min with a dumbbell-like specimen. The compressive property was tested according to GB/T 7757-2009, and the samples’ specification was Φ29 mm × 12.5 mm. The hardness was tested according to GB/T 531.1-2008. The crosslinking density of the composites was calculated using the following Equations (2) and (3) [23].
φ = ( w s w o ) / [ ( w s w o ) / ρ 1 + w o / ρ ]
y e = ρ / M C = [ ln ( 1 φ ) + φ + X 1 φ 2 ] / ( V o φ 1 / 3 )
In the formula, φ is the percentage of the volume of rubber before swelling to the volume after swelling (%), w s   is the weight after swelling (g), w o is the weight before swelling (g), ρ 1 is the density of CCl4 (1.6 g/cm3), ρ is the density of rubber before swelling (g/cm3), and y e is the crosslinking density. MC is the average molecular weight between crosslinking points. X 1 is the Flory–Huggins parameter, and the value is 0.45. V o is the molar volume of CCl4 (96.5 cm3/mol).

3. Results and Discussion

3.1. Surface Chemical Structure Analysis of f-SiO2

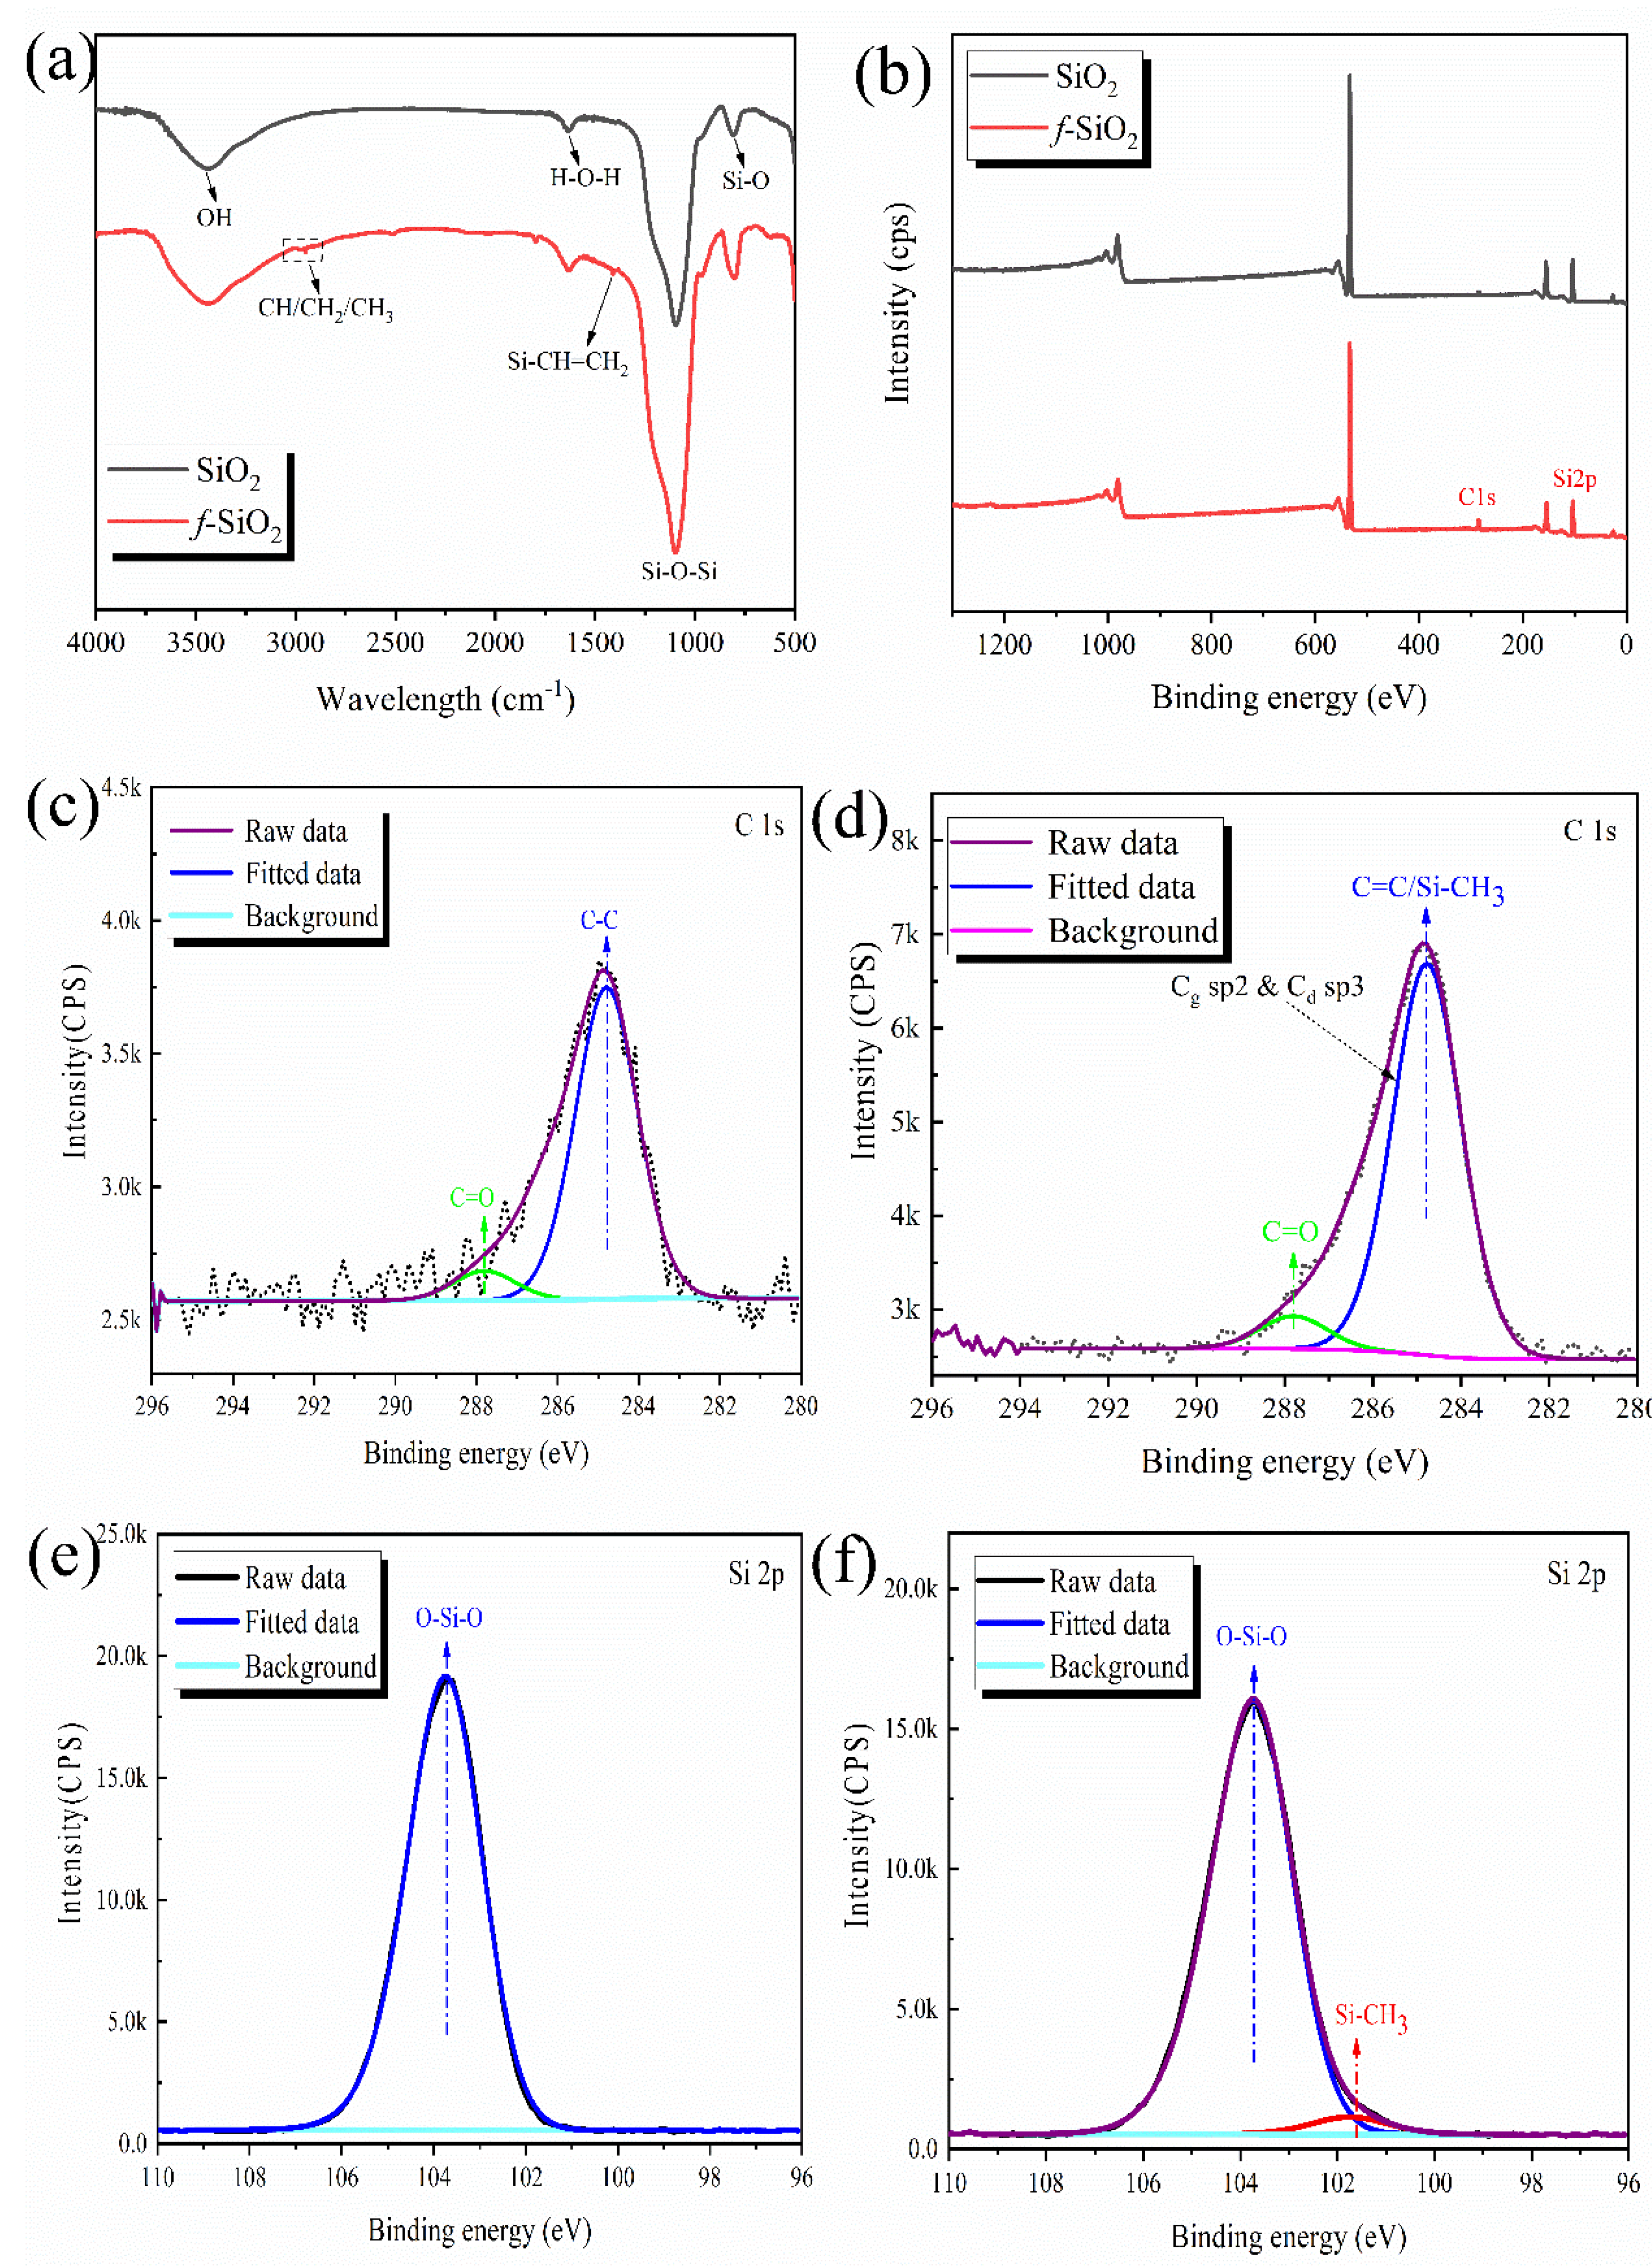
The FI-IR spectra are shown in Figure 2a. In the spectrum for the f-SiO2 particles, typically, a new peak caused by the Si-CH=CH2 bond appears at 1405 cm−1 [22]. The peaks appearing from 2950–2800 cm−1 are attributed to the stretching vibration of the C-H from the CH/CH2/CH3 group [24]. The absorption peak at 1630 cm−1 is the bending vibration of H-O-H, and the peaks at 3455 and 800 cm−1 are ascribed to the existence of Si-OH. The peaks at 1132 cm−1 are caused by the Si-O-Si bonds [25].
To further confirm the structure of the modified SiO2, XPS is used to analyze the chemical elements on the surface of the silica. The wide-scan survey spectra of SiO2 and f-SiO2 are presented in Figure 2b. Bonding energies of silicon and carbon are centered at around 102.6 and 281.4 eV, respectively. It should be noted that only the weak peak of carbon is detected on the surface of SiO2. After modifying by TMDVS, the distinct XPS peak of carbon appears, which is attributed to successful surface modification. Moreover, the high-resolution spectra of C1s and Si2p cores are fitted to provide a basis for further study of the chemical structure of the f-SiO2 surface. Figure 2c,d shows the C1s XPS spectra of SiO2 and f-SiO2, respectively. Significantly, from the comparison of C1s spectra of SiO2, the C1s spectra of f-SiO2 peak at 284.8 eV caused by Cg sp2 and Cd sp3 evidently increase [26,27]. For SiO2 composed of Si-O-Si units, it is impossible for the carbon element to appear. However, the peaks caused by the existence of carbon also appear in C1s spectra of SiO2, which is caused by the heterocarbon introduced by the test conditions. The heterocarbon in test environment leads to the existence of C-C and C=O, resulting the appearance of binding energy peaks at 284.8 and 287.8 eV, respectively. However, under the same test environment, the peak strength at 284.8 eV of f-SiO2 is obviously stronger than that of SiO2, which indicates that the f-SiO2 particles possess more carbon. Thus, it is not difficult to understand that the increased binding energy peak at 284.8 eV is caused by the existence of Si-CH=CH2 and Si-CH3 on the surface of f-SiO2. The Si2p XPS spectra of SiO2 and f-SiO2 are shown in Figure 2e,f, respectively. The most typical difference is that the Si2p XPS spectra of f-SiO2 has a peak at 101.5 eV caused by the Si-C bonds and that no peak appears for SiO2, which further confirms the successful surface modification.

3.2. Particle Size and BET Analysis of f-SiO2

The particle size and specific surface area of silica have great influence on the reinforcement effect for liquid silicone rubber [28]. In general, particles with a greater specific surface area have a higher specific surface energy, and a system with a high surface energy is unstable, as the particles have a tendency to agglomerate in order to lower the specific surface energy. Hence, particles with higher specific surface area are inferior in dispersibility. The particle size distribution can reflect the aggregation state of nanoparticles to a great extent, and the specific surface is one of the key parameters of mechanical reinforcement for rubber materials. Therefore, it is necessary to study these two parameters of f-SiO2.
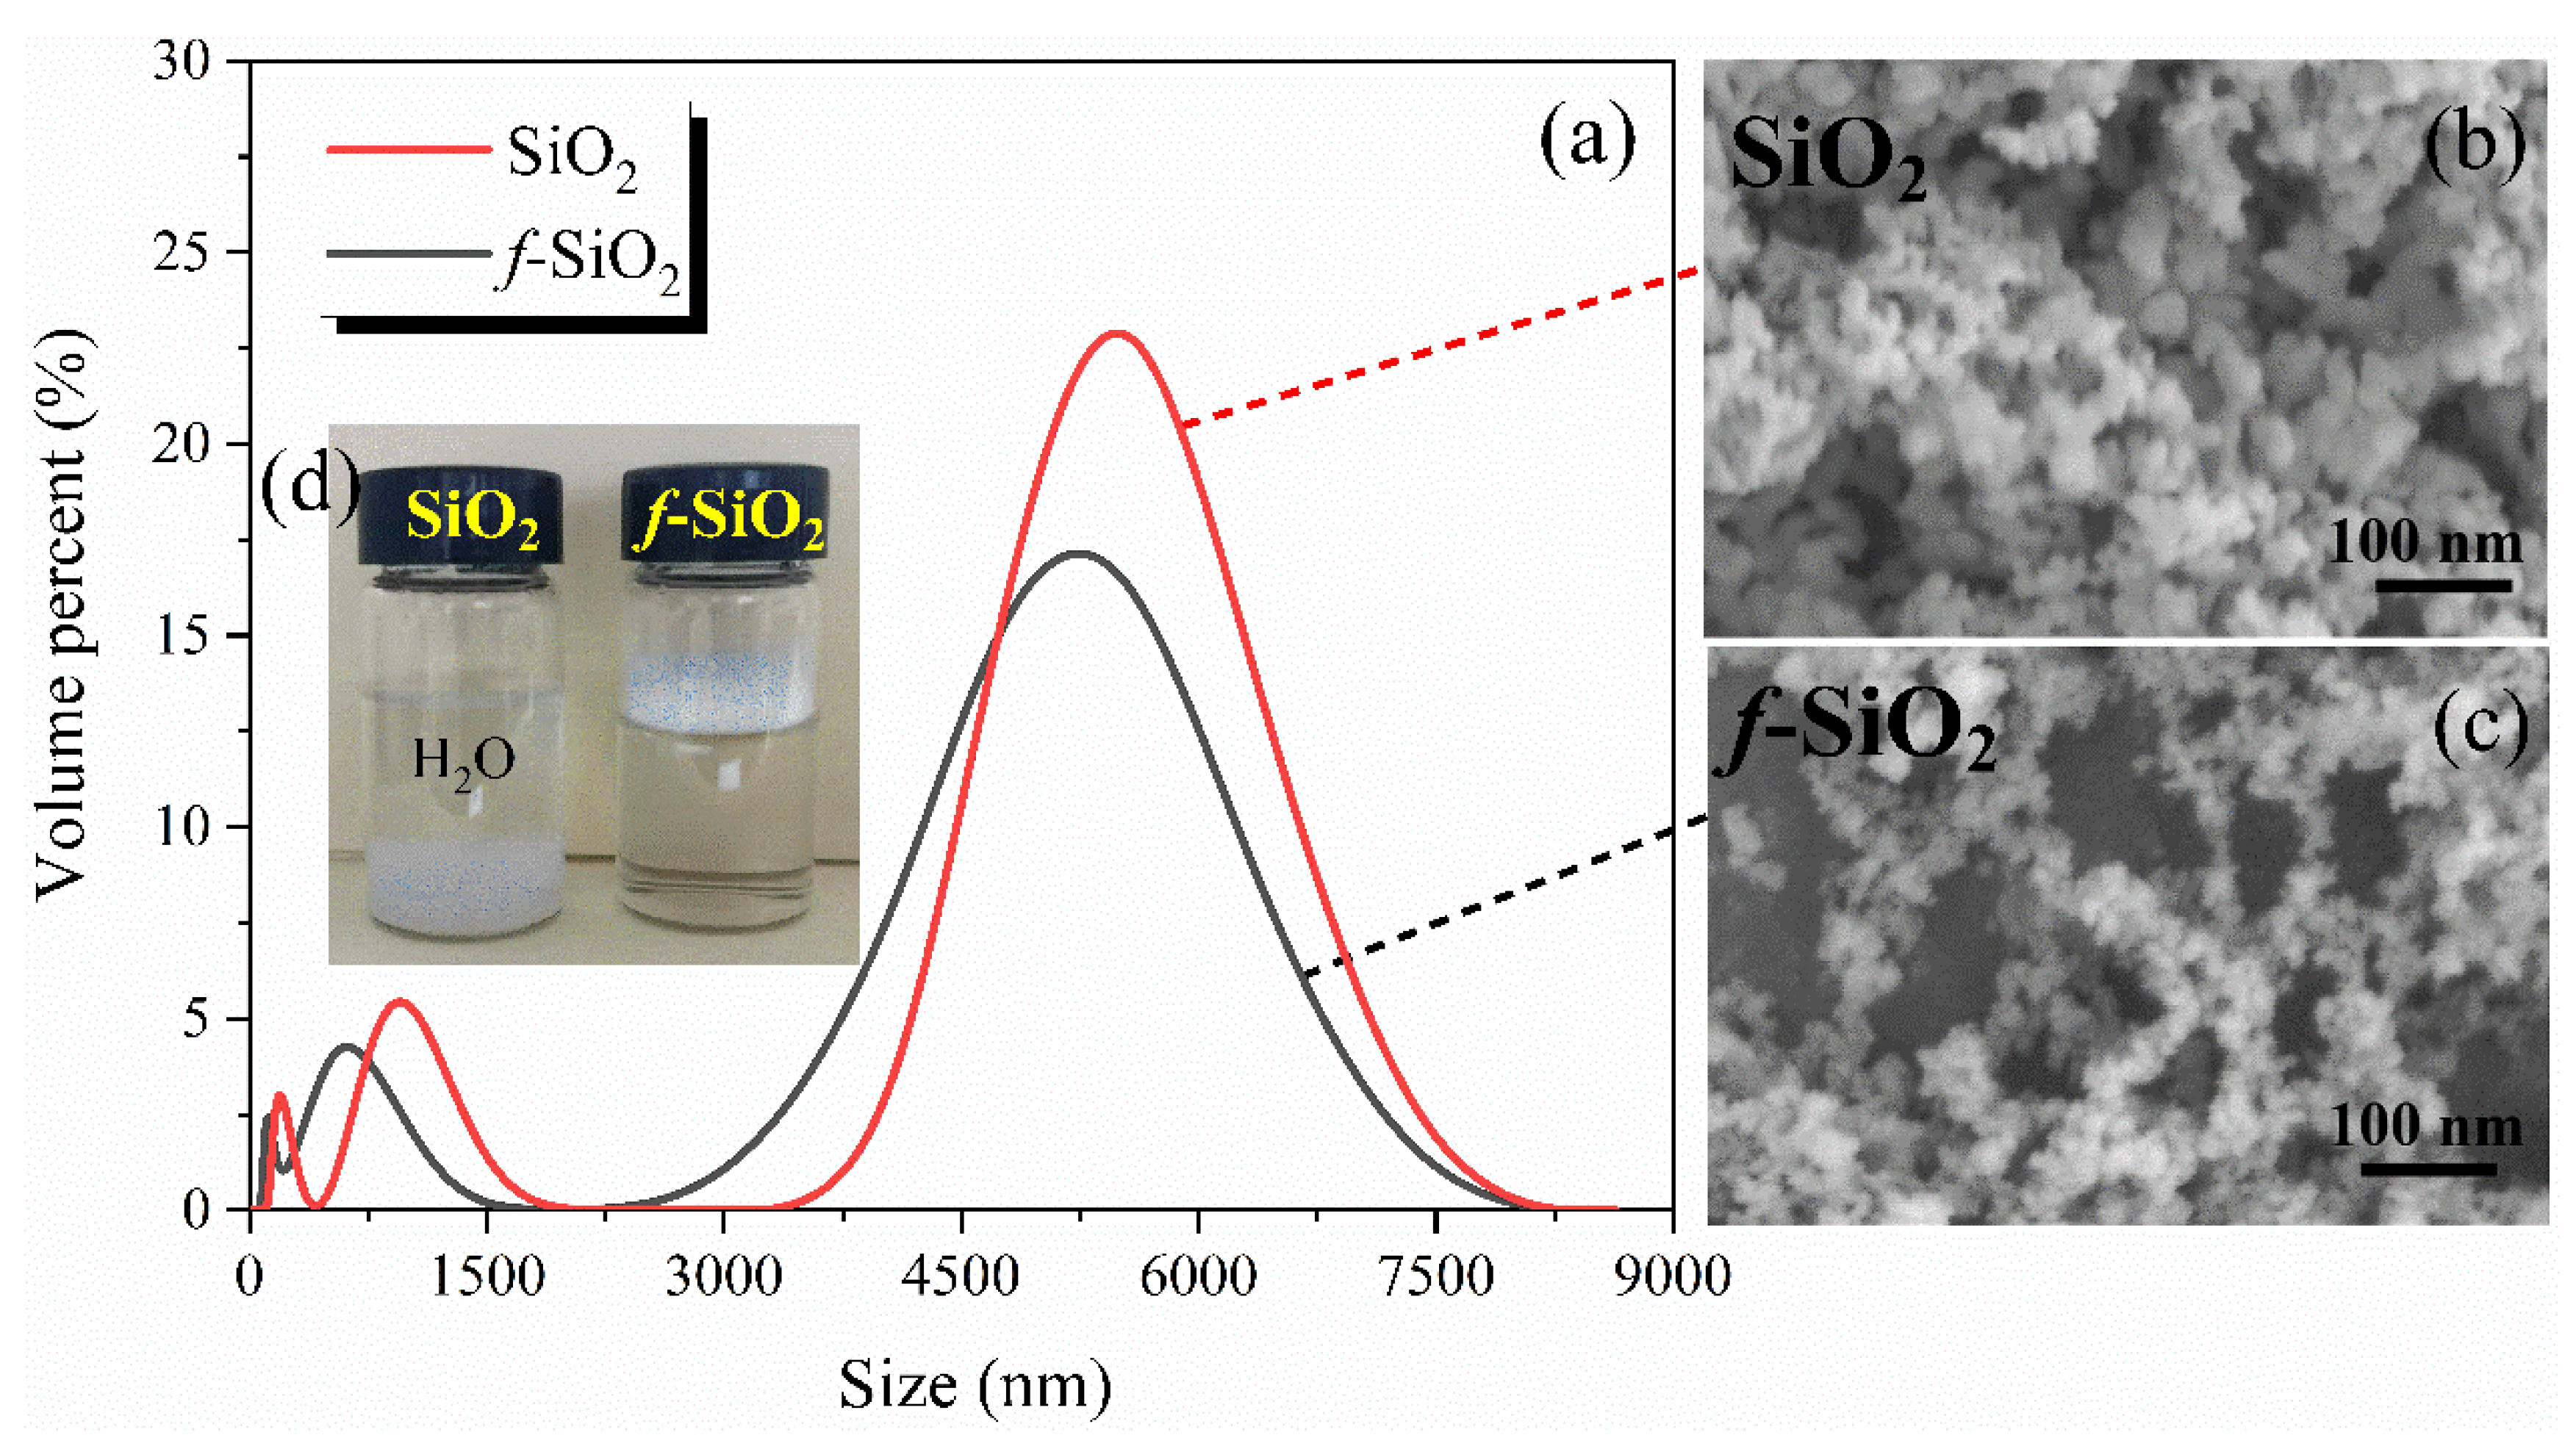
The particle size distributions of f-SiO2 are measured using the dynamic light scattering method, and the results are shown in Figure 3a. It is clearly observed that both the SiO2 and f-SiO2 particle size showed multiscale dispersion and that the maximum particle size reaches the micron scale. The particle sizes for SiO2 at maximum peaks are about 5872, 856, and 268 nm, respectively. After modifying, the particle sizes at maximum peak shifted to 5231, 624, and 67 nm, respectively. The SEM images also intuitively proved that the agglomeration degree of the SiO2 particles decreased after the modification process, as depicted in Figure 3c,d. The reduction in the degree of agglomeration for SiO2 is likely attributed to the improvement of hydrophobicity. It is well known that the large amount of hydroxyl exists on the surface of SiO2 and that hydrogen bonding between hydroxyl groups occurs easily, resulting the occurrence of agglomeration. After modification with TMDVS, the hydrophobicity of SiO2 is greatly improved, which weakens the hydrogen bonding force between SiO2 particles and reduces the agglomeration degree. The hydrophobicity of SiO2 before and after modification is shown in Figure 3d.
The effects of the amount of TMDVS on the BET surface area of f-SiO2 particles are shown in Table 1. It can be seen that the mass fraction of TMDVS relative to SiO2 has an obvious effect on BET surface area. The BET specific surface area of unmodified SiO2 particles is the highest, 258.65 m2/g, while the specific surface areas of modified SiO2 particles decrease to a certain extent with the increase in TMDVS content. Among them, the TMDVS with a mass fraction of 20 wt.% relative to SiO2 was remarkably efficient, and the BET surface area of f-SiO2 particles was decreased by 25.47% relative to SiO2. This is closely related to the change in physicochemical state of the surface and micropores of SiO2. [14,29,30] When the SiO2 particles are modified by TMDVS, both the inner surfaces of the particles and the micropores are occupied by TMDVS, resulting in a decrease in the BET surface area of SiO2 particles. However, it can be seen that after the amount of TMDVS reaches 40%, the value of BET surface area has a little increase with the increasing amount of TMDVS, which is closely related to the dispersion state of the modified SiO2 particles. The reason can be explained as follows: The increasing TMDVS content improves the dispersion level of SiO2 particles, which can be verified via the SEM micrographs in Figure 3b,c. The improvement of dispersion level means that there are more micropores in SiO2 particles, thus contributing to a slight increase in the BET surface area of SiO2 particles.

3.3. TG-DSC Analysis of f-SiO2

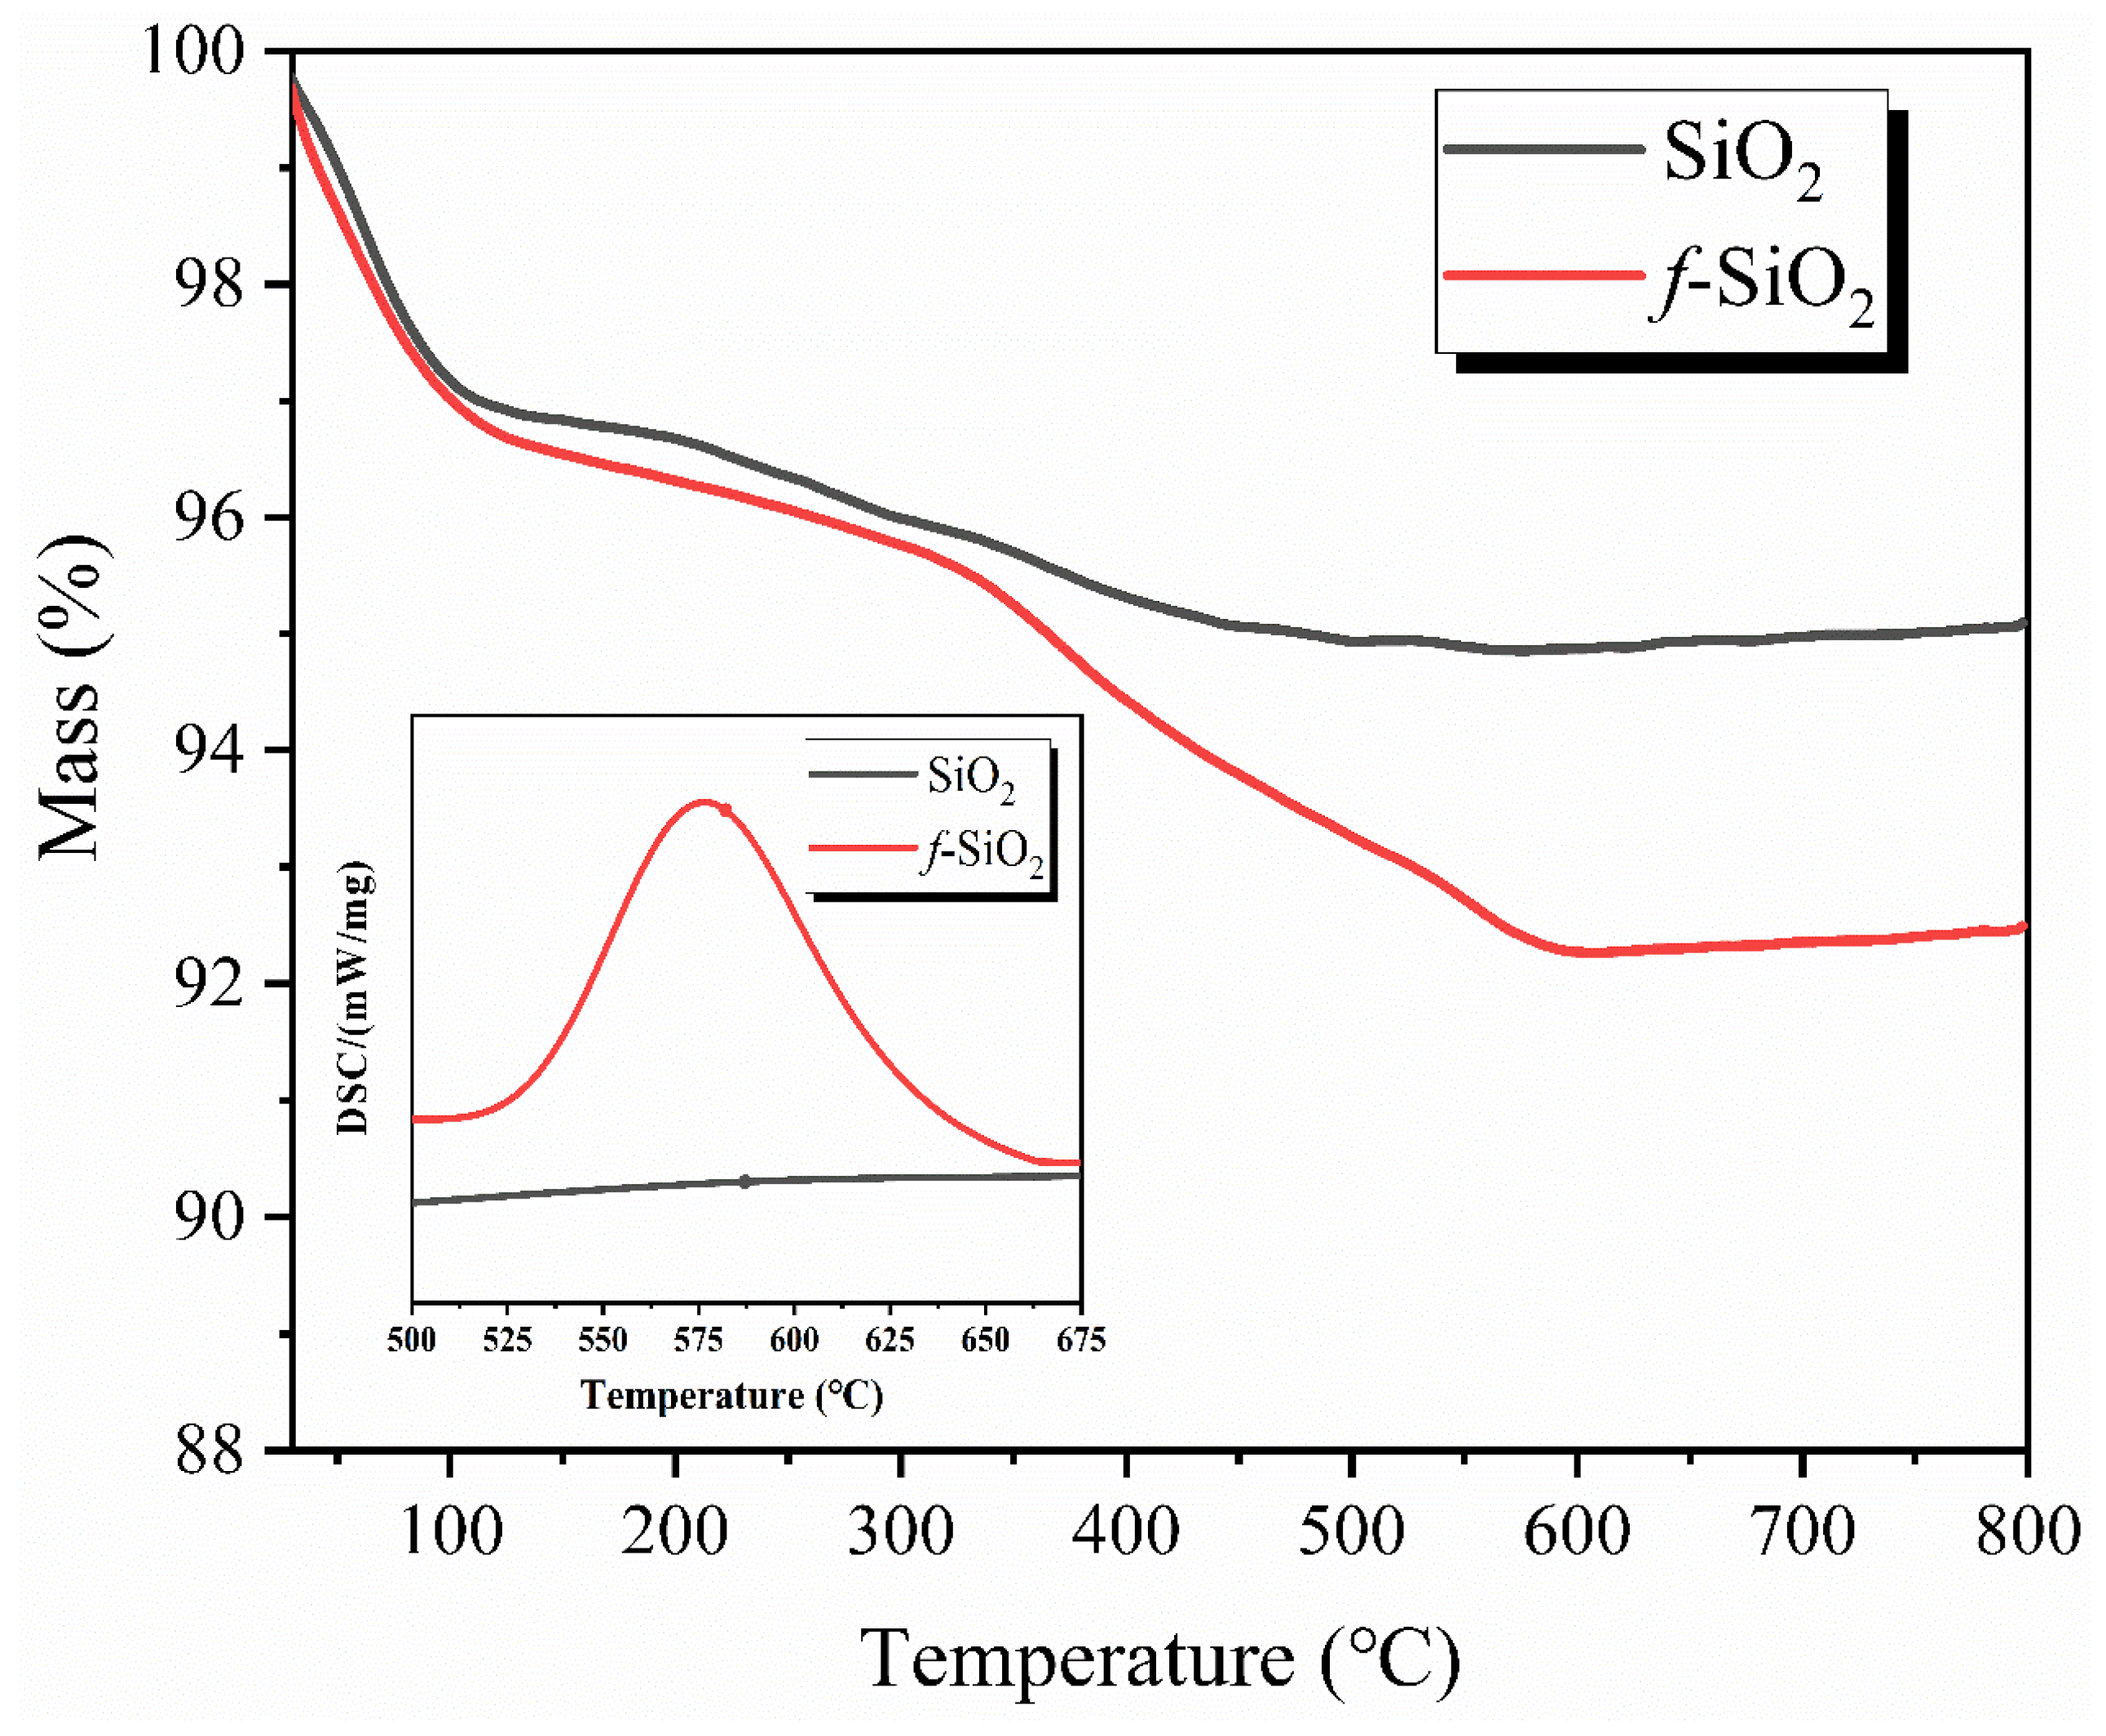
Figure 4 shows the TG–DSC curves of SiO2 and f-SiO2, respectively. From the TG curves, it can be seen that both the SiO2 and f-SiO2 exhibit typical two-stage thermal decomposition. The first-stage weight losses (<150 °C) for SiO2 and f-SiO2 are about 2.68 wt.% and 2.91 wt.%, respectively. Though the samples are dried at 100 ◦C for 24 h to remove the redundant water on the surface, the obvious weight loss in samples can be observed in the curves. This phenomenon is attributed to the removal of the bound water absorbed on the surface of SiO2 and f-SiO2. The second-stage weight losses (200–700 °C) for SiO2 and f-SiO2 are about 1.47 wt.% and 4.31 wt.%, respectively. For SiO2, the weight loss is mainly derived from the dehydration condensation of Si-OH in SiO2 particles [14]. However, the weight loss of f-SiO2 is higher than that of SiO2 in the curves. This indicates not only a dehydration reaction of Si-OH between SiO2 particles but also a thermal decomposition reaction caused by organic components occurring on the surface of SiO2 particles after modification, which can also be confirmed by the DSC result. From the DSC curves, it can be seen that the f-SiO2 shows an obvious exothermic peak around 575 °C, while the SiO2 shows no exothermic peak in the same temperature range. Moreover, the grafting ratio of the f-SiO2 was calculated from Equation (1) as 2.84%.

3.4. Rheological Properties

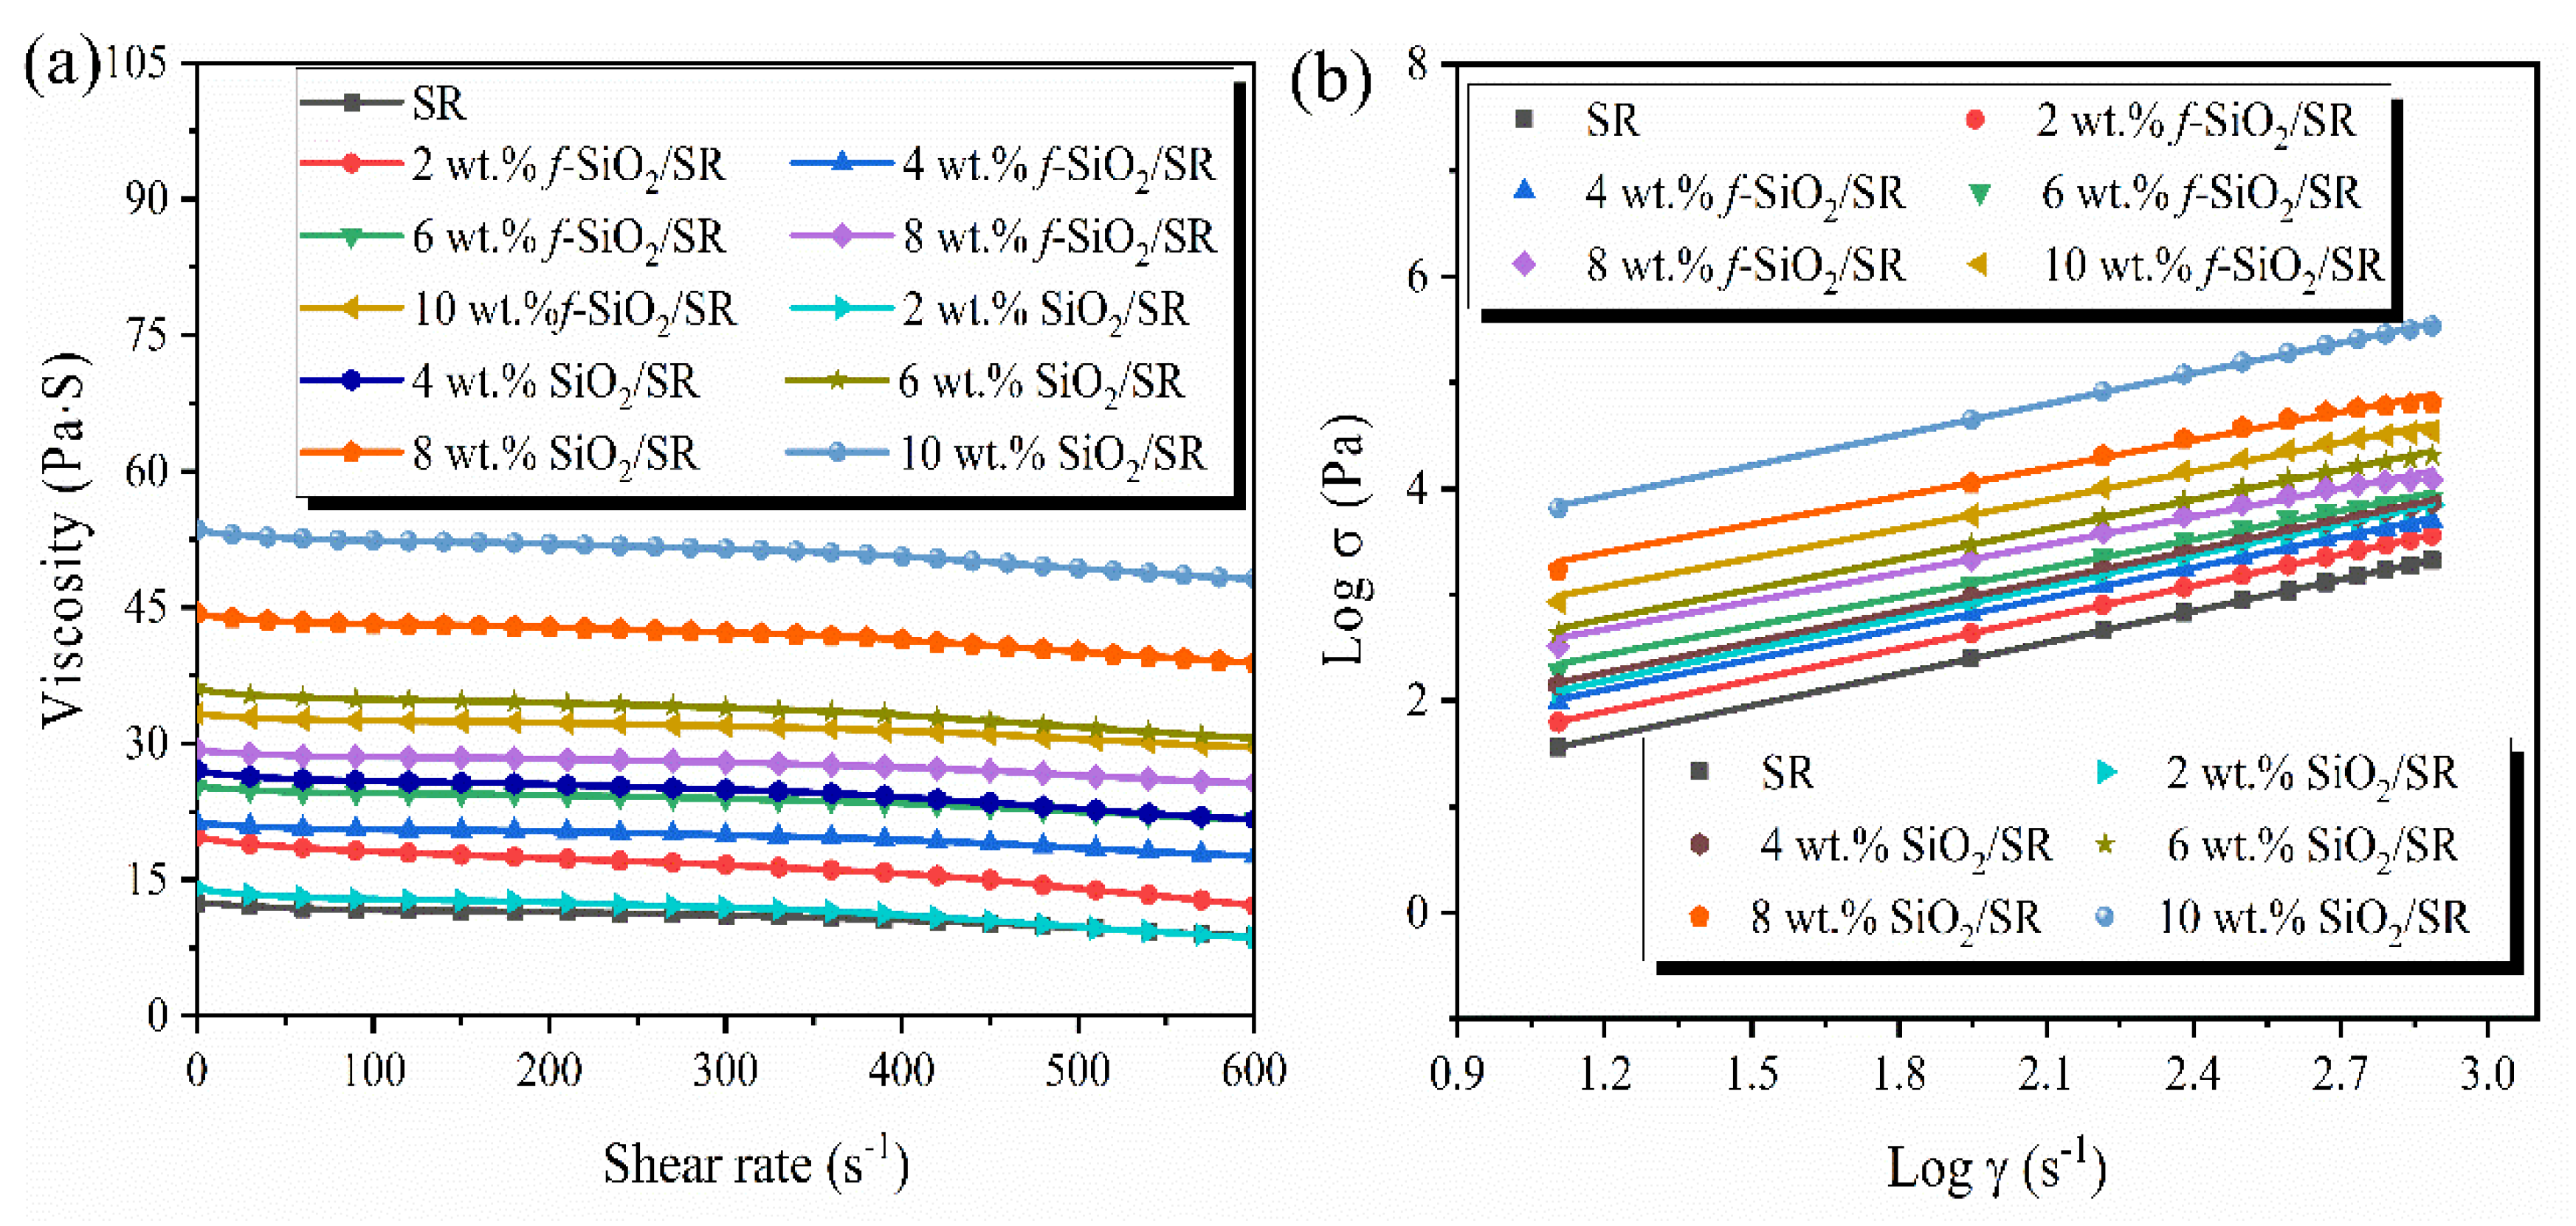
The effects of f-SiO2 and SiO2 additions on the rheological properties of SR are shown in Figure 5. As depicted in Figure 5a, all of the uncured composites exhibit the typical shear-thinning behavior of non-Newtonian fluids. At lower shear rates, the pseudo-cross-linking phenomenon caused by the van der Waals force between SiO2 particles and SR molecular chains makes the composites present a higher viscosity. With the increase in shear rate, the pseudo-crosslinking structure is gradually destroyed and the SR molecular chains relax, which causes the viscosity of the composites to decrease. Additionally, the difference in viscosity between the uncured f-SiO2/SR (uf-SiO2) and SiO2/SR composites (uSiO2) enlarges with an increase in filler content. In the whole shear rate range, the viscosity of uf-SiO2 is always lower than that of uSiO2, which is attributed to the better compatibility between f-SiO2 particles and SR compared to SiO2. Typically, When the f-SiO2 content reaches 10 wt.%, the viscosity of uf-SiO2R is only 29.6 Pa·s at the shear rate of 600 s−1, while the viscosity of uSiO2 reaches an amazing 48.3 Pa·s at the same filler content.
In order to quantitatively compare the effects of f-SiO2 and SiO2 on the viscosity of its composites, the power law model (Equations (4) and (5)) is used [14,31,32]. The fitting curves of shear stress and shear rate of the two kinds of composites are shown in Figure 5b, and the parameters of the fitting curves are listed in Table 2.
σ = k · γ n
η = σ / γ
where σ, k′, γ, n, and η are shear stress, consistency coefficient, shear rate, rheological index, and correlating viscosity, respectively. Among them, the rheological index n reflects the sensitivity of the fluid to shear, while the consistency coefficient k′ directly reflects the viscosity of the fluid. It can be seen that the value of n for uf-SiO2 is always higher than that for uSiO2 at the same filler content, which indicates that the uf-SiO2 possess stronger shear sensitivity [33]. Moreover, it is worth noting that the values of k′ for the f-SiO2/SR composites system is much smaller than that of uSiO2 overall as filler content increases, suggesting the lower viscosity and better manufacturability for uf-SiO2.

3.5. Micrographs Analysis

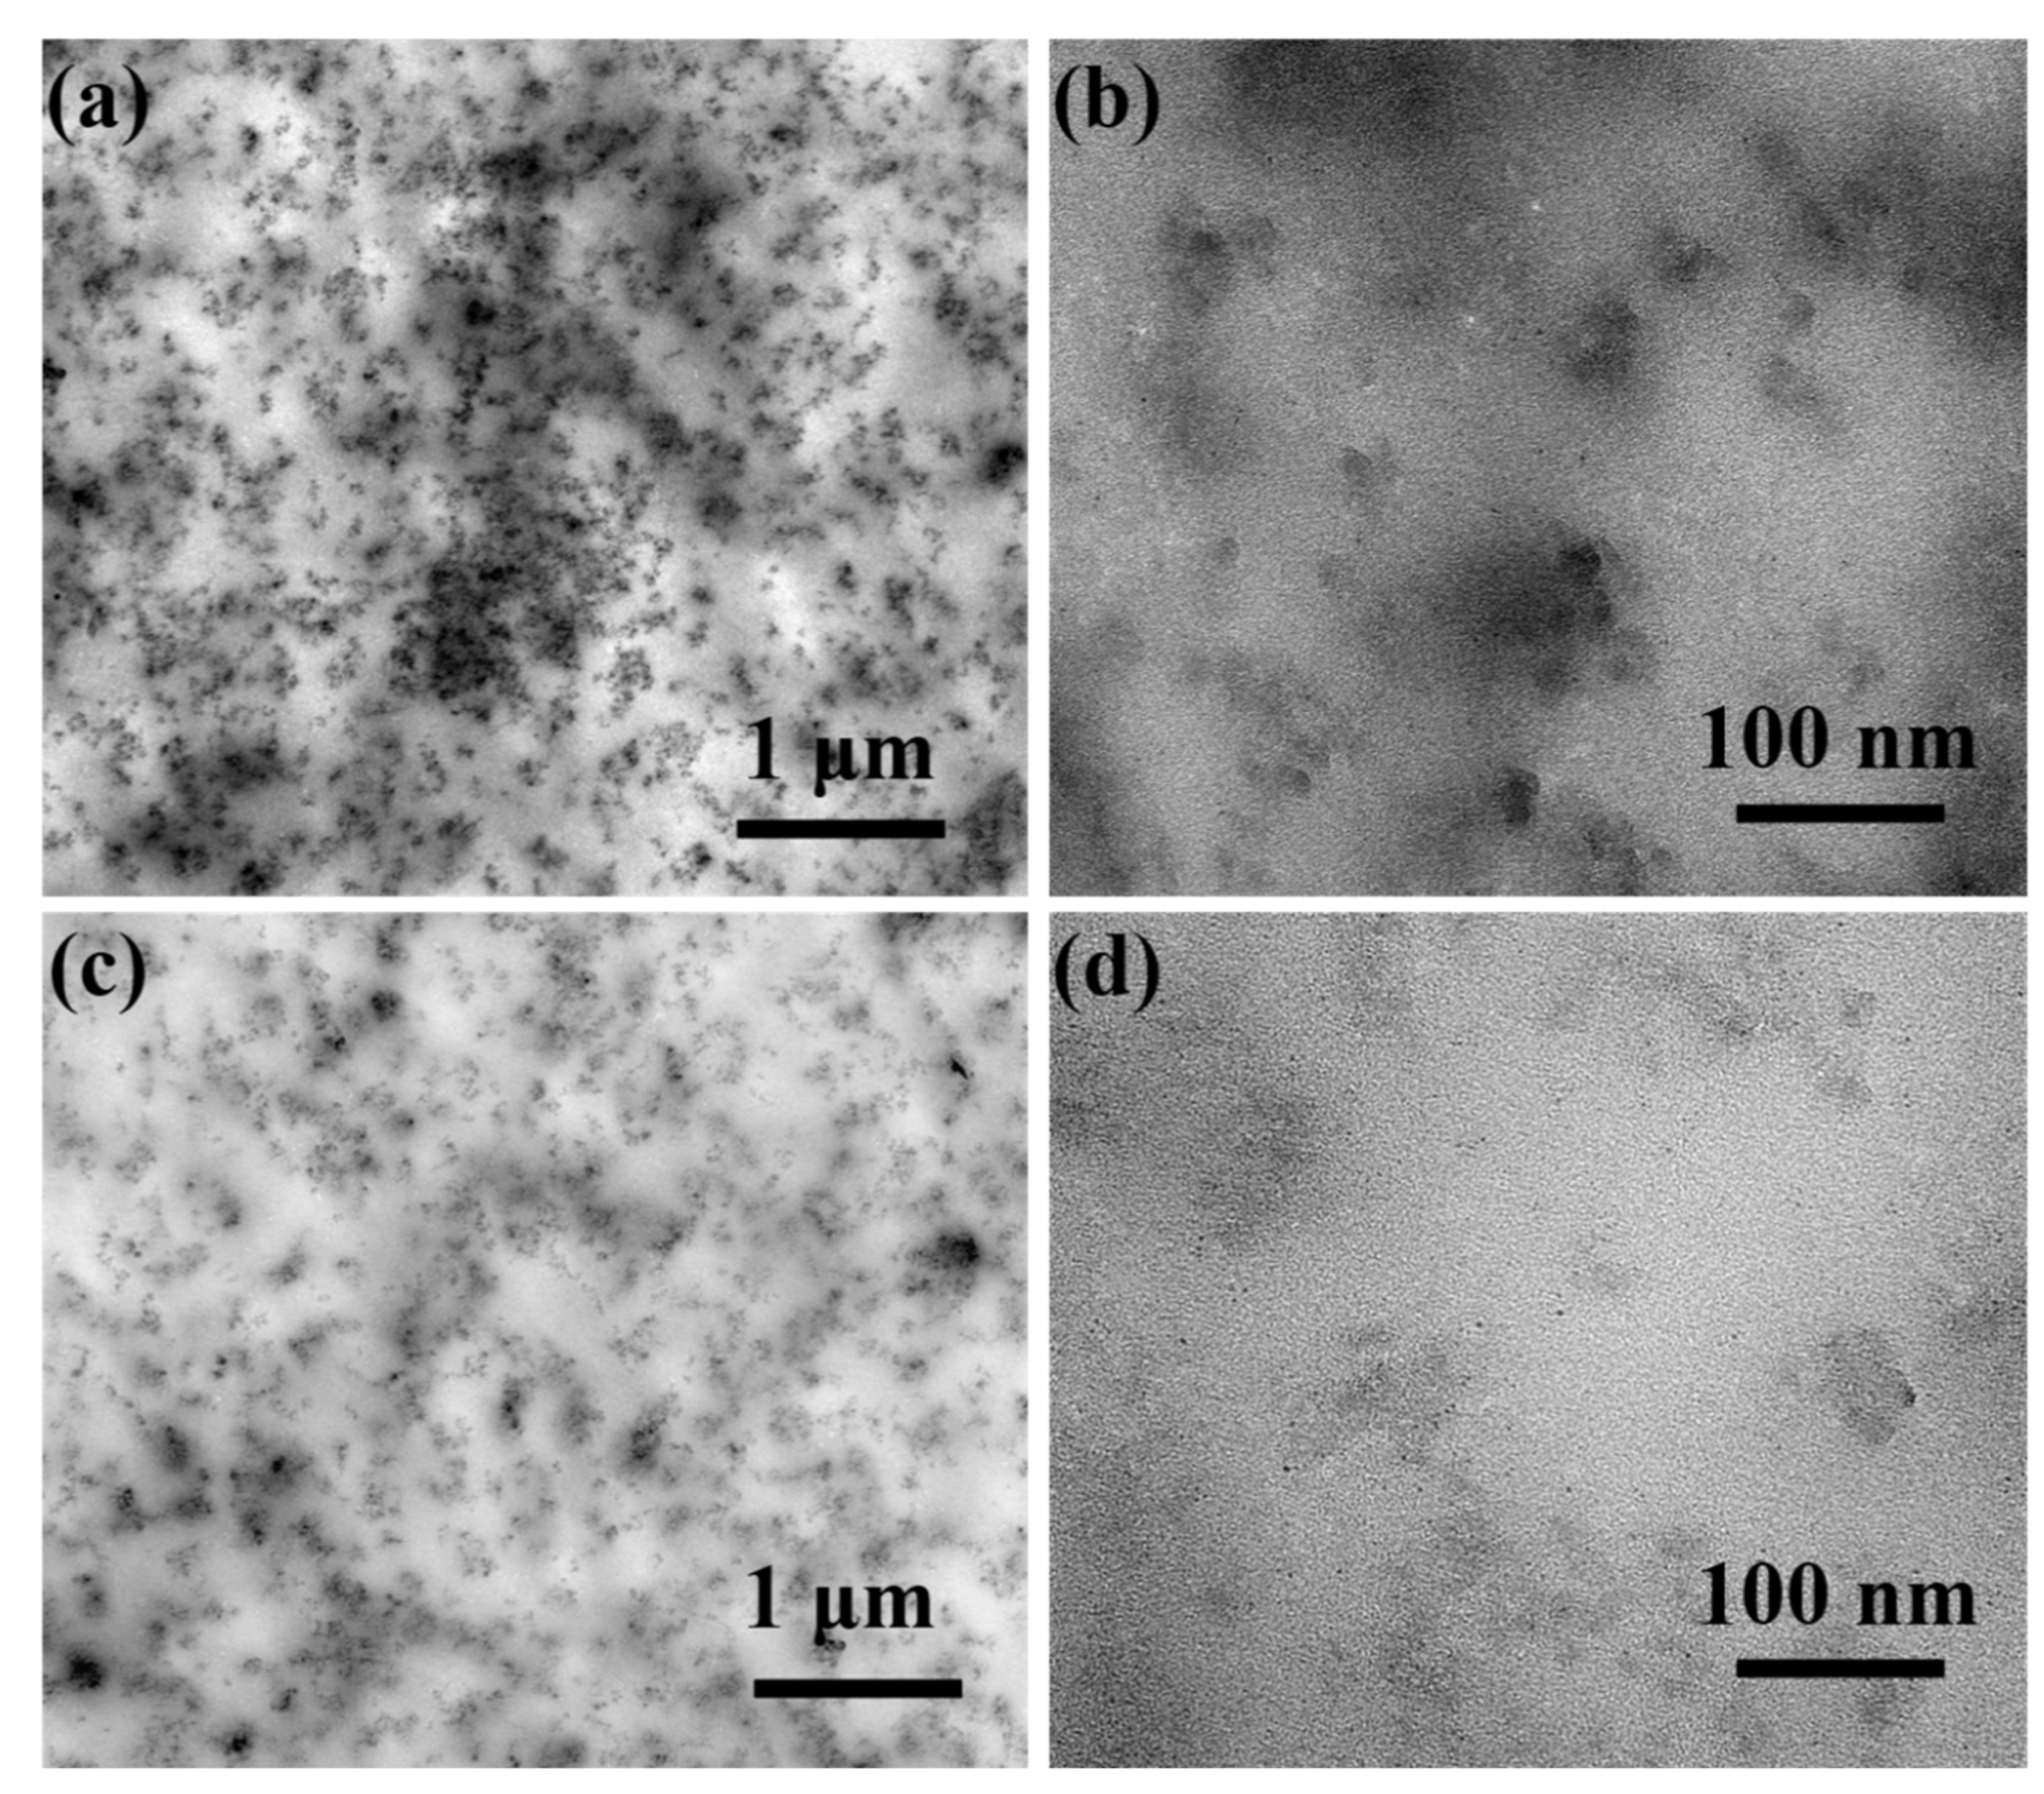
Figure 6 shows the TEM morphologies of SiO2 and f-SiO2 at 10 wt.% content in SR matrix. As shown in Figure 6a, the SiO2 particles cannot be evenly dispersed into the SR matrix, and a large number of aggregates appear, which is closely related to the compatibility between the particles and SR matrix. The surface of SiO2 has a large amount of hydrophilic Si-OH groups, which are incompatible with the hydrophobic SR matrix, resulting in the poor dispersion of SiO2 in SR [21]. The cluster area as shown in Figure 6b can be observed using a high-magnification TEM. It can be clearly observed that some aggregation of SiO2 particles exists in SR matrix. The aggregation degree between the f-SiO2 and SR matrix is lower than that of SiO2; only a relatively small cluster f-SiO2 particles is formed at about 85 nm in size, as shown in Figure 6c,d, which is due to the incomplete substitution of hydrophilic Si-OH groups on the surface of f-SiO2 particles. These results indicate that modified process of SiO2 has a good effect on the dispersion of f-SiO2 in SR matrix because the hydrophilic surface of unmodified SiO2 particles changes to the SR-friendly hydrophobic state.

3.6. Thermal Stability Analysis of SiO2/SR Composites

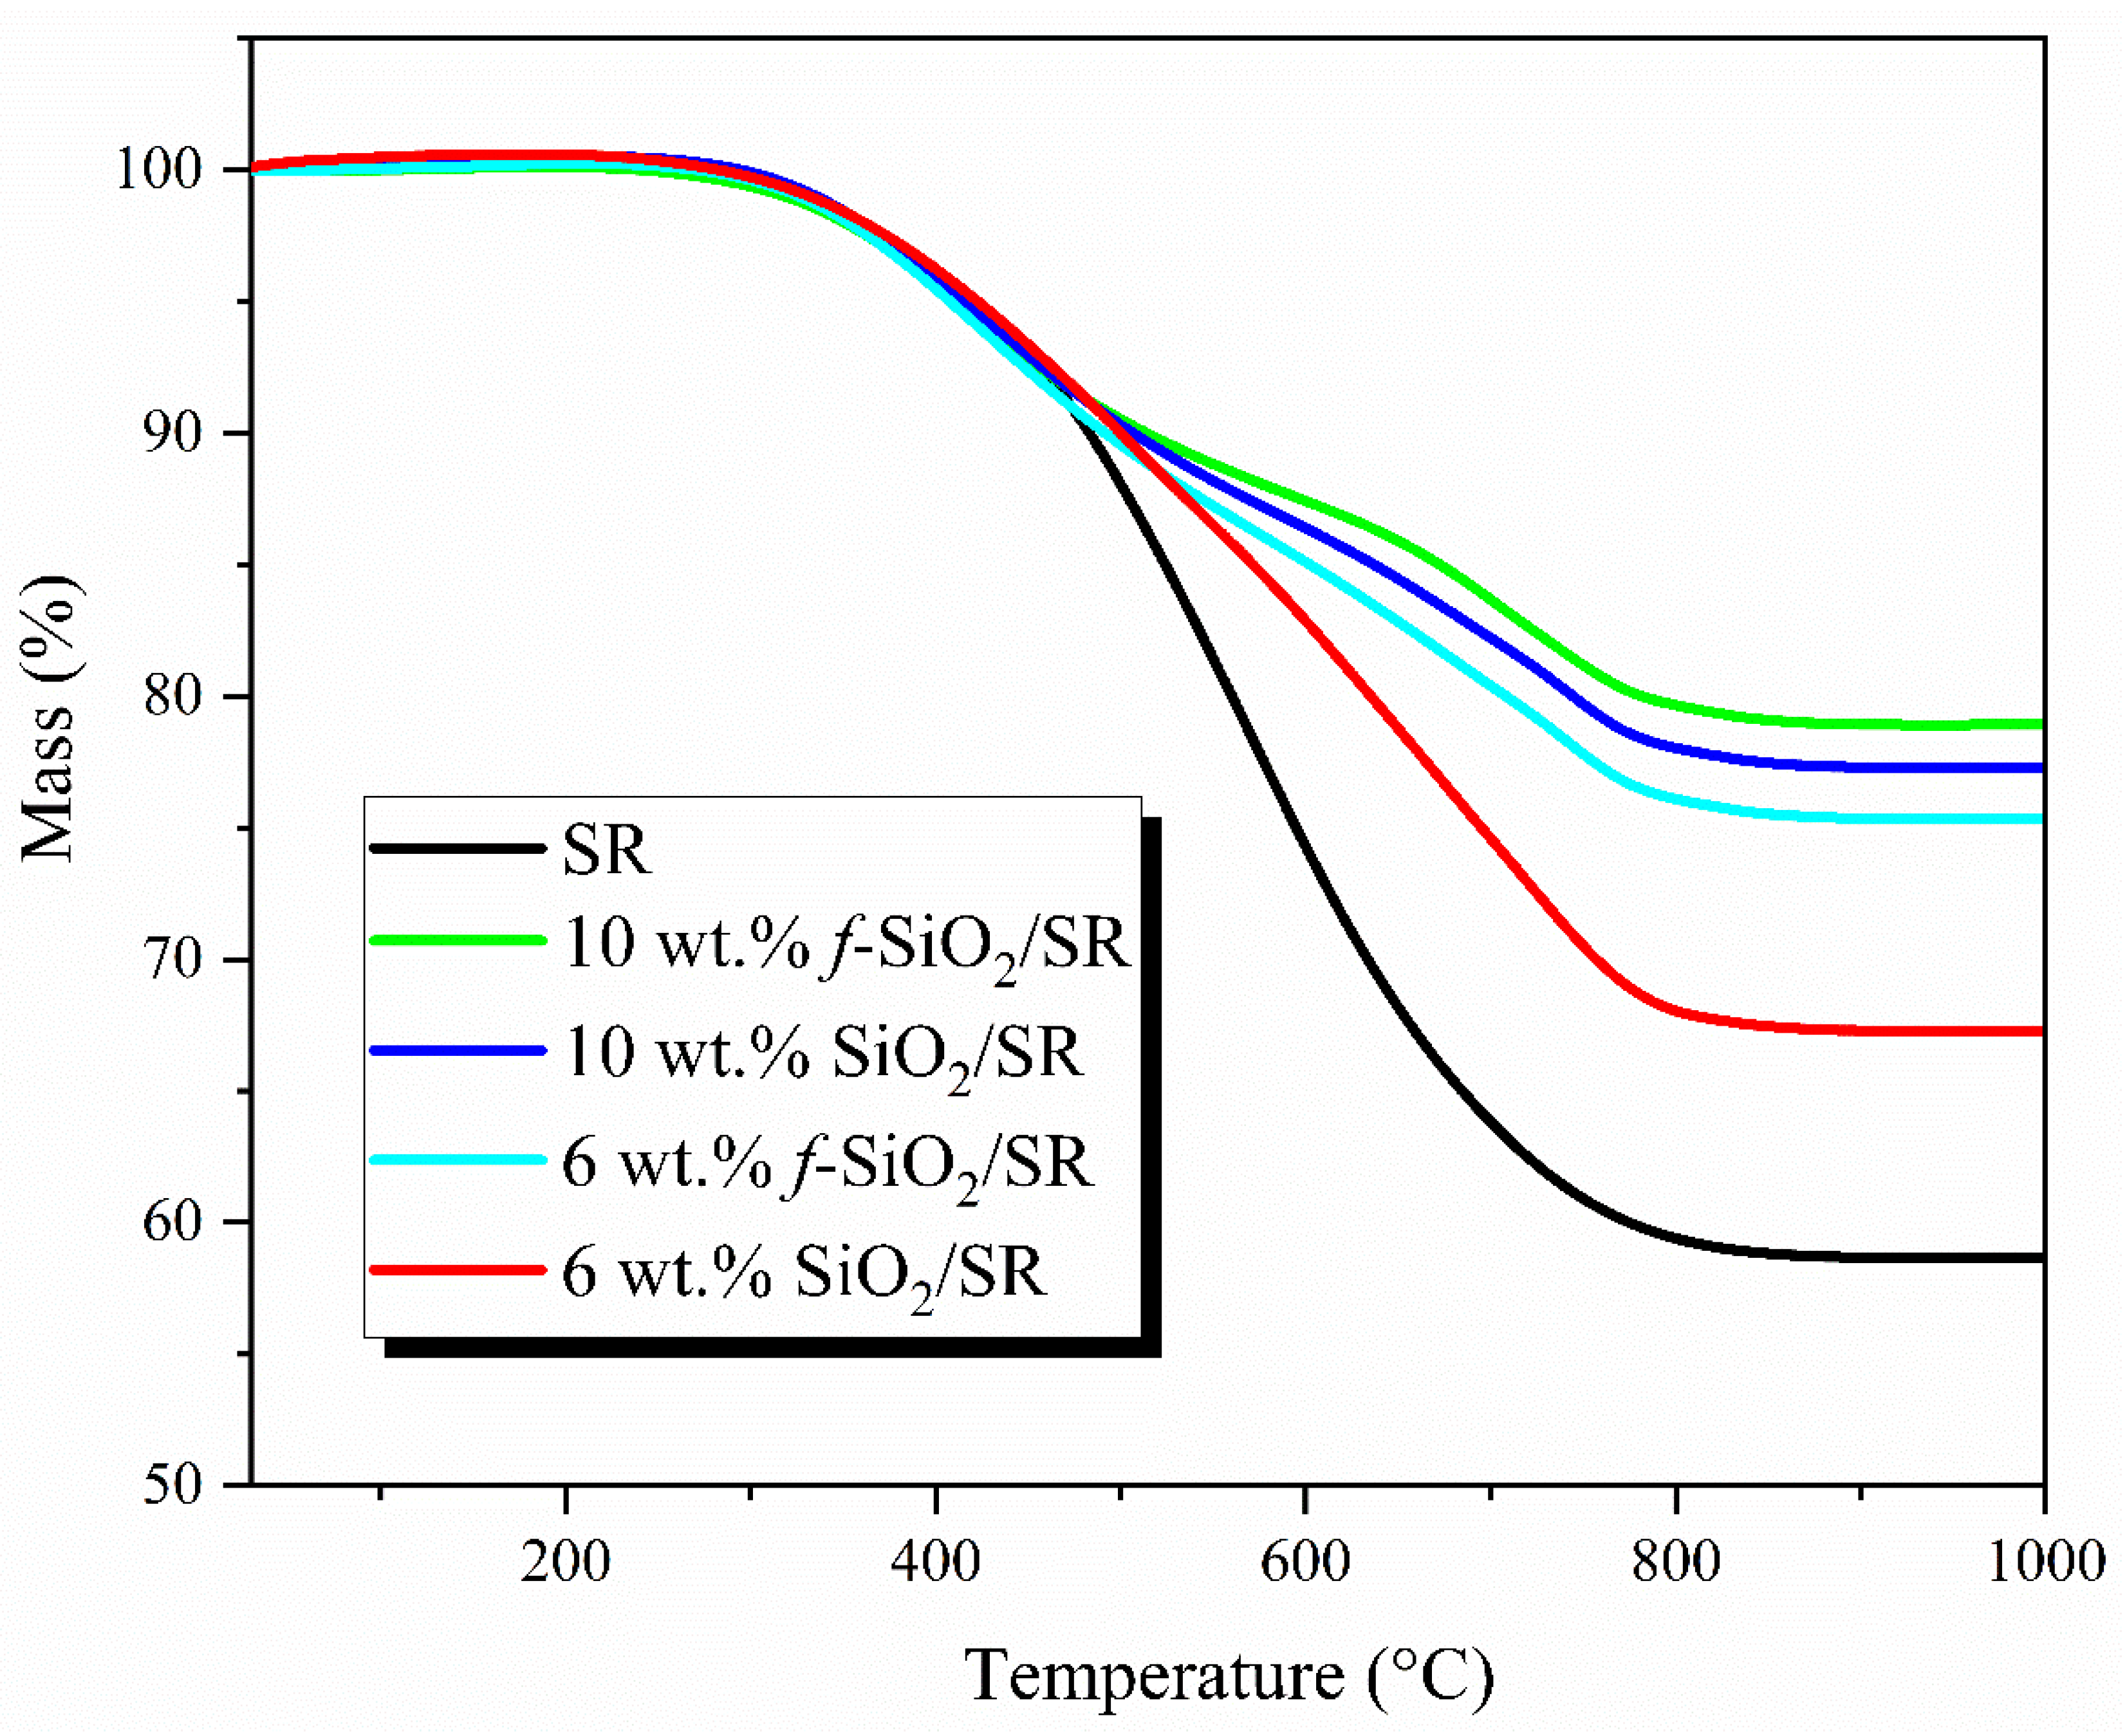
Figure 7 shows the TG curves of the SR composites at 6 wt.% and 10 wt.% filler contents. The 10% decomposition temperature (T10), the maximum thermal decomposition temperature (Tmax), and 1000 °C residual (R1000) of the f-SiO2/SR composites obtained from TG curve are listed in Table 3. For SR, the temperatures of T10, Tmax, and R1000 were 483.4 °C, 554.3 °C, and 58.6%, respectively. After being reinforced by SiO2 and f-SiO2, the T10, Tmax, and R1000 of all composites show different degrees of enhancement, which indicates that the characteristics of nanostructures and high specific surface area for SiO2 particles can effectively improve the thermal stability of SR. In particular, at the same loading of SiO2, the f-SiO2/SR composites show better thermal stability than SiO2/SR composites. The T10, Tmax, and R1000 of 10 wt.% SiO2/SR composites are 507.9 °C, 593.5 °C, and 77.2%, respectively, while the 10 wt.% f-SiO2/SR composites system can reach 518.3 °C, 603.2 °C, and 78.9%, respectively, which is caused by the following reasons: (1) After modification, the f-SiO2 still maintains a relatively large specific surface area, which is beneficial for f-SiO2 to restrict the molecular chains motion of SR. (2) The f-SiO2 has better dispersibility than SiO2 in SR matrix, which means that the number of particles per unit volume increases. Thus, more SR molecular chains are restricted, contributing to the improvement of thermal stability [28]. (3) The strong chemical bonds between the interface of f-SiO2 and SR require more energy to destroy, resulting in the better thermal stability compared to SiO2/SR composites combined by hydrogen bonds.

3.7. Thermal Conductive Property

Liquid silicone rubber is widely used as the matrix resin of high temperature thermal insulation materials because of its excellent heat resistance. For polymer-based thermal insulation materials, the polymer matrix acting as continuous phase of heat conduction has a great influence on the thermal conductivity of its composites. For example, in our previous work, the thermal conductivity of the silicone rubber as the matrix is 0.185 W/(mK), while that of the hollow silica microspheres (HSM) as thermal insulation functional phase is only 0.012 W/(mK), which is one order of magnitude lower than that of the matrix [34]. Therefore, it is necessary to study the variation of thermal conductivity of SR with the change of SiO2 particles content, which may provide some help in the design of SR-based thermal insulation materials.
The thermal conductivities of f-SiO2/SR and SiO2/SR composites are shown in Figure 8. The thermal conductivity of pure SR is only 0.121 W/(mK). After adding the f-SiO2 and SiO2, the thermal conductivities of both the two kinds of composites are improved. Overall, the thermal conductivity of f-SiO2/SR composites is always higher than that of SiO2/SR composites system at the same filler content. After adding 10 wt.% filler contents, the thermal conductivities of f-SiO2/SR and SiO2/SR composites reach 0.161 W/(mK) and 0.143 W/(mK), respectively, which are 41.3% and 26.4%, respectively, higher than that of SR. In particular, it should be noted that the thermal conductivity is not too different when the filler content is less than 6 wt.%. With the increase in filler content, the difference in thermal conductivity between the two types of composites increases obviously. This phenomenon may be explained by the following reasons: (1) the thermal conductivity of silica is generally considered to be 1.4 W/(mK), which is higher than that of SR in this study. Therefore, the f-SiO2 and SiO2 in its composites can be regarded as heat-conducting particles. The thermal conductivity of composites depends on the matrix polymer, fillers, and the combination state between them [35,36,37]. When the filler content is low, the fillers can be evenly dispersed in SR, but there is no contact and interaction between the fillers, which leads to the little contribution to the improvement of thermal conductivity of the whole composite system. With the increase in the filler content, the number of fillers reaches the critical point and the fillers begin to contact each other, forming a thermal conductivity network, which causes the thermal conductivity of the composites to begin to show an obvious upward trend. (2) Heat transfer between conductive particles and polymer matrix is realized via phonon propagation [24]. The interface state between f-SiO2 and SiO2 with SR is different. The interface between f-SiO2 and SR is connected by chemical bonds, while the interface between SiO2 and SR is only connected by hydrogen bonds. As reported in related literature, after surface modification, the bonding force between the conductive particles and the polymer matrix can be greatly increased because of the decrease of interface thermal resistance, contributing to the enhancement of phonon propagation and the thermal conductivity [24,38].
In order to further study the influence of surface modification on the thermal conductivity of the composites, the thermal conductivity of the f-SiO2/SR and SiO2/SR composites are analyzed by using the Maxwell–Eucken model [39]. The influence of the interface thermal resistance and the filler shapes on the thermal conductivity of the composite is considered in this model, as described by Equation (6).
k c = k p k f [ 1 + ( ψ 1 ) α ] + ( ψ 1 ) k p + ( ψ 1 ) φ f [ k f ( 1 α ) k p ] k f [ 1 + ( ψ 1 ) α ] + ( ψ 1 ) k p φ f [ k f ( 1 α ) k p ]
where φf, kc, kp, and kf are the volume fraction of conductive fillers and the thermal conductivities of the composites, SR matrix, and fillers, respectively. ψ represents the shape factor of conductive fillers, which is related to filler sphericity. The closer the value of ψ is to 3, the more spherical the fillers are. α is the interfacial thermal resistance factor, which is an evaluation of interfacial thermal resistance. The larger the value of α is, the larger the thermal resistance between fillers and polymer matrix is. In this study, both the values of ψ and α are unknown. Therefore, it can be first assumed that no interfacial thermal resistance exists between the fillers and SR matrix, that is, α = 0. In this case, Equation (3) is used to generate a series of derived curves (Figure 9a,b) between the thermal conductivity of the composites and the filler content at different filler shape factors (ψ). In order to distinguish the ψ value of f-SiO2/SR and SiO2/SR composites, the ψ values of f-SiO2/SR composites and SiO2/SR composites are named as ψ1 and ψ2, respectively. By comparing with the experimental data of the composites, it can be concluded that the shape factors are in good agreement with the experimental data when the value of ψ1 and ψ2 are 6 and 4, respectively. The different shape factors of the two kinds of composite systems indicate that the surface modification process has a great influence on the shape of the fillers, which is consistent with the result of SEM in Figure 3b,c. However, considering the existence of interfacial thermal resistance between the fillers and SR matrix in practice, it can be inferred that the actual values of ψ are larger than the calculated values. Therefore, for further investigation, the values of ψ1 and ψ2 are chosen to be 7 and 5, respectively. Based on this assumption, the relationships between the thermal conductivity and filler content of the composites under different interfacial thermal resistance factors (α) are shown in Figure 9c,d. It can be seen that the experimental data of the composites match the corresponding predicted curves when the interfacial thermal resistance factors of f-SiO2/SR and SiO2/SR composites are about 0.1 and 0.2, respectively. This result indicates that the interfacial thermal resistance between the f-SiO2 and SR matrix is lower than that of SiO2 and SR matrix, attributing to the enhancement of phonon propagation after the chemical bonding between f-SiO2 and SR matrix. In particular, when the fillers content is exceeds 6 wt.%, the experimental data deviate greatly from the corresponding curves. This is because that the Maxwell–Eucken model is suitable for the thermal conductivity of composites with low-volume-fraction fillers [24]. Therefore, the better dispersion and the lower interfacial thermal resistance with SR matrix are the main reasons for the higher thermal conductivities of f-SiO2/SR composites compared to SiO2/SR composites.

3.8. Mechanical Property

The mechanical properties of pure SR and its composites with different contents of SiO2 and f-SiO2 are measured. Figure 10a,b shows the typical stress–strain curves of SiO2/SR and f-SiO2/SR composites, respectively. Evidently, it can be seen that the mechanical properties of both SiO2/SR and f-SiO2/SR composites increase with additions of corresponding particles. The ultimate tensile stress (tensile strength) for the composites is extracted from the curves just after failure, and the corresponding comparison results are shown in Figure 10c. It can be seen that there are obvious differences between SiO2 and f-SiO2 in improving the mechanical properties of SR. The tensile strength of SiO2/SR composites increases from 3.42 MPa to 4.83 MPa when the filling amount increases from 0 to 10 wt.%, about a 50.1% increase. In contrast, the tensile strength of f-SiO2/SR composites increases to 5.86 MPa, a 74.3% enhancement of SR at 10 wt.% filler content. Therefore, it can be concluded that the f-SiO2 has a better mechanical reinforcement effect on SR than SiO2 does.
The reinforcing effect of nanomaterials on rubber is closely related to the dispersion state of nanomaterials in the matrix and the interface force [40,41]. In this study, the dispersion state of SiO2 in SR matrix will directly affect the mechanical strengthening effect. As shown in Figure 6, it can be intuitively seen that the f-SiO2 particles distribute more uniformly in SR matrix than SiO2 particles do even though agglomerations are not avoided. However, the size of agglomerations in SiO2/SR composites include several microns, submicrons, and even nanometers. Considering such a size distribution, hierarchical network structure can be consequently formed between the different-sized aggregates and SR molecular chains, and the stress transfer ability of such hierarchical polymer/filler networks is considered as the main reason for the improved strength of the composites [42]. Therefore, it is not hard to understand that the f-SiO2/SR composites system with better dispersion in SR matrix will have a more perfect hierarchical network structure, contributing to the better mechanical properties compared to the SiO2/SR composites system. In addition, the interface force between SiO2 particles and SR matrix is also a key factor affecting the mechanical properties for the composites, and the interface force between aggregates and matrix is beneficial for improving the overall strength [43]. For SiO2/SR composites, the interface force between SiO2 particles and SR matrix is mainly the van der Waals force, which is a type of relatively weak interface force. Thus, during the stretching process, the SiO2 particles are easily deboned between the interfaces of the composites, leading to the failure of tensile strength [42]. For f-SiO2/SR composites, the Si-CH=CH2 groups on the surface of f-SiO2 can polymerize with the Si-H groups in SR matrix in situ, and thus, the interface force between SiO2 particles and the SR matrix is mainly the chemical bond force, which is a type of strong interface force. The comparison results of elongation at break for the composites are shown in Figure 10d. With the increase in filler content, the elongation at break for both the SiO2/SR and f-SiO2/SR composites exhibits a continuous increasing trend. However, the growth of f-SiO2/SR composites is lower than that of SiO2/SR composites. The elongation at break of SiO2/SR composites increases from 115.1% to 146.2%, and the elongation at break increases by 27.2% when the filling amount increases from 0 to 10 wt.%. In contrast, the elongation at break of f-SiO2/SR composites increases to 137.3%, only 19.3% higher than that of pure SR at 10 wt.% filler loading, which is caused by the stronger binding effect of f-SiO2 on SR molecular chains compared to that of SiO2. As is known, for rubber materials, the rubber molecular chain is very long, and there are physical or chemical interactions between the molecules, forming a large network. In addition, the rubber molecular chain has good flexibility and a low interaction force. When large deformation occurs, the molecular chain network will deform, and when the external force is released, the networks will recover. This is why rubber materials have good elasticity. For f-SiO2/SR composites, the motion of the SR molecular chain is greatly limited because of the strong chemical bonds between f-SiO2 particles and the SR matrix. For SiO2/SR composites, due to the relatively weak van der Waals force between SiO2 particles and the SR matrix, the movement of the SR molecular chain will not be greatly affected, resulting in better extensibility compared to the f-SiO2/SR composites system.
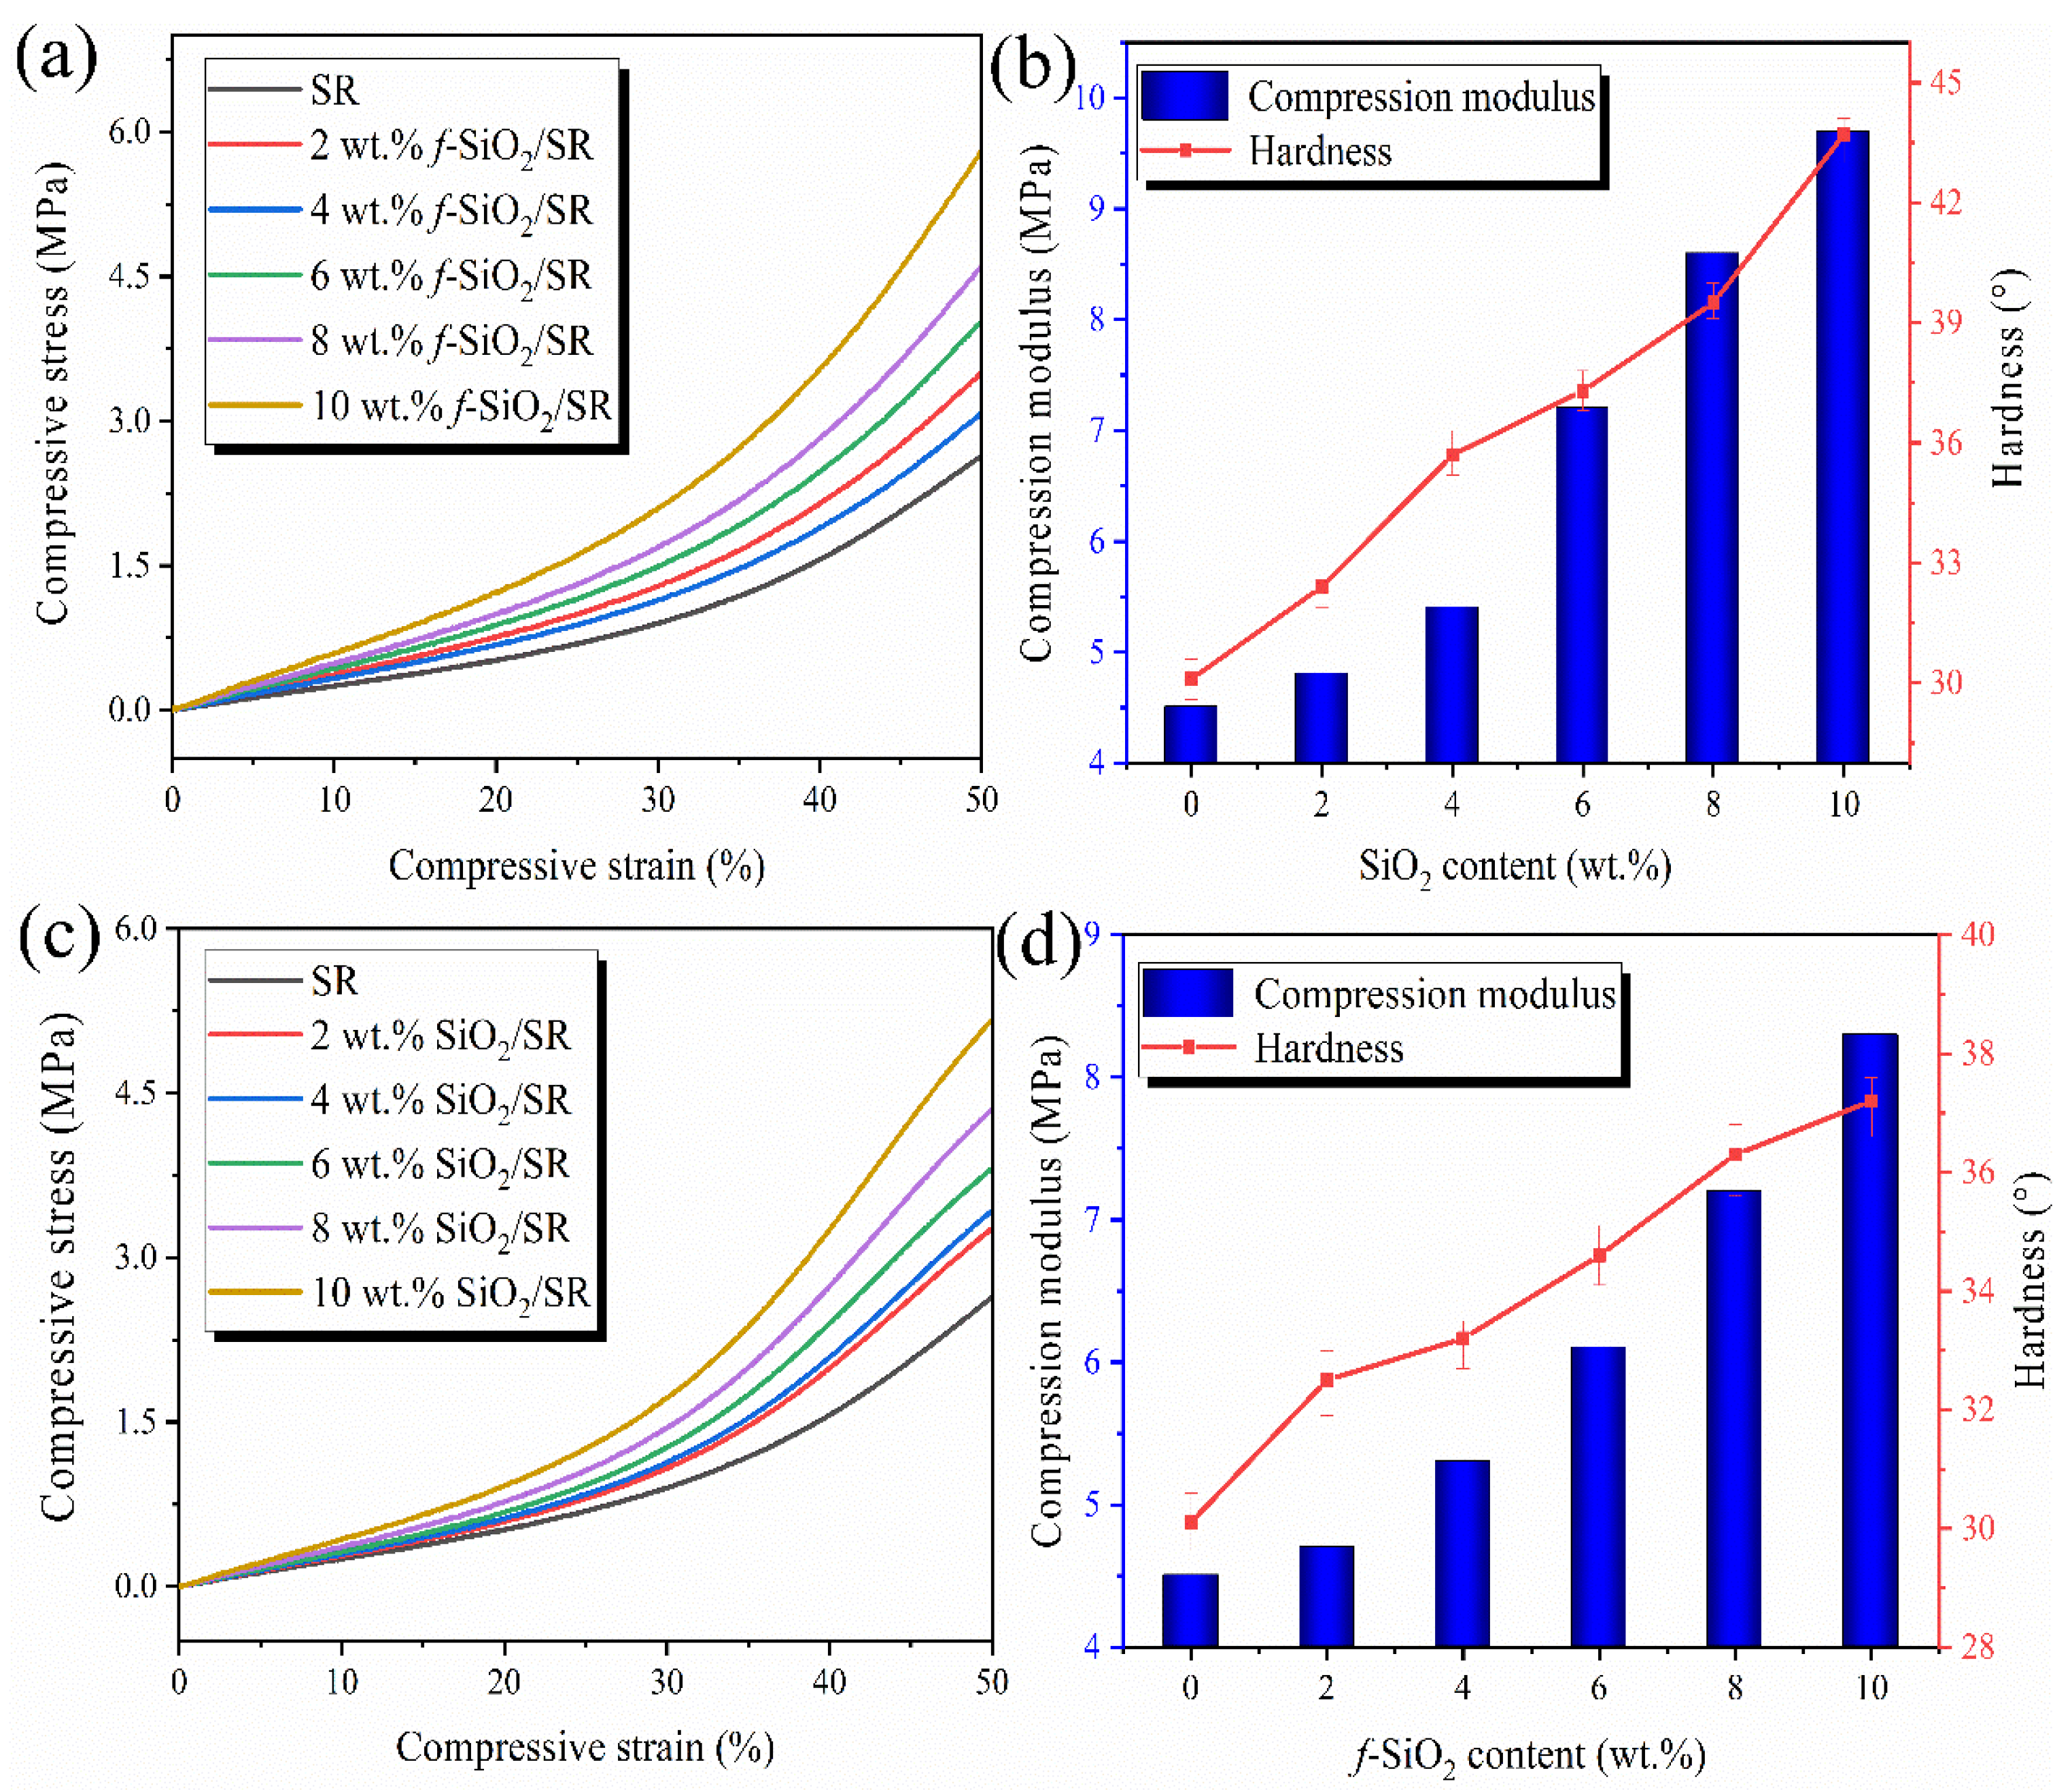
As a typical cushioning material, the compression properties and hardness of silicone rubber materials are very important for practical application. Figure 11 shows the compression property and hardness variation law with the increase of filler content. As shown in Figure 11a,c, with the increase in filler content, the compressive performances of both the f-SiO2/SR and SiO2/SR composites show a continuous increasing trend. As shown in Figure 11b,d. It can be seen that the f-SiO2 can effectively improve the compressive modulus of SR. With the filling amount increasing from 0 to 10 wt.%, the compressive modulus of SR increases from 4.48 MPa to 9.82 MPa. For SiO2/SR composites, the compressive modulus only increases from 4.48 MPa to 8.32 MPa. The difference of reinforcement to SR between SiO2 and f-SiO2 may be due to the dispersion of fillers and the strength of their interaction with SR molecular chains. The compression failure mechanism of composite materials is generally considered to be the “Rosen model”. In this model, tensile and shear modes are the main modes of composites failure caused by compressive load [44]. The better dispersion of f-SiO2 is more beneficial to the improvement of the tensile strength of SR than to that of SiO2, which is consistent with the result of Figure 10. Additionally, as reported in the literature [45], the mechanical properties of surface-modified carbon fibers (CFs) and polypropylene (PP) were studied. The results showed that the shear modulus of the composites with modified CFs showed better performance than that of unmodified CFs, which is attributed to the stronger force of the modified CFs with PP molecular chains. Therefore, it is not difficult to understand that the f-SiO2/SR composites system will have the better compression performance than that of SiO2/SR composites system because the f-SiO2 has stronger interface force with SR molecular chains than that of SiO2.
The hardness of the SiO2/SR and f-SiO2/SR composites are also shown in Figure 11b,d, respectively. It can be seen that the hardness of both two kinds of composites increase with the increase of fillers content. The maximum value of hardness for f-SiO2/SR composites can reach 43°, while the value of SiO2/SR composites is only 37°. The improvement of hardness of the composites is mainly caused by the restriction of the rigidity SiO2 particles to the flexible SR molecular chains [46]. For f-SiO2/SR composites, the Si-CH=CH2 on the surface of f-SiO2 may cause an increase in crosslinking density, resulting in the higher hardness of the composites compared to SiO2/SR composites. In order to further confirm this hypothesis, the crosslinking densities of SiO2/SR and f-SiO2/SR composites with different filler content are tested and the relevant results are shown in Table 4. Combined with the results of the above mechanical properties, it can be seen that the SiO2 particles tends to improve the crosslinking density alongside reinforcing the networks, and this result is also consistent with the relevant literature reports [47,48]. The increase of crosslinking density with the increase of filler content in this study is closely related the large specific surface area of SiO2 particles. The physical adsorption of SiO2 particles can greatly increase the entanglement probability between SR molecular chains and rigid SiO2 particles, which helps to improve the crosslinking density of the composites. the f-SiO2/SR composites system, there are not only physical entanglements but also chemical bonding through in situ polymerization between SR molecular chains and f-SiO2 particles, which may further improve the crosslinking density of the composites.

4. Conclusions

A type of vinyl-modified SiO2 particle (f-SiO2) was prepared through a surface modification of hydrophilic silica with the tetramethyldivinyldisilazane (TMDVS). The chemical structures of f-SiO2 were characterized by FT-IR and XPS, and the results confirmed the existence of typical characteristic peak caused by Si-CH=CH2 groups, suggesting successful modification. The effect of modification on particle size distribution and specific surface area were also studied, the results of which demonstrated that the aggregation of hydrophobic particles is greatly reduced. TEM observations indicated that the f-SiO2 particles were fairly well dispersed in SR composites in the form of clusters 85 nm in size at maximum. The rheological results show that the f-SiO2/SR composites system possessed lower viscosity and better manufacturability than the SiO2/SR composite. The viscosity of f-SiO2/SR composite was only 29.6 Pa·s at the shear rate of 600 s−1, while the viscosity of SiO2/SR composites system reached an amazing 48.3 Pa·s at the same filler content. The TG results indicated that the thermal stability of f-SiO2/SR composites was better than that of SiO2/SR composites at same filler content, which is attributed to to the large specific surface area that remained and good dispersibility in SR matrix. The thermal conductivity results indicated that the f-SiO2 is not conducive to the preparation of low-thermal-conductivity SR matrix because of the high dispersion and low interfacial thermal resistance with matrix, especially at high filler content. The results of mechanical properties showed that the f-SiO2 had a good reinforcement effect on SR matrix and that the maximum tensile strength of f-SiO2/SR composite could reach 5.86 MPa, while the SiO2/SR composite is only 4.83 MPa at 10 wt.% filler contents. Additionally, the compressive strength had also been improved; the maximum compressive module of f-SiO2/SR composite and SiO2/SR composite increased from 4.48 MPa to 9.82 MPa and 8.32, respectively. These improvements in tensile and compressive strength were attributed to the covalent bonding between the Si-CH=CH2 groups on the surfaces of the f-SiO2 particles and the Si-H groups in SR.

Author Contributions

Conceptualization, Y.Z. (Yulong Zhang); methodology, Y.Z. (Yulong Zhang) and Y.Z. (Yanan Zhang); validation, Y.Z. (Yanan Zhang) and J.X.; formal analysis, Y.Z. (Ye Zhong) and W.L.; data curation, Y.Z. (Yulong Zhang) and Q.Z.; writing—original draft preparation, Q.Z.; writing—review and editing, Q.Z. and G.Z.; visualization, C.X.; supervision, Q.Z. and Y.M. All authors have read and agreed to the published version of the manuscript.

Funding

This research was funded by the National Natural Science Foundation of China (22005145).

Institutional Review Board Statement

“Not applicable” for studies not involving humans or animals.

Data Availability Statement

Not applicable.

Conflicts of Interest

The authors declare no conflict of interest.

References

  1. Koushki, P.; Kwok, T.-H.; Hof, L.; Wuthrich, R. Reinforcing silicone with hemp fiber for additive manufacturing. Compos. Sci. Technol. 2020, 194, 108139. [Google Scholar] [CrossRef]
  2. Zhao, Q.; Liu, Q.; Xu, H.; Bei, Y.; Feng, S. Preparation and characterization of room temperature vulcanized silicone rubber using α-amine ketoximesilanes as auto-catalyzed cross-linkers. RSC Adv. 2016, 6, 38447–38453. [Google Scholar] [CrossRef]
  3. Ragheb, A.M.; Brook, M.A.; Hrynyk, M. Highly active, lipase silicone elastomers. Biomaterials 2005, 26, 1653–1664. [Google Scholar] [CrossRef]
  4. Zhao, J.; Luo, G.; Wu, J.; Xia, H. Preparation of microporous silicone rubber membrane with tunable pore size via solvent evaporation-induced phase separation. ACS Appl. Mater. Interfaces 2013, 5, 2040–2046. [Google Scholar] [CrossRef]
  5. Pan, G.; Mark, J.E.; Schaefer, D.W. Synthesis and characterization of fillers of controlled structure based on polyhedral oligomeric silsesquioxane cages and their use in reinforcing siloxane elastomers. J. Polym. Sci. Part B Polym. Phys. 2003, 41, 3314–3323. [Google Scholar] [CrossRef]
  6. Baumann, T.F.; Jones, T.V.; Wilson, T.; Saab, A.P.; Maxwell, R.S. Synthesis and characterization of novel PDMS nanocomposites using POSS derivatives as cross-linking filler. J. Polym. Sci. Part A Polym. Chem. 2009, 47, 2589–2596. [Google Scholar] [CrossRef]
  7. Chen, D.; Liu, Y.; Huang, C. Synergistic effect between POSS and fumed silica on thermal stabilities and mechanical properties of room temperature vulcanized (RTV) silicone rubbers. Polym. Degrad. Stab. 2012, 97, 308–315. [Google Scholar] [CrossRef]
  8. Dong, X.; Niu, C.; Qi, M. Enhancement of electrorheological performance of electrorheological elastomers by improving TiO2 particles/silicon rubber interface. J. Mater. Chem. C 2016, 4, 6806–6815. [Google Scholar] [CrossRef]
  9. Liu, Y.; Shi, Y.; Zhang, D.; Li, J.; Huang, G. Preparation and thermal degradation behavior of room temperature vulcanized silicone rubber-g-polyhedral oligomeric silsesquioxanes. Polymer 2013, 54, 6140–6149. [Google Scholar] [CrossRef]
  10. Fereidoon, A.; Memarian, S.; Albooyeh, A.; Tarahomi, S. Influence of mesoporous silica and hydroxyapatite nanoparticles on the mechanical and morphological properties of polypropylene. Mater. Des. 2014, 57, 201–210. [Google Scholar] [CrossRef]
  11. Rostamiyan, Y.; Mashhadzadeh, A.H.; SalmanKhani, A. Optimization of mechanical properties of epoxy-based hybrid nanocomposite: Effect of using nano silica and high-impact polystyrene by mixture design approach. Mater. Des. (1980–2015) 2014, 56, 1068–1077. [Google Scholar] [CrossRef]
  12. Li, J.; Zhang, J.; Chen, L.; Wang, Y.; Liu, Z. Vinyl Functionalized Porous Silica Nanospheres Prepared by Poly (1-vinyl-2-pyrrolidone) Grafted Surface-Protected Selective Etching Strategy. J. Nanosci. Nanotechnol. 2018, 18, 2914–2920. [Google Scholar] [CrossRef]
  13. Nik Ismail, N.; Ansarifar, A.; Song, M. Effect of hybrid reinforcement based on precipitated silica and montmorillonite nanofillers on the mechanical properties of a silicone rubber. Polym. Eng. Sci. 2014, 54, 1909–1921. [Google Scholar] [CrossRef] [Green Version]
  14. Ma, X.-k.; Lee, N.-H.; Oh, H.-J.; Kim, J.-W.; Rhee, C.-K.; Park, K.-S.; Kim, S.-J. Surface modification and characterization of highly dispersed silica nanoparticles by a cationic surfactant. Colloids Surf. A Physicochem. Eng. Asp. 2010, 358, 172–176. [Google Scholar] [CrossRef]
  15. Li, Y.; Chen, Z.; Li, X.; Zeng, H. A new surface modification method to improve the dispersity of nano-silica in organic solvents. J. Sol-Gel Sci. Technol. 2011, 58, 290–295. [Google Scholar] [CrossRef]
  16. Zhao, F.; Zeng, X.; Li, H.; Guo, J. Preparation of fluorinated polyacrylate composite latex with in situ generated nano-silica dispersion and film durability. Iran. Polym. J. 2013, 22, 775–784. [Google Scholar] [CrossRef]
  17. Liu, J.; Wu, S.; Zou, M.; Zheng, X.; Cai, Z. Surface modification of silica and its compounding with polydimethylsiloxane matrix: Interaction of modified silica filler with PDMS. Iran. Polym. J. 2012, 21, 583–589. [Google Scholar] [CrossRef]
  18. Rangsunvigit, P.; Imsawatgul, P.; Na-ranong, N.; O’Haver, J.H.; Chavadej, S. Mixed surfactants for silica surface modification by admicellar polymerization using a continuous stirred tank reactor. Chem. Eng. J. 2008, 136, 288–294. [Google Scholar] [CrossRef]
  19. An, D.; Wang, Z.; Zhao, X.; Liu, Y.; Guo, Y.; Ren, S. A new route to synthesis of surface hydrophobic silica with long-chain alcohols in water phase. Colloids Surf. A Physicochem. Eng. Asp. 2010, 369, 218–222. [Google Scholar] [CrossRef]
  20. Li-Li, X.; Xiao-Guang, L.; Xing-Yuan, N.; Jun, S. Micro-structure and surface modification of porous silica coating and their effects on hydrophobicity. Chin. J. Inorg. Chem. 2013, 29, 449. [Google Scholar]
  21. Kartal, A.M.; Erkey, C. Surface modification of silica aerogels by hexamethyldisilazane–carbon dioxide mixtures and their phase behavior. J. Supercrit. Fluids 2010, 53, 115–120. [Google Scholar] [CrossRef]
  22. Park, J.; Lee, J.; Hong, Y. Effects of vinylsilane-modified nanosilica particles on electrical and mechanical properties of silicone rubber nanocomposites. Polymer 2020, 197, 122493. [Google Scholar] [CrossRef]
  23. Li, Q.; Huang, X.; Liu, H.; Shang, S.; Song, Z.; Song, J. Properties enhancement of room temperature vulcanized silicone rubber by rosin modified aminopropyltriethoxysilane as a cross-linking agent. ACS Sustain. Chem. Eng. 2017, 5, 10002–10010. [Google Scholar] [CrossRef]
  24. Zhao, X.-W.; Song, L.-Y.; Zhu, X.-D.; Liu, K.-G.; Zang, C.-G.; Wen, Y.-Q.; Jiao, Q.-J. One-step enrichment of silica nanoparticles on milled carbon fibers and their effects on thermal, electrical, and mechanical properties of polymethyl-vinyl siloxane rubber composites. Compos. Part A Appl. Sci. Manuf. 2018, 113, 287–297. [Google Scholar] [CrossRef]
  25. Soraru, G.D.; Dallabona, N.; Gervais, C.; Babonneau, F. Organically modified SiO2− B2O3 gels displaying a high content of borosiloxane (B−O−Si⋮) bonds. Chem. Mater. 1999, 11, 910–919. [Google Scholar] [CrossRef]
  26. Ma, P.C.; Kim, J.-K.; Tang, B.Z. Functionalization of carbon nanotubes using a silane coupling agent. Carbon 2006, 44, 3232–3238. [Google Scholar] [CrossRef] [Green Version]
  27. Jiang, S.; Li, Q.; Zhao, Y.; Wang, J.; Kang, M. Effect of surface silanization of carbon fiber on mechanical properties of carbon fiber reinforced polyurethane composites. Compos. Sci. Technol. 2015, 110, 87–94. [Google Scholar] [CrossRef]
  28. Yue, Y.; Zhang, H.; Zhang, Z.; Chen, Y. Polymer–filler interaction of fumed silica filled polydimethylsiloxane investigated by bound rubber. Compos. Sci. Technol. 2013, 86, 1–8. [Google Scholar] [CrossRef]
  29. Miao, J.; Qian, J.; Wang, X.; Zhang, Y.; Yang, H.; He, P. Synthesis and characterization of ordered mesoporous silica by using polystyrene microemulsion as templates. Mater. Lett. 2009, 63, 989–990. [Google Scholar] [CrossRef]
  30. Liu, J.; Deng, Y.; Liu, C.; Sun, Z.; Zhao, D. A simple approach to the synthesis of hollow microspheres with magnetite/silica hybrid walls. J. Colloid Interface Sci. 2009, 333, 329–334. [Google Scholar] [CrossRef]
  31. Teng, C.-C.; Ma, C.-C.M.; Huang, Y.-W.; Yuen, S.-M.; Weng, C.-C.; Chen, C.-H.; Su, S.-F. Effect of MWCNT content on rheological and dynamic mechanical properties of multiwalled carbon nanotube/polypropylene composites. Compos. Part A Appl. Sci. Manuf. 2008, 39, 1869–1875. [Google Scholar] [CrossRef]
  32. Chen, C.; Tang, Y.; Ye, Y.S.; Xue, Z.; Xue, Y.; Xie, X.; Mai, Y.-W. High-performance epoxy/silica coated silver nanowire composites as underfill material for electronic packaging. Compos. Sci. Technol. 2014, 105, 80–85. [Google Scholar] [CrossRef]
  33. Huang, L.P.; Zhou, X.P.; Cui, W.; Xie, X.L.; Tong, S.Y. Maleic anhydride-grafted linear low-density polyethylene with low gel content. Polym. Eng. Sci. 2009, 49, 673–679. [Google Scholar] [CrossRef]
  34. Zhao, X.W.; Zang, C.G.; Sun, Y.L.; Zhang, Y.L.; Wen, Y.-Q.; Jiao, Q.J. Effect of hybrid hollow microspheres on thermal insulation performance and mechanical properties of silicone rubber composites. J. Appl. Polym. Sci. 2018, 135, 46025. [Google Scholar] [CrossRef]
  35. Louis, M.; Joshi, S.; Brockmann, W. An experimental investigation of through-thickness electrical resistivity of CFRP laminates. Compos. Sci. Technol. 2001, 61, 911–919. [Google Scholar] [CrossRef]
  36. Zhu, X.D.; Zang, C.G.; Jiao, Q.J. High electrical conductivity of nylon 6 composites obtained with hybrid multiwalled carbon nanotube/carbon fiber fillers. J. Appl. Polym. Sci. 2014, 131, 40923. [Google Scholar] [CrossRef]
  37. Gulgunje, P.V.; Newcomb, B.A.; Gupta, K.; Chae, H.G.; Tsotsis, T.K.; Kumar, S. Low-density and high-modulus carbon fibers from polyacrylonitrile with honeycomb structure. Carbon 2015, 95, 710–714. [Google Scholar] [CrossRef]
  38. García-Valdez, O.; Ledezma-Rodríguez, R.; Saldívar-Guerra, E.; Yate, L.; Moya, S.; Ziolo, R.F. Graphene oxide modification with graft polymers via nitroxide mediated radical polymerization. Polymer 2014, 55, 2347–2355. [Google Scholar] [CrossRef]
  39. Jiajun, W.; Xiao-Su, Y. Effects of interfacial thermal barrier resistance and particle shape and size on the thermal conductivity of AlN/PI composites. Compos. Sci. Technol. 2004, 64, 1623–1628. [Google Scholar] [CrossRef]
  40. Jiang, M.-J.; Dang, Z.-M.; Xu, H.-P. Enhanced electrical conductivity in chemically modified carbon nanotube/methylvinyl silicone rubber nanocomposite. Eur. Polym. J. 2007, 43, 4924–4930. [Google Scholar] [CrossRef]
  41. Coleman, J.N.; Khan, U.; Blau, W.J.; Gun’ko, Y.K. Small but strong: A review of the mechanical properties of carbon nanotube–polymer composites. Carbon 2006, 44, 1624–1652. [Google Scholar] [CrossRef]
  42. Chen, J.; Liu, J.; Yao, Y.; Chen, S. Effect of microstructural damage on the mechanical properties of silica nanoparticle-reinforced silicone rubber composites. Eng. Fract. Mech. 2020, 235, 107195. [Google Scholar] [CrossRef]
  43. Zare, Y. The roles of nanoparticles accumulation and interphase properties in properties of polymer particulate nanocomposites by a multi-step methodology. Compos. Part A Appl. Sci. Manuf. 2016, 91, 127–132. [Google Scholar] [CrossRef]
  44. Ziraki, S.; Zebarjad, S.M.; Hadianfard, M.J. A study on the role of polypropylene fibers and silica nanoparticles on the compression properties of silicone rubber composites as a material of finger joint implant. Int. J. Polym. Mater. Polym. Biomater. 2017, 66, 48–52. [Google Scholar] [CrossRef]
  45. Gogoi, R.; Sethi, S.K.; Manik, G. Surface functionalization and CNT coating induced improved interfacial interactions of carbon fiber with polypropylene matrix: A molecular dynamics study. Appl. Surf. Sci. 2021, 539, 148162. [Google Scholar] [CrossRef]
  46. Li, Y.-f.S.; Zang, C.-g.; Zhang, Y.-l. Effect of the structure of hydrogen-containing silicone oil on the properties of silicone rubber. Mater. Chem. Phys. 2020, 248, 122734. [Google Scholar] [CrossRef]
  47. Xu, H.; Ding, L.; Song, Y.; Wang, W. Rheology of end-linking polydimethylsiloxane networks filled with silica. J. Rheol. 2020, 64, 1425–1438. [Google Scholar] [CrossRef]
  48. Goswami, M.; Ghosh, M.M.; Dalmiya, M.S.; Sharma, S.; Ghorai, S.K.; Chattopadhyay, S. A finite element method based comparative fracture assessment of carbon black and silica filled elastomers: Reinforcing efficacy of carbonaceous fillers in flexible composites. Polym. Test. 2020, 91, 106856. [Google Scholar] [CrossRef]
Figure 1. Schematic diagram of (a) TMDVS modification process on silica surface; (b) mechanism of in situ polymerization between f-SiO2 and SR matrix.
Polymers 15 01224 g001
Figure 2. (a) FT-IR spectra and (b) wide-scan XPS spectra of SiO2 particles; high-resolution XPS spectra: (c,d) C1s peaks of f-SiO2 and SiO2, respectively; (e,f) Si2p peaks of f-SiO2 and SiO2, respectively.
Polymers 15 01224 g002
Figure 3. (a) Particle size distribution; (b,c) SEM images of SiO2 before and after modification; (d) hydrophobicity of SiO2 and f-SiO2.
Polymers 15 01224 g003
Figure 4. TG–DSC curves of SiO2 and f-SiO2, respectively.
Polymers 15 01224 g004
Figure 5. (a) Shear viscosity of SR and its composites filled with f-SiO2 and SiO2; (b) relationship between apparent shear rate and shear stress of SR and its composites filled with f-SiO2 and SiO2.
Polymers 15 01224 g005
Figure 6. TEM morphologies of (a,b) the SiO2/SR and (c,d) the f-SiO2/SR composites at 10 wt.% filler content.
Polymers 15 01224 g006
Figure 7. Thermal stability of the SR composites filled with f-SiO2 and SiO2 at the filler content of 6 wt.% and 10 wt.%.
Polymers 15 01224 g007
Figure 8. Thermal conductivity of f-SiO2/SR and SiO2/SR composites with different fillers loadings.
Polymers 15 01224 g008
Figure 9. (a,b) The effect of filler shapes on thermal conductivity of composites and (c,d) the effect of interfacial thermal resistance on thermal conductivity of composites.
Polymers 15 01224 g009
Figure 10. (a,b) Tensile stress–strain curves of f-SiO2/SR and SiO2/SR composites and (c) tensile strength of SR and its composites filled with f-SiO2 and SiO2; (d) elongation break of SR and its composites filled with f-SiO2 and SiO2.
Polymers 15 01224 g010
Figure 11. (a,c) Compressive stress–strain curves of f-SiO2/SR and SiO2/SR composites; (b,d) compressive modulus and hardness of f-SiO2/SR and SiO2/SR composites.
Polymers 15 01224 g011
Table 1. The effect of TMDVS content on the BET surface area of f-SiO2.
BET Surface Area (m2/g)Mass Fraction of TMDVS Relative to SiO2 (wt.%)
020406080100
f-SiO2258.65192.76213.13218.27221.46227.29
Table 2. The power law parameters of f-SiO2/SR and SiO2/SR composites.
Samplesn k Samplesn k
SR0.9782.017///
2 wt.% f-SiO2/SR0.9752.8412 wt.% SiO2/SR0.9673.887
4 wt.% f-SiO2/SR0.9538.7634 wt.% SiO2/SR0.92112.365
6 wt.% f-SiO2/SR0.92420.1366 wt.% SiO2/SR0.88728.760
8 wt.% f-SiO2/SR0.88738.4568 wt.% SiO2/SR0.84243.566
10 wt.% f-SiO2/SR0.85349.45310 wt.% SiO2/SR0.80361.391
Table 3. Thermal stability of f-SiO2/SR composites.
SamplesT10
(°C)
Tmax
(°C)
R1000
(%)
SR483.4554.358.6
10 wt.% f-SiO2/SR518.3603.278.9
10 wt.% SiO2/SR507.9593.577.2
6 wt.% f-SiO2/SR492.1587.775.3
6 wt.% SiO2/SR500.3571.367.2
Table 4. Comparison of MC for SiO2/SR and f-SiO2/SR composites.
SamplesMC (g/mol)
02 wt.%4 wt.%6 wt.%8 wt.%10 wt.%
f-SiO2/SR215922782267237224512512
SiO2/SR215923672416256325982725
Disclaimer/Publisher’s Note: The statements, opinions and data contained in all publications are solely those of the individual author(s) and contributor(s) and not of MDPI and/or the editor(s). MDPI and/or the editor(s) disclaim responsibility for any injury to people or property resulting from any ideas, methods, instructions or products referred to in the content.