

Halochromic Silk Fabric as a Reversible pH-Sensor Based on a Novel 2-Aminoimidazole Azo Dye

 ,
, 
 , , , ,
  , ,
, ,  ,
,  ,
, 
Abstract
:
1. Introduction
2. Materials and Methods
2.1. Materials
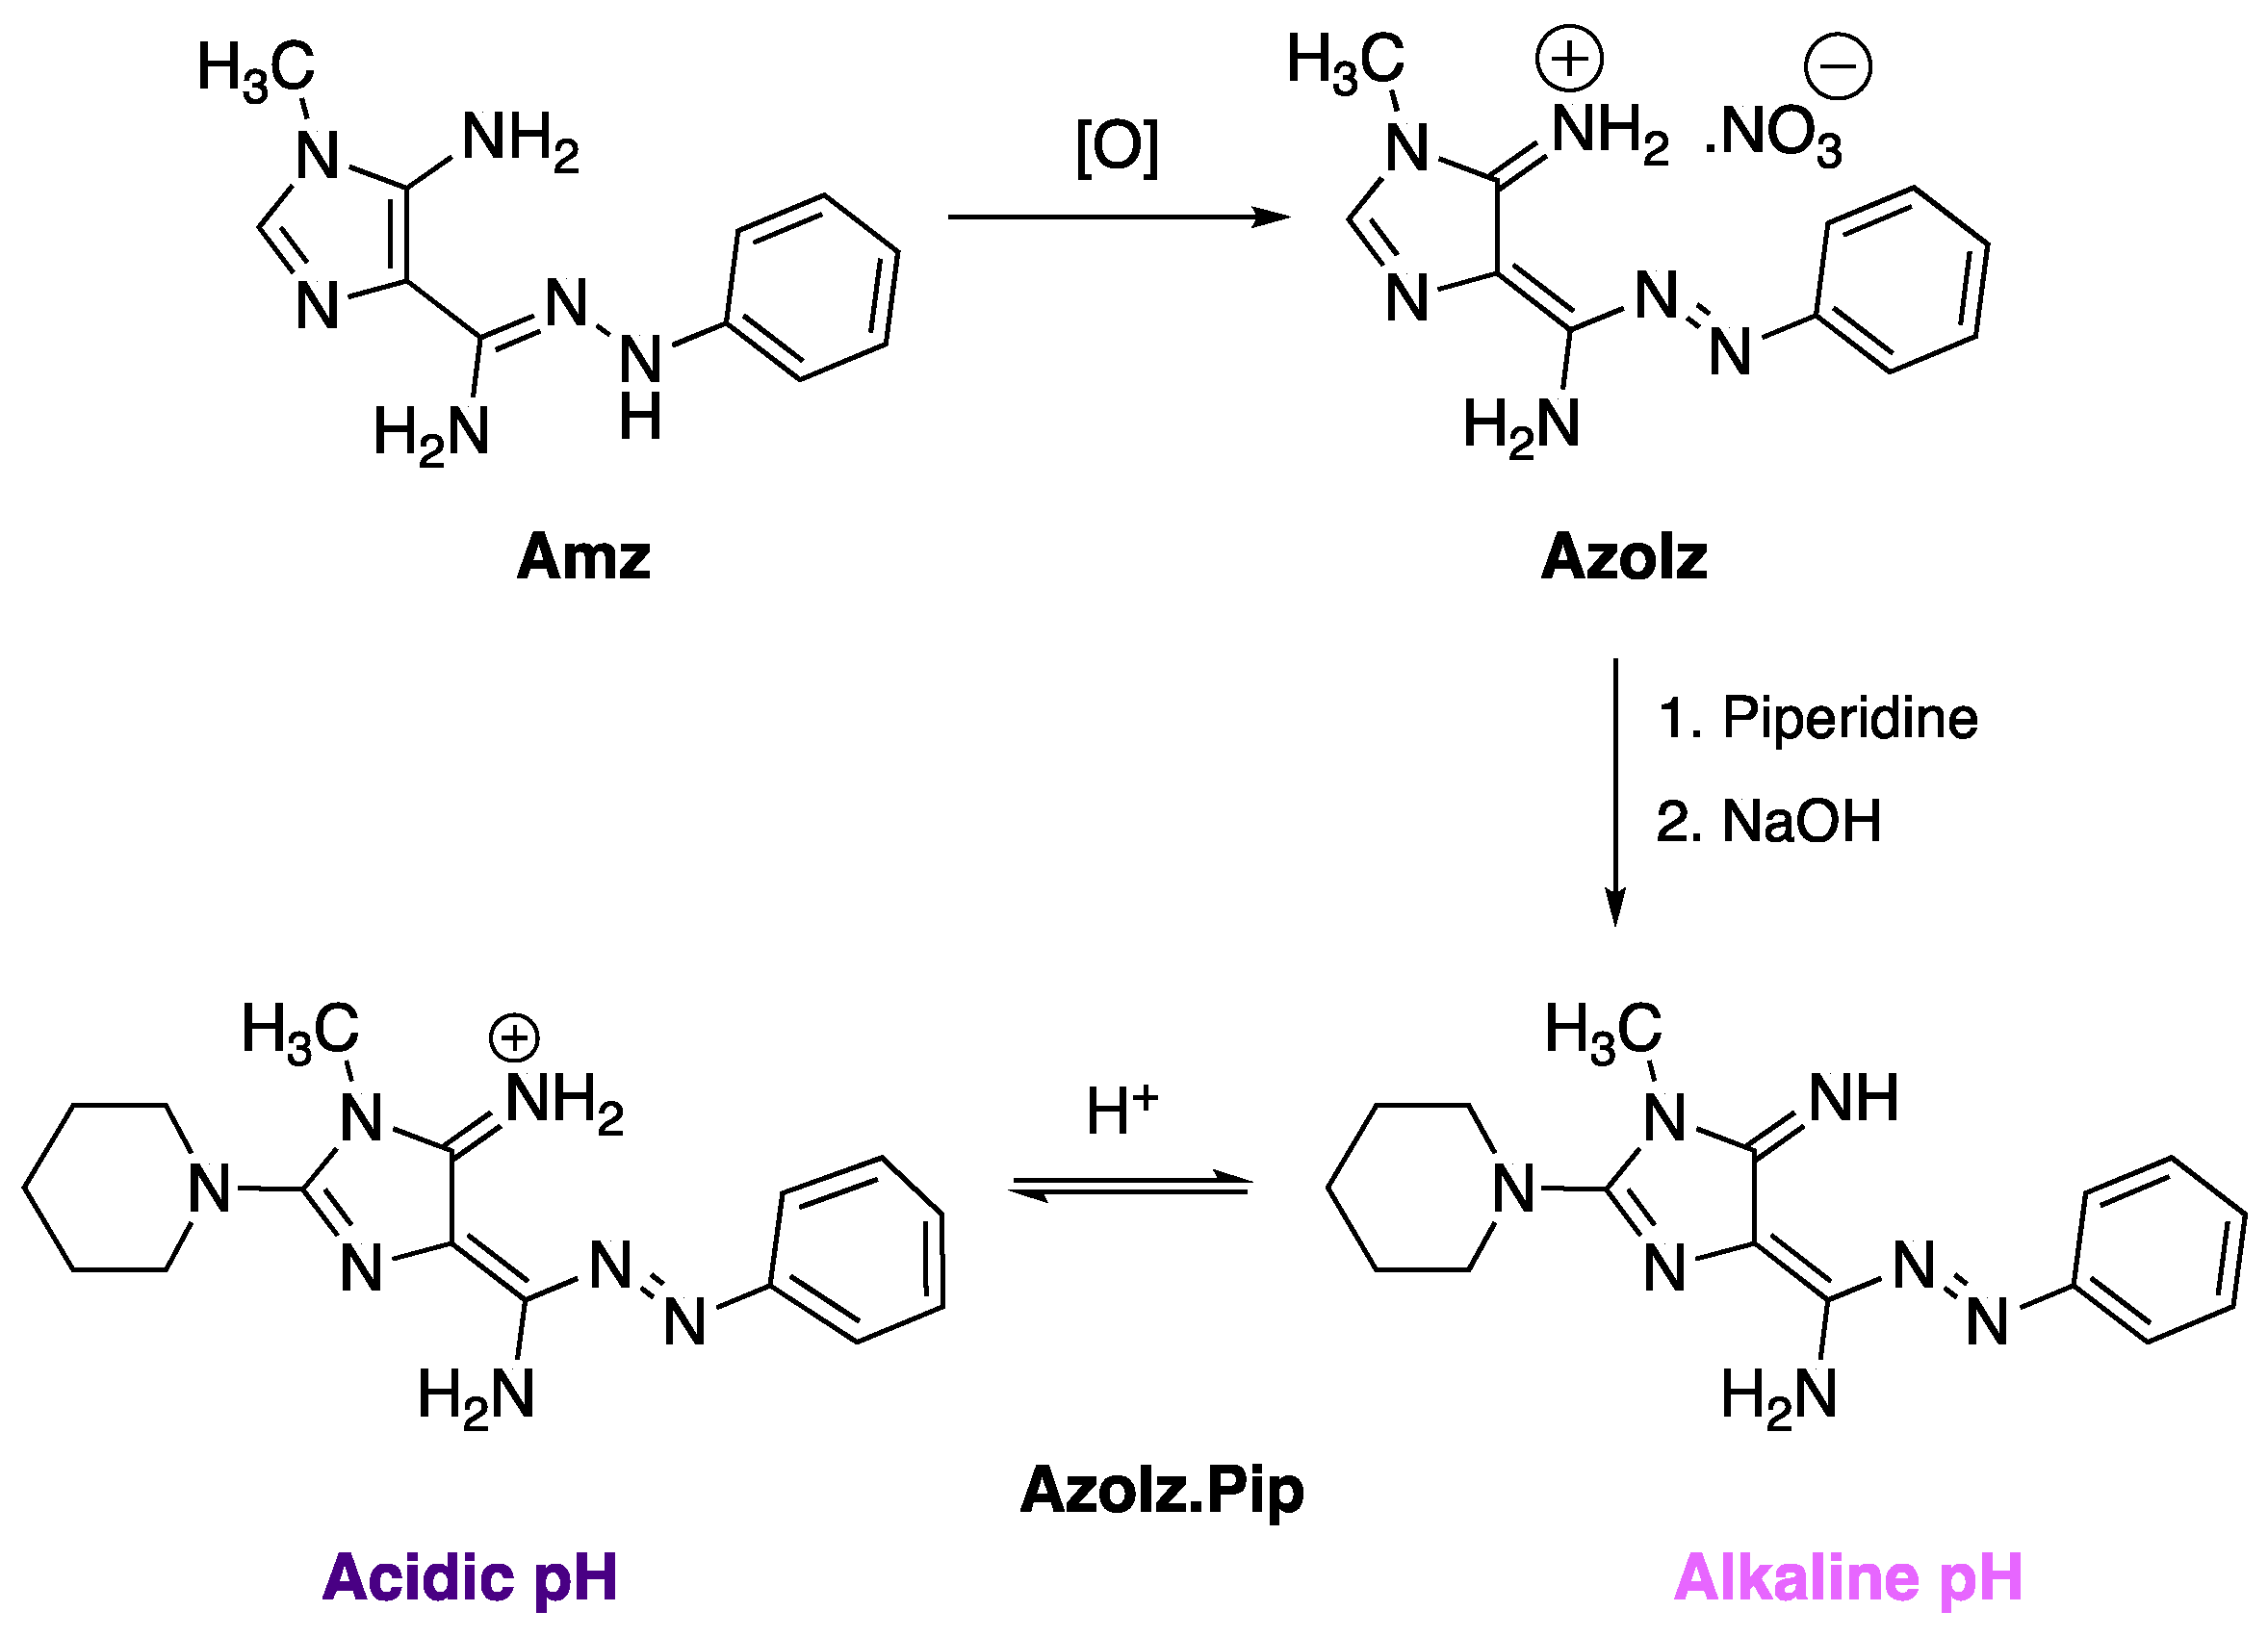
2.2. Synthesis and Characterization of the AzoIz.Pip Dye
2.3. Functionalization of Silk with AzoIz.Pip Dye under Different Conditions
2.4. pH and Color Measurements
2.5. Evaluation of the Halochromic Properties of the Dyed Silk Samples, Stability of the Dyes in Silk (Leaching and Color Change in Different Time Periods), and Reversibility of Color Change
2.6. Fastness Studies
2.6.1. Domestic and Commercial Washing
2.6.2. Rubbing (Dry and Wet)
2.6.3. Perspiration and Wound Exudate
2.7. X-ray Photoelectron Spectroscopy (XPS)
2.8. FTIR-ATR
2.9. Cytotoxicity of AzoIz.Pip-Dyed Silk Extracts
2.9.1. Neutral Red Uptake Assay
2.9.2. MTT Reduction Assay
2.9.3. Statistical Analysis
3. Results and Discussion
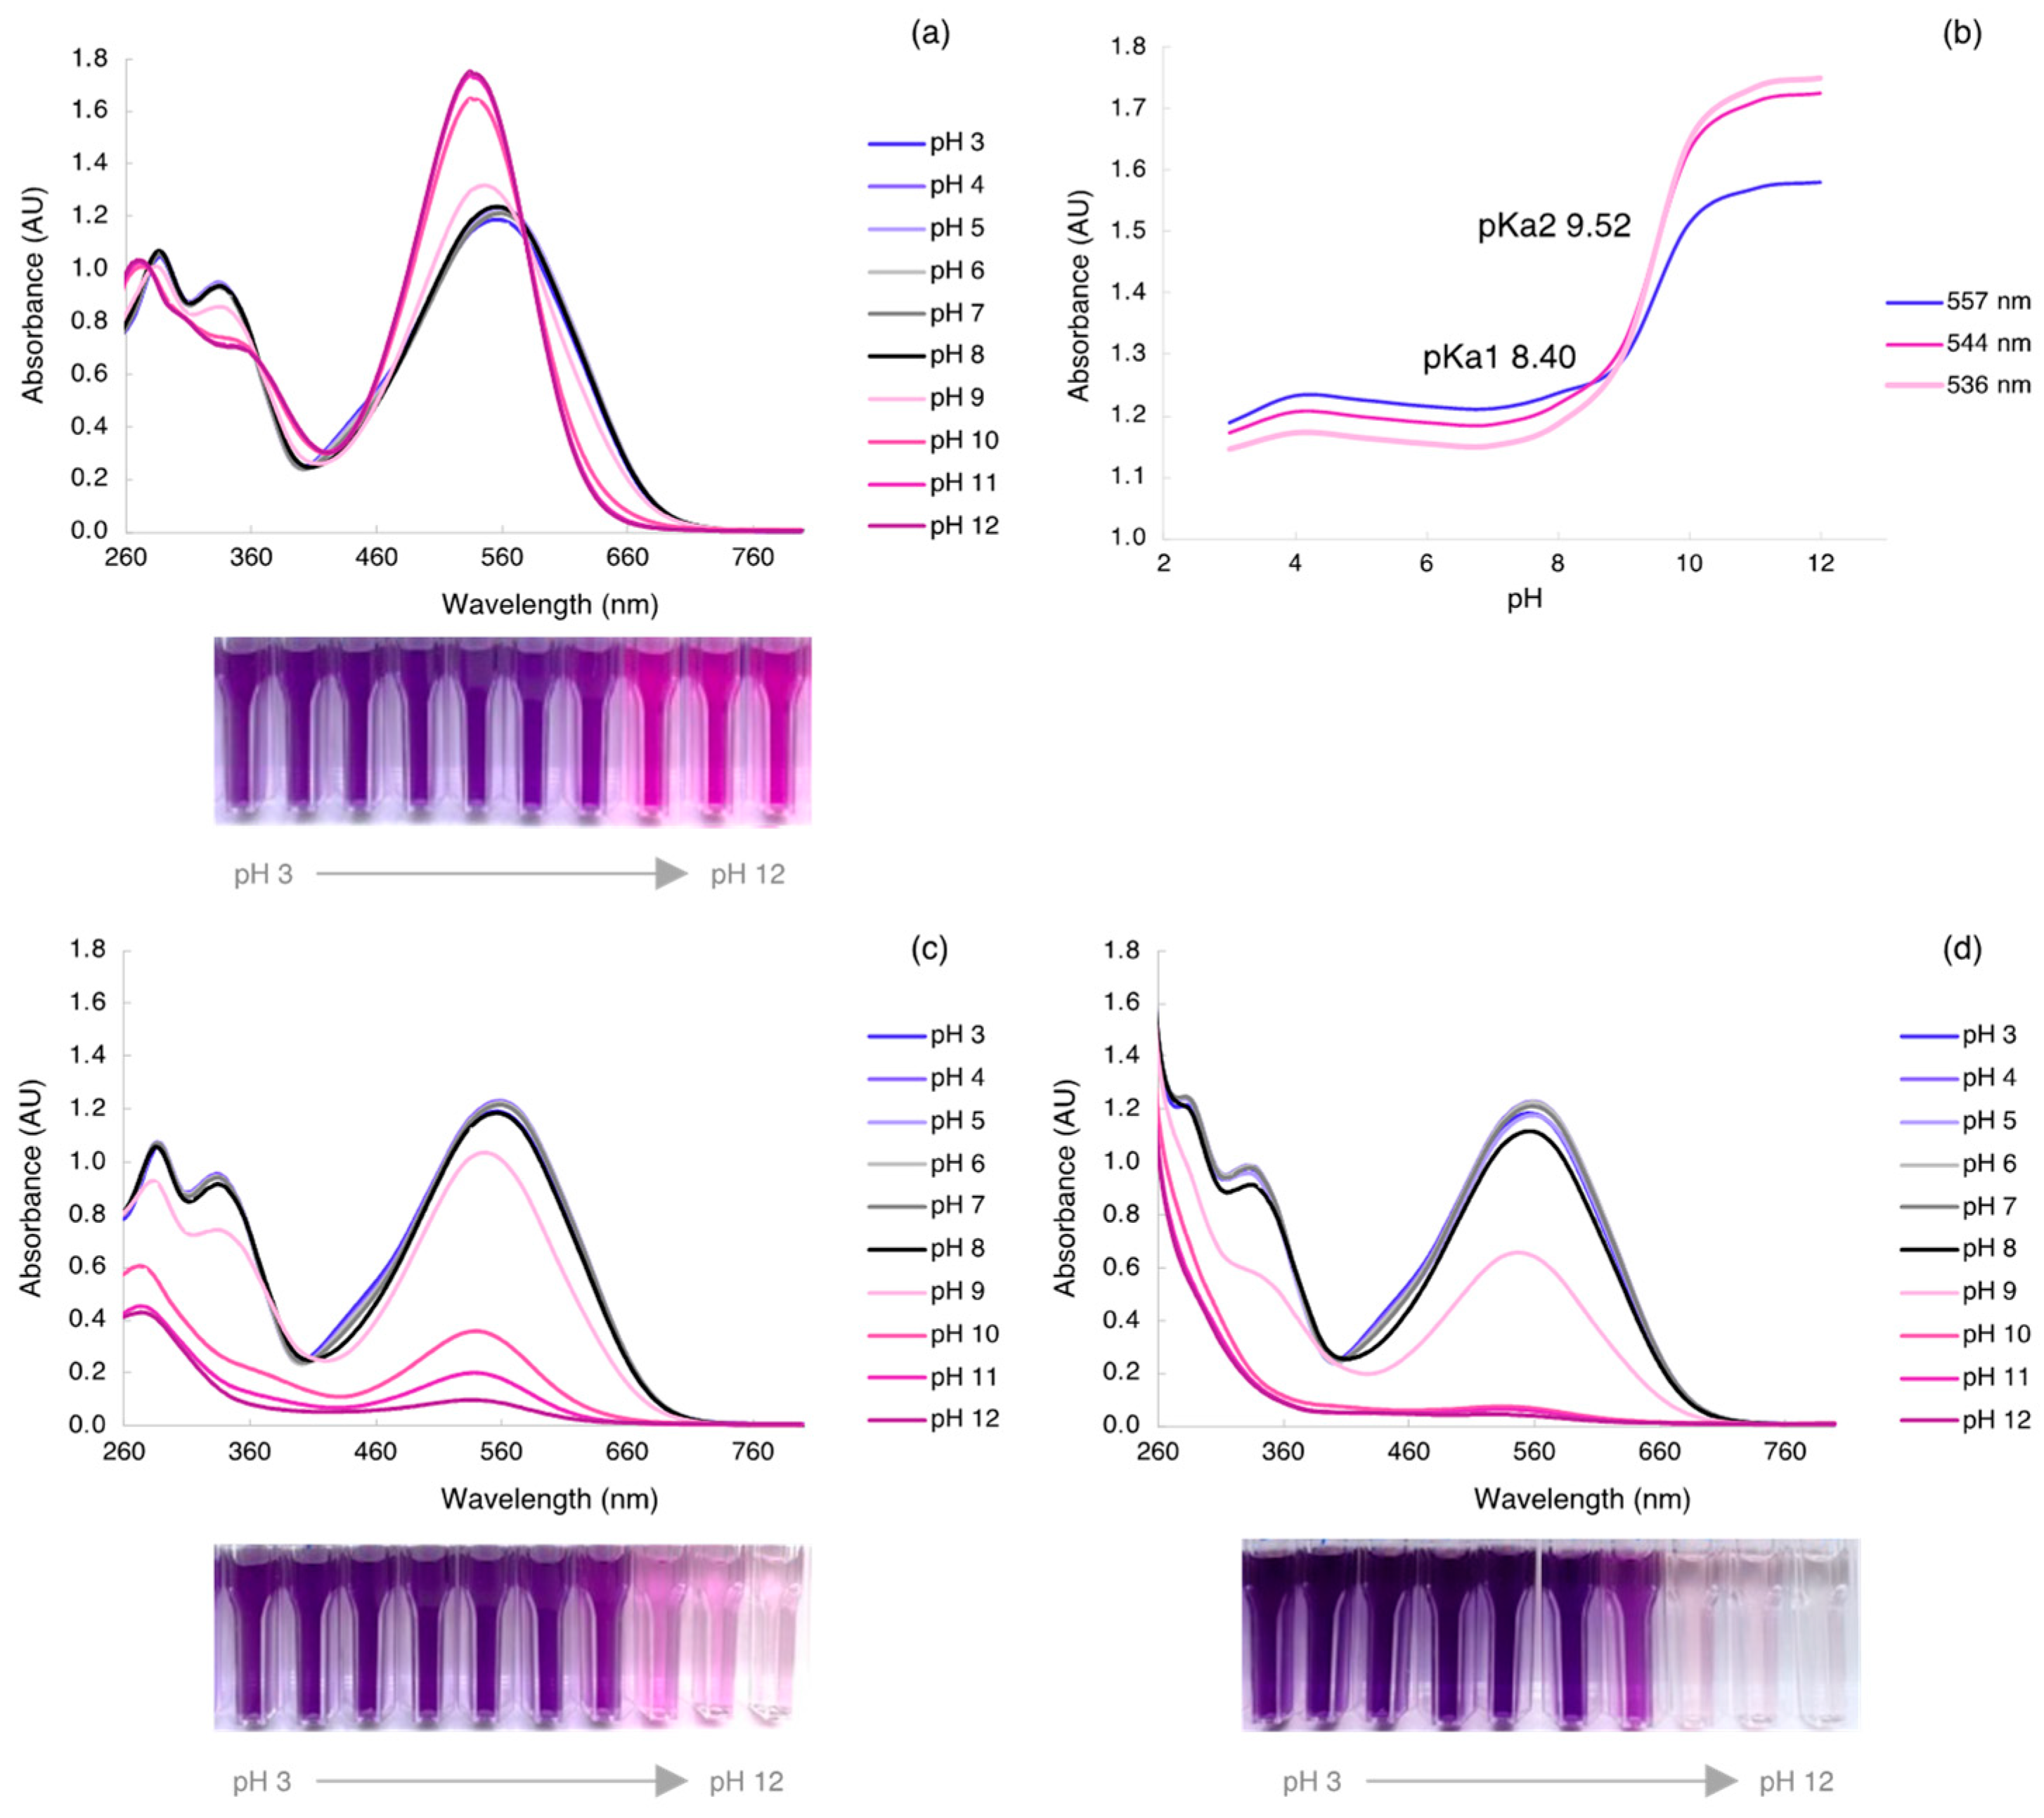
3.1. AzoIz.Pip Synthesis and Corresponding Halochromism in Aqueous Solution from pH 3 to 12
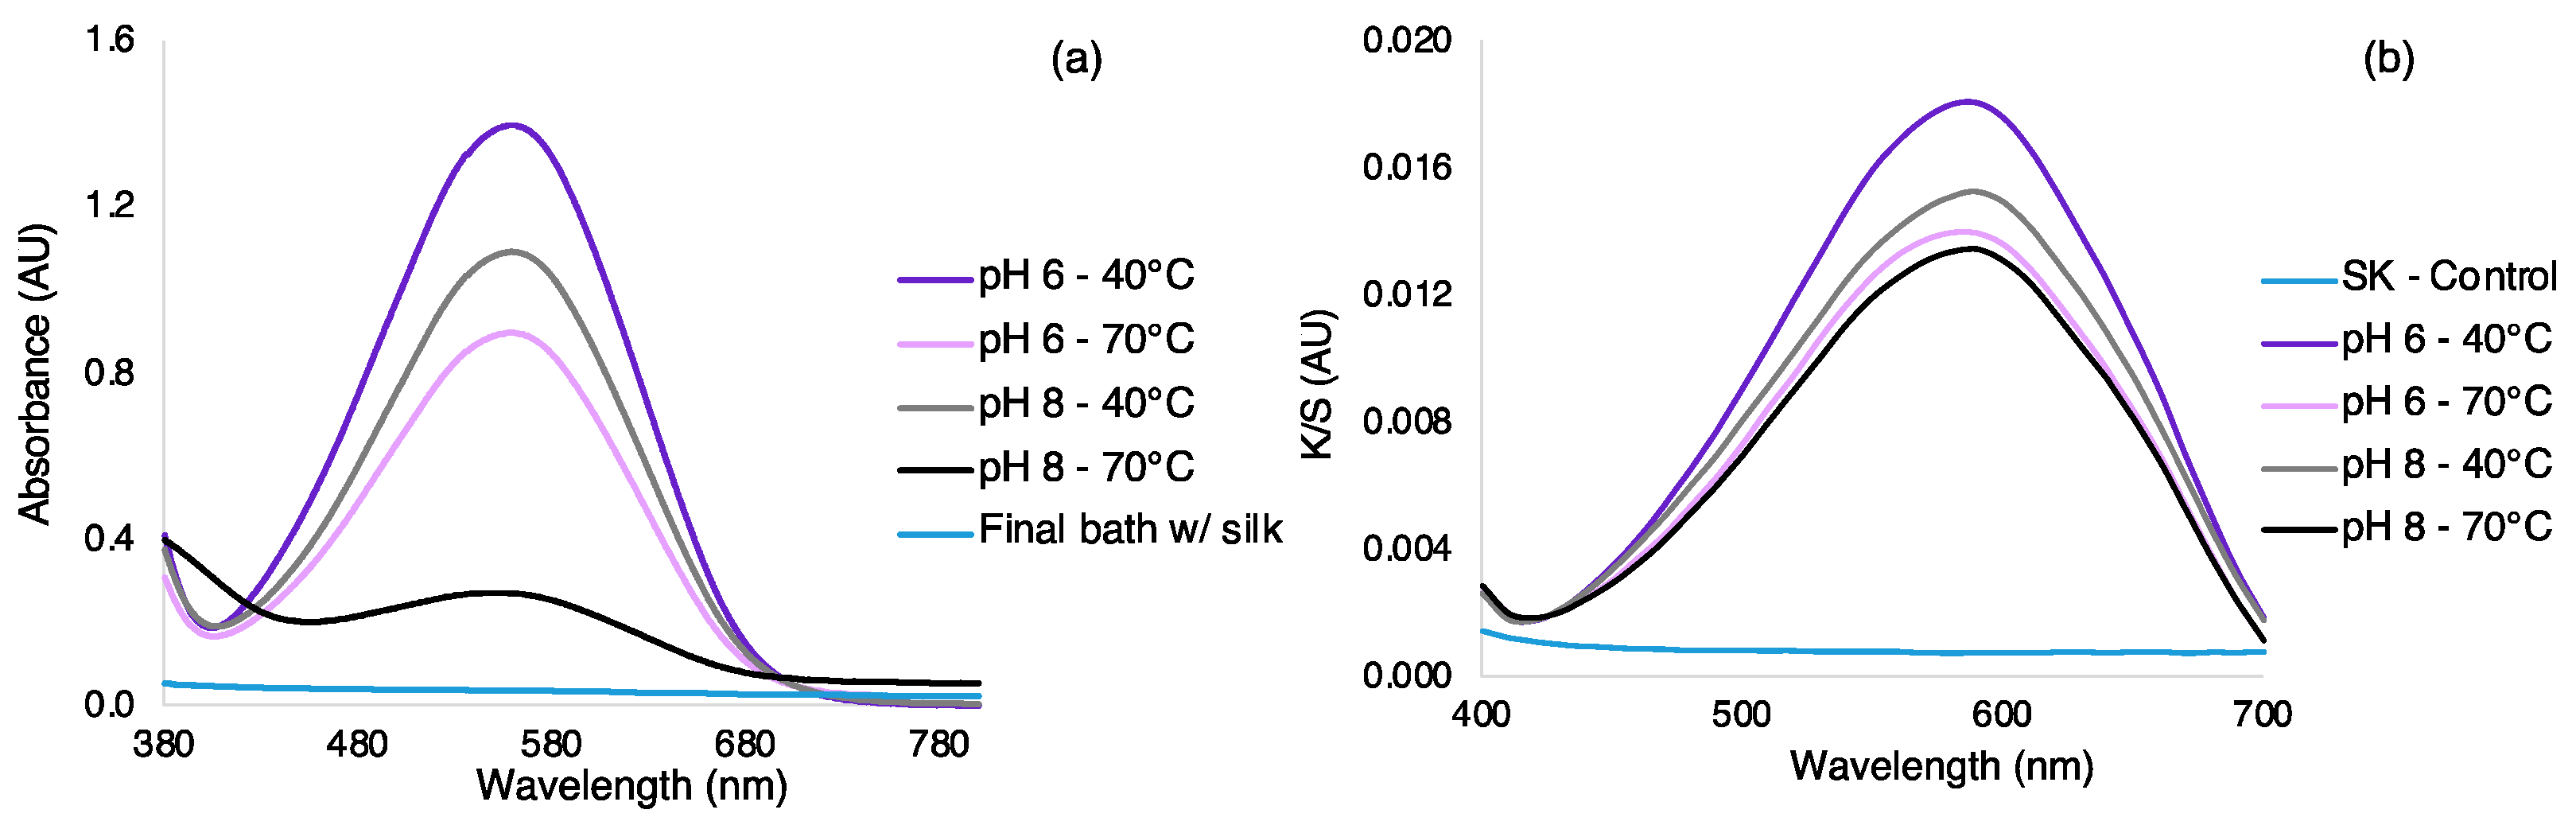
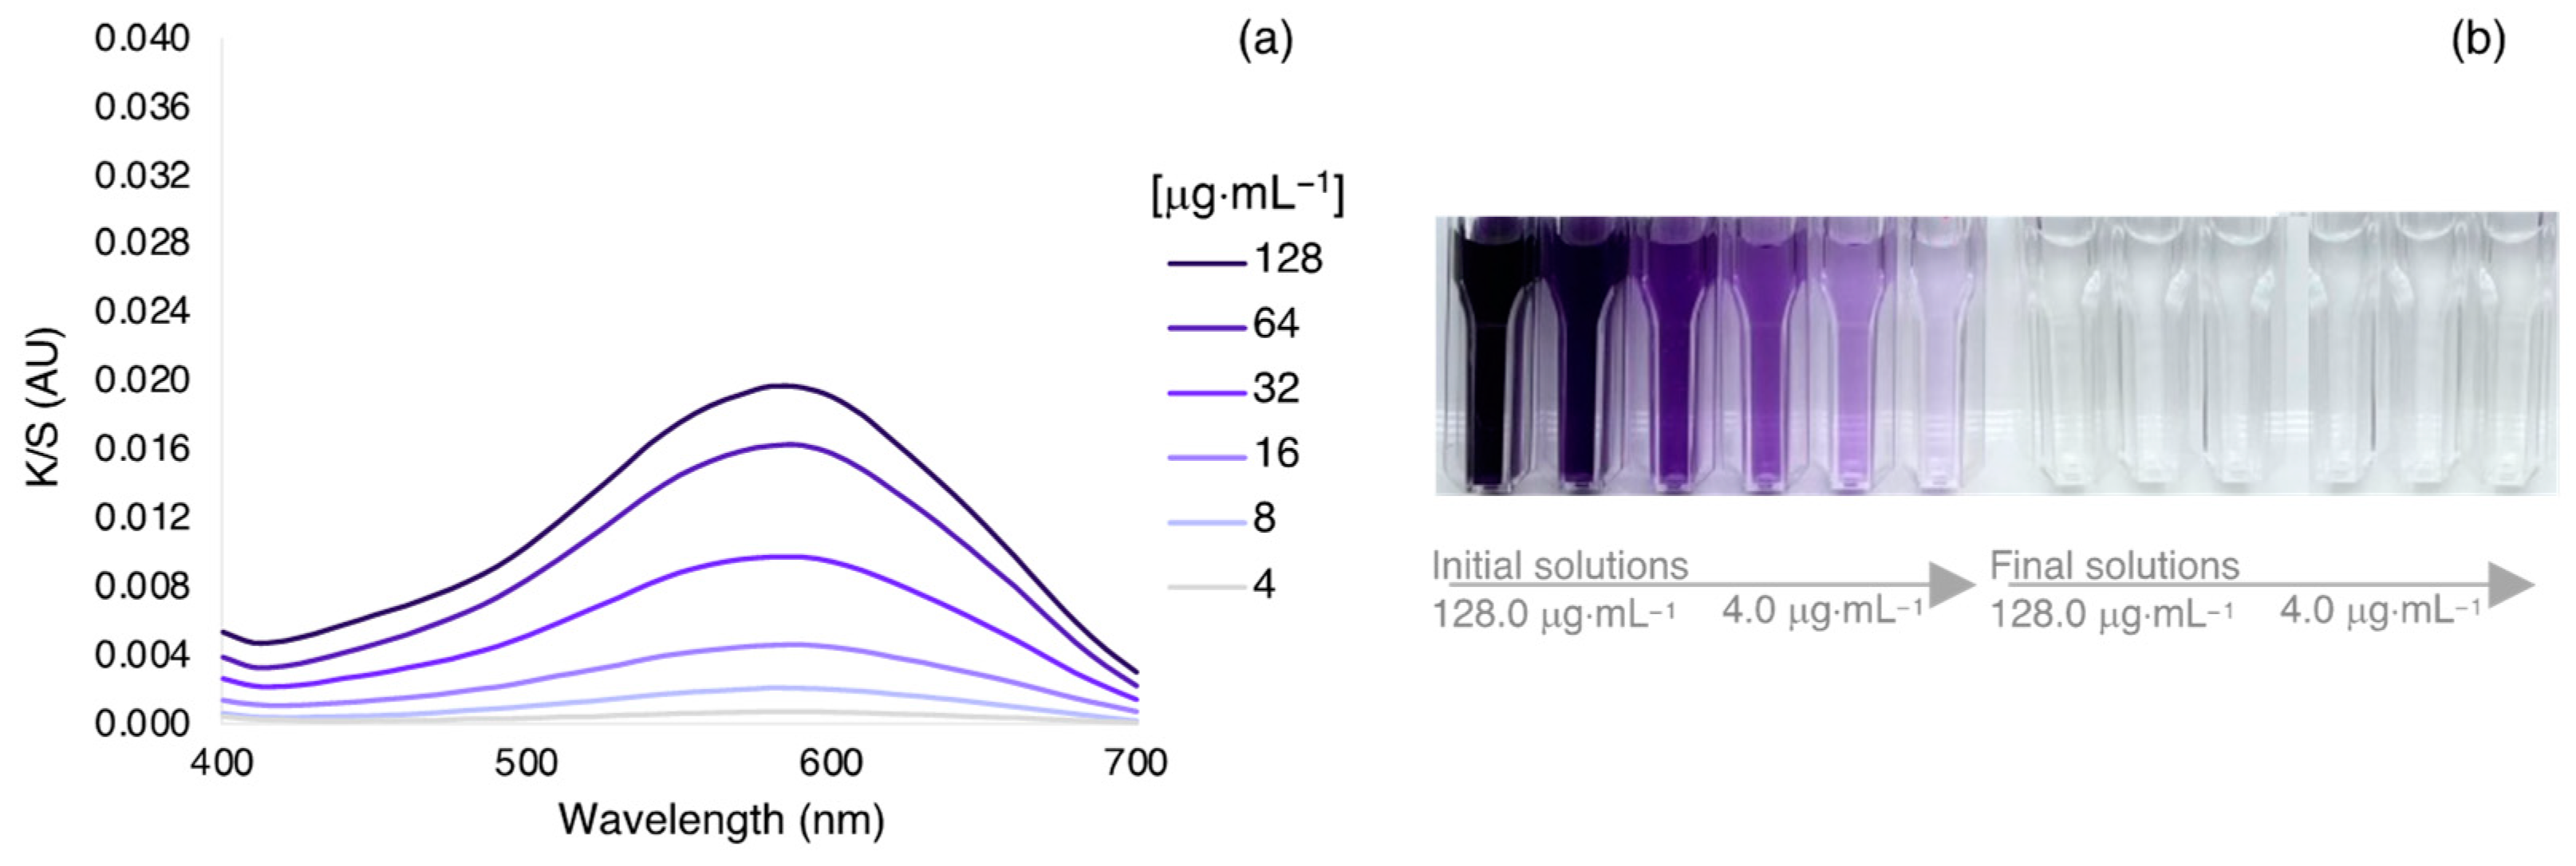
3.2. Dyeing Optimization of Silk by Exhaustion under Different Bath, Temperatures, and Dye Concentration
3.3. Evaluation of the Halochromic Properties of Dyed Silk
3.4. Stability of the Halochromic Dyes in Silk Fabric and Leaching Evaluation
3.5. Study of the Reversibility of the Color Change in the Silk Fabrics
3.6. Colorfastness Tests
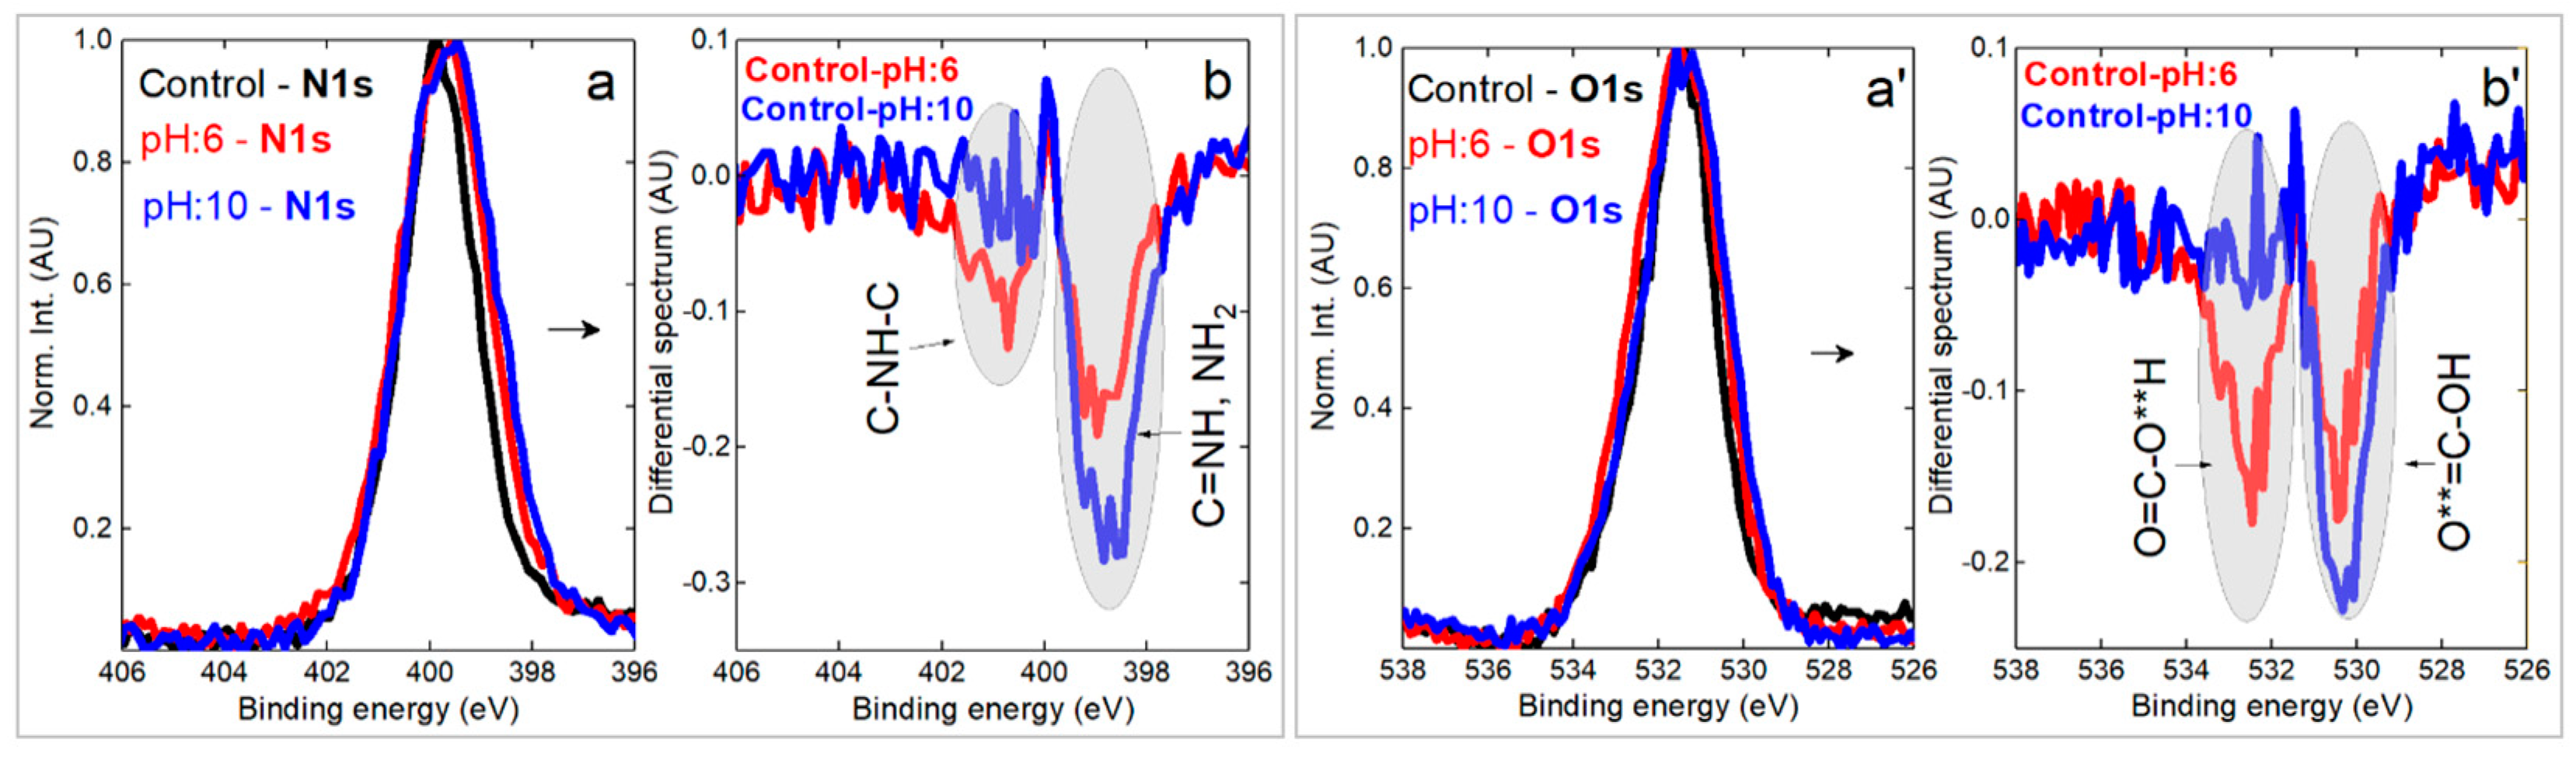
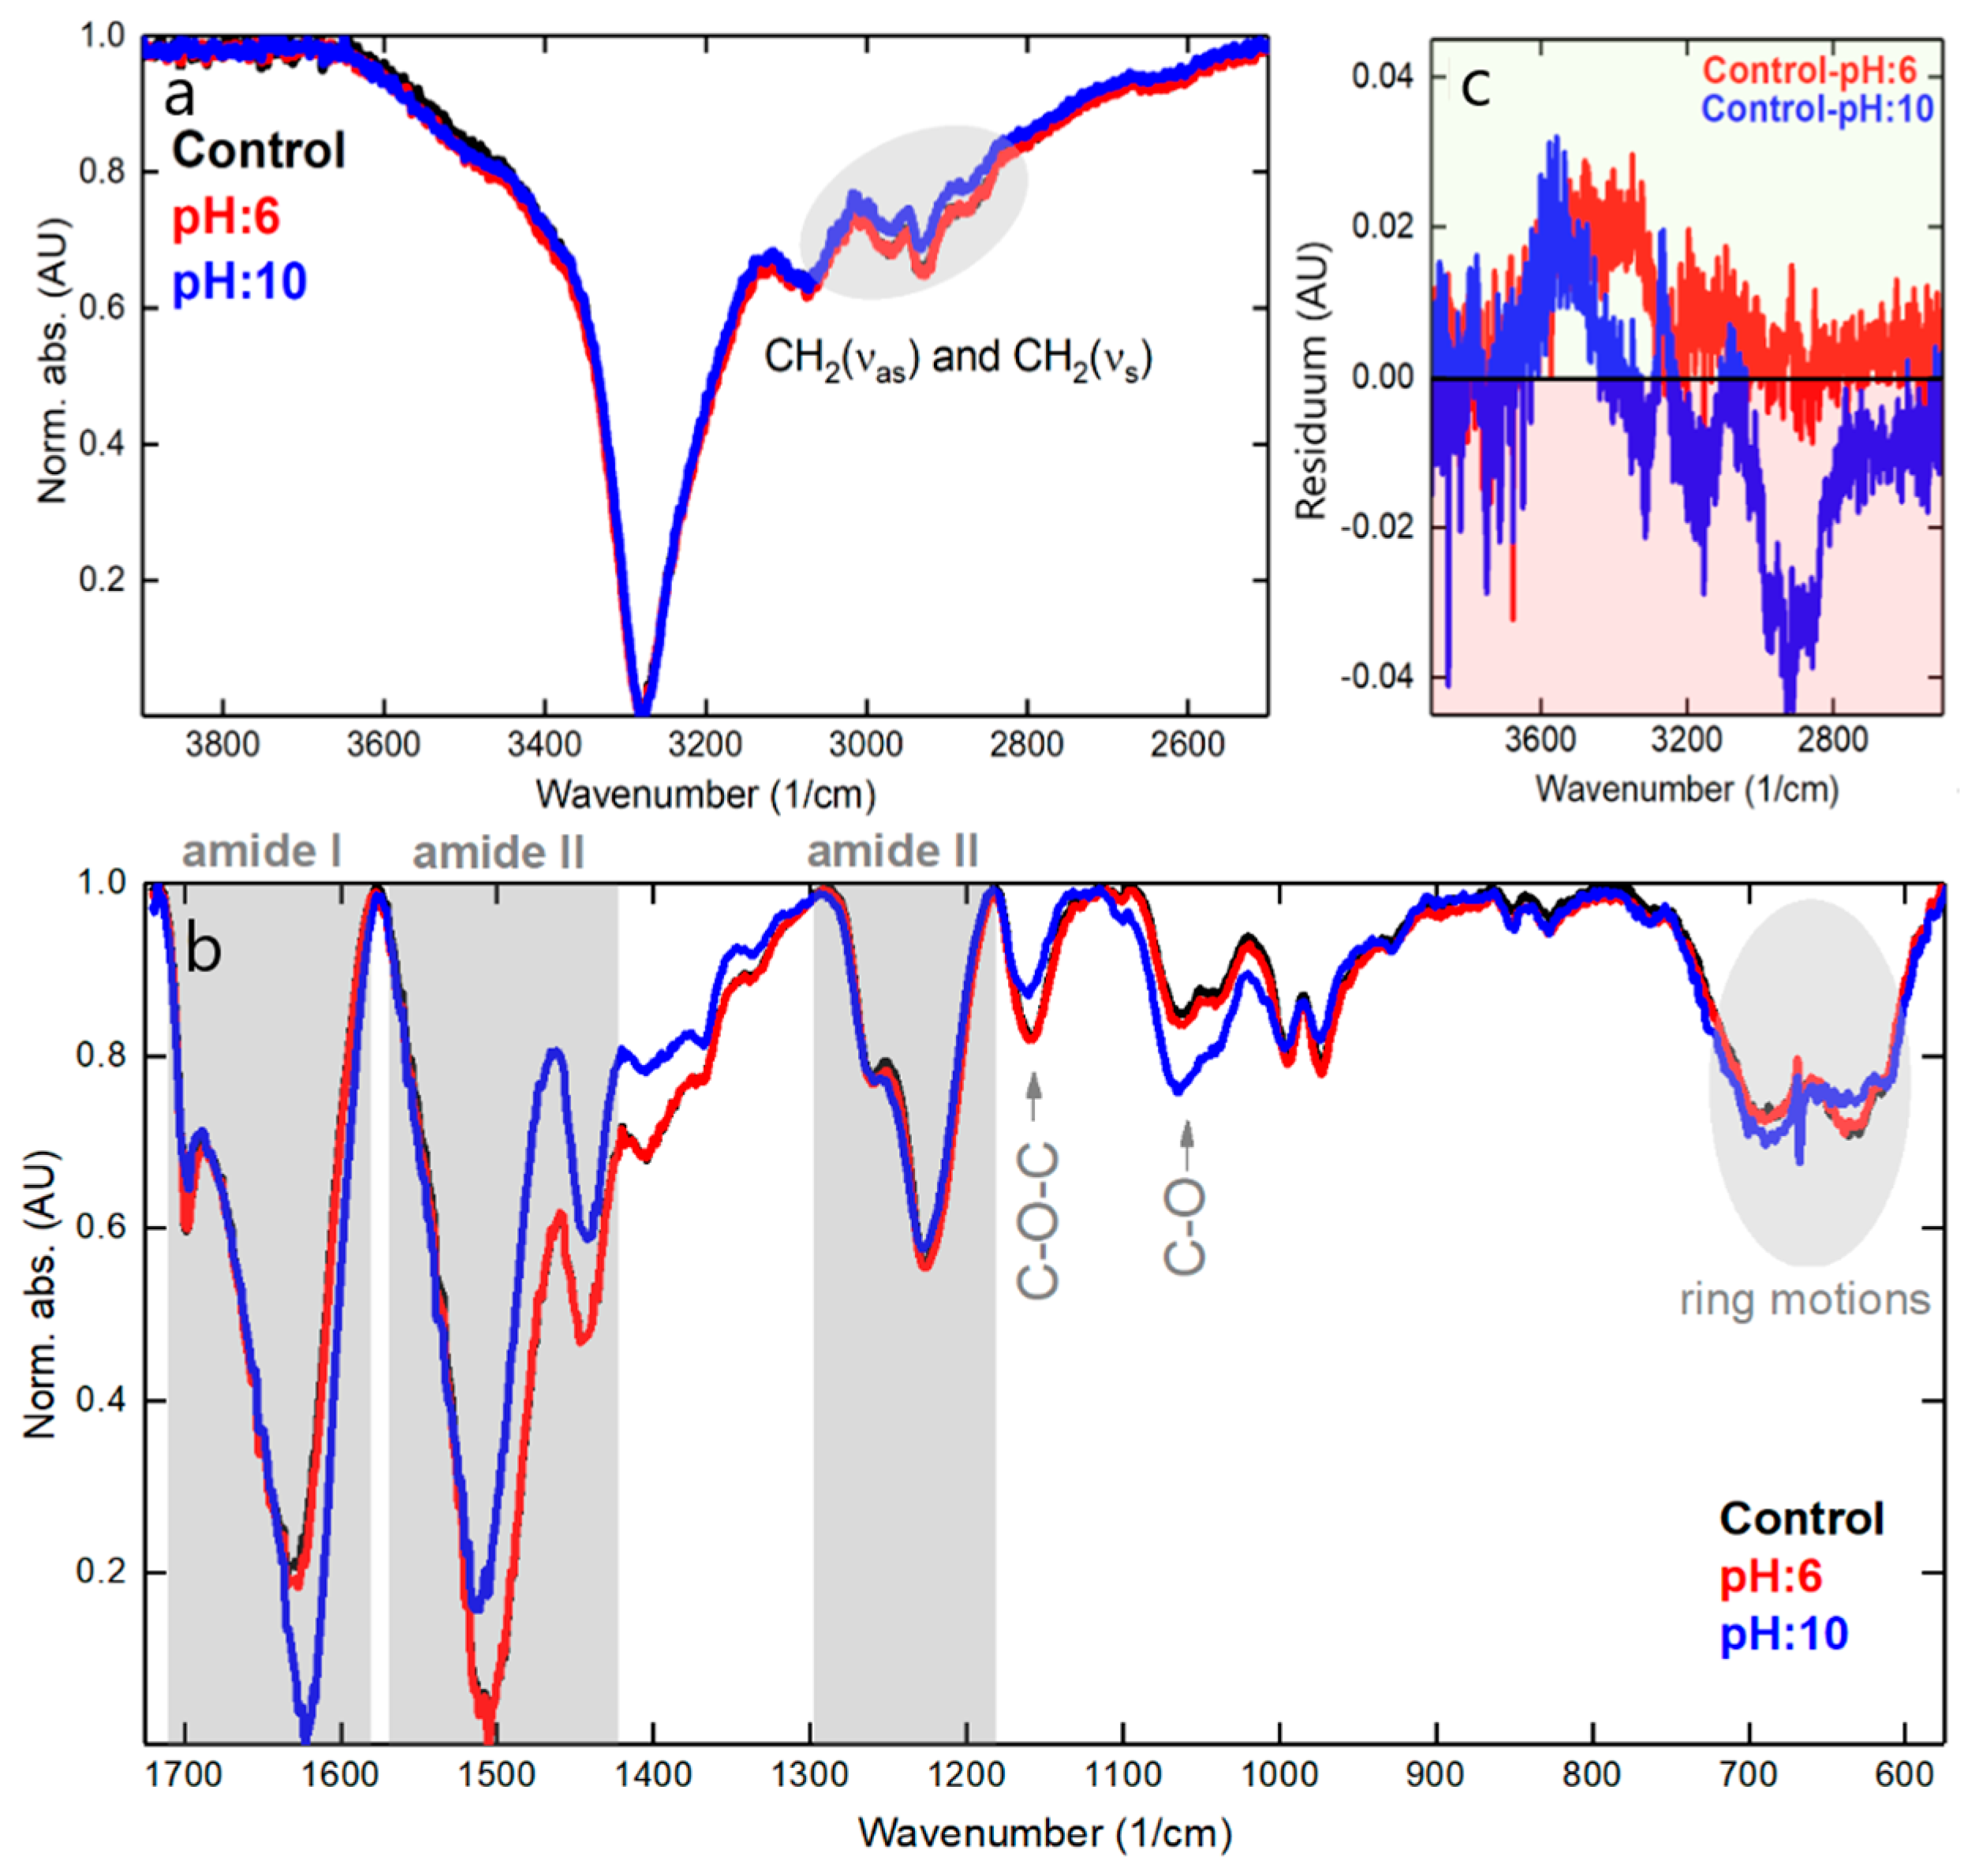
3.7. XPS Analysis
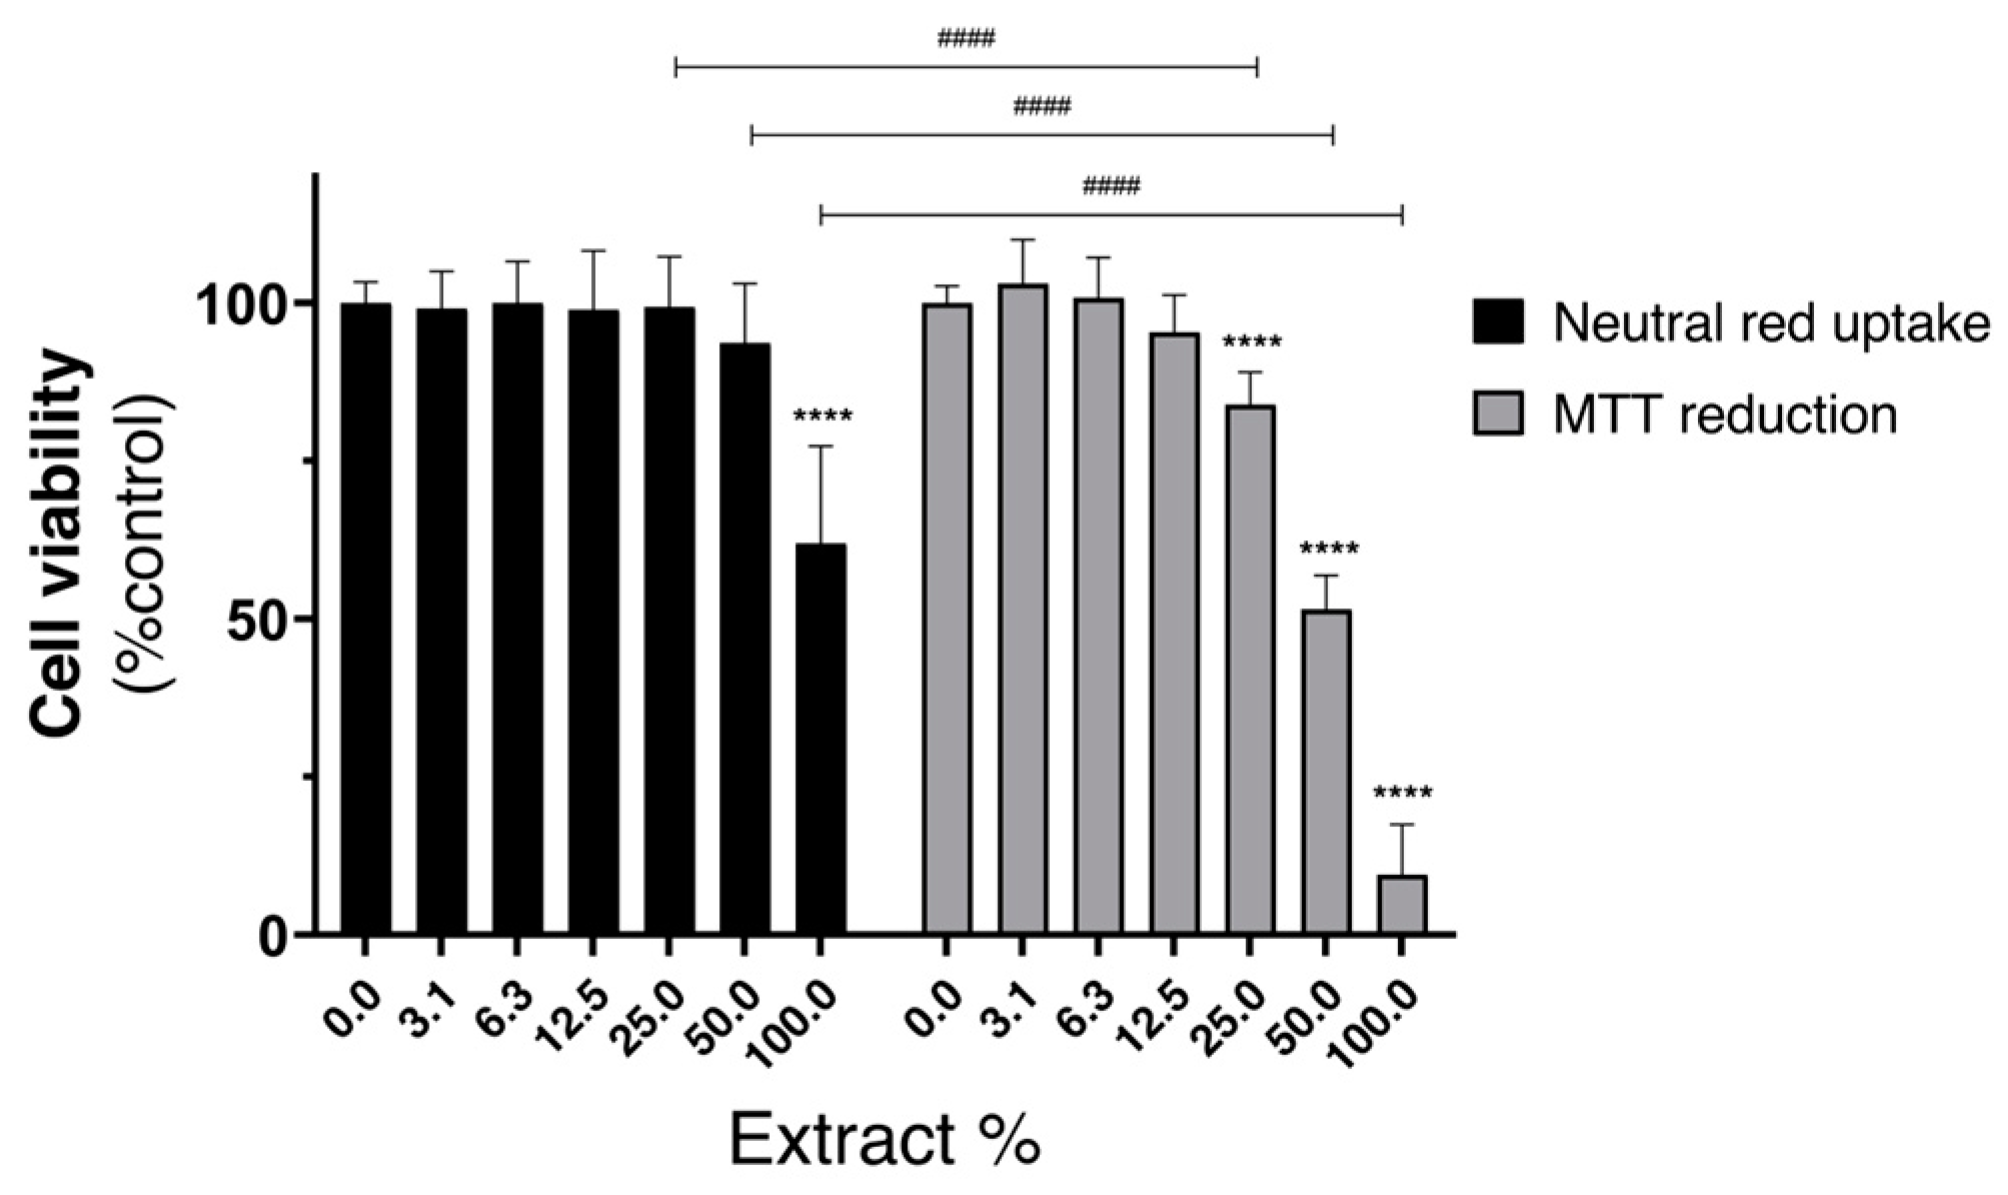
3.8. Cytotoxicity Evaluation of the Dyed Silk Extracts
4. Conclusions
Author Contributions
Funding
Institutional Review Board Statement
Data Availability Statement
Acknowledgments
Conflicts of Interest
References
- Zysset, C.; Kinkeldei, T.; Münzenrieder, N.; Tröster, G.; Cherenack, K. Fabrication technologies for the integration of thin-film electronics into smart textiles. In Multidisciplinary Know-How for Smart-Textiles Developers; Woodhead Publishing: Cambridge, UK, 2013; pp. 227–252. [Google Scholar] [CrossRef]
- Singha, K.; Kumar, J.; Pandit, P. Recent Advancements in Wearable & Smart Textiles: An Overview. Mater. Today Proc. 2019, 16, 1518–1523. [Google Scholar] [CrossRef]
- Basu, A.; Jain, S.; Khoiwal, V.S. Development of Smart Textiles for Medical Care. In Functional Textiles and Clothing; Springer: Singapore, 2019; pp. 101–106. [Google Scholar] [CrossRef]
- Kelly, F.M.; Cochrane, C. Color-Changing Textiles and Electrochromism. In Handbook of Smart Textiles; Springer: Singapore, 2015; pp. 859–889. [Google Scholar] [CrossRef]
- Steyaert, I.; Vancoillie, G.; Hoogenboom, R.; De Clerck, K. Dye immobilization in halochromic nanofibers through blend electrospinning of a dye-containing copolymer and polyamide-6. Polym. Chem. 2015, 6, 2685–2694. [Google Scholar] [CrossRef]
- Tang, B.; He, Y.; Liu, J.; Zhang, J.; Li, J.; Zhou, J.; Ye, Y.; Wang, J.; Wang, X. Kinetic investigation into pH-dependent color of anthocyanin and its sensing performance. Dye. Pigment. 2019, 170, 107643. [Google Scholar] [CrossRef]
- Van der Schueren, L.; De Meyer, T.; Steyaert, I.; Ceylan, Ö.; Hemelsoet, K.; Van Speybroeck, V.; De Clerck, K. Polycaprolactone and polycaprolactone/chitosan nanofibres functionalised with the pH-sensitive dye Nitrazine Yellow. Carbohydr. Polym. 2013, 91, 284–293. [Google Scholar] [CrossRef] [PubMed] [Green Version]
- Trovato, V.; Sfameni, S.; Rando, G.; Rosace, G.; Libertino, S.; Ferri, A.; Plutino, M.R. A Review of Stimuli-Responsive Smart Materials for Wearable Technology in Healthcare: Retrospective, Perspective, and Prospective. Molecules 2022, 27, 5709. [Google Scholar] [CrossRef] [PubMed]
- Pakolpakçıl, A.; Osman, B.; Özer, E.T.; Şahan, Y.; Becerir, B.; Göktalay, G.; Karaca, E. Halochromic composite nanofibrous mat for wound healing monitoring. Mater. Res. Express 2020, 6, 1250c3. [Google Scholar] [CrossRef]
- Schaude, C.; Fröhlich, E.; Meindl, C.; Attard, J.; Binder, B.; Mohr, G. The Development of Indicator Cotton Swabs for the Detection of pH in Wounds. Sensors 2017, 17, 1365. [Google Scholar] [CrossRef] [Green Version]
- Rosace, G.; Guido, E.; Colleoni, C.; Brucale, M.; Piperopoulos, E.; Milone, C.; Plutino, M.R. Halochromic resorufin-GPTMS hybrid sol-gel: Chemical-physical properties and use as pH sensor fabric coating. Sens. Actuators B Chem. 2017, 241, 85–95. [Google Scholar] [CrossRef]
- Pal, A.; Nadiger, V.G.; Goswami, D.; Martinez, R.V. Conformal, waterproof electronic decals for wireless monitoring of sweat and vaginal pH at the point-of-care. Biosens. Bioelectron. 2020, 160, 112206. [Google Scholar] [CrossRef]
- Khattab, T.A.; Fouda, M.M.G.; Rehan, M.; Okla, M.K.; Alamri, S.A.; Alaraidh, I.A.; Al-ghamdi, A.A.; Soufan, W.H.; Abdelsalam, E.M.; Allam, A.A. Novel halochromic cellulose nanowhiskers from rice straw: Visual detection of urea. Carbohydr. Polym. 2020, 231, 115740. [Google Scholar] [CrossRef]
- Ferrara, M.; Bengisu, M. Materials that Change Color. In Materials That Change Color; Springer: Cham, Switzerland, 2014; pp. 9–60. [Google Scholar] [CrossRef]
- Aghaei, Z.; Ghorani, B.; Emadzadeh, B.; Kadkhodaee, R.; Tucker, N. Protein-based halochromic electrospun nanosensor for monitoring trout fish freshness. Food Control 2020, 111, 107065. [Google Scholar] [CrossRef]
- Yildiz, E.; Sumnu, G.; Kahyaoglu, L.N. Monitoring freshness of chicken breast by using natural halochromic curcumin loaded chitosan/PEO nanofibers as an intelligent package. Int. J. Biol. Macromol. 2021, 170, 437–446. [Google Scholar] [CrossRef] [PubMed]
- Miranda, K.W.E.; Natarelli, C.V.L.; Thomazi, A.C.; Ferreira, G.M.D.; Frota, M.M.; Bastos, M.d.S.R.; Mattoso, L.H.C.; Oliveira, J.E. Halochromic Polystyrene Nanofibers Obtained by Solution Blow Spinning for Wine pH Sensing. Sensors 2020, 20, 417. [Google Scholar] [CrossRef] [PubMed] [Green Version]
- Van der Schueren, L.; De Clerck, K. Coloration and application of pH-sensitive dyes on textile materials. Color. Technol. 2012, 128, 82–90. [Google Scholar] [CrossRef]
- Atav, R.; Akkuş, E.; Ergünay, U. Investigation of the Dyeability of Cotton Fabrics with a Halochromic Dye According to Exhaust and Padding Methods. J. Nat. Fibers 2021, 19, 9125–9138. [Google Scholar] [CrossRef]
- Khan, S.A.; Hussain, D.; Khan, T.A. Recent Advances in Synthetic Dyes. In Innovative and Emerging Technologies for Textile Dyeing and Finishing; John Wiley & Sons: Hoboken, NJ, USA, 2021; pp. 91–111. [Google Scholar]
- Butnaru, I.; Sava, I.; Damaceanu, M.-D. Exploring the impact of triphenylmethane incorporation on physical properties of polyimides with emphasis on optical and halochromic behaviour. Polymer 2020, 200, 122621. [Google Scholar] [CrossRef]
- Kalay, S.; Stetsyshyn, Y.; Donchak, V.; Harhay, K.; Lishchynskyi, O.; Ohar, H.; Panchenko, Y.; Voronov, S.; Çulha, M. pH-Controlled fluorescence switching in water-dispersed polymer brushes grafted to modified boron nitride nanotubes for cellular imaging. Beilstein J. Nanotechnol. 2019, 10, 2428–2439. [Google Scholar] [CrossRef]
- Mohamad, F.; Tanner, M.G.; Choudhury, D.; Choudhary, T.R.; Wood, H.A.C.; Harrington, K.; Bradley, M. Controlled core-to-core photo-polymerisation—Fabrication of an optical fibre-based pH sensor. Analyst 2017, 142, 3569–3572. [Google Scholar] [CrossRef] [Green Version]
- Van der Schueren, L.; de Clerck, K. Halochromic Textile Materials as Innovative pH-Sensors. In Smart and Interactive Textiles; Trans Tech Publications Ltd.: Zurich, Switzerland, 2012; pp. 47–52. [Google Scholar]
- Holland, C.; Numata, K.; Rnjak-Kovacina, J.; Seib, F.P. The Biomedical Use of Silk: Past, Present, Future. Adv. Healthc. Mater. 2018, 8, e1800465. [Google Scholar] [CrossRef] [Green Version]
- Patil, P.P.; Reagan, M.R.; Bohara, R.A. Silk fibroin and silk-based biomaterial derivatives for ideal wound dressings. Int. J. Biol. Macromol. 2020, 164, 4613–4627. [Google Scholar] [CrossRef]
- Gholipourmalekabadi, M.; Sapru, S.; Samadikuchaksaraei, A.; Reis, R.L.; Kaplan, D.L.; Kundu, S.C. Silk fibroin for skin injury repair: Where do things stand? Adv. Drug Deliv. Rev. 2020, 153, 28–53. [Google Scholar] [CrossRef] [PubMed]
- Chouhan, D.; Mandal, B.B. Silk biomaterials in wound healing and skin regeneration therapeutics: From bench to bedside. Acta Biomater. 2020, 103, 24–51. [Google Scholar] [CrossRef] [PubMed]
- Sun, W.; Gregory, D.A.; Tomeh, M.A.; Zhao, X. Silk Fibroin as a Functional Biomaterial for Tissue Engineering. Int. J. Mol. Sci. 2021, 22, 1499. [Google Scholar] [CrossRef]
- Wen, D.-L.; Sun, D.-H.; Huang, P.; Huang, W.; Su, M.; Wang, Y.; Han, M.-D.; Kim, B.; Brugger, J.; Zhang, H.-X.; et al. Recent progress in silk fibroin-based flexible electronics. Microsyst. Nanoeng. 2021, 7, 35. [Google Scholar] [CrossRef] [PubMed]
- Dantas, D.; Ribeiro, A.I.; Carvalho, F.; Gil-Martins, E.; Silva, R.; Remião, F.; Zille, A.; Cerqueira, F.; Pinto, E.; Dias, A.M. Red-shifted and pH-Responsive Imidazole-based Azo Dyes with Potent Antimicrobial Activity. Chem. Commun. 2023, 59, 2791–2794. [Google Scholar] [CrossRef] [PubMed]
- Alves, M.J.; Booth, B.L.; Proenç, M.F.J.R.P. Synthesis of 5-amino-4-(cyanoformimidoyl)-1H-imidazole: A reactive intermediate for the synthesis of 6-carbamoyl-1,2-dihydropurines and 6-carbamoylpurines. J. Chem. Soc. Perkin Trans. 1 1990, 6, 1705–1712. [Google Scholar] [CrossRef]
- Ribeiro, A.I.; Gabriel, C.; Cerqueira, F.; Maia, M.; Pinto, E.; Sousa, J.C.; Medeiros, R.; Proença, M.F.; Dias, A.M. Synthesis and antimicrobial activity of novel 5-aminoimidazole-4-carboxamidrazones. Bioorg. Med. Chem. Lett. 2014, 24, 4699–4702. [Google Scholar] [CrossRef]
- Ribeiro, A.I.; Vieira, B.; Dantas, D.; Silva, B.; Pinto, E.; Cerqueira, F.; Silva, R.; Remião, F.; Padrão, J.; Dias, A.M.; et al. Synergistic Antimicrobial Activity of Silver Nanoparticles with an Emergent Class of Azoimidazoles. Pharmaceutics 2023, 15, 926. [Google Scholar] [CrossRef]
- Salgado, L.E.V.; Vargas-Hernández, C. Spectrophotometric Determination of the pKa, Isosbestic Point and Equation of Absorbance vs. pH for a Universal pH Indicator. Am. J. Anal. Chem. 2014, 05, 1290–1301. [Google Scholar] [CrossRef] [Green Version]
- Mongay, C.; Cerdà, V. A Britton-Robinson buffer of known ionic strength. Ann. Chim. 1974, 64, 409–412. [Google Scholar]
- Oates, A. Microbial Ecology of Chronic Wounds; University of Manchester: Manchester, UK, 2011. [Google Scholar]
- Van der Schueren, L.; Hemelsoet, K.; Van Speybroeck, V.; De Clerck, K. The influence of a polyamide matrix on the halochromic behaviour of the pH-sensitive azo dye Nitrazine Yellow. Dye. Pigment. 2012, 94, 443–451. [Google Scholar] [CrossRef]
- Bhate, P.M.; Devi, R.V.; Dugane, R.; Hande, P.R.; Shaikh, L.; Vaidya, S.; Masand, S. A novel reactive dye system based on diazonium salts. Dye. Pigment. 2017, 145, 208–215. [Google Scholar] [CrossRef]
- Ribeiro, A.I.; Shvalya, V.; Cvelbar, U.; Silva, R.; Marques-Oliveira, R.; Remião, F.; Felgueiras, H.P.; Padrão, J.; Zille, A. Stabilization of Silver Nanoparticles on Polyester Fabric Using Organo-Matrices for Controlled Antimicrobial Performance. Polymers 2022, 14, 1138. [Google Scholar] [CrossRef]
- Cerqueira, F.; Maia, M.; Gabriel, C.; Medeiros, R.; Cravo, S.; Ribeiro, A.I.; Dantas, D.; Dias, A.M.; Saraiva, L.; Raimundo, L.; et al. Mechanism of Antifungal Activity by 5-Aminoimidazole-4-Carbohydrazonamide Derivatives against Candida albicans and Candida krusei. Antibiotics 2021, 10, 183. [Google Scholar] [CrossRef] [PubMed]
- Griffiths, J.; Cox, R. Colour and halochromic properties of azo dyes derived from 10-methyl-9-methylene-9,10-dihydroacridine as coupling component. Dye. Pigment. 2000, 47, 65–71. [Google Scholar] [CrossRef]
- Zhang, W.; Zhang, D.; Chen, Y.; Lin, H. Hyperbranched polymer functional TiO2 nanoparticles: Synthesis and its application for the anti-UV finishing of silk fabric. Fibers Polym. 2015, 16, 503–509. [Google Scholar] [CrossRef]
- Massella, D.; Argenziano, M.; Ferri, A.; Guan, J.; Giraud, S.; Cavalli, R.; Barresi, A.A.; Salaün, F. Bio-Functional Textiles: Combining Pharmaceutical Nanocarriers with Fibrous Materials for Innovative Dermatological Therapies. Pharmaceutics 2019, 11, 403. [Google Scholar] [CrossRef] [Green Version]
- Vuthiganond, N.; Nakpathom, M.; Mongkholrattanasit, R. Azoic Deep Dyeing of Silk and UV Protection Using Plant Polyphenols and Diazonium Coupling. Fibers Polym. 2020, 21, 1052–1060. [Google Scholar] [CrossRef]
- Artemenko, A.; Shchukarev, A.; Štenclová, P.; Wågberg, T.; Segervald, J.; Jia, X.; Kromka, A. Reference XPS spectra of amino acids. IOP Conf. Ser. Mater. Sci. Eng. 2021, 1050, 012001. [Google Scholar] [CrossRef]
- Mia, M.S.; Yao, P.; Zhu, X.; Lei, X.; Xing, T.; Chen, G. Degradation of textile dyes from aqueous solution using tea-polyphenol/Fe loaded waste silk fabrics as Fenton-like catalysts. RSC Adv. 2021, 11, 8290–8305. [Google Scholar] [CrossRef]
- Addison, J.B.; Osborn Popp, T.M.; Weber, W.S.; Edgerly, J.S.; Holland, G.P.; Yarger, J.L. Structural characterization of nanofiber silk produced by embiopterans (webspinners). RSC Adv. 2014, 4, 41301–41313. [Google Scholar] [CrossRef] [PubMed] [Green Version]
- de Palaminy, L.; Daher, C.; Moulherat, C. Development of a non-destructive methodology using ATR-FTIR and chemometrics to discriminate wild silk species in heritage collections. Spectrochim. Acta Part A Mol. Biomol. Spectrosc. 2022, 270, 120788. [Google Scholar] [CrossRef] [PubMed]
- Llano, E.; Ríos, D.; Restrepo, G. Evaluación de tecnologías para la estabilización de suelos viales empleando intemperismo acelerado. Una estrategia de análisis de impactos sobre la biodiversidad. TecnoLógicas 2020, 23, 185–199. [Google Scholar] [CrossRef]


| pH | [NaOH] (g·L−1) | [CH3COOH] (g·L−1) | [H3PO4] (g·L−1) | [H3BO3] (g·L−1) |
|---|---|---|---|---|
| 3 | 1.04 | 2.09 | 3.409 | 2.15 |
| 4 | 1.60 | 1.92 | 3.136 | 1.98 |
| 5 | 2.07 | 1.78 | 2.904 | 1.83 |
| 6 | 2.39 | 1.69 | 2.751 | 1.74 |
| 7 | 2.75 | 1.58 | 2.570 | 1.62 |
| 8 | 3.00 | 1.50 | 2.450 | 1.55 |
| 9 | 3.22 | 1.43 | 2.340 | 1.48 |
| 10 | 3.49 | 1.35 | 2.208 | 1.39 |
| 11 | 3.62 | 1.32 | 2.148 | 1.36 |
| 12 | 4.00 | 1.20 | 1.960 | 1.24 |
| Compound | [Compound] (g·L−1) |
|---|---|
| MOPS | 20.900 |
| Sodium Chloride | 6.025 |
| Potassium Chloride | 0.372 |
| Urea | 0.540 |
| Creatinine | 0.013 |
| Glucose | 0.324 |
| Yeast extract | 1.0 |
| Peptone | 3.0 |
| Magnesium sulphate | 0.017 |
| Haemin | 0.005 |
| Potassium phosphate | 0.109 |
| pH | λmax (nm) | Absorbance | ε (L·mol−1·cm−1) |
|---|---|---|---|
| 3 | 557 | 1.19 | 5.79 × 10³ |
| 4 | 557 | 1.23 | 6.01 × 10³ |
| 5 | 557 | 1.23 | 5.97 × 10³ |
| 6 | 557 | 1.22 | 5.92 × 10³ |
| 7 | 557 | 1.21 | 5.90 × 10³ |
| 8 | 557 | 1.24 | 6.03 × 10³ |
| 9 | 544 | 1.32 | 6.43 × 10³ |
| 10 | 536 | 1.65 | 8.03 × 10³ |
| 11 | 536 | 1.74 | 8.46 × 10³ |
| 12 | 536 | 1.75 | 8.53 × 10³ |
| pH | T (°C) | L* | a* | b* | K/S sum | ∆E # | UPF | Sample |
|---|---|---|---|---|---|---|---|---|
| SK | - | 76.1 | −0.13 | 0.74 | 0.30 | - | 5 |  |
| 6 | 40 | 53.60 | 6.90 | −24.99 | 0.58 | 33.99 | 8 |  |
| 6 | 70 | 56.72 | 5.62 | −21.38 | 0.52 | 29.06 | 9 |  |
| 8 | 40 | 55.68 | 5.64 | −22.05 | 0.54 | 30.23 | 8 |  |
| 8 | 70 | 57.35 | 5.03 | −20.72 | 0.51 | 28.05 | 7 |  |
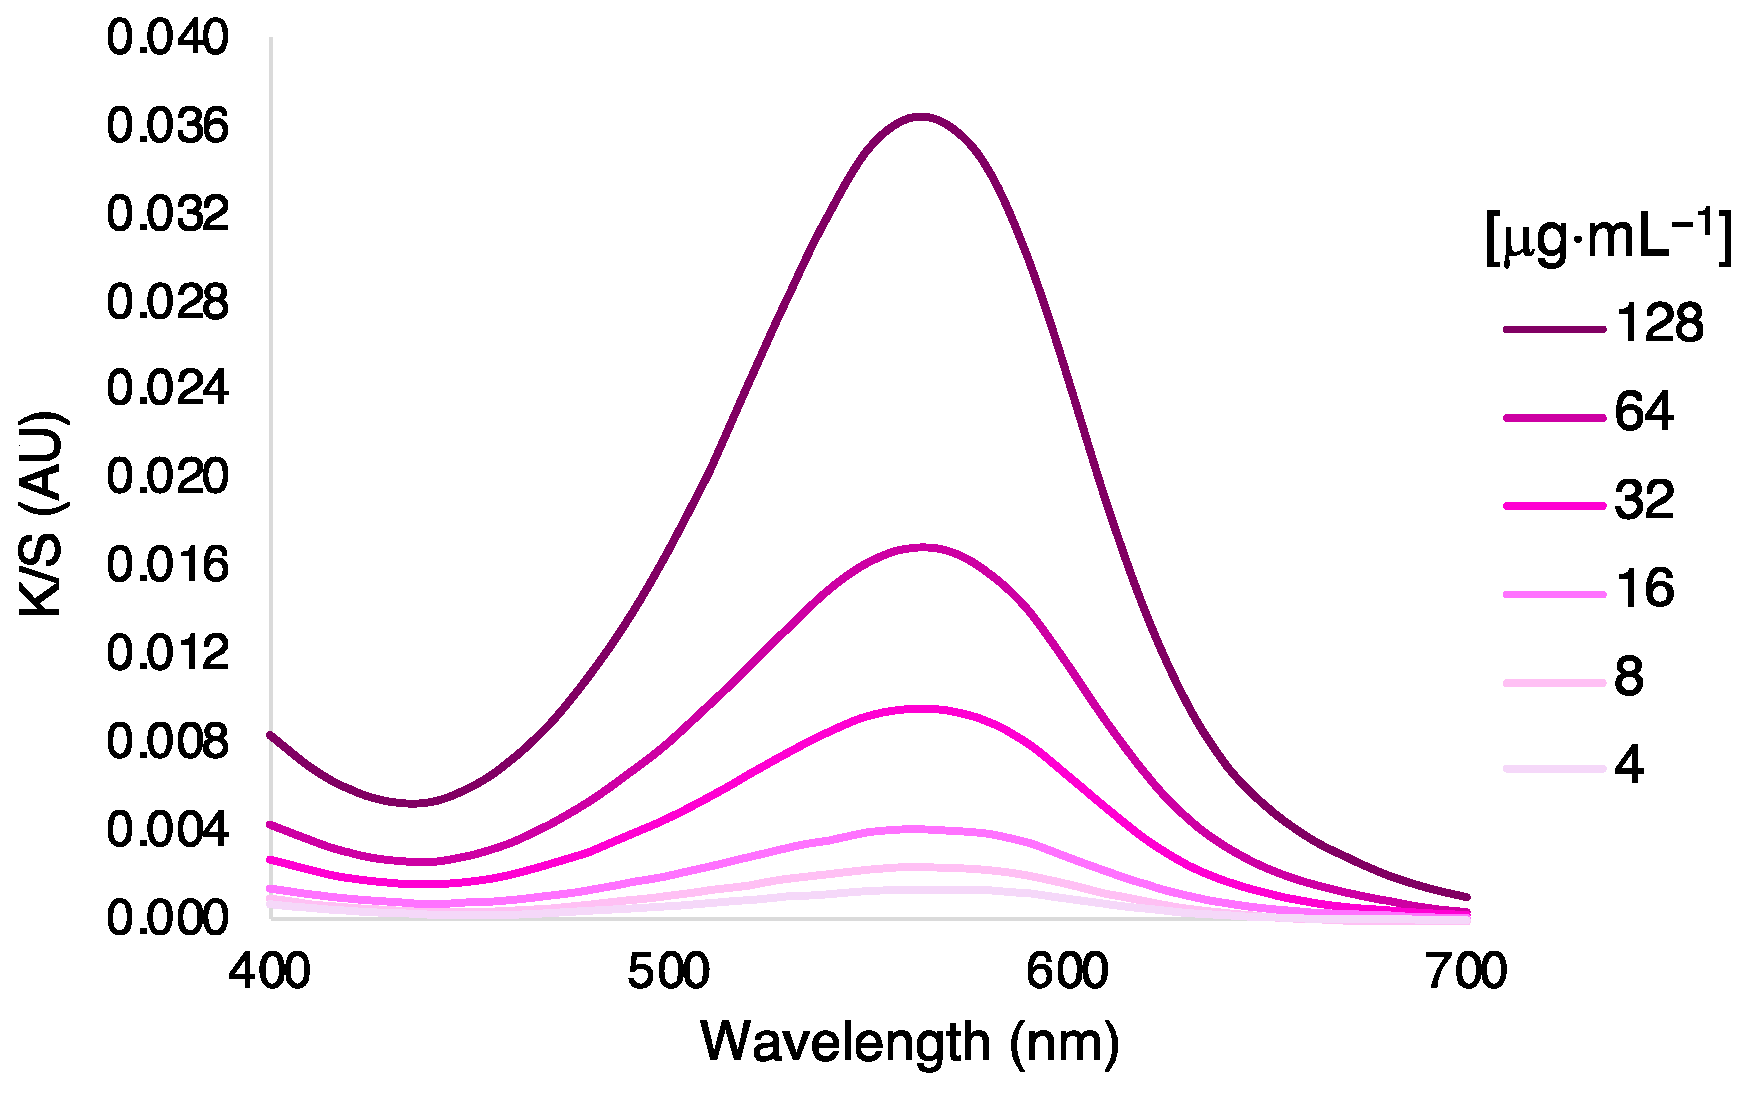
| [AzoIz.Pip] μg·mL−1 | K/S Sum | ∆E # | UPF |
|---|---|---|---|
| 4 | 0.32 | 2.62 | 5 |
| 8 | 0.35 | 6.82 | 6 |
| 16 | 0.39 | 12.49 | 7 |
| 32 | 0.49 | 21.30 | 7 |
| 64 | 0.59 | 28.60 | 8 |
| 128 | 0.66 | 30.53 | 8 |
| Buffer, pH | L* | a* | b* | K/S Sum | ∆E # | UPF | Sample |
|---|---|---|---|---|---|---|---|
| BR, 4 | 55.92 | 3.96 | −16.73 | 0.54 | 1.50 | 7 |  |
| BR, 5 | 56.79 | 2.99 | −15.71 | 0.53 | 1.80 | 7 |  |
| BR, 6 | 55.41 | 4.28 | −17.45 | 0.55 | 1.18 | 7 |  |
| BR, 7 | 53.45 | 5.06 | −18.09 | 0.59 | 2.25 | 8 |  |
| BR, 8 | 55.52 | 6.16 | −18.59 | 0.54 | 3.19 | 8 |  |
| BR, 9 | 53.34 | 7.31 | −20.02 | 0.58 | 4.19 | 8 |  |
| BR, 10 | 54.17 | 12.02 | −20.22 | 0.55 | 9.16 | 9 |  |
| Artificial exudate, 7 | 55.33 | 3.86 | −16.83 | 0.56 | 0.97 | 9 |  |
| Artificial sweat, 6 | 54.23 | 4.06 | −17.39 | 0.58 | 0.86 | 8 |  |
| Artificial sweat, 8 | 54.13 | 4.43 | −17.78 | 0.58 | 1.30 | 8 |  |
| [AzoIz.Pip] μg·mL−1 | K/S Sum | ∆E # | UPF |
|---|---|---|---|
| 4 | 0.33 | 4.48 | 7 |
| 8 | 0.34 | 7.97 | 6 |
| 16 | 0.36 | 12.41 | 7 |
| 32 | 0.43 | 22.85 | 7 |
| 64 | 0.53 | 31.83 | 8 |
| 128 | 0.77 | 44.61 | 10 |
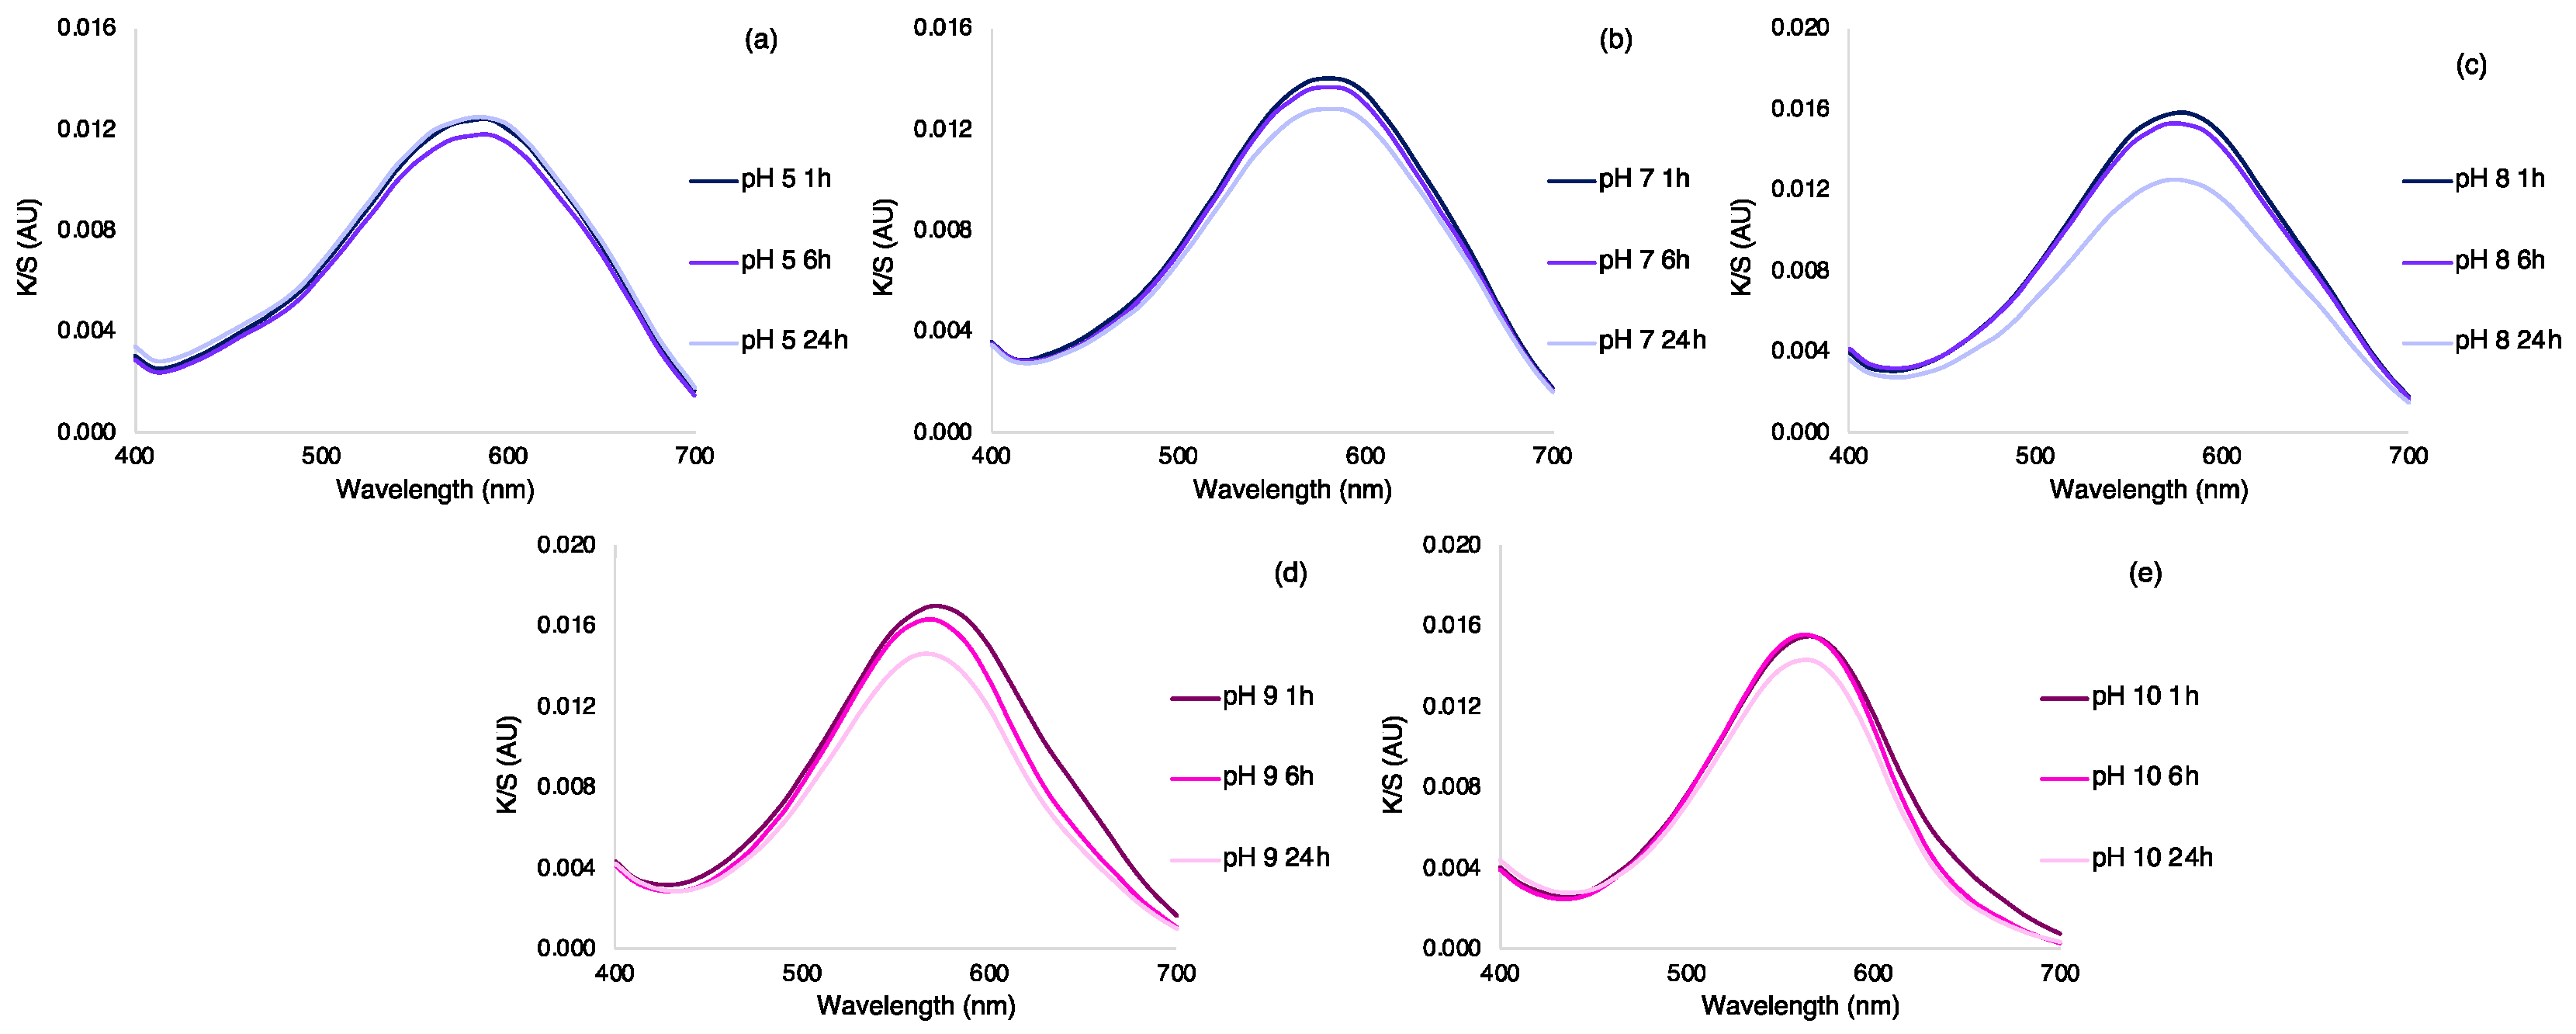
| Buffer, Time | L* | a* | b* | K/S Sum | ∆E # | UPF | Sample |
|---|---|---|---|---|---|---|---|
| pH 5, 1 h | 56.79 | 2.99 | −15.71 | 0.53 | 4.27 | 7 |  |
| pH 5, 6 h | 57.35 | 2.94 | −15.4 | 0.52 | 4.91 | 7 |  |
| pH 5, 24 h | 56.54 | 2.89 | −15.21 | 0.53 | 4.37 | 7 |  |
| pH 7, 1 h | 55.39 | 3.94 | −17.35 | 0.55 | 2.29 | 9 |  |
| pH 7, 6 h | 55.68 | 4.2 | −17.41 | 0.54 | 2.59 | 8 |  |
| pH 7, 24 h | 56.4 | 3.81 | −16.56 | 0.53 | 3.48 | 8 |  |
| pH 8, 1 h | 54.03 | 5.57 | −19.23 | 0.57 | 2.46 | 9 |  |
| pH 8, 6 h | 54.38 | 5.5 | −18.45 | 0.57 | 2.23 | 8 |  |
| pH 8, 24 h | 56.8 | 4.72 | −16.63 | 0.52 | 3.96 | 7 |  |
| pH 9, 1 h | 53.34 | 7.31 | −20.02 | 0.58 | 4.19 | 7 |  |
| pH 9, 6 h | 54.24 | 9.28 | −19.9 | 0.55 | 6.02 | 8 |  |
| pH 9, 24 h | 55.54 | 8.58 | −18.19 | 0.53 | 4.42 | 7 |  |
| pH 10, 1 h | 55.31 | 10.64 | −19.25 | 0.53 | 7.38 | 8 |  |
| pH 10, 6 h | 55.63 | 12.45 | −19.17 | 0.52 | 8.68 | 7 |  |
| pH 10, 24 h | 56.5 | 11.71 | −17.18 | 0.50 | 9.16 | 8 |  |
| pH | L* | a* | b* | K/S Sum | ∆E # | UPF | Sample | |
|---|---|---|---|---|---|---|---|---|
| Initial sample | 6 | 53.60 | 6.90 | −24.99 | 0.58 | - | 8 |  |
| 1st color change | 10 | 54.57 | 11.8 | −19.84 | 0.54 | 8.44 | 8 |  |
| 2nd color change | 6 | 54.93 | 4.29 | −18.12 | 0.56 | 1.87 | 8 |  |
| 3rd color change | 10 | 53.99 | 11.64 | −20.12 | 0.55 | 8.28 | 8 |  |
| 4th color change | 6 | 55.17 | 3.69 | −17.17 | 0.56 | 2.12 | 8 |  |
| Acidic Sweat | Alkaline Sweat | Wound Exudate | Washing | Rubbing Wet | Rubbing Dry | |
|---|---|---|---|---|---|---|
| ∆E | 0.86 | 1.30 | 0.97 | 14.48 | - | - |
| Acetate | 3–4 | 3–4 | 3–4 | 5 | 5 | 5 |
| Cotton | 4 | 4–5 | 4–5 | 5 | ||
| Polyamide 6,6 | 3–4 | 3–4 | 3–4 | 4 | ||
| Polyester | 5 | 5 | 4–5 | 5 | ||
| Acrylic | 4 | 4–5 | 5 | 5 | ||
| Wool | 5 | 4 | 4 | 5 |
| C1 | C2 | C3 | C4 | Sample | |
|---|---|---|---|---|---|
| Control | 1.22 ± 0.06 | 0.68 ± 0.11 | 0.31 ± 0.08 | 0.51 ± 0.03 |  |
| pH 6 | 1.34 ± 0.03 | 0.69 ± 0.04 | 0.62 ± 0.03 | 0.48 ± 0.02 |  |
| pH 10 | 1.38 ± 0.02 | 0.70 ± 0.03 | 0.64 ± 0.04 | 0.49 ± 0.02 |  |
Disclaimer/Publisher’s Note: The statements, opinions and data contained in all publications are solely those of the individual author(s) and contributor(s) and not of MDPI and/or the editor(s). MDPI and/or the editor(s) disclaim responsibility for any injury to people or property resulting from any ideas, methods, instructions or products referred to in the content. |
© 2023 by the authors. Licensee MDPI, Basel, Switzerland. This article is an open access article distributed under the terms and conditions of the Creative Commons Attribution (CC BY) license (https://creativecommons.org/licenses/by/4.0/).
Share and Cite
Ribeiro, A.I.; Vieira, B.; Alves, C.; Silva, B.; Pinto, E.; Cerqueira, F.; Silva, R.; Remião, F.; Shvalya, V.; Cvelbar, U.; et al. Halochromic Silk Fabric as a Reversible pH-Sensor Based on a Novel 2-Aminoimidazole Azo Dye. Polymers 2023, 15, 1730. https://doi.org/10.3390/polym15071730
Ribeiro AI, Vieira B, Alves C, Silva B, Pinto E, Cerqueira F, Silva R, Remião F, Shvalya V, Cvelbar U, et al. Halochromic Silk Fabric as a Reversible pH-Sensor Based on a Novel 2-Aminoimidazole Azo Dye. Polymers. 2023; 15(7):1730. https://doi.org/10.3390/polym15071730
Chicago/Turabian StyleRibeiro, Ana Isabel, Bárbara Vieira, Cátia Alves, Bárbara Silva, Eugénia Pinto, Fátima Cerqueira, Renata Silva, Fernando Remião, Vasyl Shvalya, Uros Cvelbar, and et al. 2023. "Halochromic Silk Fabric as a Reversible pH-Sensor Based on a Novel 2-Aminoimidazole Azo Dye" Polymers 15, no. 7: 1730. https://doi.org/10.3390/polym15071730
APA StyleRibeiro, A. I., Vieira, B., Alves, C., Silva, B., Pinto, E., Cerqueira, F., Silva, R., Remião, F., Shvalya, V., Cvelbar, U., Padrão, J., Dias, A. M., & Zille, A. (2023). Halochromic Silk Fabric as a Reversible pH-Sensor Based on a Novel 2-Aminoimidazole Azo Dye. Polymers, 15(7), 1730. https://doi.org/10.3390/polym15071730