
Alkaline Treatment Investigation for Sedge Fibers (Cyperus malaccensis): A Promising Enhancement


 and
and 
Abstract
:1. Introduction
2. Materials and Methods
2.1. Materials and Processing
2.2. Thermogravimetric Analysis (TGA/DTG)
2.3. Differential Scanning Calorimetry (DSC)
2.4. Fourier-Transform Infrared Spectroscopy (FTIR)
2.5. X-ray Diffraction (XRD)
2.6. Scanning Electron Microscopy (SEM)
3. Results and Discussion
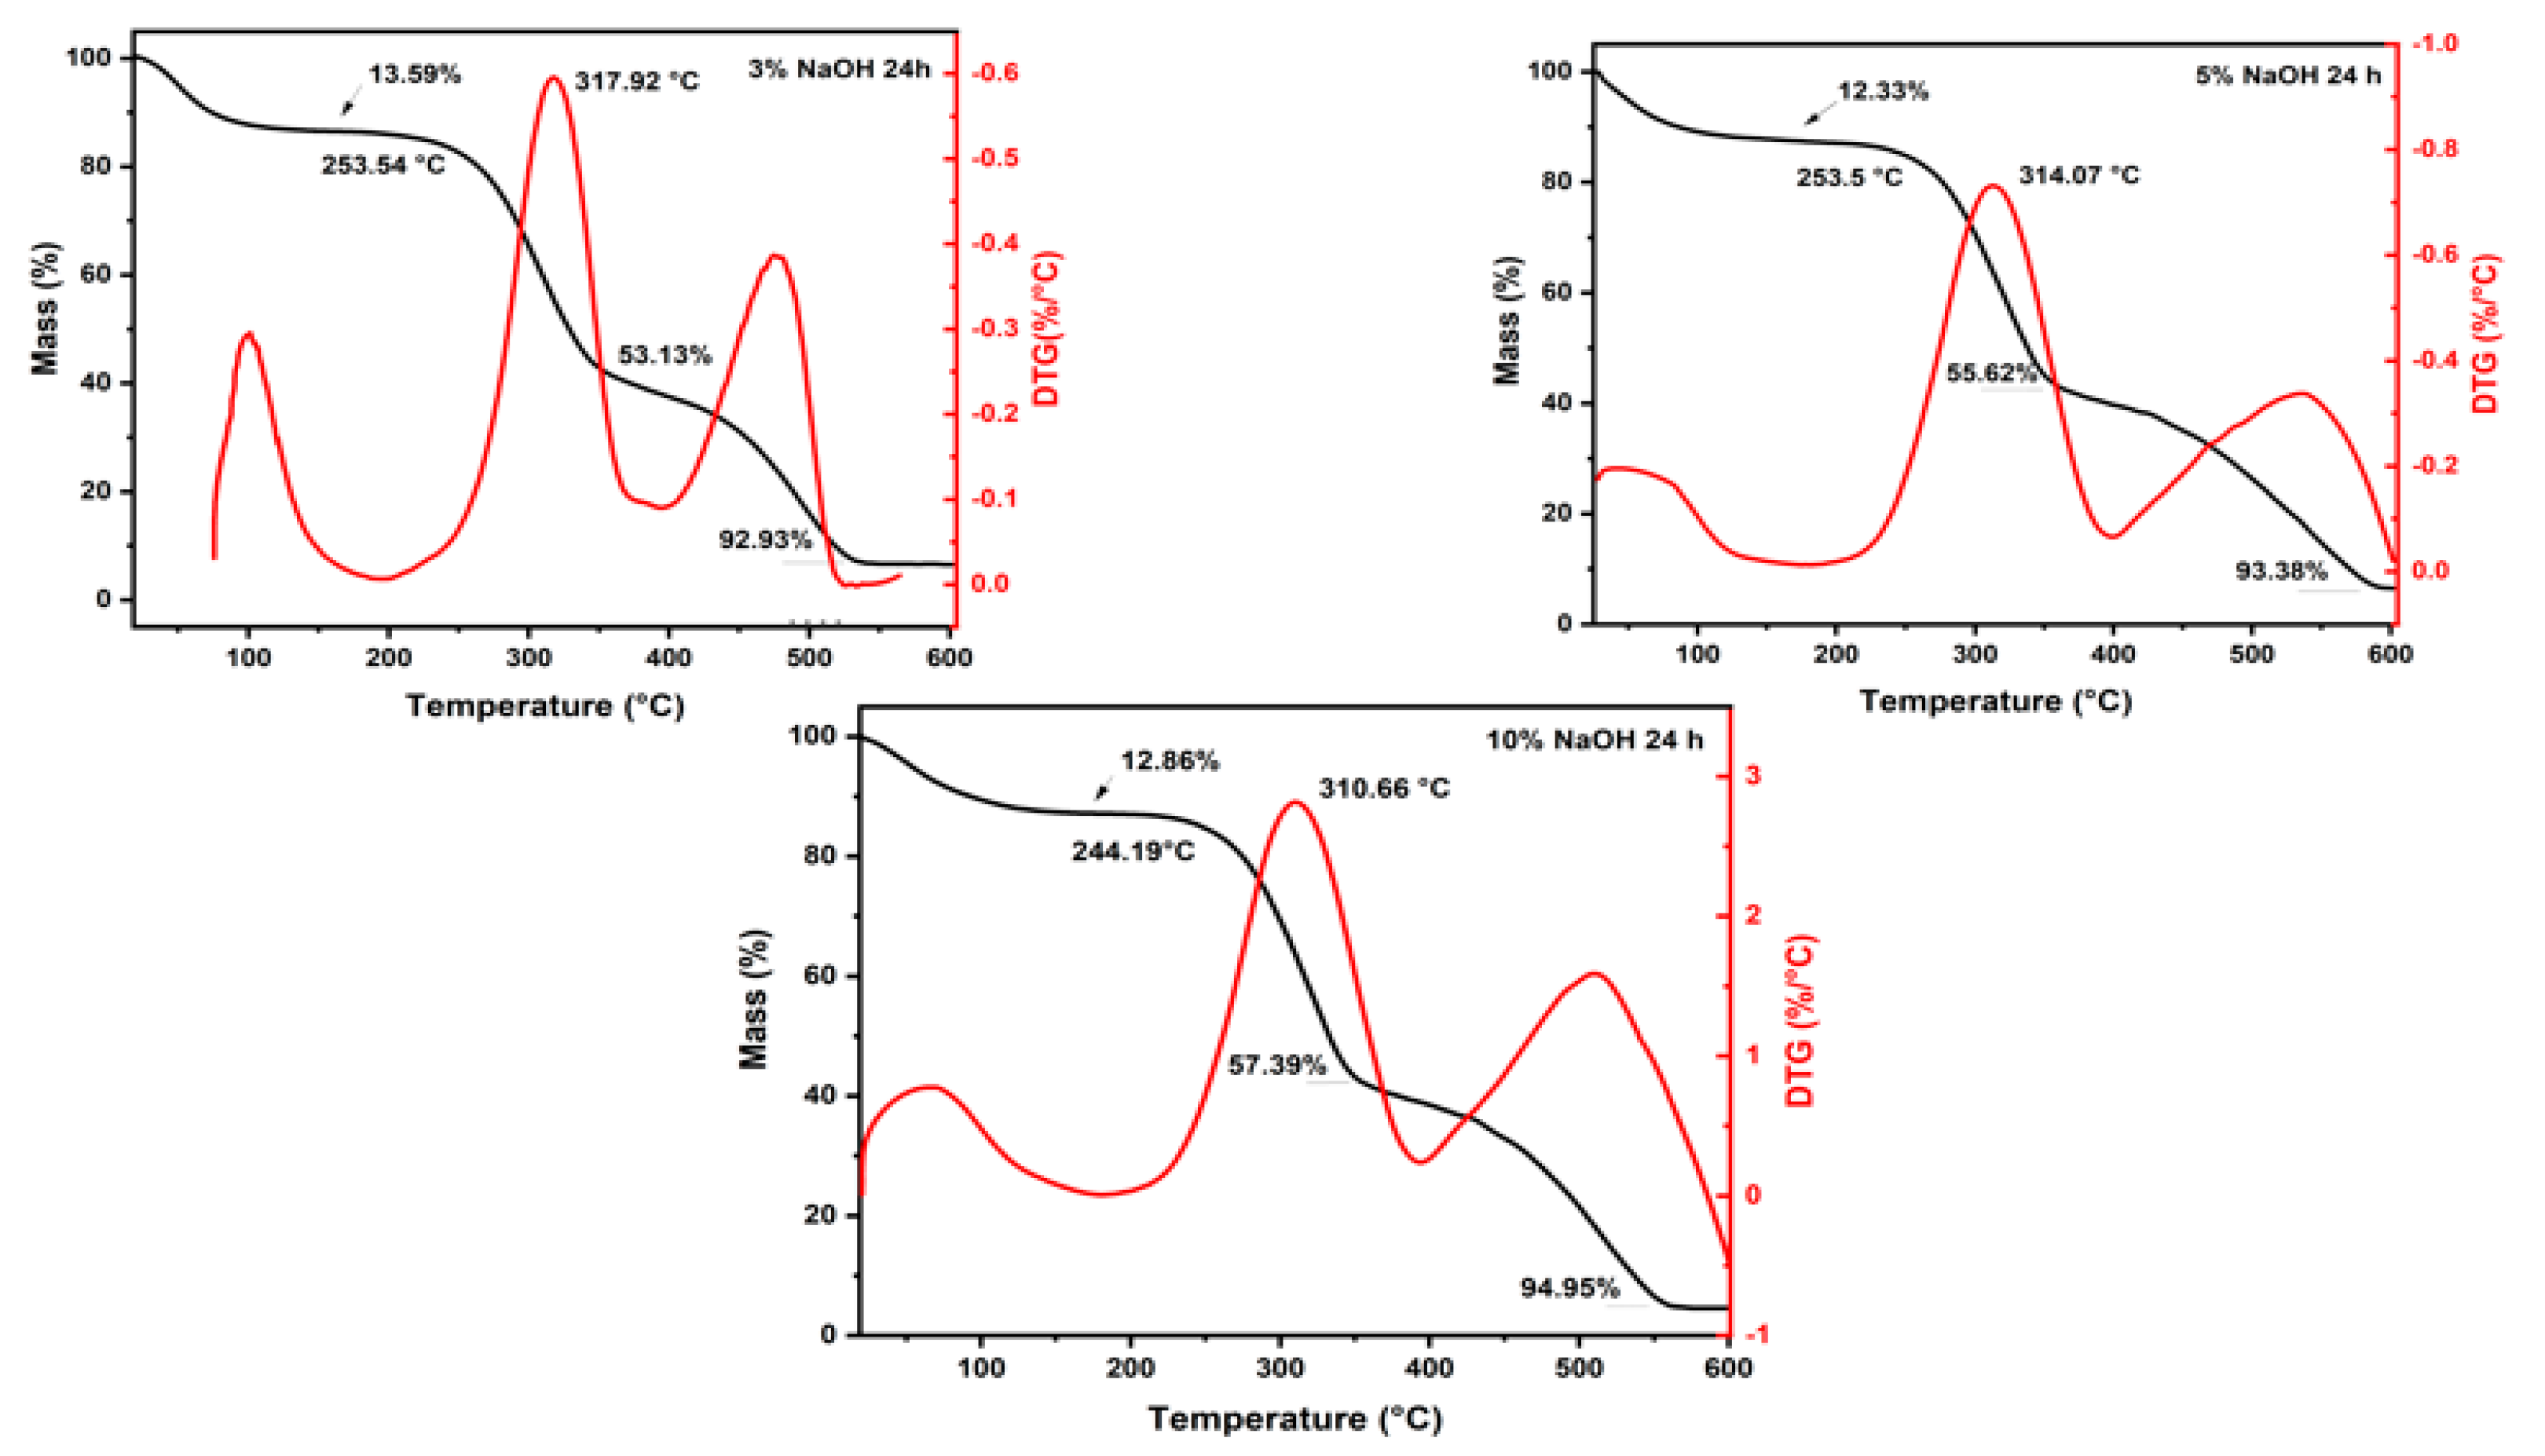
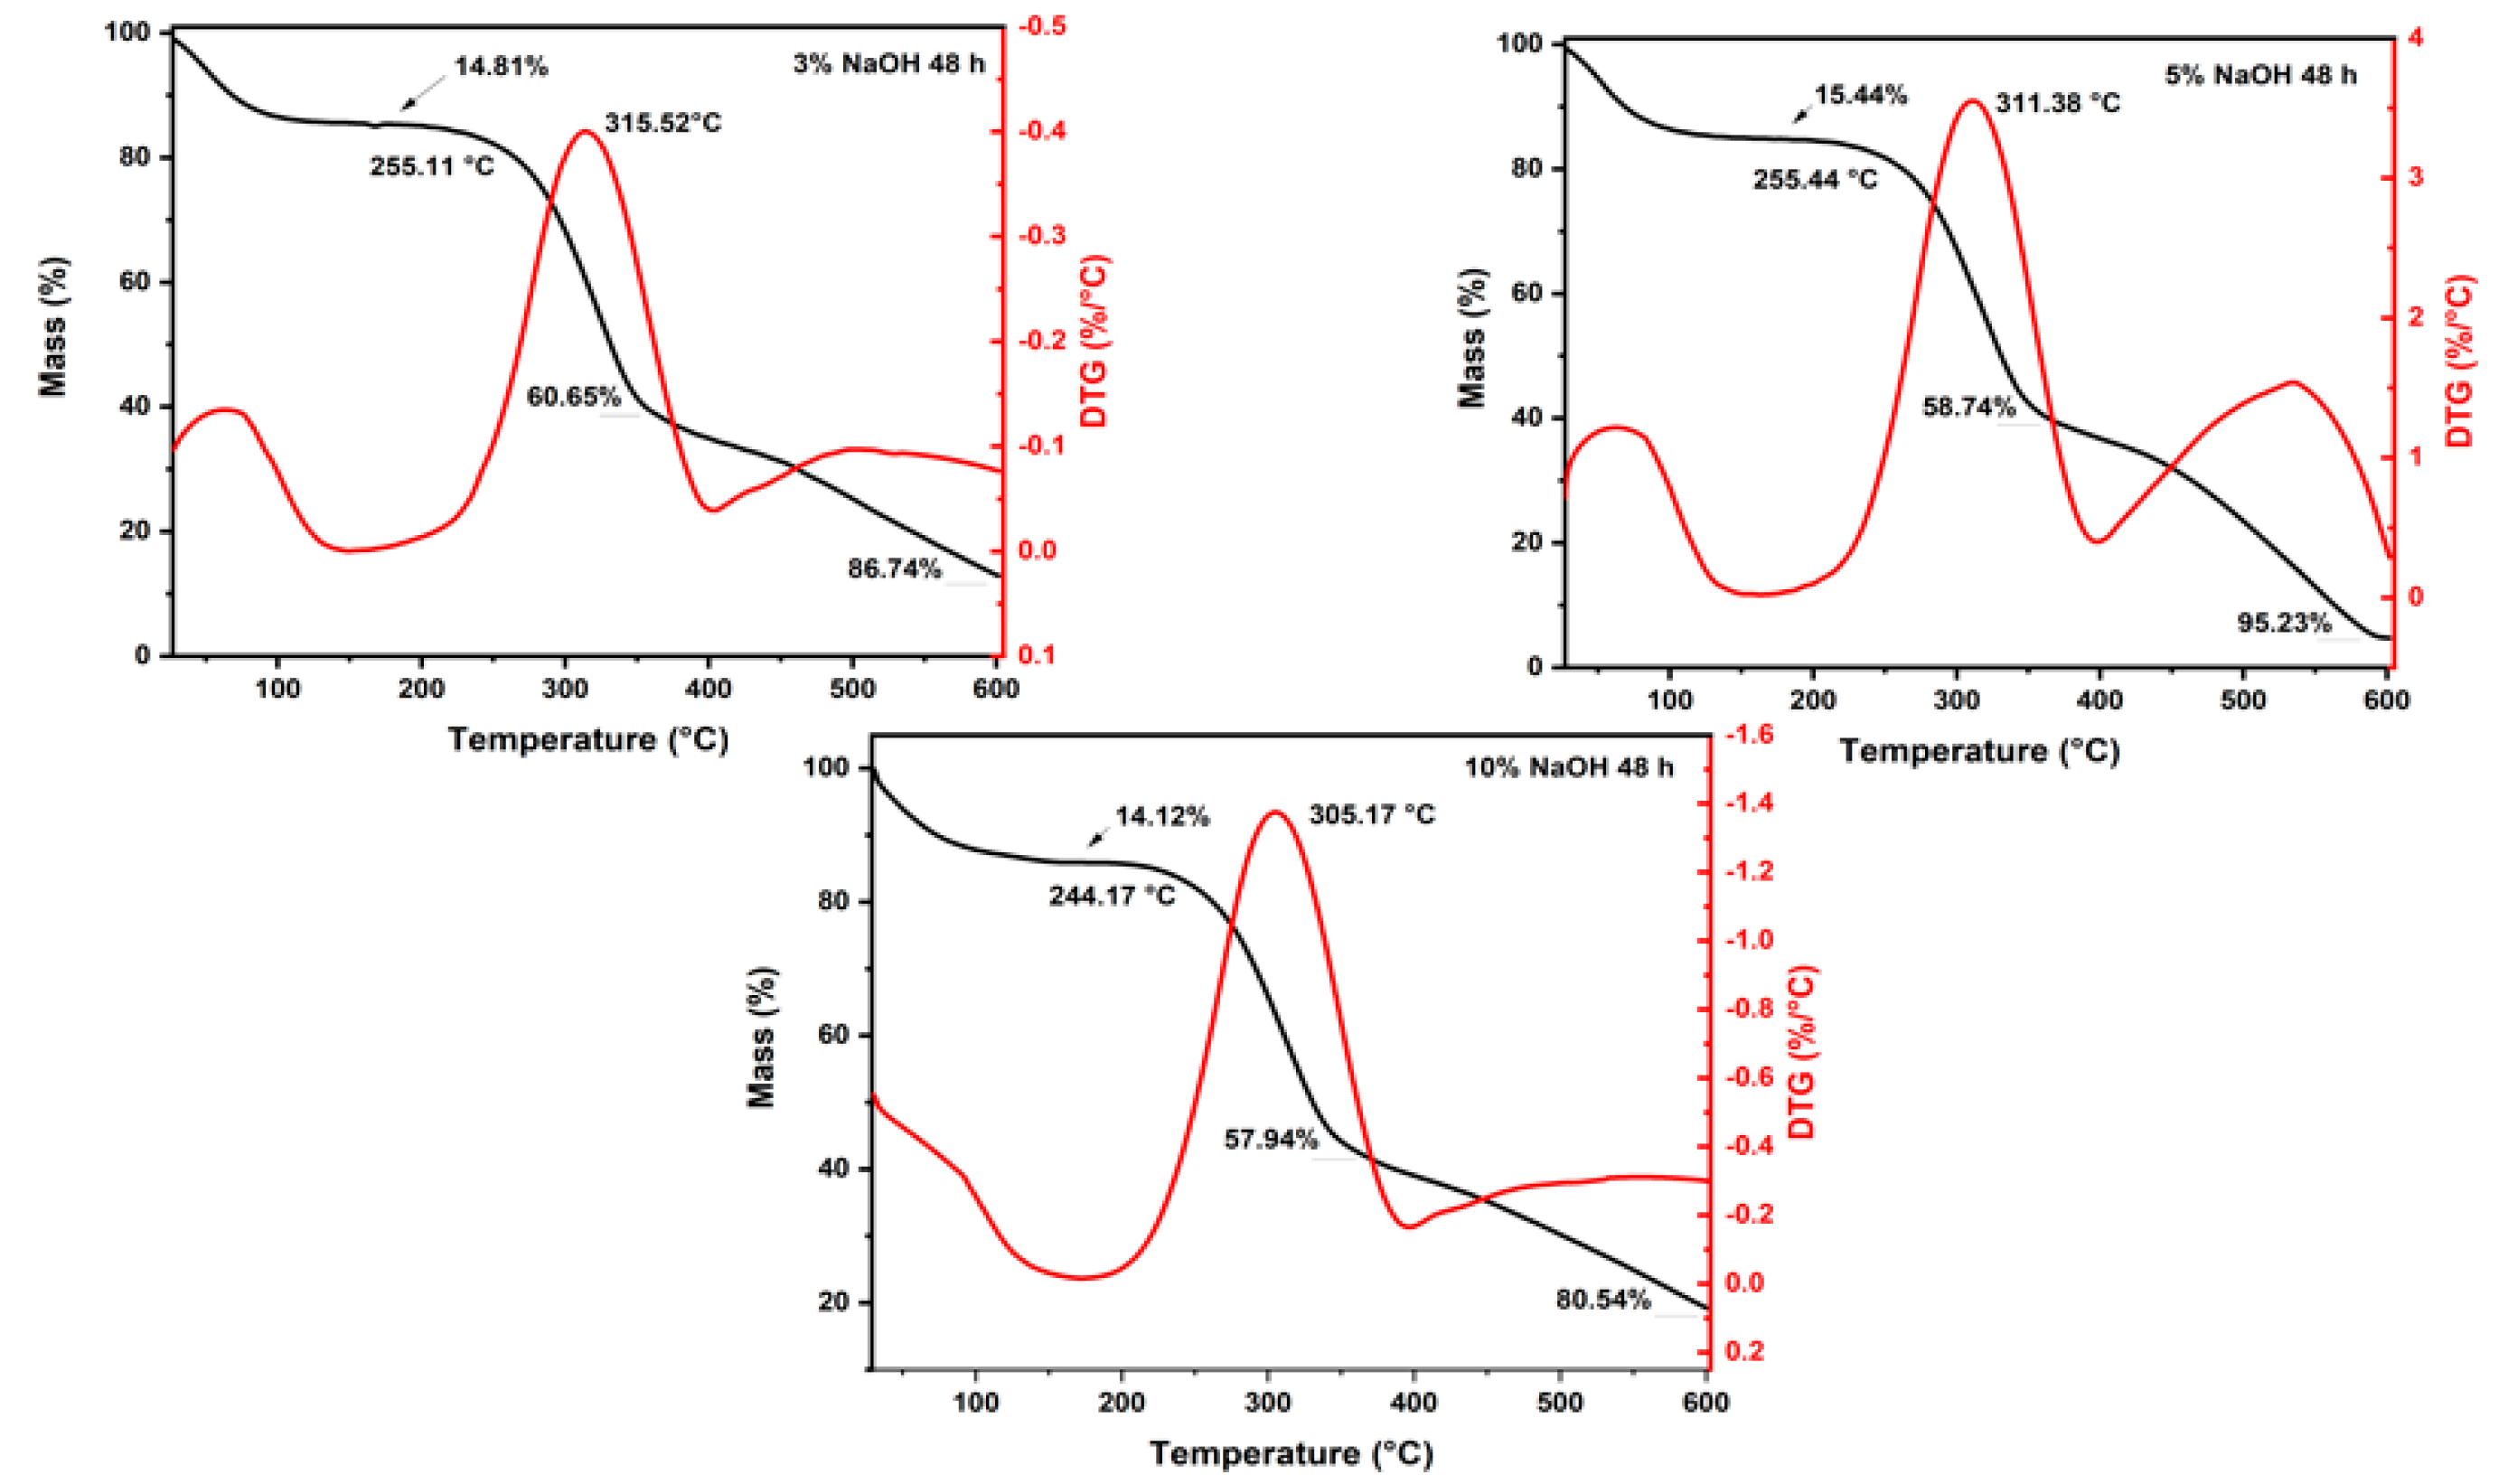
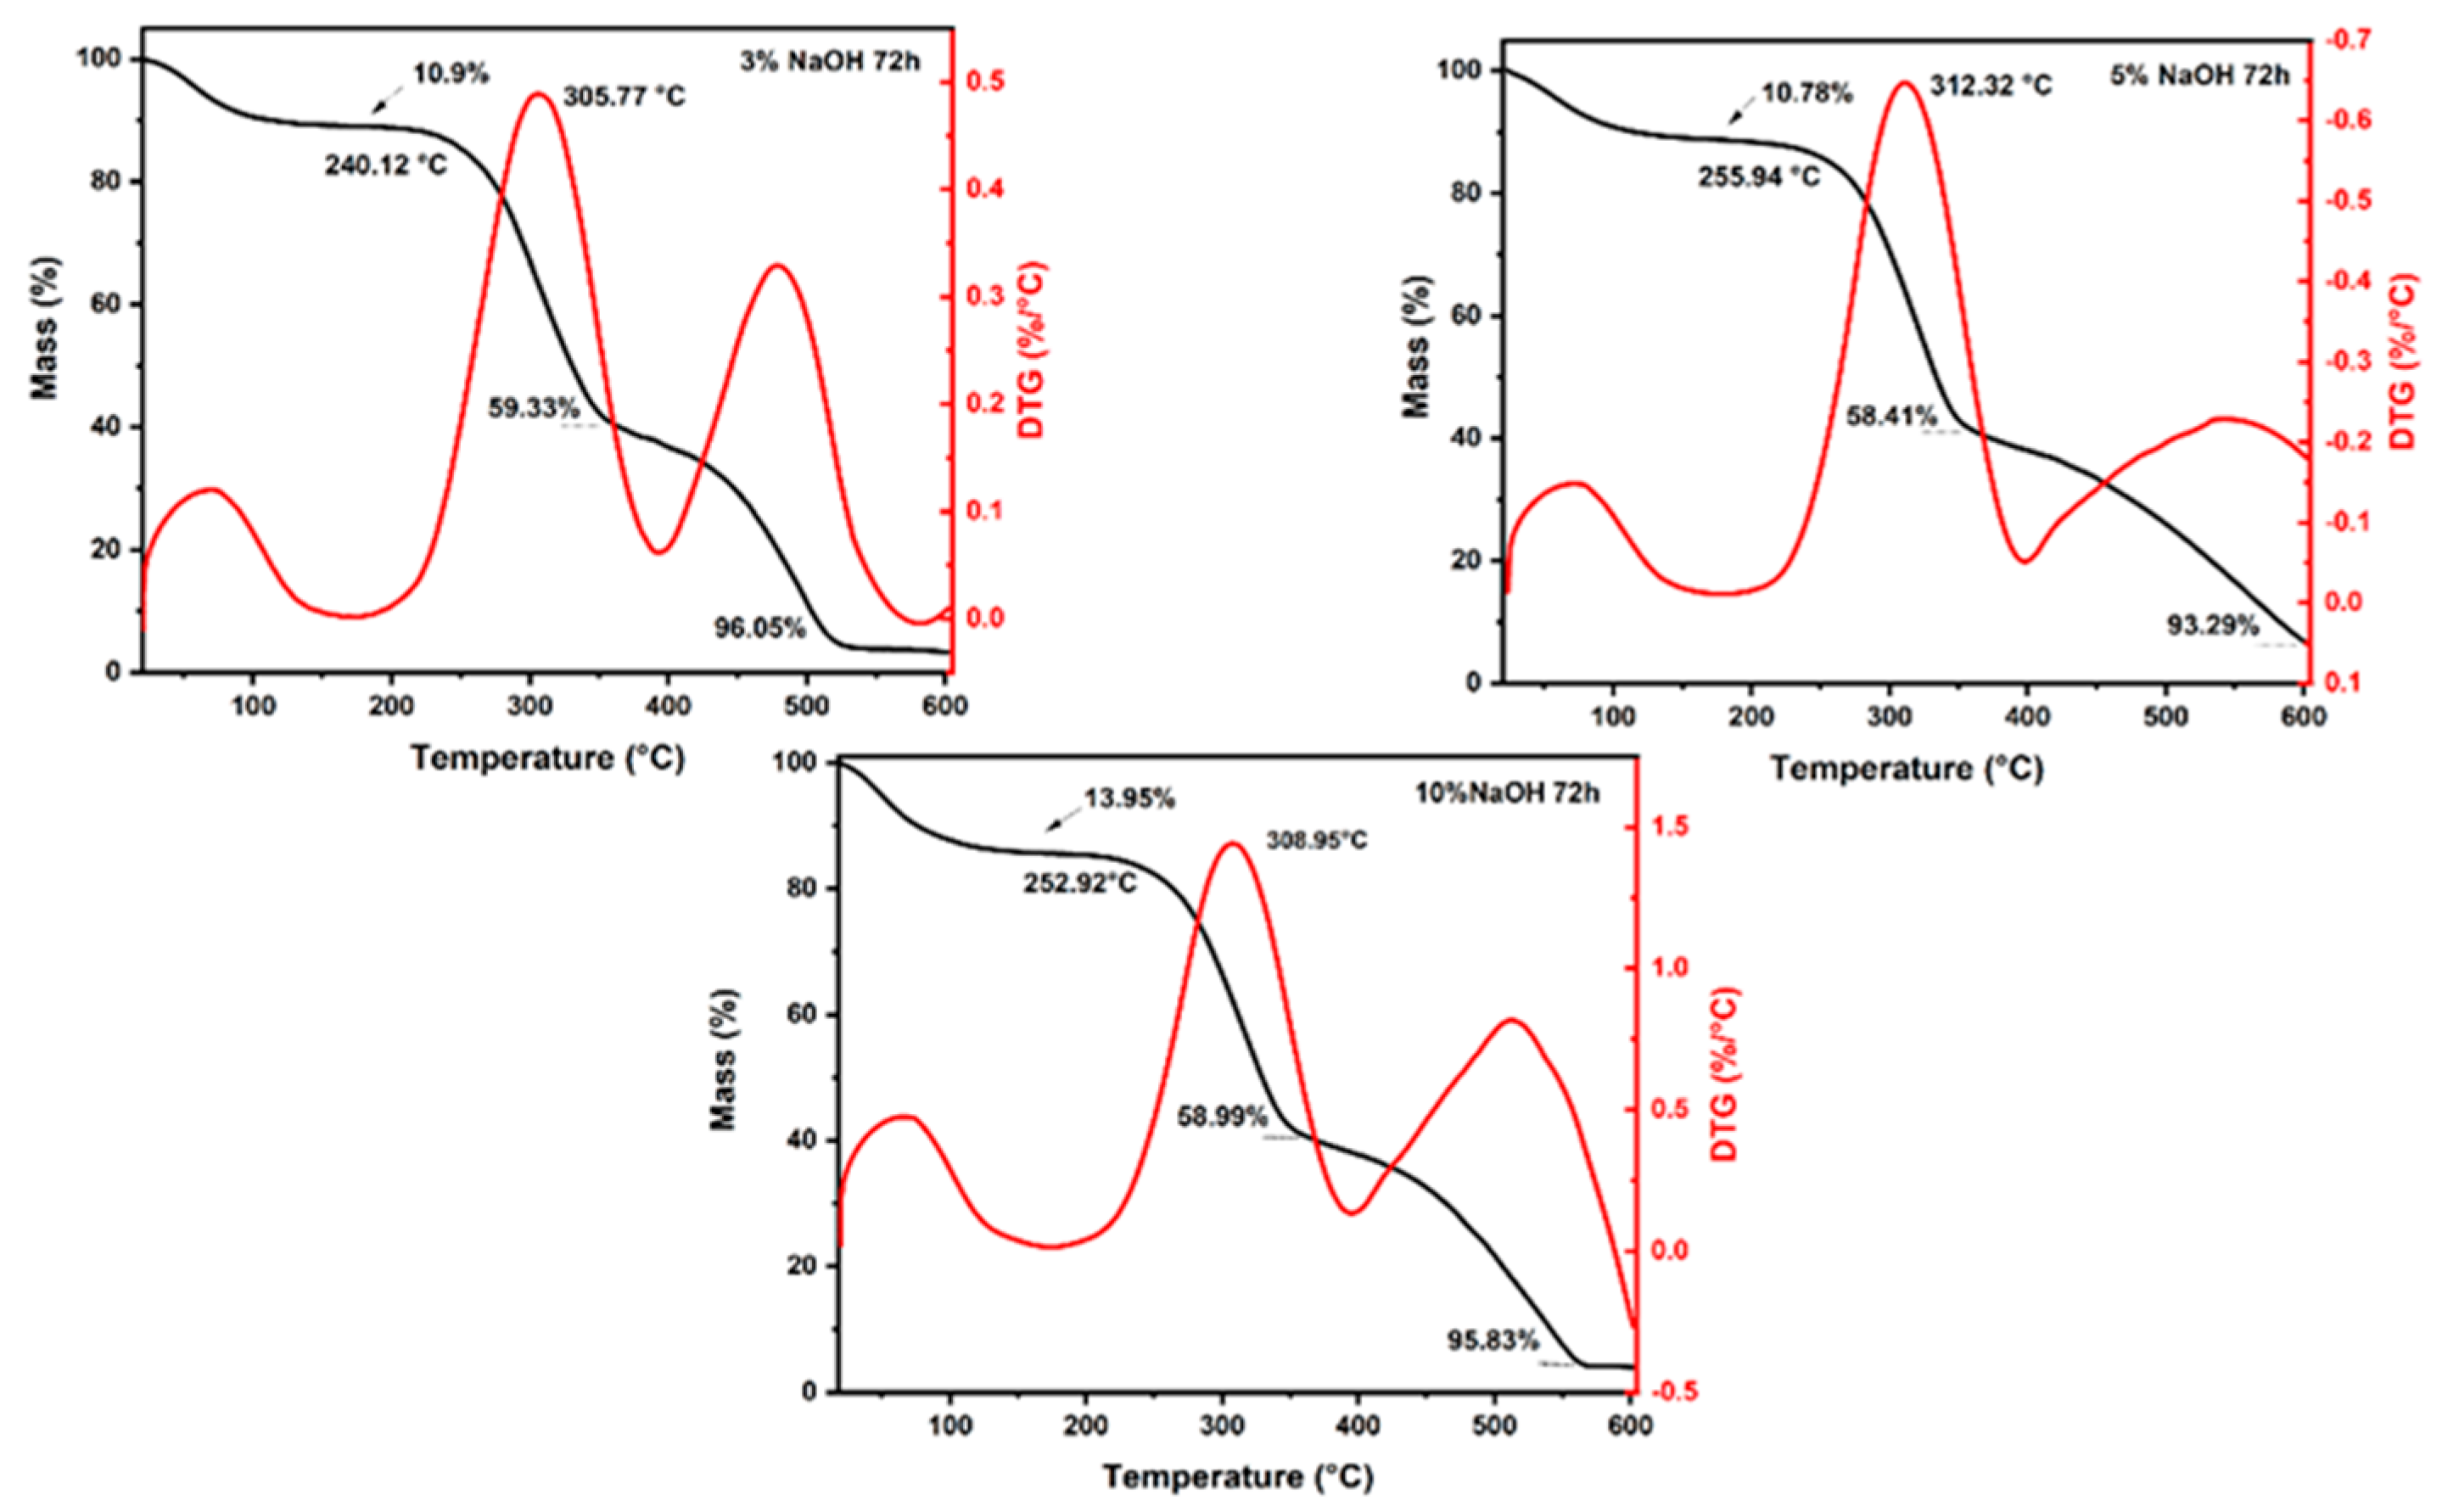
3.1. Thermogravimetric Analysis
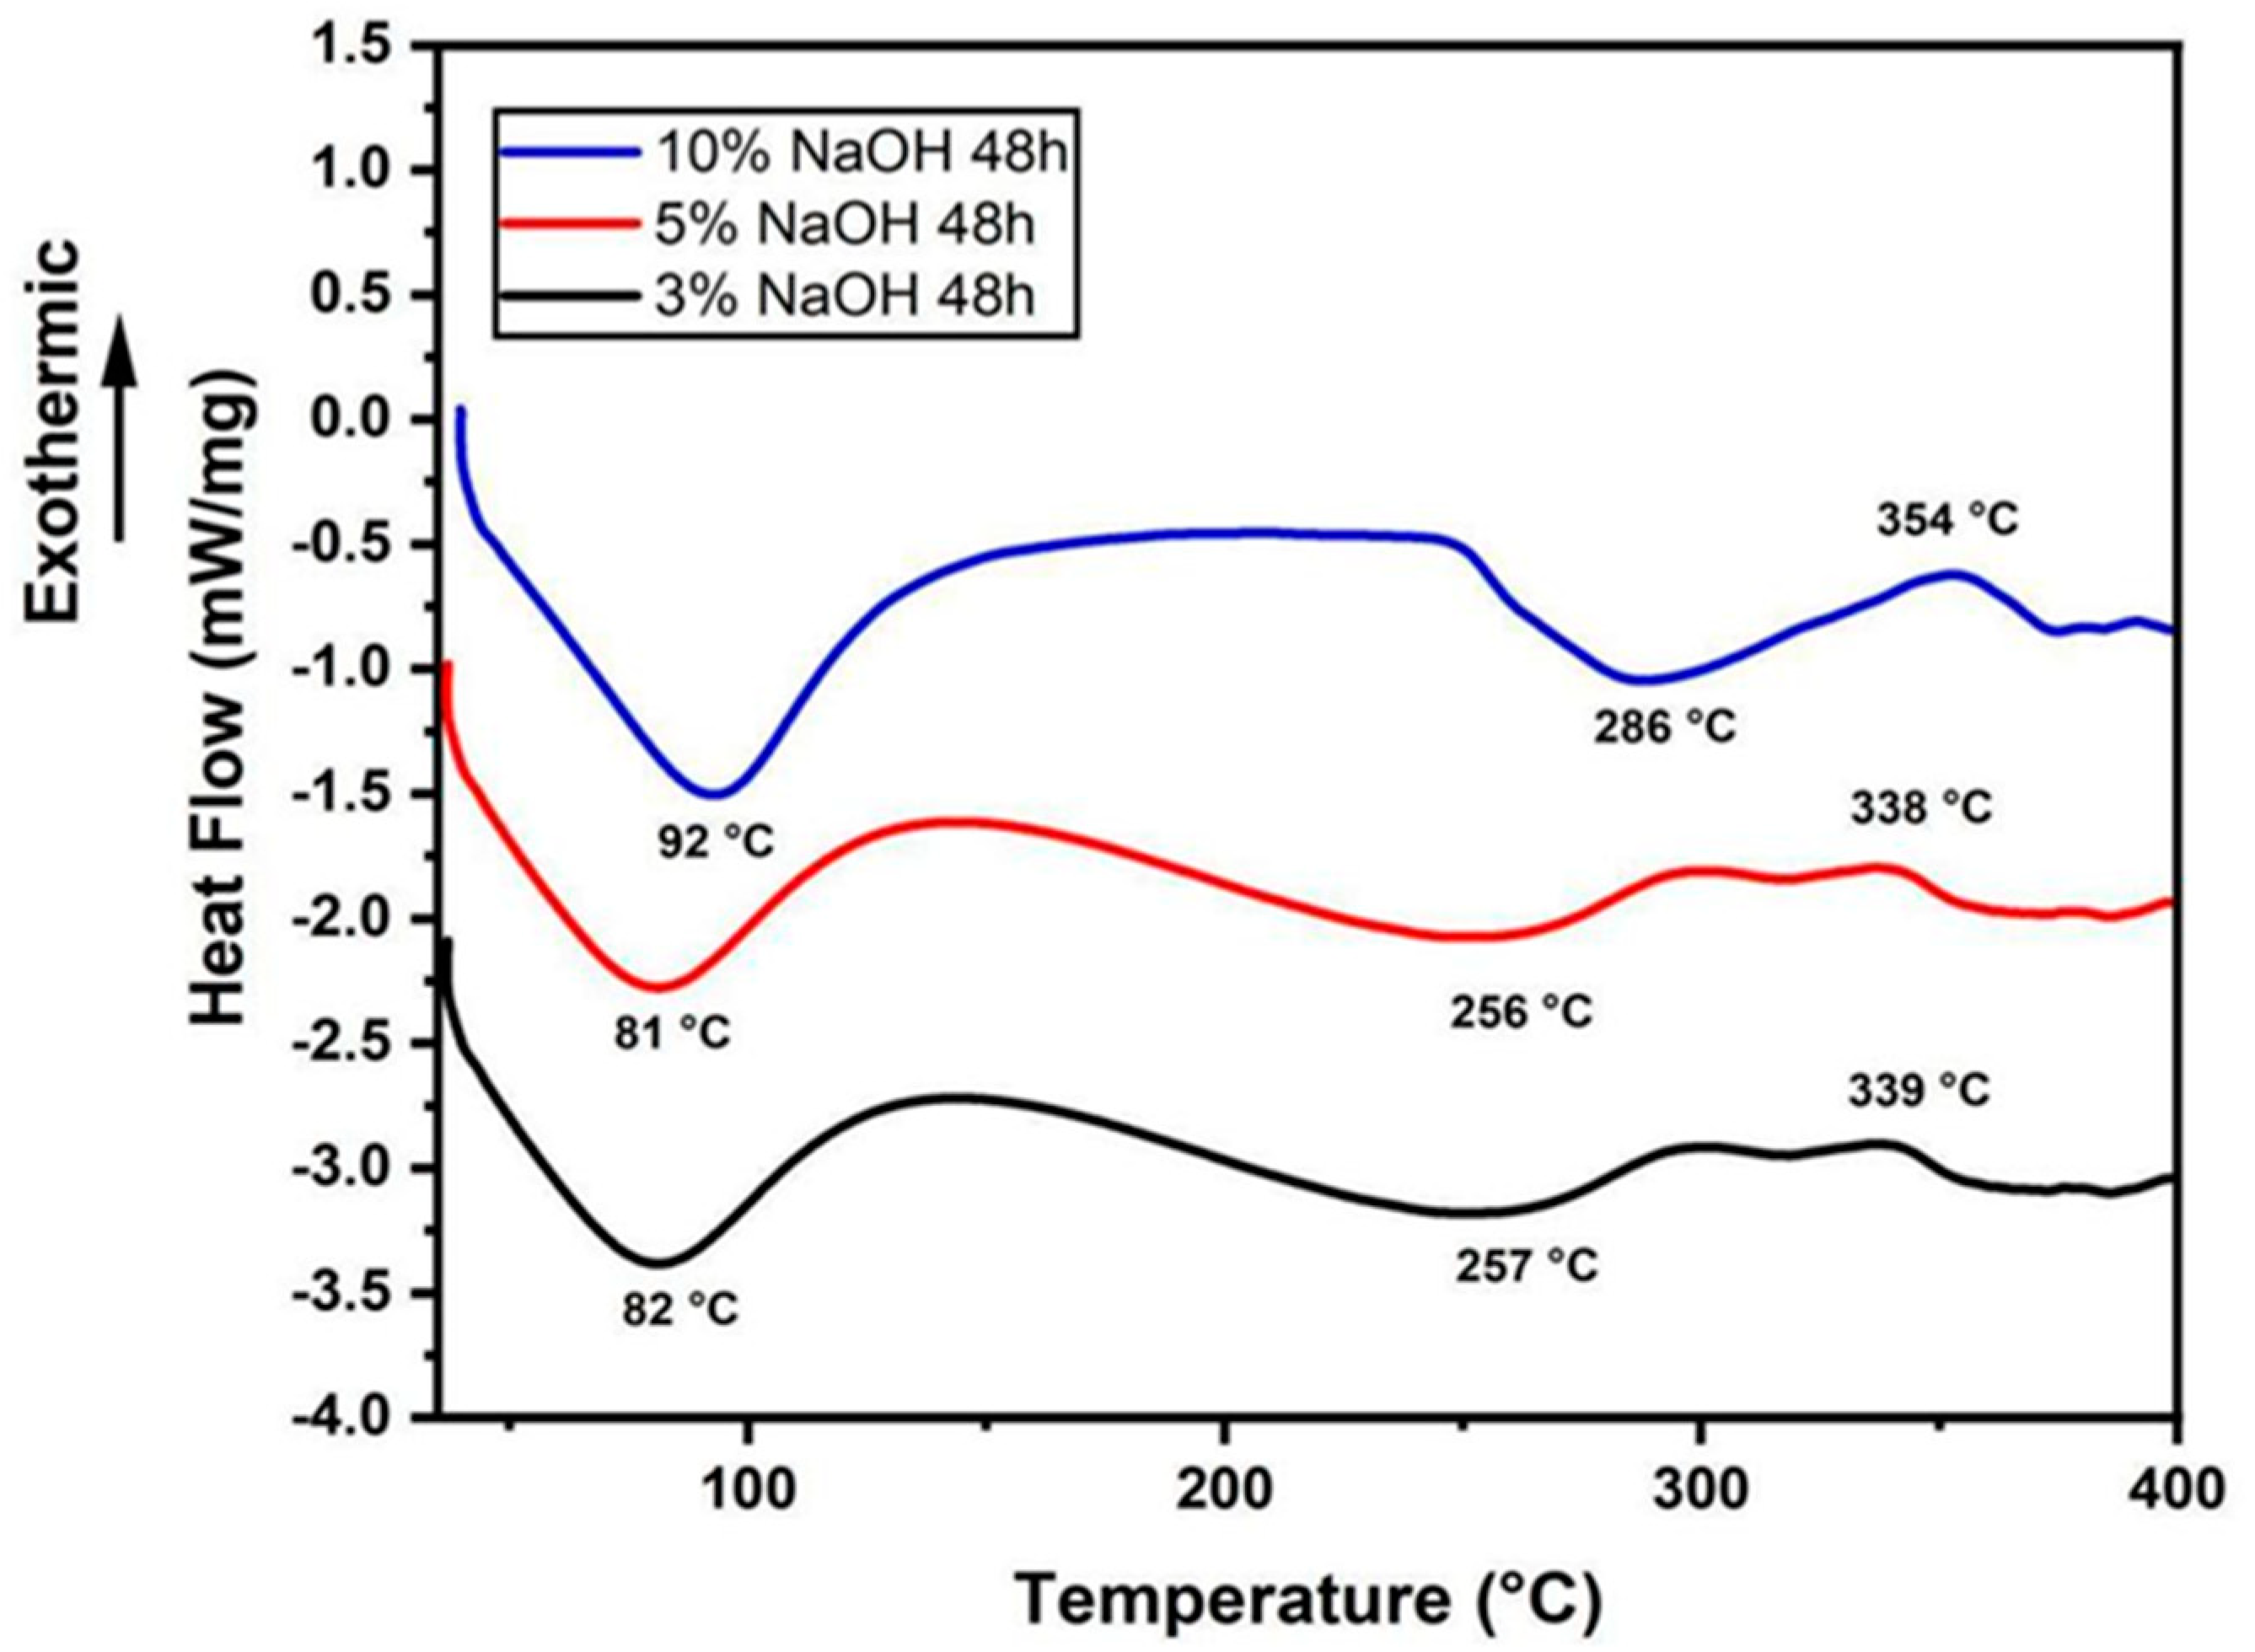
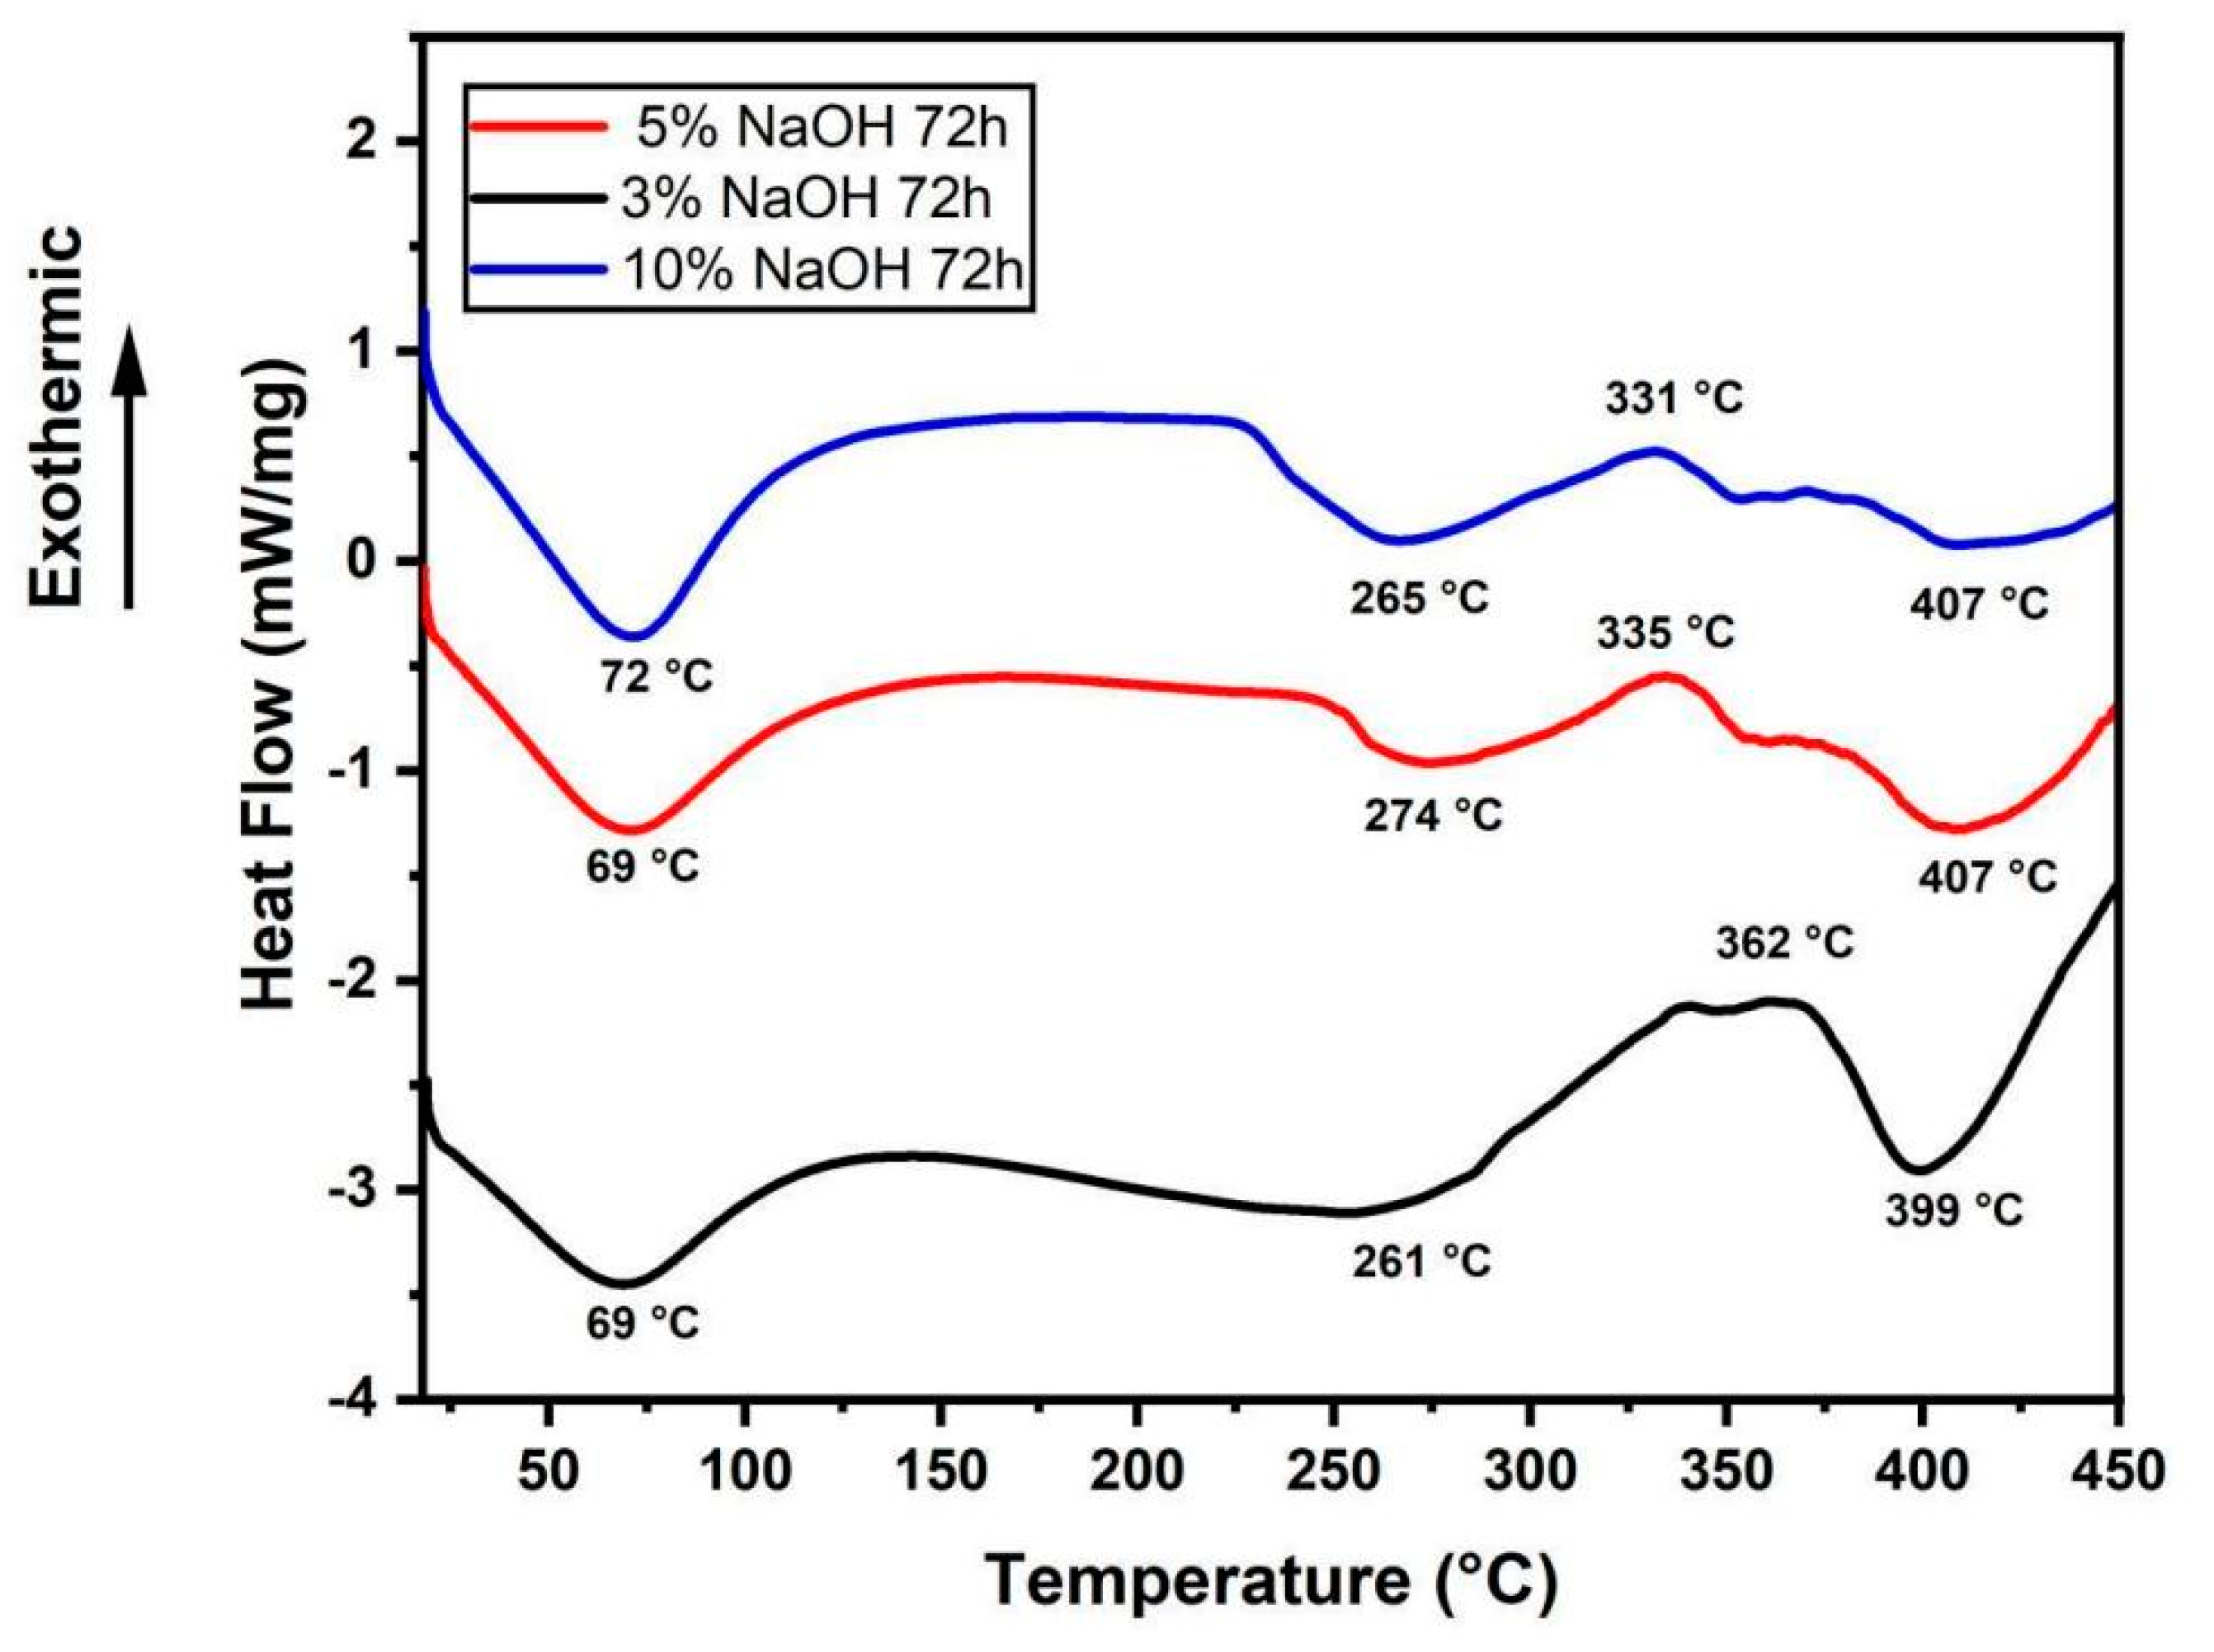
3.2. DSC Analysis
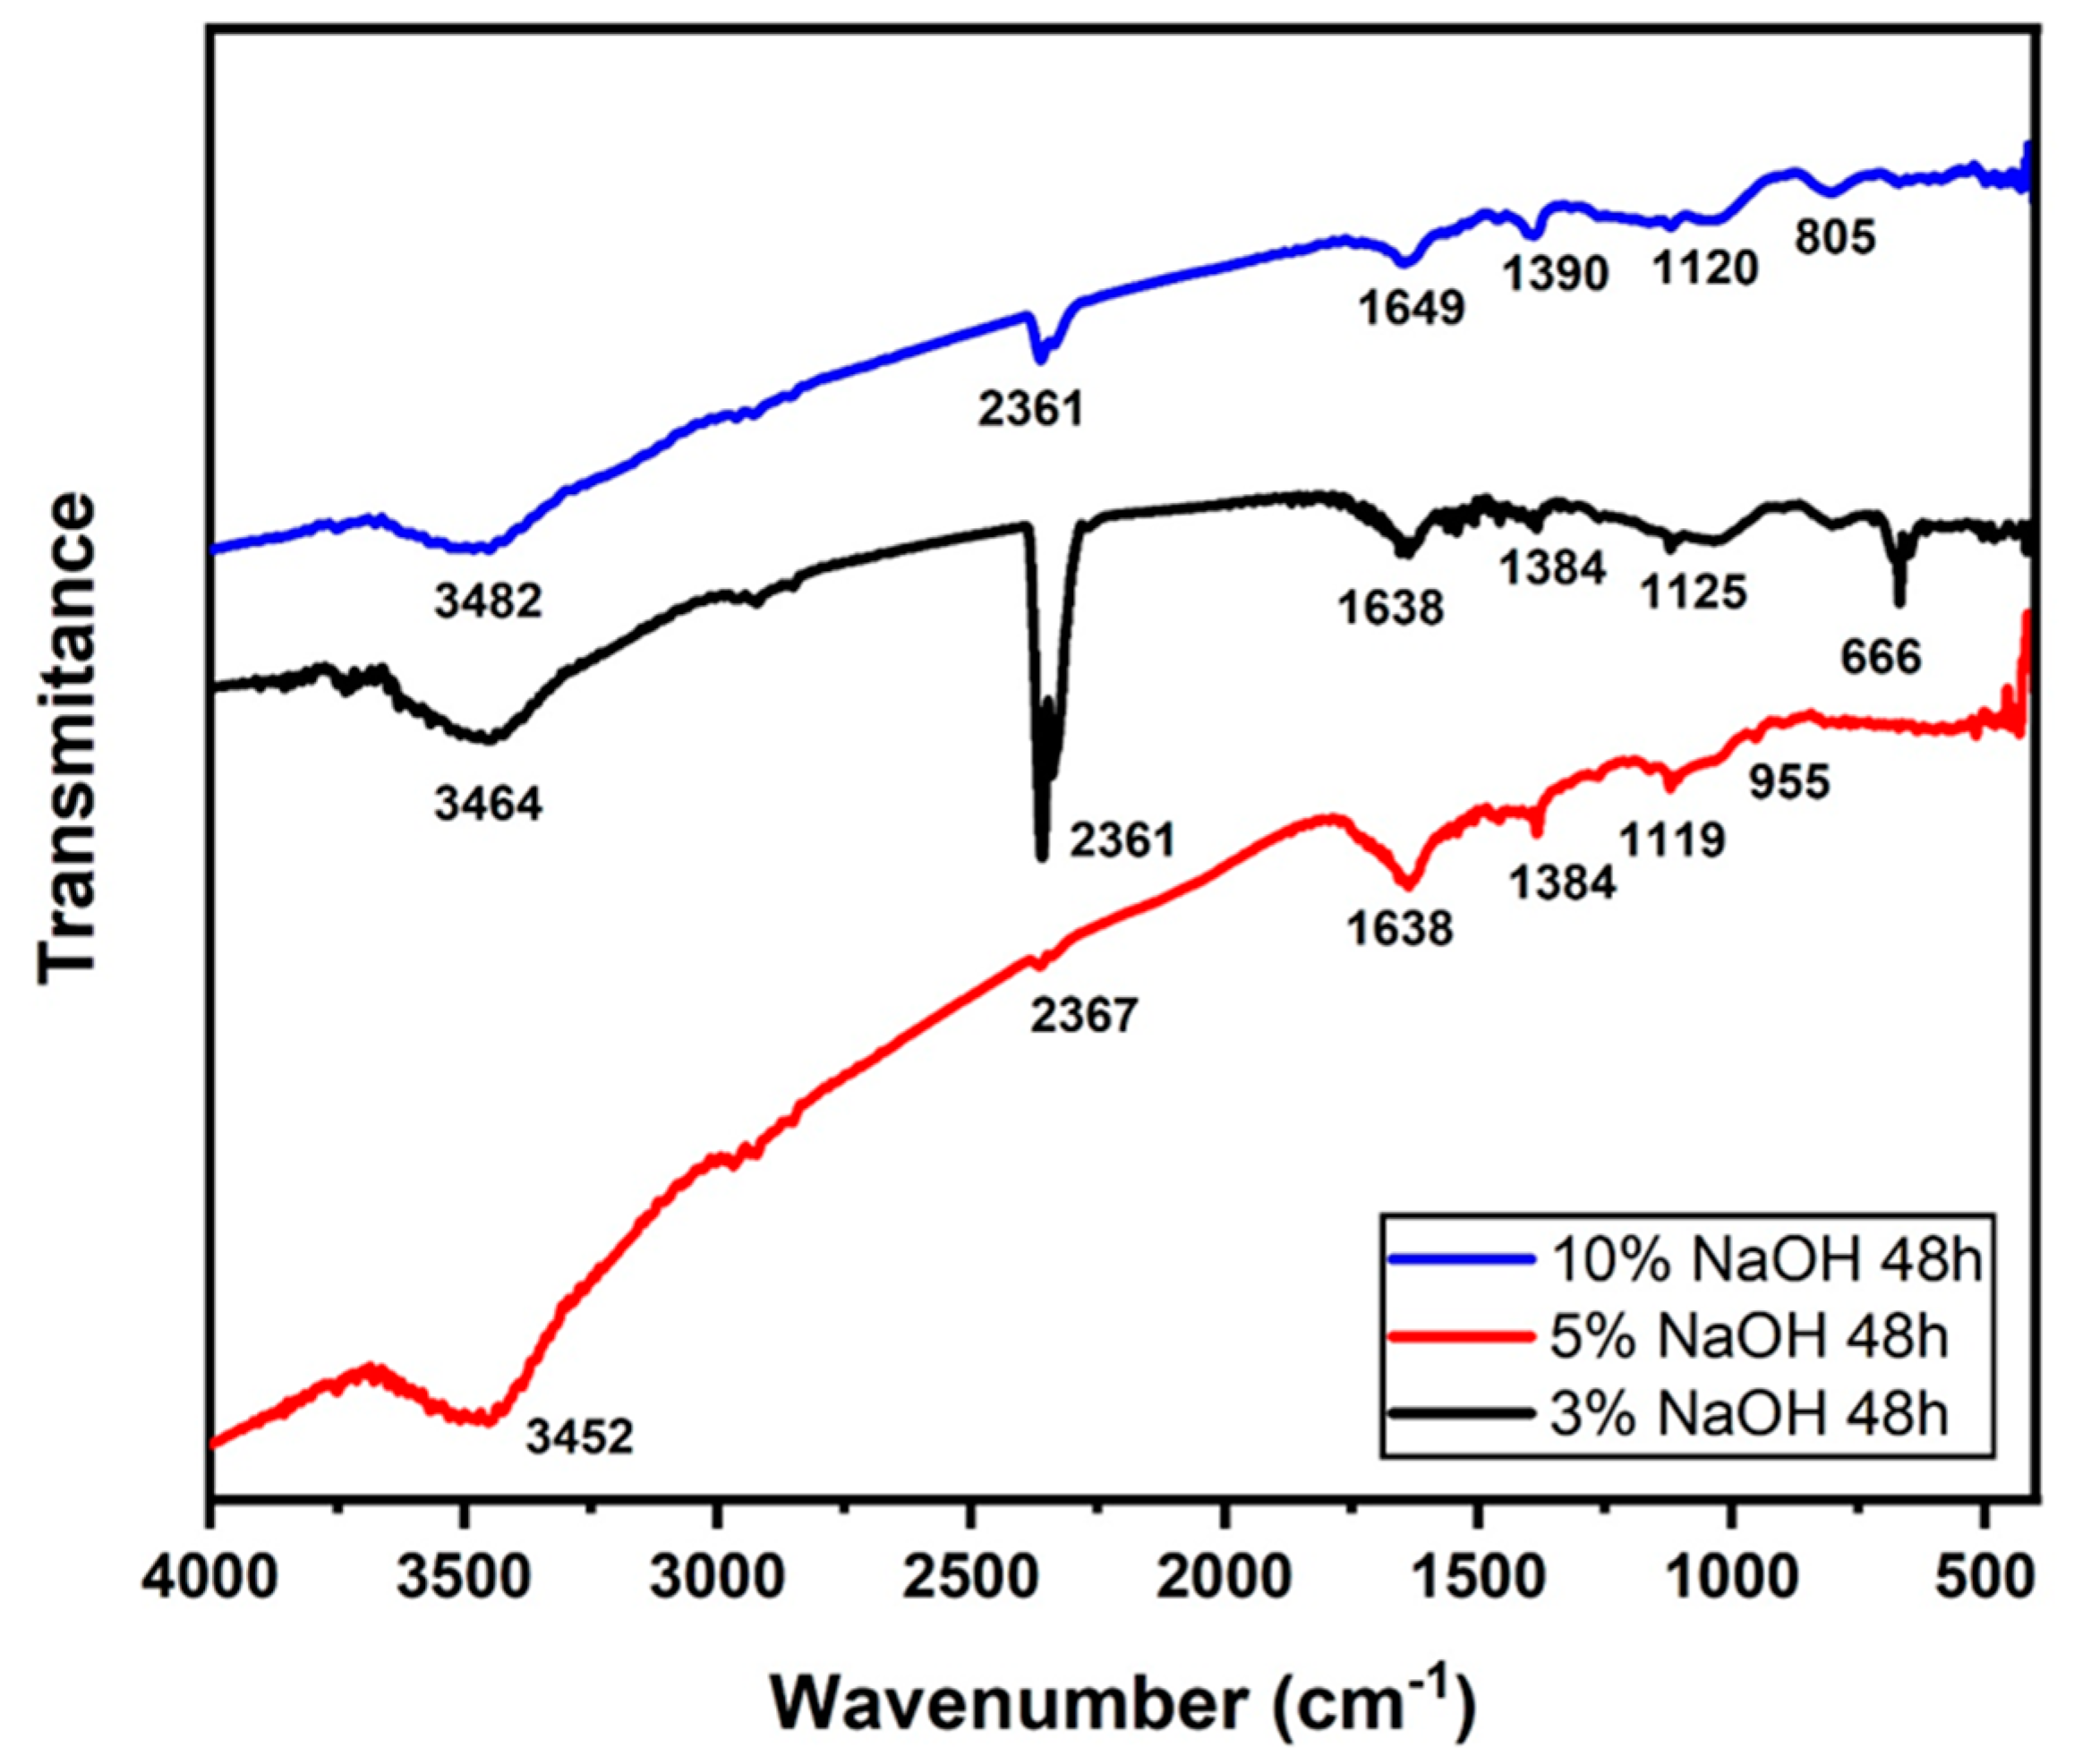
3.3. FTIR Analysis
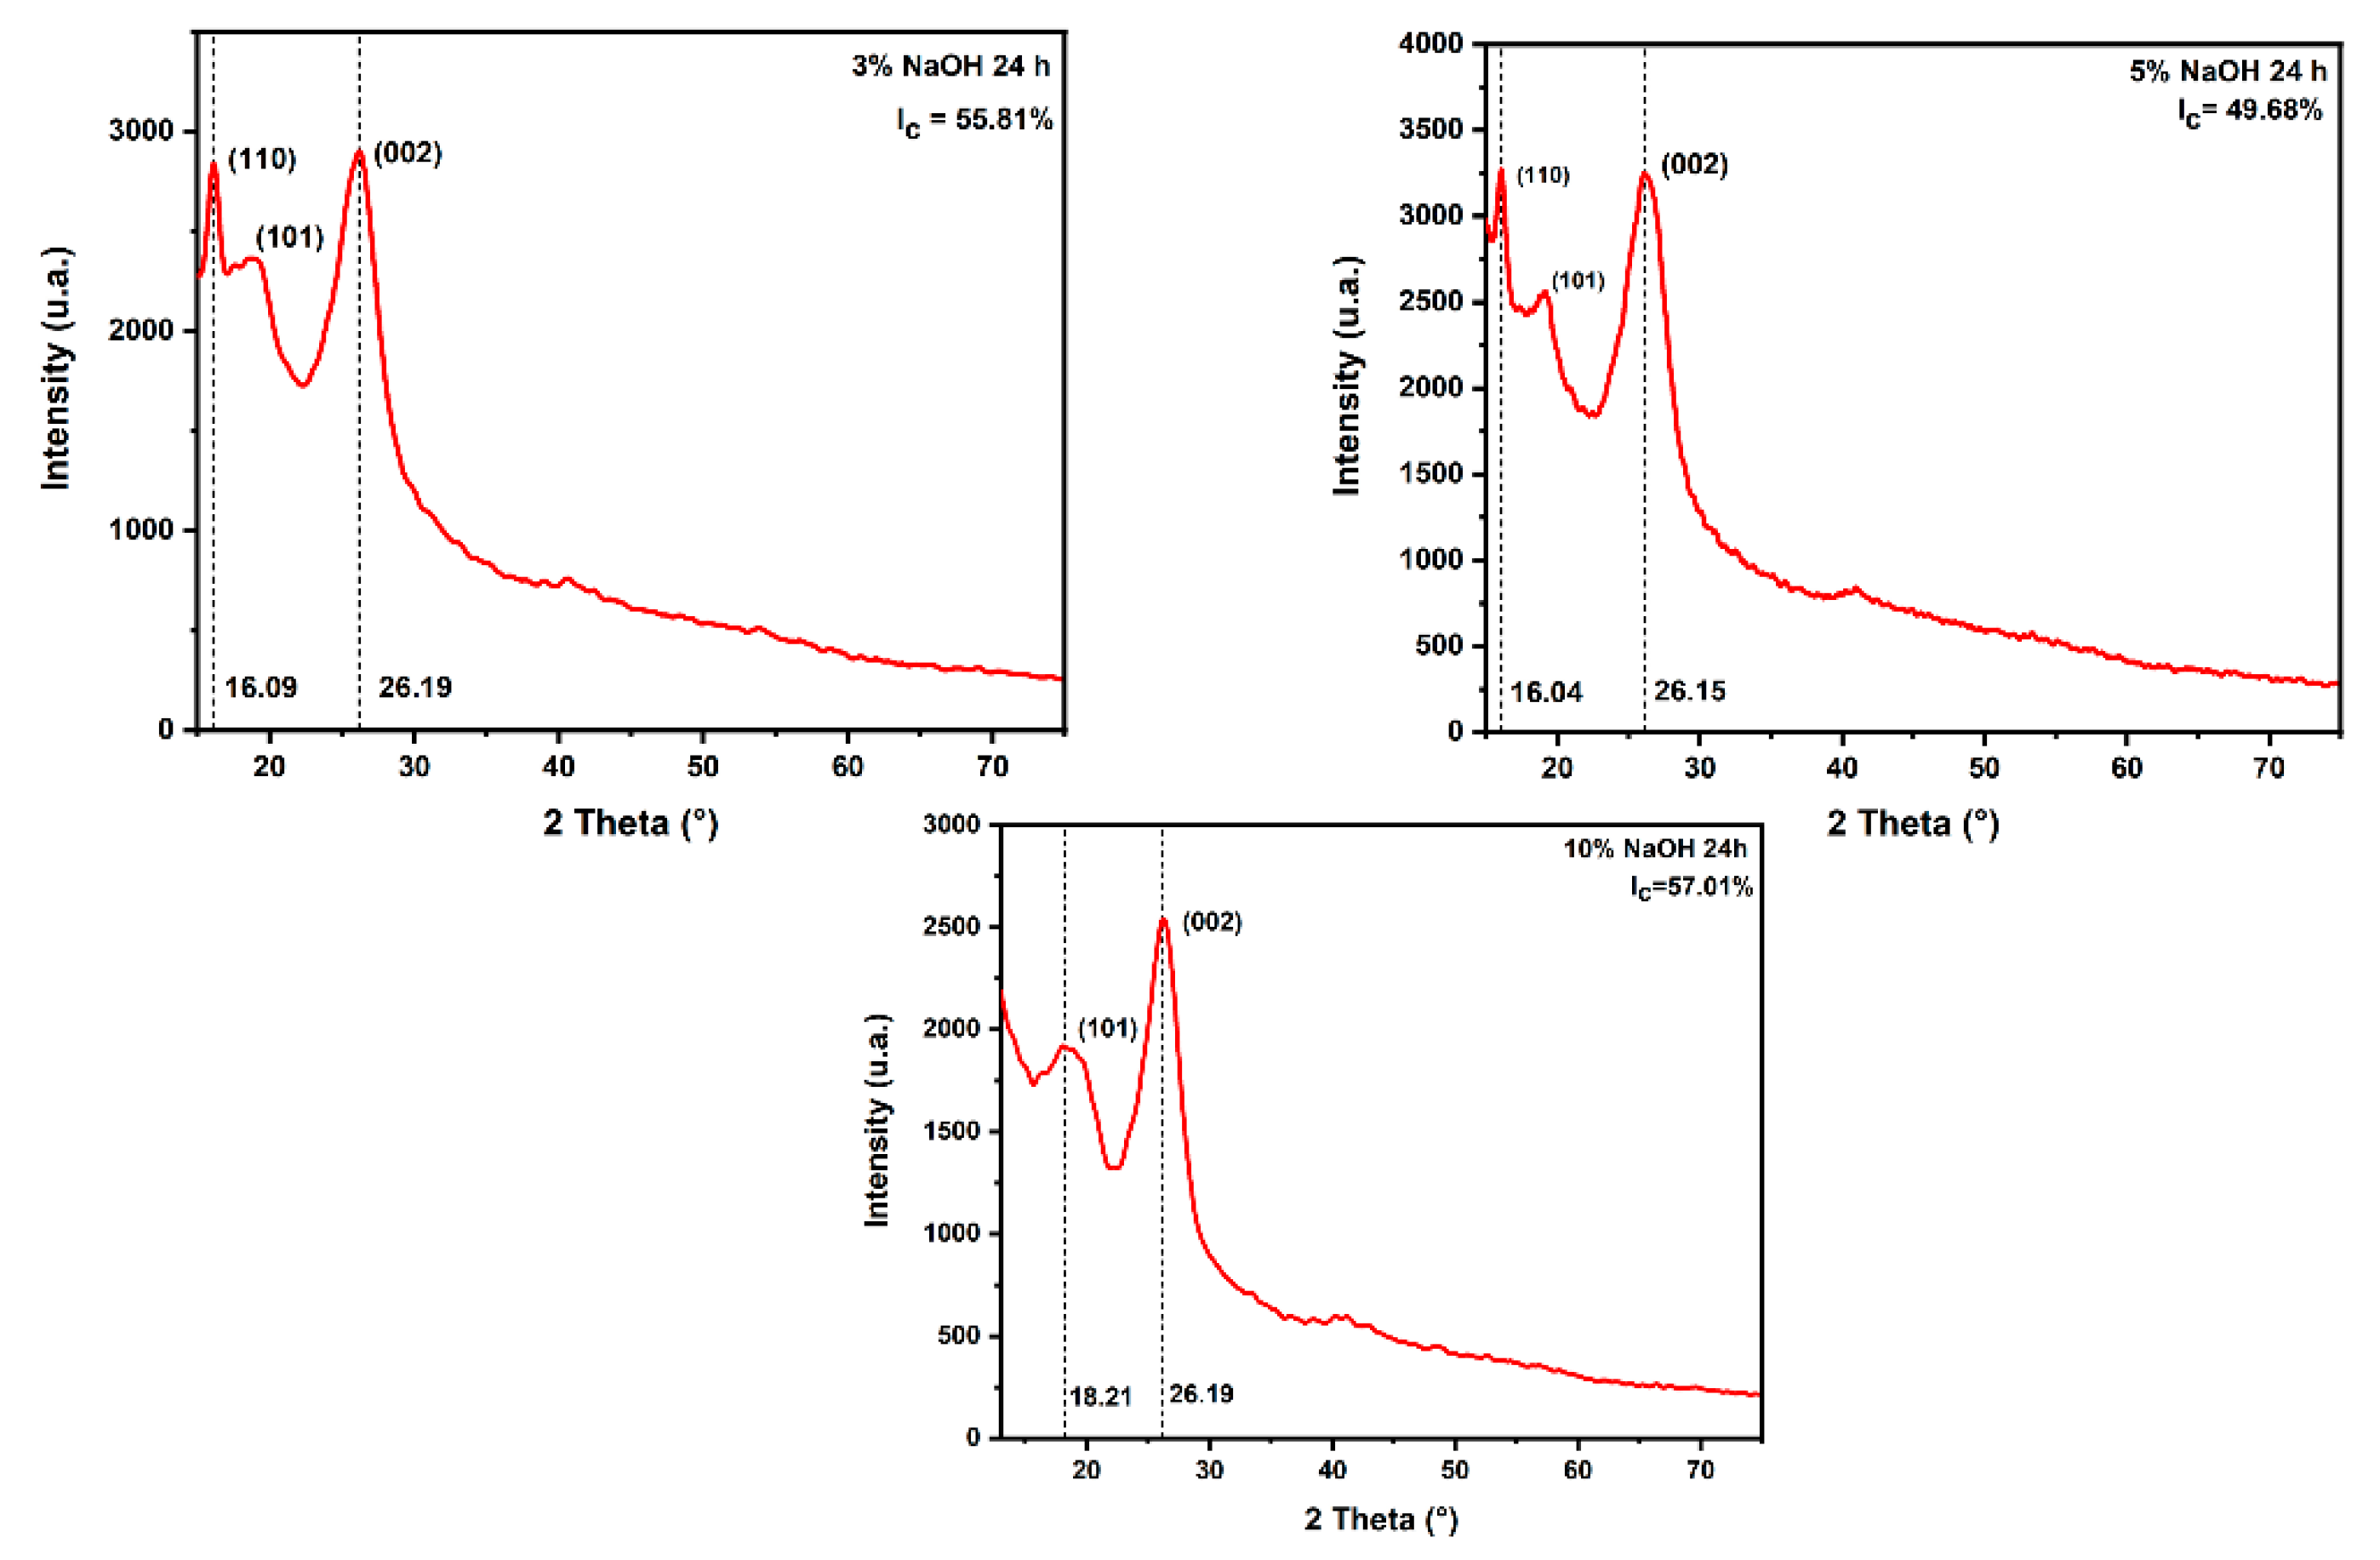
3.4. XRD Analysis
3.5. Morphological Analysis
4. Conclusions
Author Contributions
Funding
Data Availability Statement
Acknowledgments
Conflicts of Interest
References
- Rocha, D.L.; Júnior, L.U.D.T.; Marvila, M.T.; Pereira, E.C.; Souza, D.; Azevedo, A.R.G. A Review of the Use of Natural Fibers in Cement Composites: Concepts, Applications and Brazilian History. Polymers 2022, 14, 2043. [Google Scholar] [CrossRef] [PubMed]
- Hasan, A.; Rabbi, M.S.; Billah, M.M. Making the Lignocellulosic Fibers Chemically Compatible for Composites: A Comprehensive Review. Clean. Mater. 2022, 4, 100078. [Google Scholar] [CrossRef]
- Li, M.; Pu, Y.; Thomas, V.M.; Yoo, C.G.; Ozcan, S.; Deng, Y.; Nelson, K.; Ragauskas, A. Recent Advancements of Plant-Based Natural Fiber-Reinforced Composites and Their Applications. Compos. Part B 2020, 20, 108254. [Google Scholar] [CrossRef]
- Raj, A.M.K.; Muthusamy, S.; Panchal, H.; Ibrahim, M.A.M.; Alsoufi, M.S. Investigation of Mechanical Properties of Dual-Fiber Reinforcement in Polymer Composite. J. Mater. Res. 2022, 18, 3908–3915. [Google Scholar]
- Hasan, K.M.F.; Horváth, P.G.; Alpár, T. Development of Lignocellulosic Fiber Reinforced Cement Composite Panels Using Semi-Dry Technology. Cellulose 2021, 28, 3631–3645. [Google Scholar] [CrossRef]
- Lopes, M.D.M.; Pádua, M.S.; Carvalho, J.P.R.G.; Simonassi, N.T.; Lopez, F.P.D.; Colorado, H.A.; Vieira, C.M.F. Natural Based Polyurethane Matrix Composites Reinforced with Bamboo Fiber Waste for use as Oriented Strand Board. J. Mater. Res. 2021, 12, 2317–2324. [Google Scholar] [CrossRef]
- Rangappa, S.M.; Siengchin, S.; Parameswaranpillai, J.; Jawaid, M.; Ozbakkaloglu, T. Lignocellulosic Fiber Reinforced Composites: Progress, Performance, Properties, Applications, and Future Perspectives. Polym. Compos. 2021, 43, 645–691. [Google Scholar] [CrossRef]
- Haba, B.; Benali, F.; Jawaid, M.; Leão, A.L. A Review on Gypsum-Based Composites Reinforced With Palm Fibers in Construction Applications. Int. J. Thermophys. 2022, 43, 164. [Google Scholar] [CrossRef]
- Dunne, R.; Desai, D.; Sadiku, R.; Jayaramudu, J. A review of Natural Fibres, their Sustainability and Automotive Applications. J. Reinf. Plast. Compos. 2016, 35, 1041–1050. [Google Scholar] [CrossRef]
- Potluri, R.; Krishna, N.C. Potential and Applications of Green Composites in Industrial Space. Mater. Today Proc. 2020, 22, 2041–2048. [Google Scholar] [CrossRef]
- Nurazzi, N.M.; Asyraf, M.R.M.; Khalina, A.; Abdullah, N.; Aisyah, H.A.; Rafiqah, S.A.; Sabaruddin, F.A.; Kamarudin, S.H.; Norrrahim, M.N.F.; Ilyas, R.A.; et al. A Review on Natural Fiber Reinforced Polymer Composite for Bullet Proof and Ballistic Applications. Polymers 2021, 13, 646. [Google Scholar] [CrossRef] [PubMed]
- Asyraf, M.Z.; Suriani, M.J.; Ruzaidi, M.C.; Khalina, A.; Ilyas, R.A.; Asyraf, M.R.M.; Syamsir, A.; Azmi, A.; Mohamed, A. Development of Natural Fibre-Reinforced Polymer Composites Ballistic Helmet Using Concurrent Engineering Approach: A Brief Review. Sustainability 2022, 14, 7092. [Google Scholar] [CrossRef]
- Doddamani, S.; Kulkarni, S.M.; Joladarashi, S.; Kumar, M.T.S.; Gurjar, A.K. Analysis of Light Weight Natural Fiber Composites Against Ballistic Impact: A Review. Int. J. Lightweight Mater. Manuf. 2023, 6, 450–468. [Google Scholar] [CrossRef]
- Bledzki, A.K.; Gassan, J. Composites Reinforced with Cellulose Based Fibres. Prog. Polym. Sci. 1999, 24, 221–274. [Google Scholar] [CrossRef]
- Monteiro, S.N.; Lopes, F.P.D.; Barbosa, A.P.; Bevitori, A.B.; Silva, I.L.A.; Costa, L.L. Natural Lignocellulosic Fibers as Engineering Materials—Na Overview. Metall. Mater. Trans. A 2011, 42, 2963–2974. [Google Scholar] [CrossRef]
- Jayamani, E.; Loong, T.G.; Bakri, M.K.B. Comparative Study of Fourier Transform Infrared Spectroscopy (FTIR) Analysis of Natural Fibres Treated with Chemical, Physical and Biological Methods. Polym. Bull. 2020, 77, 1605–1629. [Google Scholar] [CrossRef]
- Rajendran, M.; Bakthavatchalam, K.; Bharathi, S.M.L. Review on the Hybridized Application of Natural Fiber in the Development of Geopolymer Concrete. J. Nat. Fibers 2023, 20, 2178578. [Google Scholar] [CrossRef]
- Panaitescu, D.M.; Vuluga, Z.; Sanporean, C.G.; Nicolae, C.A.; Gabor, A.R.; Trusca, R. High Flow Polypropylene/SEBS Composites Reinforced with Differently Treated Hemp Fibers for Injection Molded Parts. Compos. Part B 2019, 174, 107062. [Google Scholar] [CrossRef]
- George, J.; Sreekala, M.S.; Thomas, S. A review on Interface Modification and Characterization of Natural Fiber Reinforced Plastic Composites. Polym. Eng. Sci. 2004, 41, 1471–1485. [Google Scholar] [CrossRef]
- Alharbi, M.A.; Hirai, S.; Tuan, H.A.; Akioka, S.; Shoji, W. Dataset on Mechanical, Thermal and Structural Characterization of Plant Fiber-Based Biopolymers Prepared by Hot-Pressing Raw Cocunut Coir, and Milled Powders of Cotton, Waste Bagasse, Wood, and Bamboo. Data Brief 2020, 30, 105510. [Google Scholar] [CrossRef]
- Shahril, S.M.; Ridzuan, M.J.M.; Majid, M.S.A.; Bariah, A.M.N.; Rahman, M.T.A.; Narayanasamy, P. Alkali Treatment Influence on Cellulosic Fiber from Furcraea foetida Leaves as Potential Reinforcement of Polymeric Composites. J. Mater. Res. Technol. 2022, 19, 2567–2583. [Google Scholar] [CrossRef]
- Assefa, A.G.; Kiflie, Z.; Demsash, H.D. Valorization of Abundantly Available Ethiopian Teff (Eragrostis Tef) Straw for the Isolation of Cellulose Fibrils by Alkaline Hydrogen Peroxide Treatment Method. J. Polym. Environ. 2022, 31, 900–912. [Google Scholar] [CrossRef]
- Bonnet-Masimbert, P.-A.; Gauvin, F.; Brouwers, H.J.H.; Amziane, S. Study of Modifications on the Chemical and Mechanical Compatibility between Cement Matrix and oil Palm Fibres. Results Eng. 2020, 7, 100150. [Google Scholar] [CrossRef]
- Bartos, A.; Anggono, J.; Farkas, A.E.; Kun, D.; Soetaredjo, F.E.; Móczo, J.; Antoni; Purwaningsih, H.; Pukánszky, B. Alkali Treatment of Lignocellulosic Fibers Extracted from Sugarcane Bagasse: Composition, Structure, Properties. Polym. Test. 2020, 88, 106549. [Google Scholar] [CrossRef]
- Darus, S.A.A.Z.M.; Ghazali, M.J.; Azhari, C.H.; Zulkifli, R.; Shamsuri, A.A.; Sarac, H.; Mustafa, M.T. Physicochemical and Thermal Properties of Lignocellulosic Fiber from Gigantochloa Scortechinii Bamboo: Effect of Steam Explosion Treatment. Fibers Polym. 2020, 21, 2186–2194. [Google Scholar] [CrossRef]
- Loganathan, T.M.; Sultan, M.T.H.; Ahsan, Q.; Jawaid, M.; Naveen, J.; Shah, A.U.M.; Hua, L.S. Characterization of Alkali Treated New Cellulosic Fibre from Cyrtostachys renda. J. Mater. Res. Technol. 2020, 9, 3537–3546. [Google Scholar] [CrossRef]
- Salih, A.A.; Zulkifli, R.; Azhari, C.H. Tensile Properties and Microstructure of Single-Cellulosic Bamboo Fiber Strips after Alkali Treatment. Fibers 2020, 8, 26. [Google Scholar] [CrossRef]
- Li, X.; Tabil, L.G.; Panigrahi, S. Chemical Treatments of Natural Fiber for Use in Natural Fiber-Reinforced Composites: A Review. J. Polym. Environ. 2007, 15, 25–33. [Google Scholar] [CrossRef]
- Jacob, M.; Thomas, S.; Varughese, K.T. Mechanical Properties of Sisal/Oil Palm Hybrid Fiber Reinforced Natural Rubber Composites. Compos. Sci. Technol. 2004, 64, 955–965. [Google Scholar] [CrossRef]
- Mishra, S.; Mohanty, A.K.; Drzal, L.T.; Misra, M.; Parija, S.; Nayak, S.K.; Tripathy, S.S. Studies on Mechanical Perfomance of Biofibre/Glass Reinforced Polyester Hybrid Composites. Compos. Sci. Technol. 2003, 63, 1377–1385. [Google Scholar] [CrossRef]
- Kalia, S.; Kaith, B.S.; Kaur, I. Pretreatments of Natural Fibers and Their Applications as Reinforcing Material in Polymer Composites—A Review. Polym. Eng. Sci. 2009, 49, 1253–1272. [Google Scholar] [CrossRef]
- Rajesh, G.; Prasad, A.V.R.; Gupta, A.V.S.S.K.S. Water Absorption Characteristics of Successive Alkali Treated Jute/ Polylactic Acid Composites. Mater. Today Proc. 2018, 5, 24414–24421. [Google Scholar] [CrossRef]
- Ohijeagbon, I.O.; Bello-Ochende, M.U.; Adeleke, A.A.; Ikubanni, P.P.; Samuel, A.A.; Lasode, O.A.; Atoyebi, O.D. Physico-Mechanical Properties of Cement Bonded Ceiling Board Developed from Teak and African Locust Bean Tree Wood Residue. Mater. Today Proc. 2021, 44, 2865–2873. [Google Scholar] [CrossRef]
- Yan, L.; Chouw, N.; Huang, L.; Kasal, B. Effect of Alkali Treatment on Microstructure and Mechanical Properties of Coir Fibres, Coir Fibre Reinforced-Polymer Composites and Reinforced-Cementitious Composites. Constr. Build. Mater. 2016, 112, 168–182. [Google Scholar] [CrossRef]
- Neuba, L.M.; Junio, R.F.P.; Ribeiro, M.P.; Souza, A.T.; Lima, E.S.; Filho, F.C.G.; Figueiredo, A.B.-H.S.; Braga, F.O.; Azevedo, A.R.G.; Monteiro, S.N. Promising Mechanical, Thermal, and Ballistic Properties of Novel Epoxy Composites Reinforced with Cyperus malaccensis Sedge Fiber. Polymers 2020, 12, 1776. [Google Scholar] [CrossRef] [PubMed]
- Neuba, L.M.; Pereira, A.C.; Junio, R.F.P.; Souza, A.T.; Chaves, Y.S.; Oliveira, M.P.; Monteiro, S.N. Ballistic Performance of Cyperus malaccensis Sedge Fibers Reinforcing Epoxy Matrix as a Standalone Target. J. Mater. Res. Technol. 2023, 23, 4367–4375. [Google Scholar] [CrossRef]
- Neuba, L.M.; Junio, R.F.P.; Souza, A.T.; Carvalho, M.T.; Ribeiro, M.E.A.; Lazarus, B.S.; Pereira, A.C.; Monteiro, S.N. Dynamic Mechanical and Thermal Mechanical Analysis of Cyperus malaccensis Sedge Fiber Reinforced GO-Incorporated Epoxy Nanocomposites: A Short Comunnication. J. Mater. Res. Technol. 2023, 24, 1653–1662. [Google Scholar] [CrossRef]
- Neuba, L.M.; Junio, R.F.P.; Ribeiro, M.P.; Souza, A.T.; Ribeiro, M.P.; da Silveira, P.H.P.M.; Silva, T.T.; Pereira, A.C.; Monteiro, S.N. Evaluation of the Change in Density with the Diameter and Thermal Analysis of the Seven-Islands-Sedge Fiber. Polymers 2022, 14, 3687. [Google Scholar] [CrossRef]
- Segal, L.; Creely, J.J.; Martin, A.E.; Conrad, C.M. An Empirical Method for Estimating the Degree of Crystallinity of Native Cellulose Using the X-ray Diffractometer. Text. Res. J. 1959, 29, 786–794. [Google Scholar] [CrossRef]
- Tiwari, Y.M.; Sarangi, S.K. Characterization of Raw and Alkali Treated Cellulosic Grewia Flavescens Natural Fiber. Int. J. Biol. Macromol. 2022, 209, 1933–1942. [Google Scholar] [CrossRef]
- Ismail, F.N.; Radzuan, N.A.M.; Sulong, A.B.; Muhamad, N.; Haron, C.H.C. The Effect of Alkali Treatment on Physical, Mechanical and Thermal Properties of Kenaf Fiber and Polymer Epoxy Composites. Polymers 2021, 13, 2005. [Google Scholar] [CrossRef] [PubMed]
- Kathirselvan, M.; Kumaravel, A.; Arthanarieswaran, V.P.; Saravanakumar, S.S. Characterization of Cellulose Fibers in Thespesia populnea Barks: Influence of Alkali Treatment. Carbohydr. Polym. 2019, 217, 178–189. [Google Scholar] [CrossRef] [PubMed]
- Seki, Y.; Sarikanat, M.; Sever, K.; Durmuskahya, C. Extraxction and Properties of Ferula communis (Chakshir) Fibers as Novel Reinforcement for Composites Materials. Compos. Part B 2013, 44, 517–523. [Google Scholar] [CrossRef]
- Fu, S.; Liu, X. 19—Thermal and Flame Retardancy Properties of Thermoplastics/Natural Fiber Biocomposites; Elsevier: Amsterdam, The Netherlands, 2017; pp. 479–508. [Google Scholar]
- Venugopal, A.; Boominathan, S.K. Physico-Chemical, Thermal and Tensile Properties of Alkali-Treated Acacia Concinna Fiber. J. Nat. Fibers 2022, 19, 3093–3108. [Google Scholar] [CrossRef]
- Chen, H.; Wu, J.; Shi, J.; Zhang, W.; Wang, H. Effect of Alkali Treatment on Microstructure and Thermal Stability of Parenchyma Cell Compared with Bamboo Fiber. Ind. Crops Prod. 2021, 164, 113380. [Google Scholar] [CrossRef]
- Apuzzo, F.; Nucci, L.; Delfino, I.; Portaccio, M.; Minervini, G.; Isola, G.; Serino, I.; Camerlingo, C.; Lepore, M. Applications of Vibrational Spectroscopies in the Qualitative Analysis of Gingival Crevicular Fluid and Perondontal Ligament dring Orthodontic Tooth Movement. J. Clin. Med. 2021, 10, 1405. [Google Scholar] [CrossRef]
- Kunusa, W.R.; Isa, I.; Laliyo, L.A.R.; Iyabu, H. FTIR, XRD and SEM Analysis of Microcrystalline Cellulose (MCC) Fibers from Corncobs in Alkaline Treatment. J. Phys. Conf. Ser. 2017, 1028, 012199. [Google Scholar] [CrossRef]
- Umashankaran, M.; Gopalakrishnan, S. Effect of Sodium Hydroxyde Treatment on Physico-chemical, Thermal, Tensile and Surface Morphological Properties of Pongamia Pinnata L. Bark Fiber. J. Nat. Fibers 2021, 18, 2063–2076. [Google Scholar] [CrossRef]
- Ganapathy, T.; Sathiskumar, R.; Senthamaraikannan, P.; Saravanakumar, S.S.; Khan, A. Characterization of Raw and Alkali Treated New Natural Cellulosic Fibres Extracted from the Aerial Roots of Banyan Tree. Int. J. Biol. Macromol. 2019, 138, 573–581. [Google Scholar] [CrossRef]
- Neuba, L.M.; Junio, R.F.P.; Souza, A.T.; Ribeiro, M.P.; Silveira, P.H.P.M.; Silva, T.T.; Pereira, A.C.; Monteiro, S.N. Mechanical Properties, Critical Length, and Interfacial Strength of Seven-Islands-Sedge Fibers (Cyperus malaccensis) For Possible Epoxy Matrix Reinforcement. Polymers 2022, 14, 3807. [Google Scholar] [CrossRef]


| Parameters | |||
|---|---|---|---|
| NaOH Concentration | Immersion Period | ||
| - | 24 h | 48 h | 72 h |
| 3% | Group 1 | Group 4 | Group 7 |
| 5% | Group 2 | Group 5 | Group 8 |
| 10% | Group 3 | Group 6 | Group 9 |
| Conditions | Mass Loss | Initial Degradation (°C) | Maximum Degradation Rate (°C) | |||
|---|---|---|---|---|---|---|
| Up to 200 °C (%) | At the End of the Second Stage (%) | At 600 °C (%) | ||||
| 24 h | 3% | 13.59 | 53.13 | 92.93 | 253.54 | 317.92 |
| 5% | 12.33 | 55.62 | 93.38 | 253.5 | 314.07 | |
| 10% | 12.86 | 57.39 | 94.95 | 244.19 | 310.66 | |
| 48 h | 3% | 14.81 | 60.65 | 86.74 | 255.11 | 315.52 |
| 5% | 15.44 | 58.74 | 95.23 | 255.44 | 311.38 | |
| 10% | 14.12 | 57.94 | 80.54 | 244.17 | 305.17 | |
| 72 h | 3% | 10.9 | 59.33 | 96.05 | 240.12 | 305.77 |
| 5% | 10.78 | 58.41 | 93.29 | 255.94 | 312.32 | |
| 10% | 13.95 | 58.99 | 95.83 | 252.92 | 308.95 | |
| Untreated * | 13.23 | 63.07 | 96.04 | 255.68 | 300.95 | |
| Treatments | Crystallinity Index (%) | Crystallite Size (nm) | Reference | |
|---|---|---|---|---|
| Raw Pongamia pinnata L. | 45.31 | 5.43 | [49] | |
| Alkalized Pongamia pinnata L. | 52.43 | 8.43 | [49] | |
| Raw banyan Fiber | 72.47 | 6.28 | [50] | |
| Alkalized banyan Fiber | 76.35 | 7.74 | [50] | |
| Raw ACF | 27.5 | 4.17 | [45] | |
| Alkalized ACF | 35.6 | 6.43 | [45] | |
| Untreated sedge fibers | 62.47 | 2.56 | [51] | |
| Treatments with Different NaOH Concentrations | Crystallinity Index (%) | Crystallite Size (nm) | Reference | |
| 24 h | 3% | 55.81 | 3.75 | Present work |
| 5% | 49.68 | 3.43 | ||
| 10% | 57.01 | 3.44 | ||
| 48 h | 3% | 66.50 | 10.66 | |
| 5% | 51.24 | 4.09 | ||
| 10% | 39.40 | 6.84 | ||
| 72 h | 3% | 57.21 | 3.66 | |
| 5% | 52.71 | 3.68 | ||
| 10% | 56.4 | 3.89 | ||
Disclaimer/Publisher’s Note: The statements, opinions and data contained in all publications are solely those of the individual author(s) and contributor(s) and not of MDPI and/or the editor(s). MDPI and/or the editor(s) disclaim responsibility for any injury to people or property resulting from any ideas, methods, instructions or products referred to in the content. |
© 2023 by the authors. Licensee MDPI, Basel, Switzerland. This article is an open access article distributed under the terms and conditions of the Creative Commons Attribution (CC BY) license (https://creativecommons.org/licenses/by/4.0/).
Share and Cite
Neuba, L.d.M.; Junio, R.F.P.; Souza, A.T.; Chaves, Y.S.; Tavares, S.; Palmeira, A.A.; Monteiro, S.N.; Pereira, A.C. Alkaline Treatment Investigation for Sedge Fibers (Cyperus malaccensis): A Promising Enhancement. Polymers 2023, 15, 2153. https://doi.org/10.3390/polym15092153
Neuba LdM, Junio RFP, Souza AT, Chaves YS, Tavares S, Palmeira AA, Monteiro SN, Pereira AC. Alkaline Treatment Investigation for Sedge Fibers (Cyperus malaccensis): A Promising Enhancement. Polymers. 2023; 15(9):2153. https://doi.org/10.3390/polym15092153
Chicago/Turabian StyleNeuba, Lucas de Mendonça, Raí Felipe Pereira Junio, Andressa Teixeira Souza, Yago Soares Chaves, Sheron Tavares, Alexandre Alvarenga Palmeira, Sergio Neves Monteiro, and Artur Camposo Pereira. 2023. "Alkaline Treatment Investigation for Sedge Fibers (Cyperus malaccensis): A Promising Enhancement" Polymers 15, no. 9: 2153. https://doi.org/10.3390/polym15092153