
Design of Experiment for Optimizing Microencapsulation by the Solvent Evaporation Technique


 ,
,  ,
, 

Abstract
:
1. Introduction
2. Materials and Methods
2.1. Materials
2.2. Method
2.2.1. Characterization
2.2.2. Experimental Design
3. Results and Discussion
4. Conclusions
Author Contributions
Funding
Data Availability Statement
Conflicts of Interest
References
- Orgilés-Calpena, E.; Arán-Ais, F.; Torró-Palau, A.M.; Sánchez, M. Adhesives in the Footwear Industry: A Critical Review. Rev. Adhes. Adhes. 2019, 7, 69–91. [Google Scholar] [CrossRef]
- Adhesives & Sealants Industry. Polychloroprene Contact Adhesives. Water-Based Systems Make Inroads into Traditional Solvent-Borne Technology. Available online: https://www.adhesivesmag.com/articles/85273-polychloroprene-contact-adhesives (accessed on 19 November 2023).
- Centers for Disease Control and Prevention. The National Institute for Occupational Safety and Health. Isocyanates. Overview. 2008. Available online: https://www.cdc.gov/niosh/topics/isocyanates/default.html (accessed on 19 November 2023).
- ECHA—European Chemicals Agency. ECHA—Annex XVII to REACH—Conditions of Restriction. Restrictions on the Manufacture, Placing on the Market and Use of Certain Dangerous Substances, Mixtures and Articles. Available online: https://echa.europa.eu/documents/10162/503ac424-3bcb-137b-9247-09e41eb6dd5a (accessed on 19 November 2023).
- Loureiro, M.V.; Attaei, M.; Rocha, S.; Vale, M.; Bordado, J.C.; Simões, R.; Pinho, I.; Marques, A.C. The role played by different active hydrogen sources in the microencapsulation of a commercial oligomeric diisocyanate. J. Mater. Sci. 2020, 55, 4607–4623. [Google Scholar] [CrossRef]
- Loureiro, M.V.; Vale, M.; Galhano, R.; Matos, S.; Bordado, J.C.; Pinho, I.; Marques, A.C. Microencapsulation of Isocyanate in Biodegradable Poly(ε-caprolactone) Capsules and Application in Monocomponent Green Adhesives. ACS Appl. Polym. Mater. 2020, 2, 4425–4438. [Google Scholar] [CrossRef]
- Attaei, M.; Loureiro, M.V.; Vale, M.; Condeço, J.; Pinho, I.; Bordado, J.C.; Marques, A.C. Isophorone Diisocyanate (IPDI) Microencapsulation for Mono-Component Adhesives: Effect of the Active H and NCO Sources. Polymers 2018, 10, 825. [Google Scholar] [CrossRef] [PubMed]
- Loureiro, M.V.; Mariquito, A.; Vale, M.; Bordado, J.C.; Pinho, I.; Marques, A.C. Emulsion Stabilization Strategies for Tailored Isocyanate Microcapsules. Polymers 2023, 15, 403. [Google Scholar] [CrossRef]
- Aguiar, A.; Loureiro, M.V.; Pinho, I.; Marques, A.C. Efficient encapsulation of isocyanates in PCL/PLA biodegradable microcapsules for adhesives. J. Mater. Sci. 2023, 58, 2249–2267. [Google Scholar] [CrossRef]
- Yang, J.; Keller, M.W.; Moore, J.S.; White, S.R.; Sottos, N.R. Microencapsulation of Isocyanates for Self-Healing Polymers. Macromolecules 2008, 41, 9650–9655. [Google Scholar] [CrossRef]
- Wang, W.; Xu, L.; Li, X.; Lin, Z.; Yang, Y.; An, E. Self-Healing Mechanisms of Water Triggered Smart Coating in Seawater. J. Mater. Chem. A 2014, 2, 1914–1921. [Google Scholar] [CrossRef]
- Di Credico, B.; Levi, M.; Turri, S. An efficient Method for the Output of New Self-Repairing Materials Through a Reactive Isocyanate Encapsulation. Eur. Polym. J. 2013, 49, 2467–2476. [Google Scholar] [CrossRef]
- Perignon, C.; Ongmayeb, G.; Neufeld, R.; Frere, Y.; Poncelet, D. Microencapsulation by Interfacial Polymerization: Membrane Formation and Structure. J. Microencapsul. 2015, 32, 1–15. [Google Scholar] [CrossRef]
- Ma, Y.; Jiang, Y.; Tan, H.; Zhang, Y.; Gu, J. A Rapid and Efficient Route to Preparation of Isocyanate Microcapsules. Polymers 2017, 9, 274. [Google Scholar] [CrossRef] [PubMed]
- Xiao, Y.; Wu, B.; Fu, X.; Wang, R.; Lei, J. Preparation of Biodegradable Microcapsules Through an Organic Solvent-Free Interfacial Polymerization Method. Polym. Adv. Technol. 2019, 30, 483–488. [Google Scholar] [CrossRef]
- Lu, W.; Meng, Q.; Qin, C.; Li, J.; Qi, G.; Kong, B.; He, Z. Facile and efficient isocyanate microencapsulation via SDBS/PVP synergetic emulsion. J. Appl. Polym. Sci. 2019, 136, 48045. [Google Scholar] [CrossRef]
- Taylor, C.J.; Pomberger, A.; Felton, K.C.; Grainger, R.; Barecka, M.; Chamberlain, T.W.; Bourne, R.A.; Johnson, C.N.; Lapkin, A.A. A Brief Introduction to Chemical Reaction Optimization. Chem. Rev. 2023, 123, 3089–3126. [Google Scholar] [CrossRef] [PubMed]
- Taylor, C.J.; Baker, A.; Chapman, M.R.; Reynolds, W.R.; Jolley, K.E.; Clemens, G.; Smith, G.E.; Blacker, A.J.; Chamberlain, T.W.; Christie, S.D.R.; et al. Flow chemistry for process optimisation using design of experiments. J. Flow Chem. 2021, 11, 75–86. [Google Scholar] [CrossRef]
- Peris-Díaz, M.D.; Sentandreu, M.A.; Sentandreu, E. Multiobjective optimization of liquid chromatography–triple-quadrupole mass spectrometry analysis of underivatized human urinary amino acids through chemometrics. Anal. Bioanal. Chem. 2018, 410, 4275–4284. [Google Scholar] [CrossRef] [PubMed]
- Fu, F.; Hu, L. Advanced High Strength Natural Fibre Composites in Construction, 1st ed.; Woodhead Publishing: Cambridge, UK, 2017. [Google Scholar]
- Sagués, F.; Epstein, I.R. Nonlinear chemical dynamics. Dalton Trans. 2003, 2003, 1201–1217. [Google Scholar] [CrossRef]
- Jankovic, A.; Chaudhary, G.; Goia, F. Designing the design of experiments (DOE)—An investigation on the influence of different factorial designs on the characterization of complex systems. Energy Build. 2021, 250, 111298. [Google Scholar] [CrossRef]
- Kumari, M.; Gupta, S.K. Response surface methodological (RSM) approach for optimizing the removal of trihalomethanes (THMs) and its precursor’s by surfactant modified magnetic nanoadsorbents (sMNP)—An endeavor to diminish probable cancer risk. Sci. Rep. 2019, 9, 18339. [Google Scholar] [CrossRef]
- Rajkumar, K.; Muthukumar, M. Response surface optimization of electro-oxidation process for the treatment of C.I. Reactive Yellow 186 dye: Reaction pathways. Appl. Water Sci. 2017, 7, 637–652. [Google Scholar] [CrossRef]
- Paulo, F.; Santos, L. Design of experiments for microencapsulation applications: A review. Mater. Sci. Eng. C Mater. Biol. Appl. 2017, 77, 1327–1340. [Google Scholar] [CrossRef] [PubMed]
- Lock, A.T.; Seekell, R.P.; Vutha, A.; Kheir, J.N.; Polizzotti, B.D. Using design of experiments to understand and predict polymer microcapsule core-shell architecture. J. Appl. Polym. Sci. 2020, 138, 50100. [Google Scholar] [CrossRef]
- Carvalho, A.C.M.; Ferreira, E.P.C.; Bomio, M.; Melo, J.D.D.; Barbosa, A.P.C.; Costa, M.C.B. Influence of synthesis parameters on properties and characteristics of poly (urea-formaldehyde) microcapsules for self-healing applications. J. Microencapsul. 2019, 36, 410–419. [Google Scholar] [CrossRef] [PubMed]
- Grandhi, S.; Ramana, G.; Siddanathi, R.; Potti, L.; Pathuri, R.; Samineni, R. Study on Influence of Process Parameters On Quality Of Lovastatin Microspheres By Design Of Experiments. J. Pharm. Negat. Results 2022, 13, 1799–1810. [Google Scholar] [CrossRef]
- Rai, S.; Ravikumar, P. Development and Evaluation of Microsphere-based Topical Formulation using Design of Experiments. Indian J. Pharm. Sci. 2016, 78, 182–192. [Google Scholar] [CrossRef]
- Javidi, M.; Fathi Fathabadi, H.; Jenabali Jahromi, S.A.; Khorram, M. Investigating the interfacial synthesis of polyurethane microcapsules and optimization of the process using response surface method. Mater. Res. Express 2019, 6, 105302. [Google Scholar] [CrossRef]
- Schindelin, J.; Arganda-Carreras, I.; Frise, E.; Kaynig, V.; Longair, M.; Pietzsch, T.; Preibisch, S.; Rueden, C.; Saalfeld, S.; Schmid, B.; et al. Fiji: An open-source platform for biological-image analysis. Nat. Methods 2012, 9, 676–682. [Google Scholar] [CrossRef] [PubMed]
- ISO 20344; Personal Protective Equipment—Test methods for Footwear. ISO: Geneva, Switzerland, 2021.
- Ye, G.; Ma, L.; Li, L.; Liu, J.; Yuan, S.; Huang, G. Application of Box–Behnken design and response surface methodology for modeling and optimization of batch flotation of coal. Int. J. Coal Prep. Util. 2020, 40, 131–145. [Google Scholar] [CrossRef]
- Akkaya, G.K.; Öden, M.K. Optimization of the effect of copper electrodes on the removal efficiency of 4-clorophenol from aqueous solution by electrocoagulation. Environ. Sci. Technol. 2022, 5, 33–43. [Google Scholar] [CrossRef]
- Tamara, D.H.; Dokić, P.; Krstonošić, V.; Hadnađev, M. Influence of oil phase concentration on droplet size distribution and stability of oil-in-water emulsions. Eur. J. Lipid Sci. Technol. 2013, 115, 313–321. [Google Scholar] [CrossRef]
- Taherian, A.R.; Fustier, P.; Ramaswamy, H.S. Effect of added oil and modified starch on rheological properties, droplet size distribution, opacity and stability of beverage cloud emulsions. J. Food Eng. 2006, 77, 687–696. [Google Scholar] [CrossRef]
- Wang, B.; Tian, H.; Xiang, D. Stabilizing the Oil-in-Water Emulsions Using the Mixtures of Dendrobium Officinale Polysaccharides and Gum Arabic or Propylene Glycol Alginate. Molecules 2020, 25, 759. [Google Scholar] [CrossRef]
- Niu, F.; Niu, D.; Zhang, H.; Chang, C.; Gu, L.; Su, Y.; Yang, Y. Ovalbumin/gum arabic-stabilized emulsion: Rheology, emulsion characteristics, and Raman spectroscopic study. Food Hydrocoll. 2016, 52, 607–614. [Google Scholar] [CrossRef]
- Costa, C.; Medronho, B.; Filipe, A.; Mira, I.; Lindman, B.; Edlund, H.; Norgren, M. Emulsion Formation and Stabilization by Biomolecules: The Leading Role of Cellulose. Polymers 2019, 11, 1570. [Google Scholar] [CrossRef] [PubMed]
- Walstra, P. Physical Chemistry of Foods, 1st ed.; CRC Press: Boca Raton, FL, USA, 2001. [Google Scholar]
- Huang, M.; Yang, J. Facile microencapsulation of HDI for self-healing anticorrosion coatings. J. Mater. Chem. 2011, 21, 11123–11130. [Google Scholar] [CrossRef]
- Dennison, T.J.; Smith, J.; Hofmann, M.P.; Bland, C.E.; Badhan, R.K.; Al-Khattawi, A.; Mohammed, A.R. Design of Experiments to Study the Impact of Process Parameters on Droplet Size and Development of Non-Invasive Imaging Techniques in Tablet Coating. PLoS ONE 2016, 11, e0157267. [Google Scholar] [CrossRef] [PubMed]
- Meybodi, N.M.; Mohammadifar; Abdolmaleki, K. Effect of Dispersed Phase Volume Fraction on Physical Stability of Oil-in-Water Emulsion in The Presence of Gum Tragacanth. J. Food Qual. Hazards Control 2014, 1, 102–107. [Google Scholar]
- Mirhosseini, H.; Tan, C.P.; Hamid, N.S.A.; Yusof, S. Optimization of the contents of Arabic gum, xanthan gum and orange oil affecting turbidity, average particle size, polydispersity index and density in orange beverage emulsion. Food Hydrocoll. 2008, 22, 1212–1223. [Google Scholar] [CrossRef]
- Ferguson, P.D.; Shaw, R.; McCudden, A.; Elliot, C.; Welham, M.; McAlpine, V.; Castel, C.; Armstrong, T.; Yang, Q.; Qiu, W. Improving Robustness of Pharmaceutical Dosage form Sample Preparation Using Experimental Design and Process Understanding Tools. Chromatographia 2020, 83, 1525–1538. [Google Scholar] [CrossRef]
- Yu, X.; Wang, N.; Lv, S. Crystal and multiple melting behaviors of PCL lamellae in ultrathin films. J. Cryst. Growth 2016, 438, 11–18. [Google Scholar] [CrossRef]
- Smith, B.C. The carbonyl group, part I: Introduction. Spectroscopy 2017, 32, 31–36. [Google Scholar]
- Delpech, M.C.; Miranda, G.S. Waterborne polyurethanes: Influence of chain extender in ftir spectra profiles. Cent. Eur. J. Eng. 2012, 2, 231–238. [Google Scholar] [CrossRef]
- Smith, B.C. Infrared Spectral Interpretation: A Systematic Approach, 1st ed.; CRC Press: Boca Raton, FL, USA, 1998. [Google Scholar]
- Paiva, R.M.M.; Marques, E.A.S.; da Silva, L.F.M.; António, C.A.C.; Arán-Ais, F. Adhesives in the footwear industry. Proc. IMechE Part L J. Mater. Des. Appl. 2015, 230, 357–374. [Google Scholar] [CrossRef]
- EN 15307:2014; Adhesives for Leather and Footwear Materials. Sole-Upper Bonds. Minimum Strength Requirements. British-Adopted European Standard: London, UK, 2014.
- Jiang, W.; Hosseinpourpia, R.; Biziks, V.; Ahmed, S.A.; Militz, H.; Adamopoulos, S. Preparation of Polyurethane Adhesives from Crude and Purified Liquefied Wood Sawdust. Polymers 2021, 13, 3267. [Google Scholar] [CrossRef]
- Lee, J.-H.; Lee, T.-H.; Shim, K.-S.; Park, J.-W.; Kim, H.-J.; Kim, Y.; Jung, S. Effect of crosslinking density on adhesion performance and flexibility properties of acrylic pressure sensitive adhesives for flexible display applications. Int. J. Adhes. Adhes. 2017, 74, 137–143. [Google Scholar] [CrossRef]


| Independent Variables | Abbreviation | Factors | Coded Levels | ||
|---|---|---|---|---|---|
| −1 | 0 | 1 | |||
| PVA concentration % (w/w) | PVAc | 2 | 3 | 4 | |
| GA concentration % (w/w) | GAc | 0 | 1.75 | 3.5 | |
| O phase volume % (v/v) | V.r. | 28 | 33.5 | 39 | |
| Experimental Run | Experimental Parameters | Response | ||
|---|---|---|---|---|
| W Phase | V.r. (% w/w) | MCs Size (µm) | ||
| PVAc (% w/w) | GAc (% w/w) | |||
| N1 | 2 | 0 | 28 | Y1 |
| N2 | 4 | 0 | 28 | Y2 |
| N3 | 2 | 3.5 | 28 | Y3 |
| N4 | 4 | 3.5 | 28 | Y4 |
| N5 | 2 | 0 | 39 | Y5 |
| N6 | 4 | 0 | 39 | Y6 |
| N7 | 2 | 3.5 | 39 | Y7 |
| N8 | 4 | 3.5 | 39 | Y8 |
| N9 | 2 | 1.75 | 33.5 | Y9 |
| N10 | 4 | 1.75 | 33.5 | Y10 |
| N11 | 3 | 0 | 33.5 | Y11 |
| N12 | 3 | 3.5 | 33.5 | Y12 |
| N13 | 3 | 1.75 | 28 | Y13 |
| N14 | 3 | 1.75 | 39 | Y14 |
| N15 | 3 | 1.75 | 33.5 | Y15 |
| N16 | 3 | 1.75 | 33.5 | Y16 |
| N17 | 3 | 1.75 | 33.5 | Y17 |
| Experimental Run | Experimental Parameters | Response | Encapsulated Isocyanate (wt%) (As-Prepared MCs) * | Encapsulated Isocyanate (wt%) (after 3 Months) * | ||
|---|---|---|---|---|---|---|
| PVAc (% w/w) | GAc (% w/w) | V.r. (% w/w) | MCs Size (µm) | |||
| N1 | 2 | 0 | 28 | 155.1 ± 74.5 | 58.3 | 41.4 |
| N2 | 4 | 0 | 28 | 41.4 ± 15.8 | 57.9 | 40.6 |
| N3 | 2 | 3.5 | 28 | 109.1 ± 33.1 | 58.8 | 48.7 |
| N4 | 4 | 3.5 | 28 | 46.5 ± 14.2 | 57.4 | 38.9 |
| N5 | 2 | 0 | 39 | 172.6 ± 83.6 | 59.6 | 52.3 |
| N6 | 4 | 0 | 39 | 82.8 ± 23 | 57.7 | 41.2 |
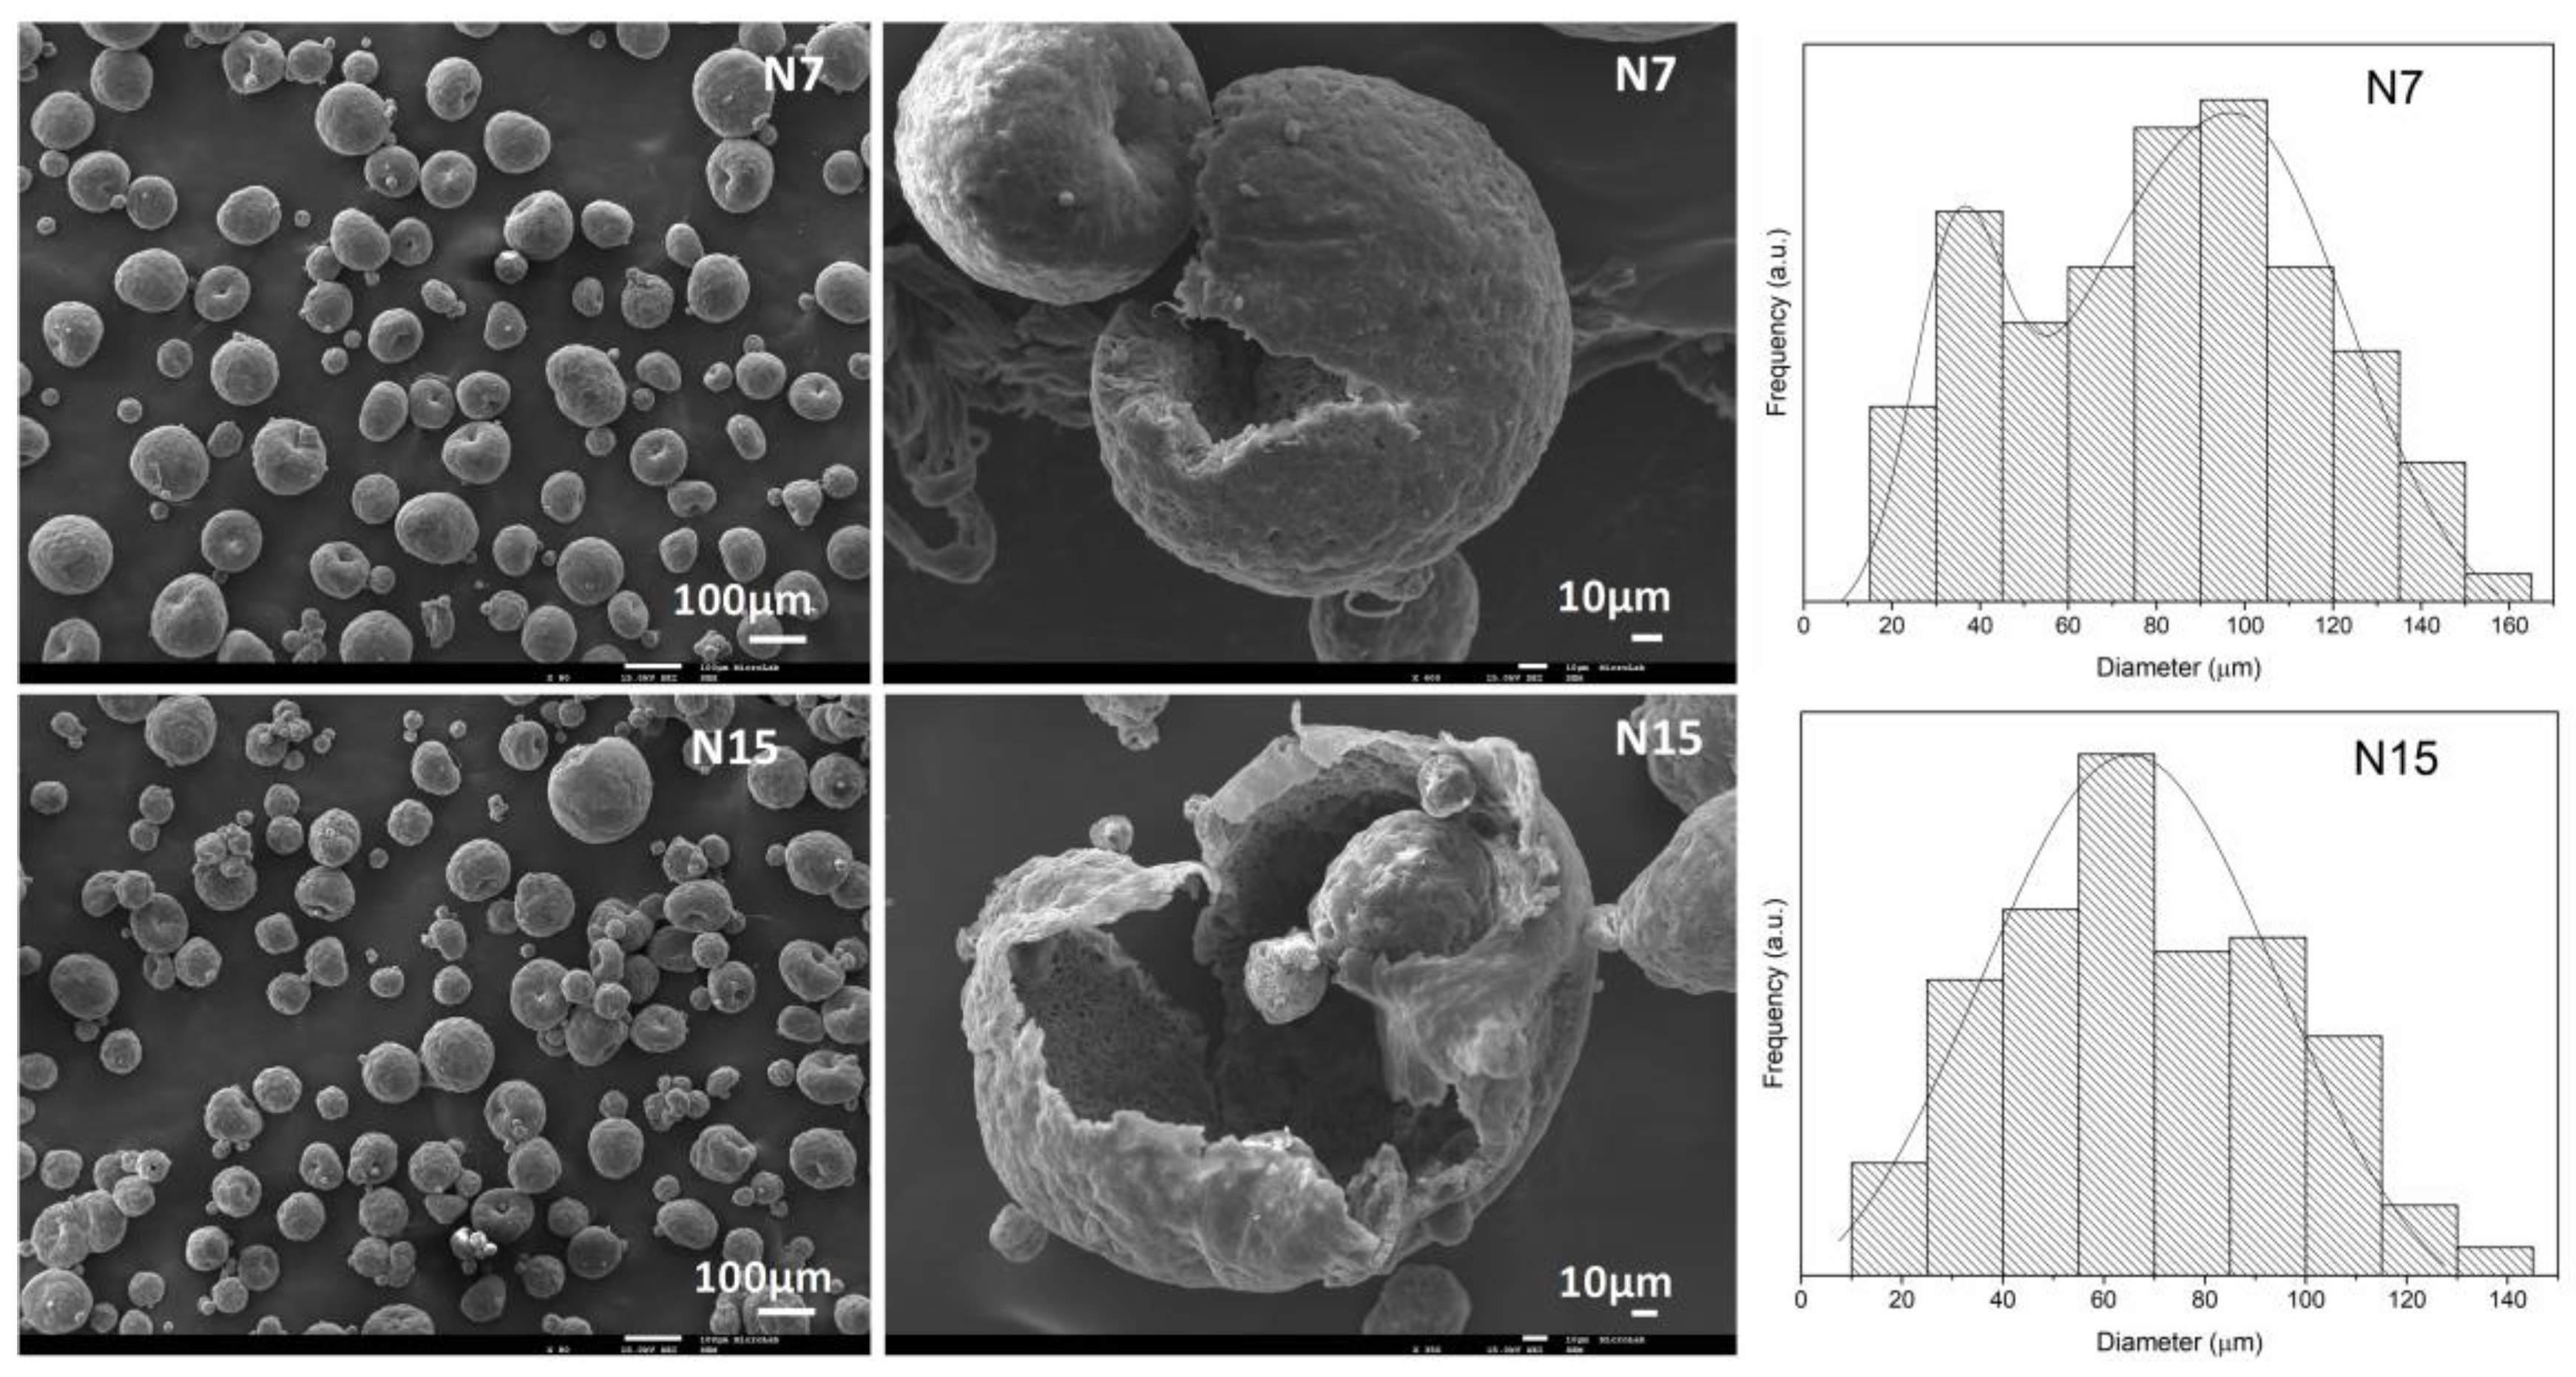
| N7 | 2 | 3.5 | 39 | 93.7 ± 32.1 | 60.6 | 53.1 |
| N8 | 4 | 3.5 | 39 | 91.8 ± 46 | 55.1 | 40.2 |
| N9 | 2 | 1.75 | 33.5 | 140.5 ± 79.8 | 58.2 | 41.8 |
| N10 | 4 | 1.75 | 33.5 | 65.5 ± 21.5 | 56.6 | 36.7 |
| N11 | 3 | 0 | 33.5 | 104.2 ± 48.6 | 57.1 | 42.3 |
| N12 | 3 | 3.5 | 33.5 | 70.8 ± 25.1 | 58.5 | 47.1 |
| N13 | 3 | 1.75 | 28 | 70.2 ± 32.8 | 58.5 | 45.3 |
| N14 | 3 | 1.75 | 39 | 109.4 ± 29.9 | 58.2 | 45.8 |
| N15 | 3 | 1.75 | 33.5 | 76.6 ± 31.2 | 58.2 | 44.8 |
| N16 | 3 | 1.75 | 33.5 | 81.2 ± 25.2 | 56.7 | 46.1 |
| N17 | 3 | 1.75 | 33.5 | 130.1 ± 92.4 | 59.1 | 48.4 |
| Regression Coefficients | R2 | R2 Adj. | Q2 | RDS |
|---|---|---|---|---|
| Coefficient Values | 0.973 | 0.955 | 0.867 | 7.809 |
| Experimental Run | PVAc (%) | GAc (%) | V.r. (%) | MCs Average Size (µm) | |
|---|---|---|---|---|---|
| Predicted | Experimental | ||||
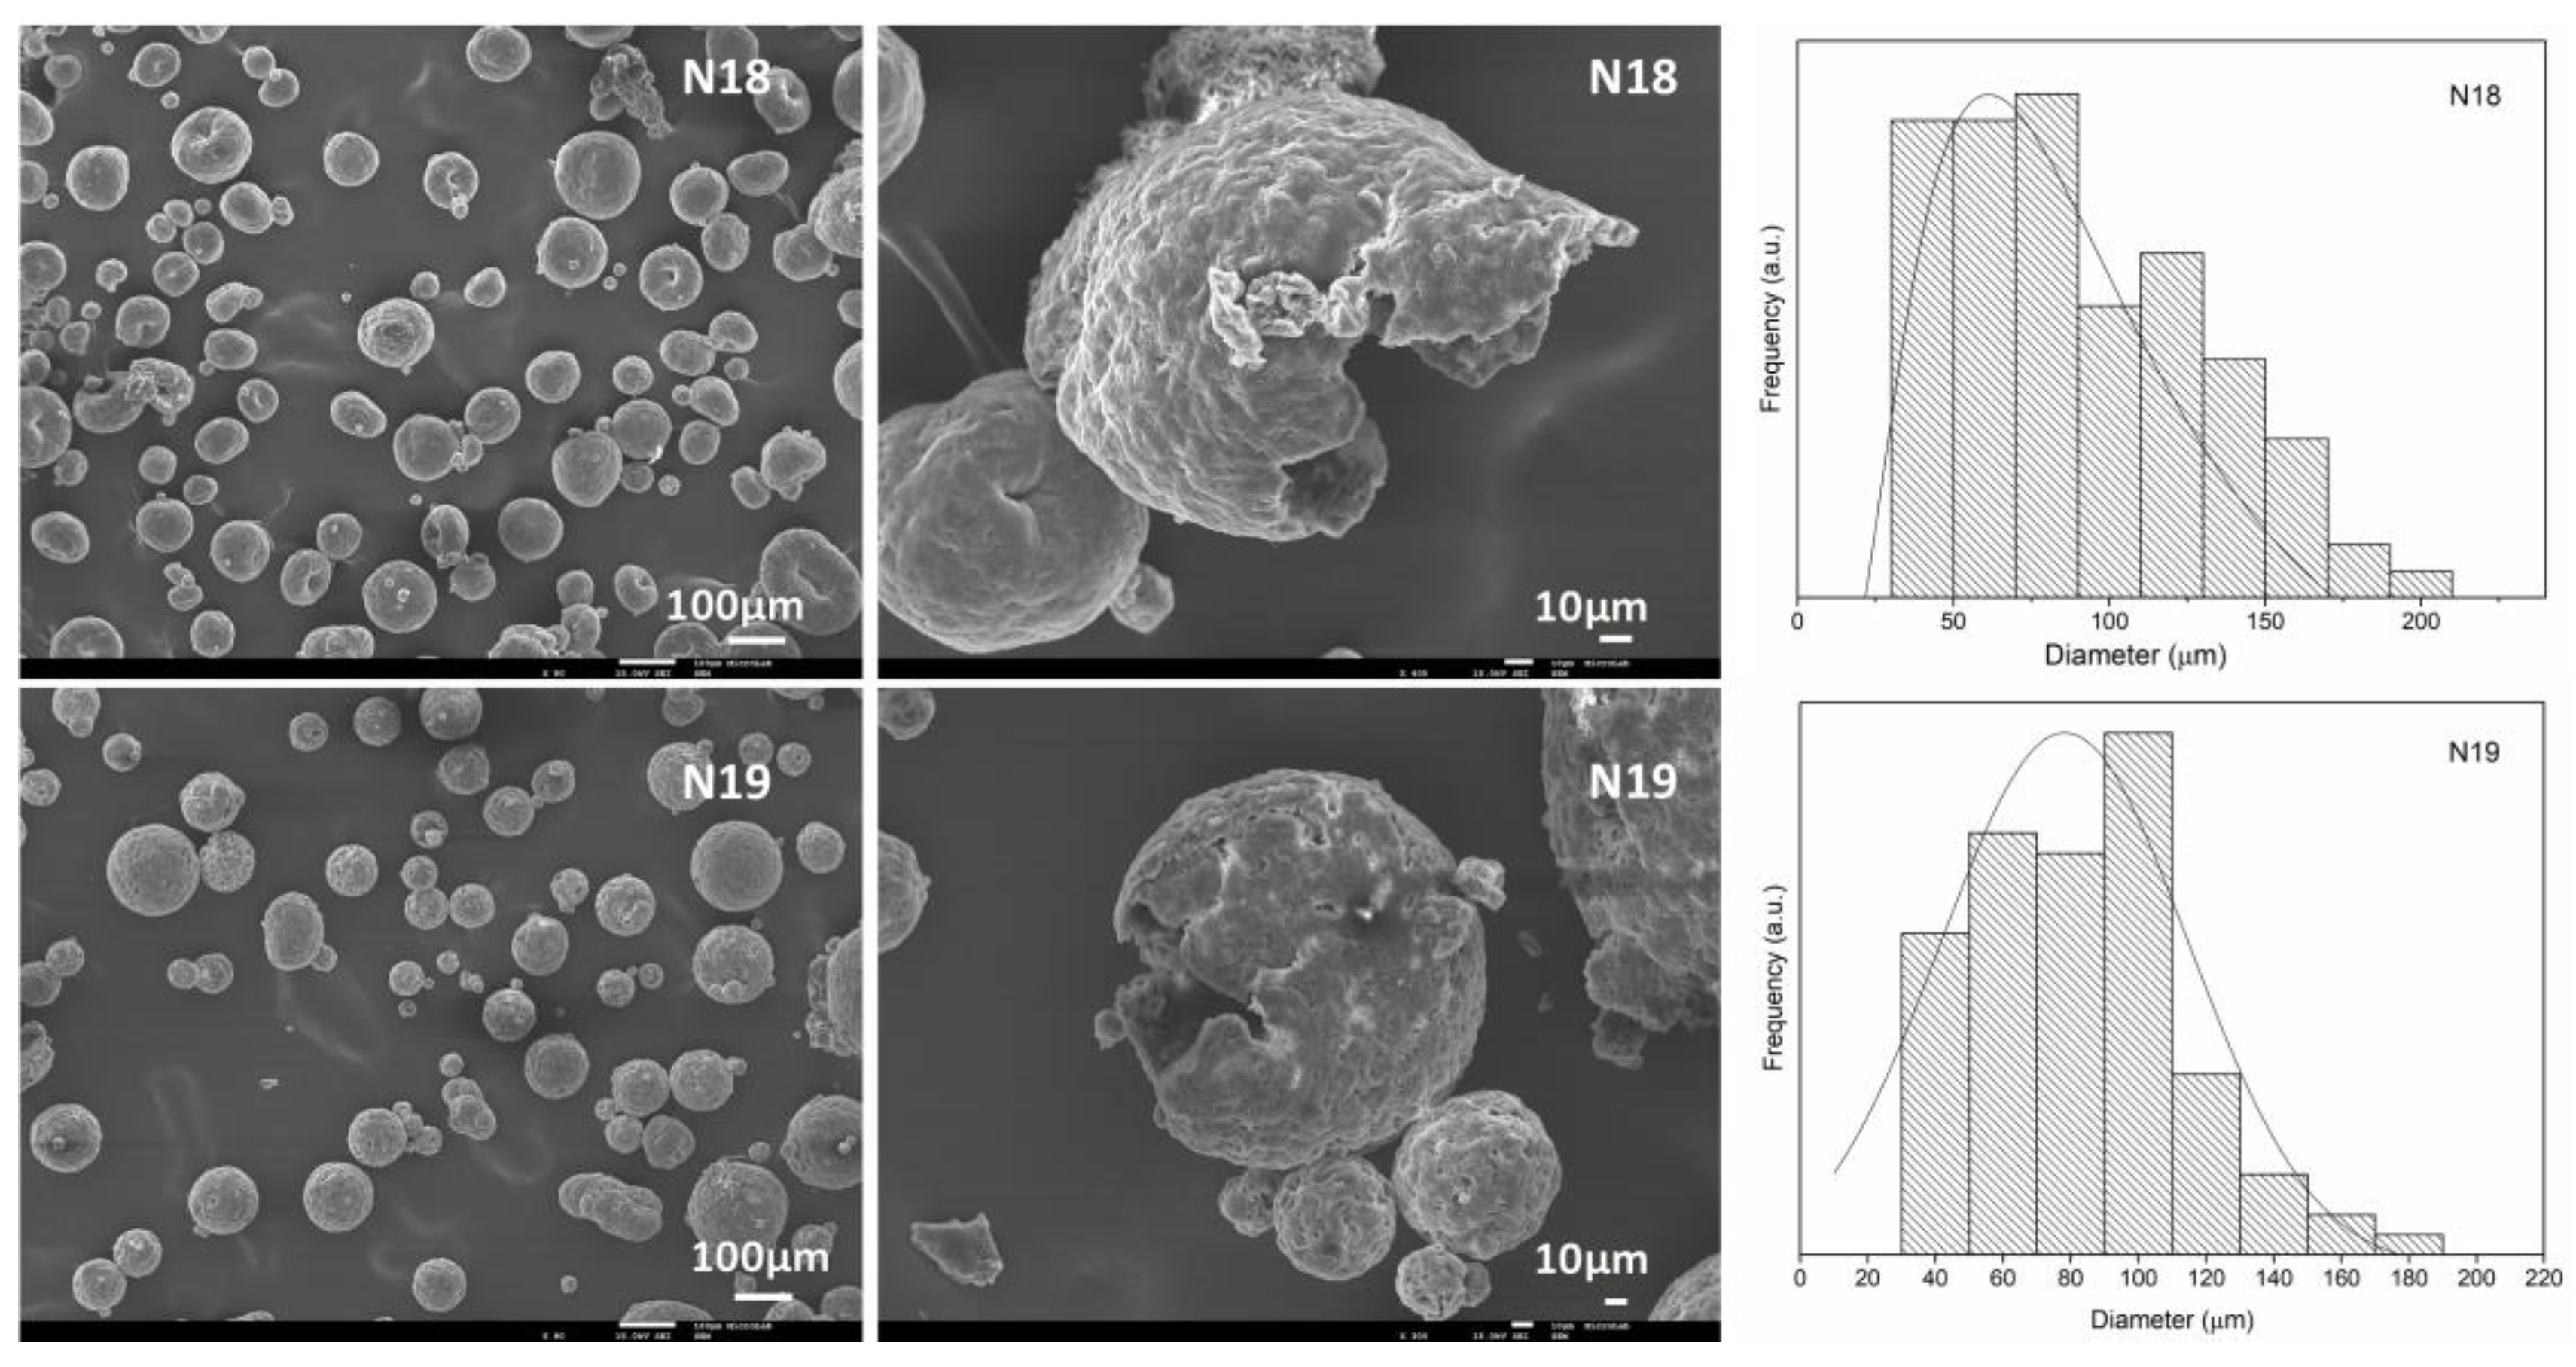
| N18 | 3 | 1.5 | 28 | 58.6–93.4 | 90.3 ± 25.3 |
| N19 | 2.8 | 2 | 33.5 | 66.4–88.1 | 80.2 ± 20.9 |
| MCs’ Acronym | Average Size | Mode | S/D Ratio |
|---|---|---|---|
| N7 | 93.7 ± 34.1 | 38.7, 98.5 | 0.38, 0.15 |
| N15 | 72.9 ± 32.2 | 62.8 | 0.087 |
| I_45MCs | 326.4 ± 157.3 | 264, 416 and 637 | 0.11, 0.071 and 0.046 |
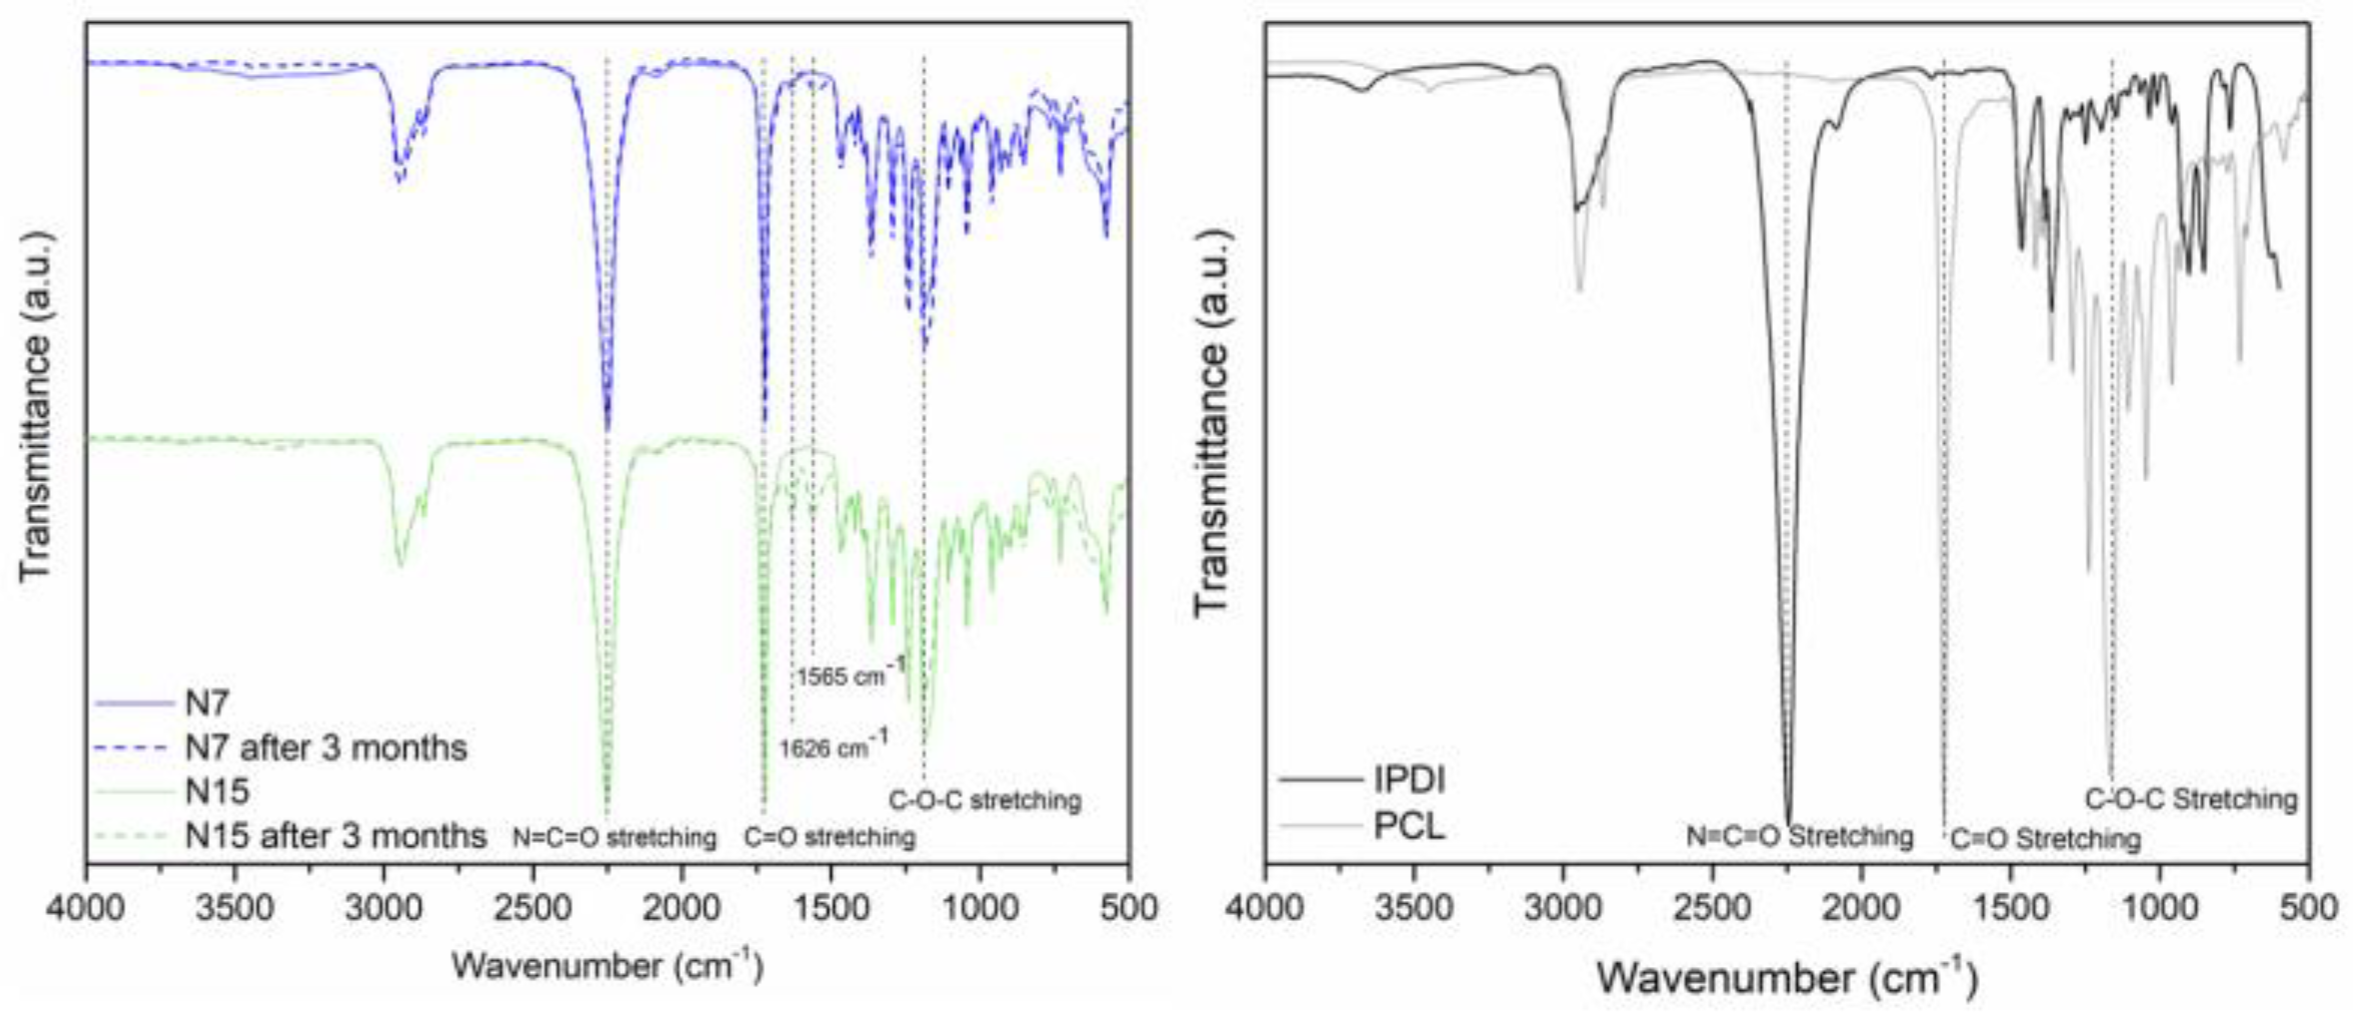
| MCs’ Acronym | Relative Encapsulation Yield (Y), from FTIR | Encapsulated Isocyanate (wt%), from TGA | Encapsulated Isocyanate in the 3 Months Aged MCs (wt%), from TGA | % of Isocyanate Loss after 3 Months |
|---|---|---|---|---|
| N7 MCs | 3.19 | 60.6 | 53.1 | 7.4 |
| N15 MCs | 2.67 | 58.2 | 44.8 | 13.5 |
| Crosslinker | Percentage in the Pre-Polymer (wt%) | d (cm) 60 °C | d (cm) 70 °C | d (cm) 80 °C | d (cm) 90 °C |
|---|---|---|---|---|---|
| - | - | FO | FO | FO | FO |
| Suprasec® 2234 | 2.5 | 0.35 | 1.05 | 3.35 | FO |
| IPDI | 5 | 0.65 | 2.75 | 3.25 | FO |
| PCL_MCs | 2.5 | 1 | 1.93 | 3.95 | FO |
| 5 | 0.83 | 2.30 | 3.40 | FO |
| Crosslinker | Percentage in the Pre-Polymer (wt%) | d (cm) 60°C | d (cm) 70°C | d (cm) 80°C | d (cm) 90°C |
|---|---|---|---|---|---|
| - | - | 1 | FO | FO | FO |
| Desmodur® RC | 2.5 | 0 | 0 | 0 | 0 |
| IPDI | 2.5 | 0.3 | 0.96 | FO | FO |
| 5 | 0 | 0 | 0 | 1.43 | |
| PCL_MCs | 2.5 | 0 | 0.33 | 2.07 | FO |
| 5 | 0 | 0.2 | 0.27 | 0.93 |
Disclaimer/Publisher’s Note: The statements, opinions and data contained in all publications are solely those of the individual author(s) and contributor(s) and not of MDPI and/or the editor(s). MDPI and/or the editor(s) disclaim responsibility for any injury to people or property resulting from any ideas, methods, instructions or products referred to in the content. |
© 2023 by the authors. Licensee MDPI, Basel, Switzerland. This article is an open access article distributed under the terms and conditions of the Creative Commons Attribution (CC BY) license (https://creativecommons.org/licenses/by/4.0/).
Share and Cite
Loureiro, M.V.; Aguiar, A.; Santos, R.G.d.; Bordado, J.C.; Pinho, I.; Marques, A.C. Design of Experiment for Optimizing Microencapsulation by the Solvent Evaporation Technique. Polymers 2024, 16, 111. https://doi.org/10.3390/polym16010111
Loureiro MV, Aguiar A, Santos RGd, Bordado JC, Pinho I, Marques AC. Design of Experiment for Optimizing Microencapsulation by the Solvent Evaporation Technique. Polymers. 2024; 16(1):111. https://doi.org/10.3390/polym16010111
Chicago/Turabian StyleLoureiro, Mónica V., António Aguiar, Rui G. dos Santos, João C. Bordado, Isabel Pinho, and Ana C. Marques. 2024. "Design of Experiment for Optimizing Microencapsulation by the Solvent Evaporation Technique" Polymers 16, no. 1: 111. https://doi.org/10.3390/polym16010111
APA StyleLoureiro, M. V., Aguiar, A., Santos, R. G. d., Bordado, J. C., Pinho, I., & Marques, A. C. (2024). Design of Experiment for Optimizing Microencapsulation by the Solvent Evaporation Technique. Polymers, 16(1), 111. https://doi.org/10.3390/polym16010111