
PVA/PANI-DBSA Nanomesh Tactile Sensor for Force Feedback

Abstract
:1. Introduction
2. Materials and Methods
2.1. Materials
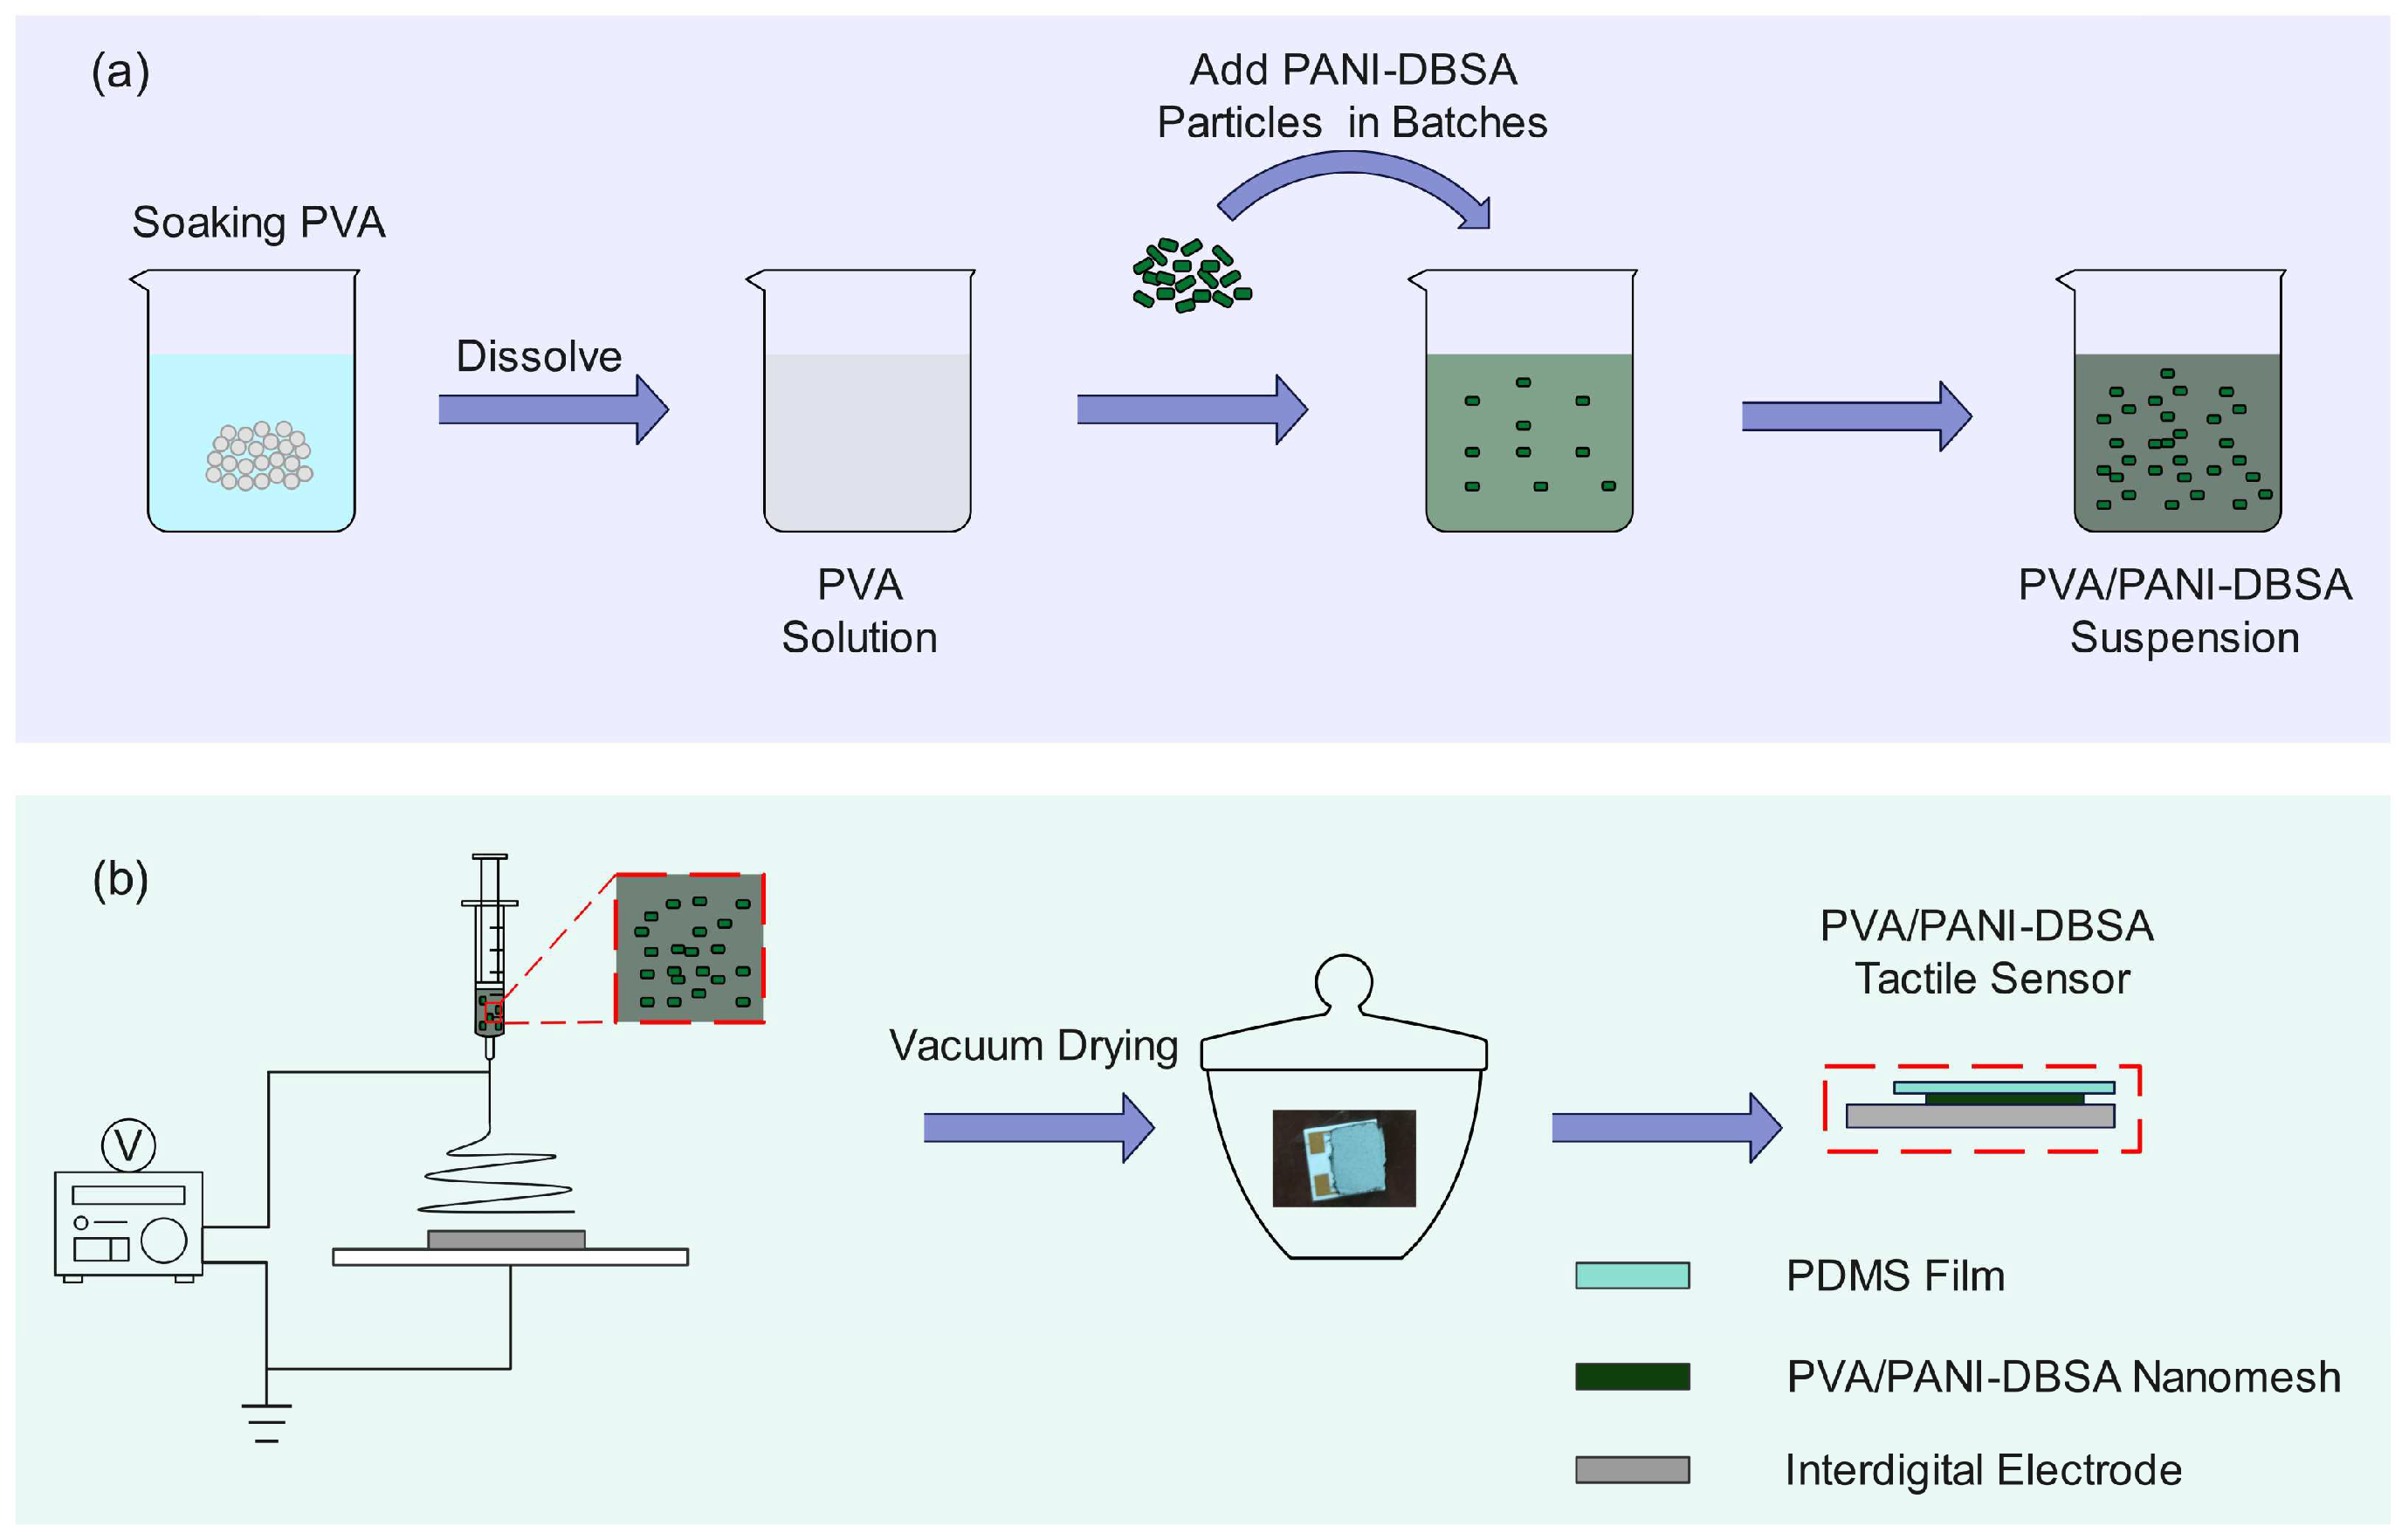
2.2. Fabrication
2.2.1. Configuration of Electrospinning Solution
2.2.2. Fabrication of PVA/PANI-DBSA Tactile Sensor
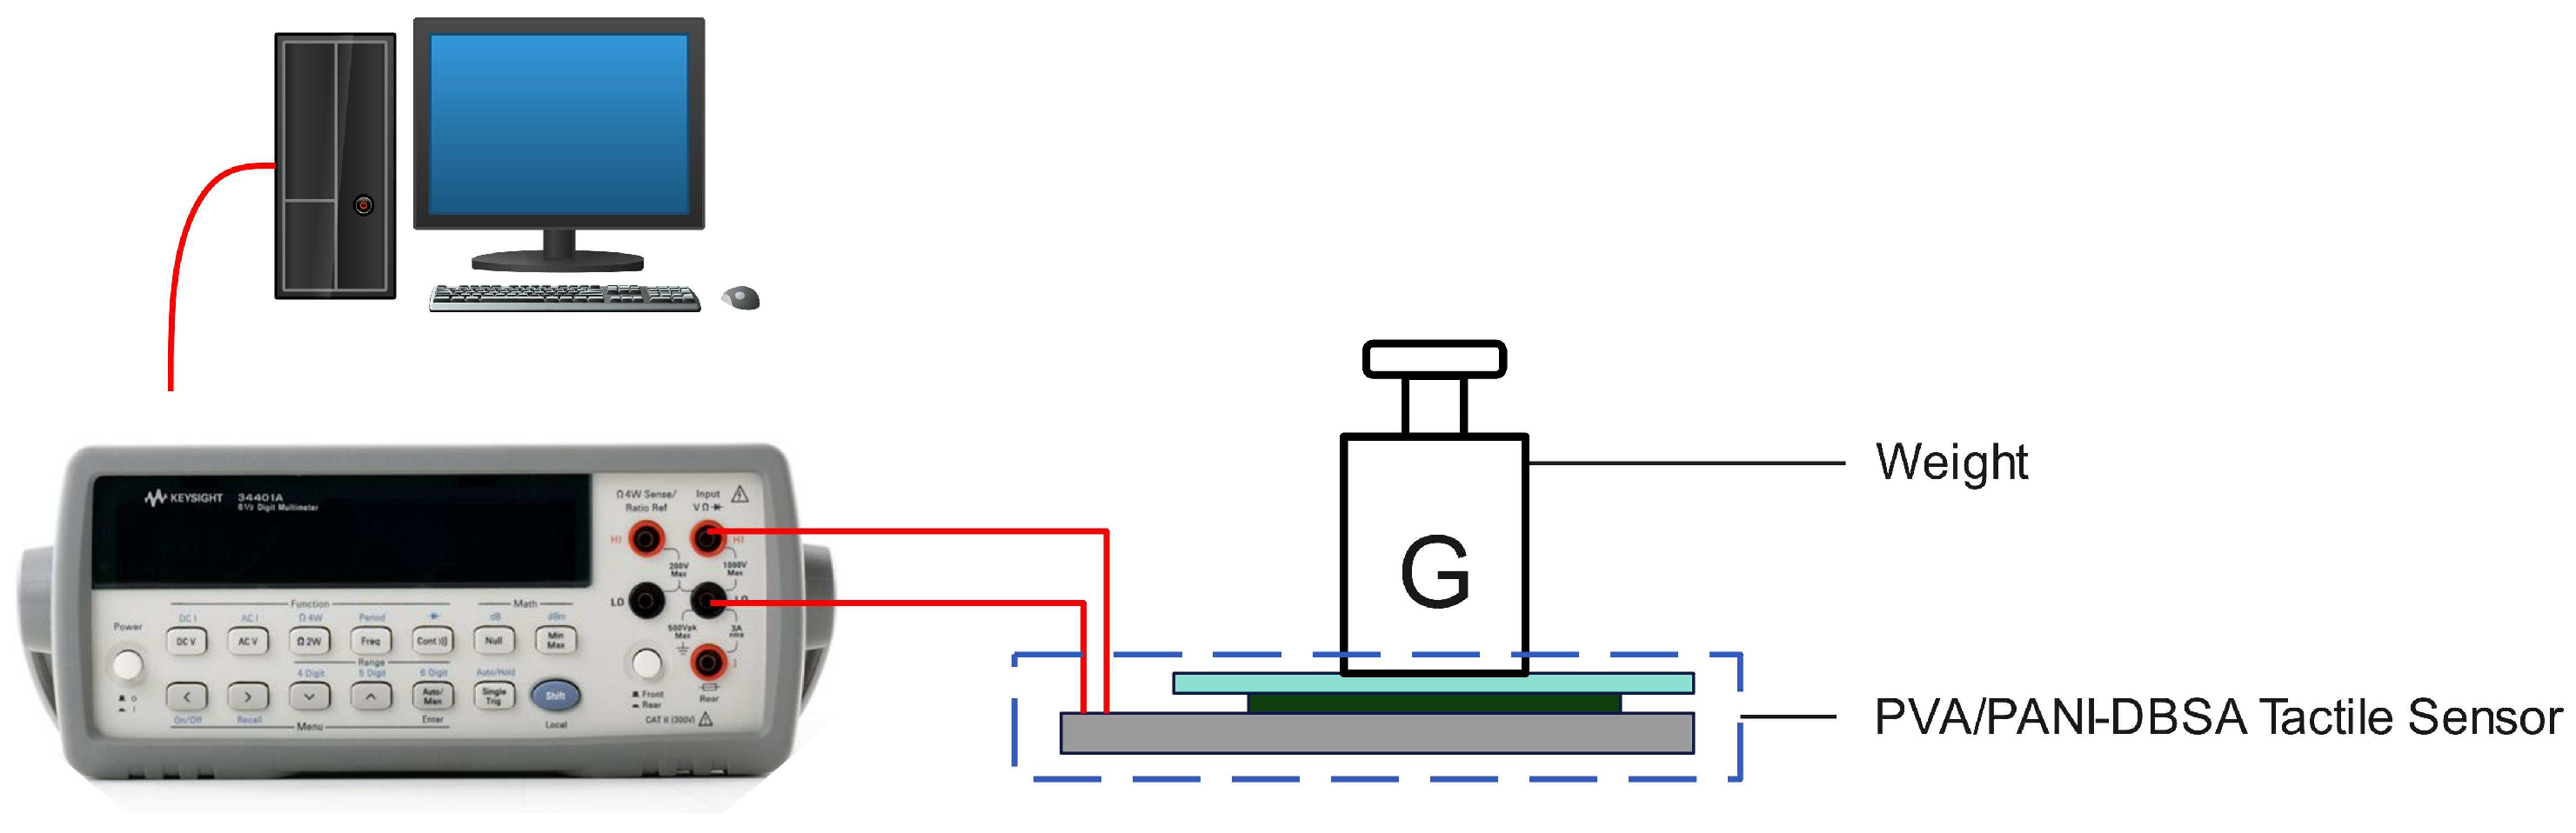
2.3. Characterization
2.4. Experimental Design
3. Results and Discussion
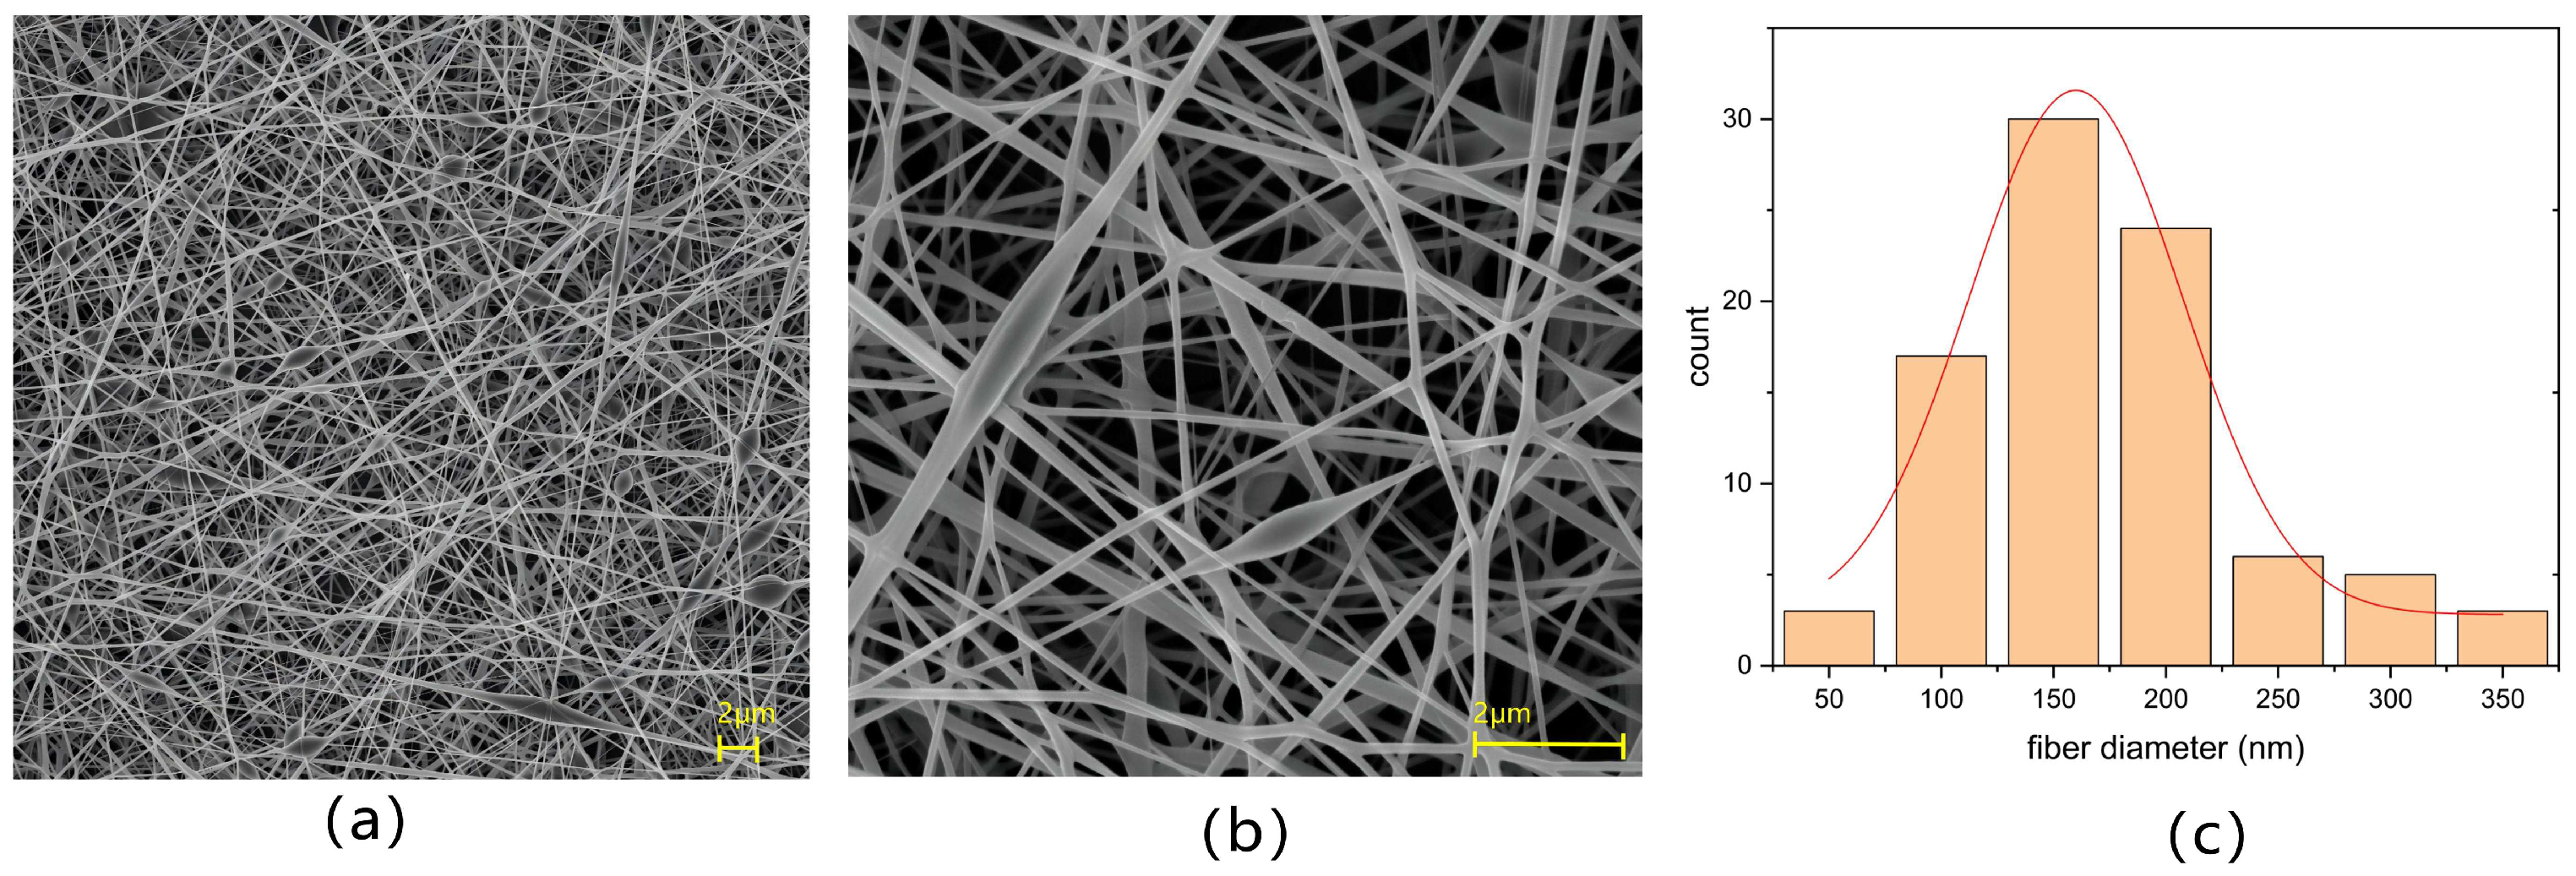
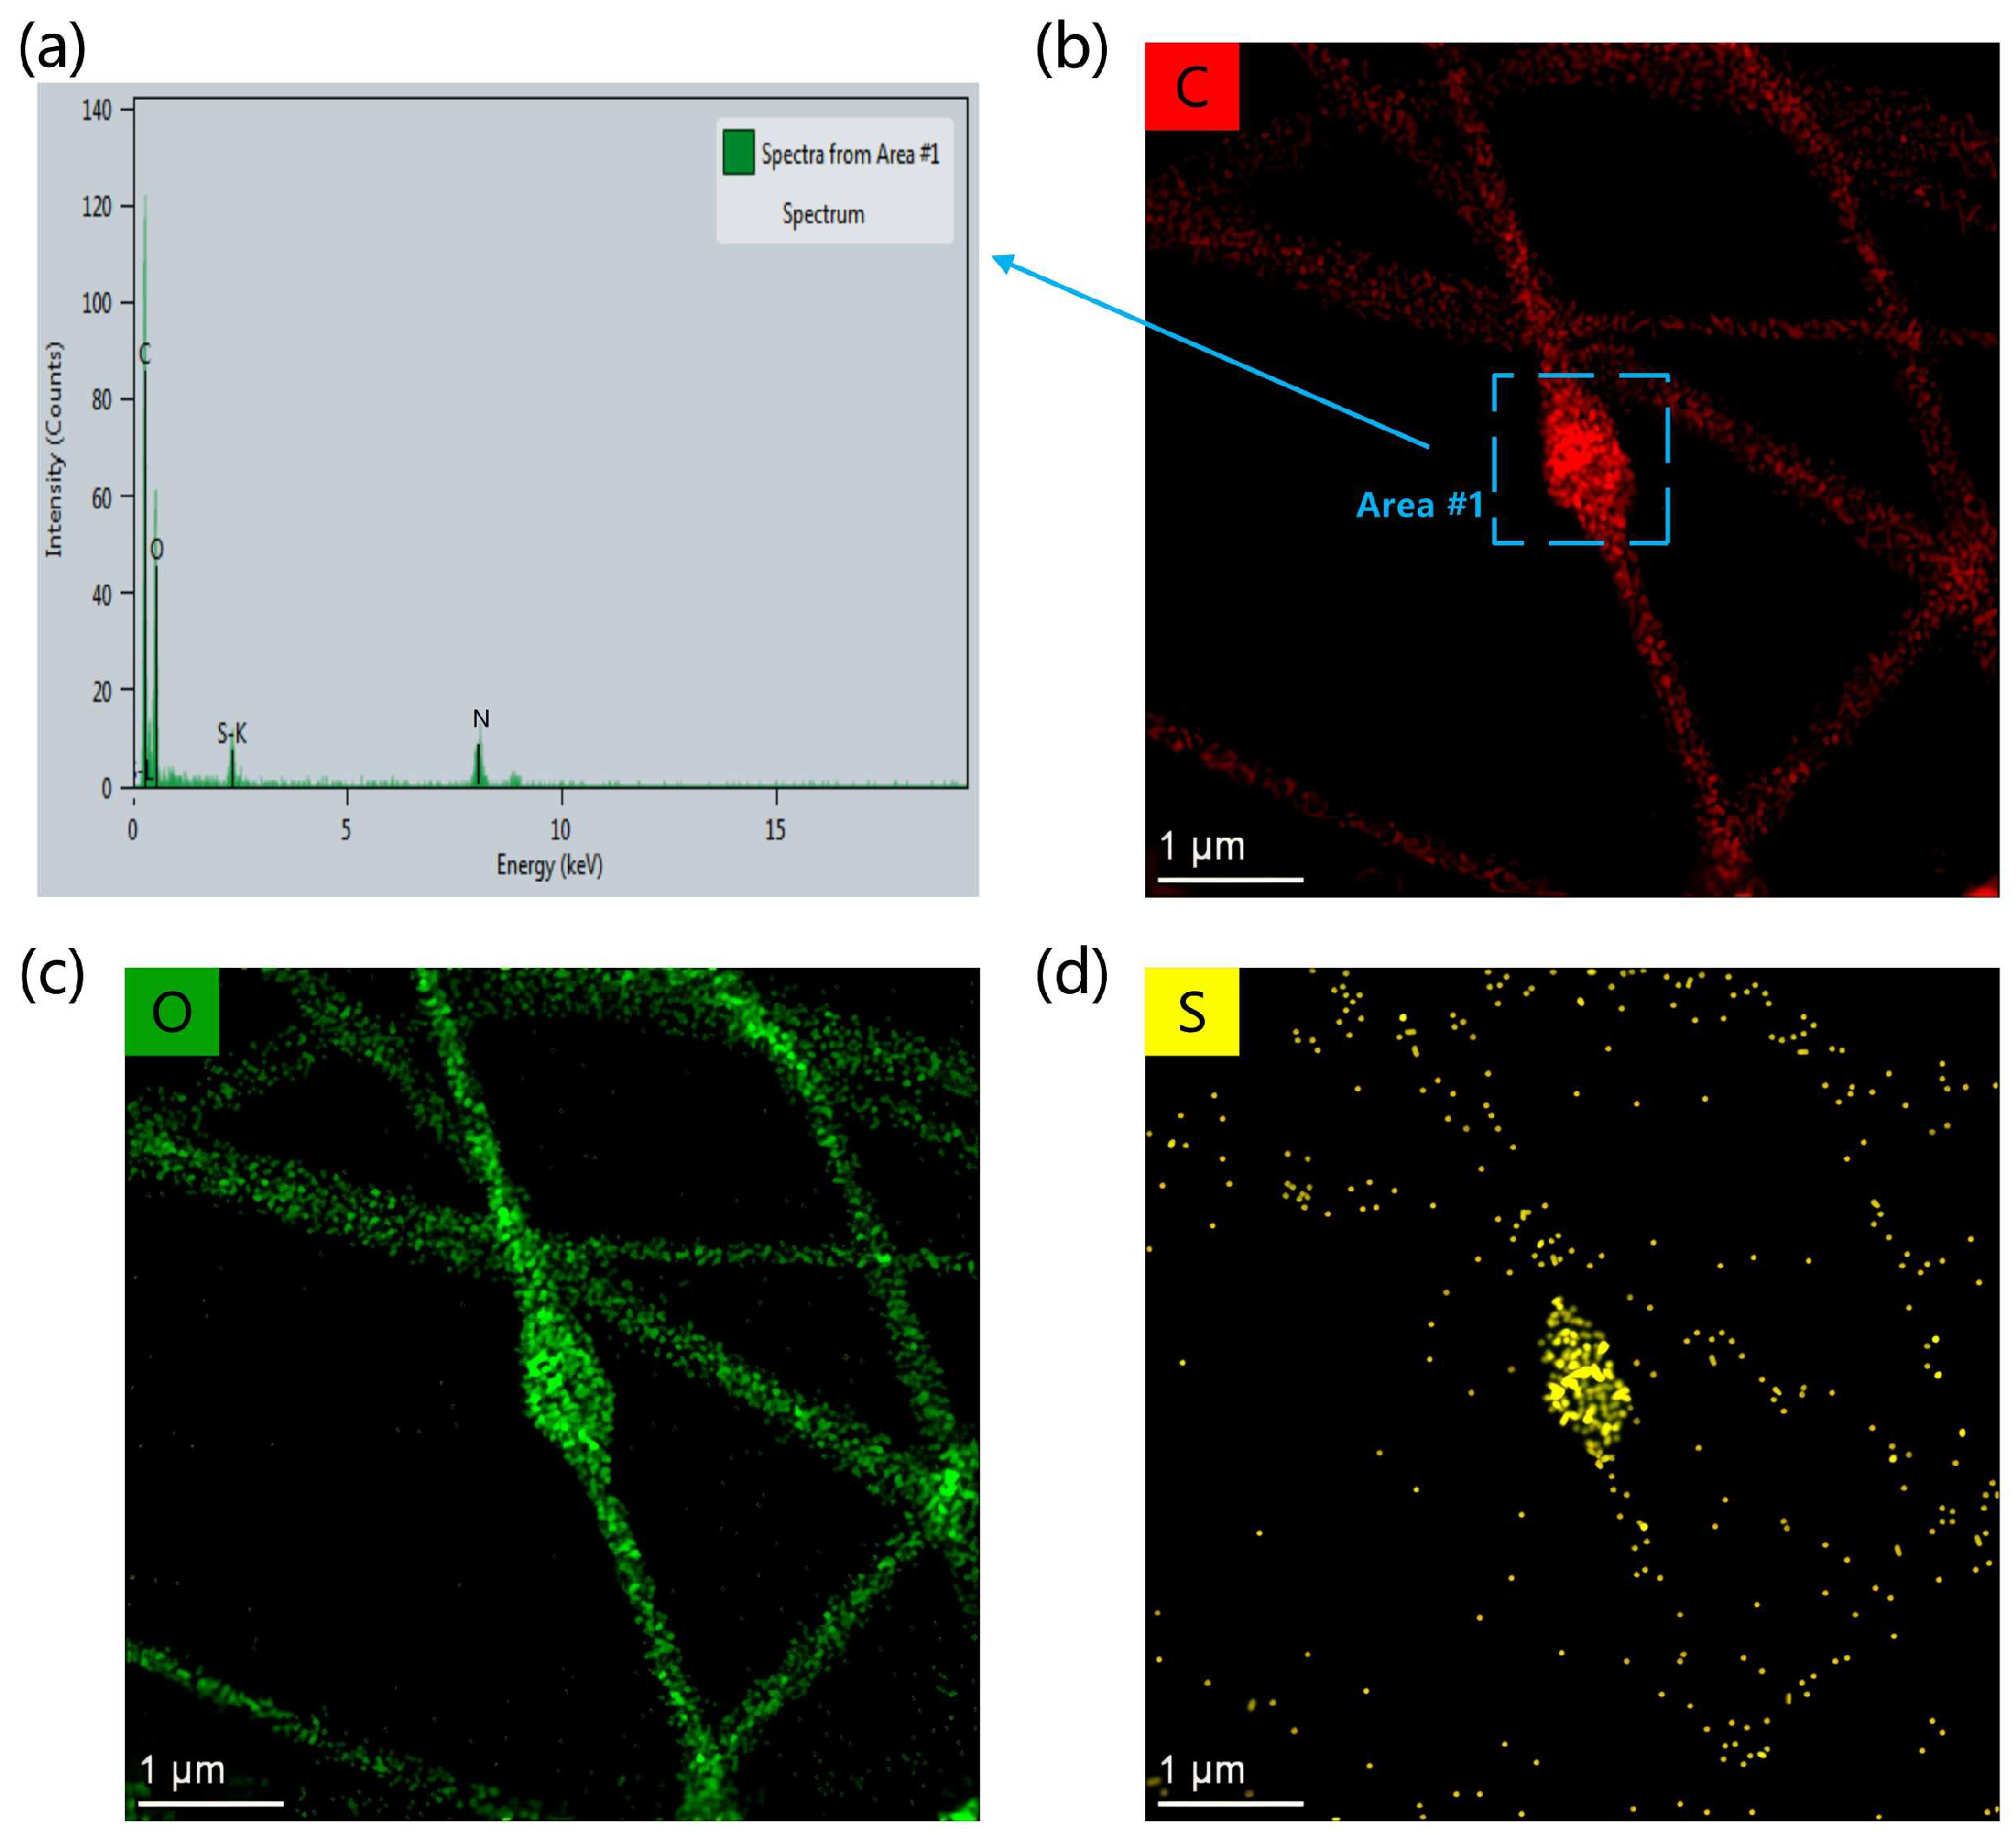
3.1. Structural Characterization
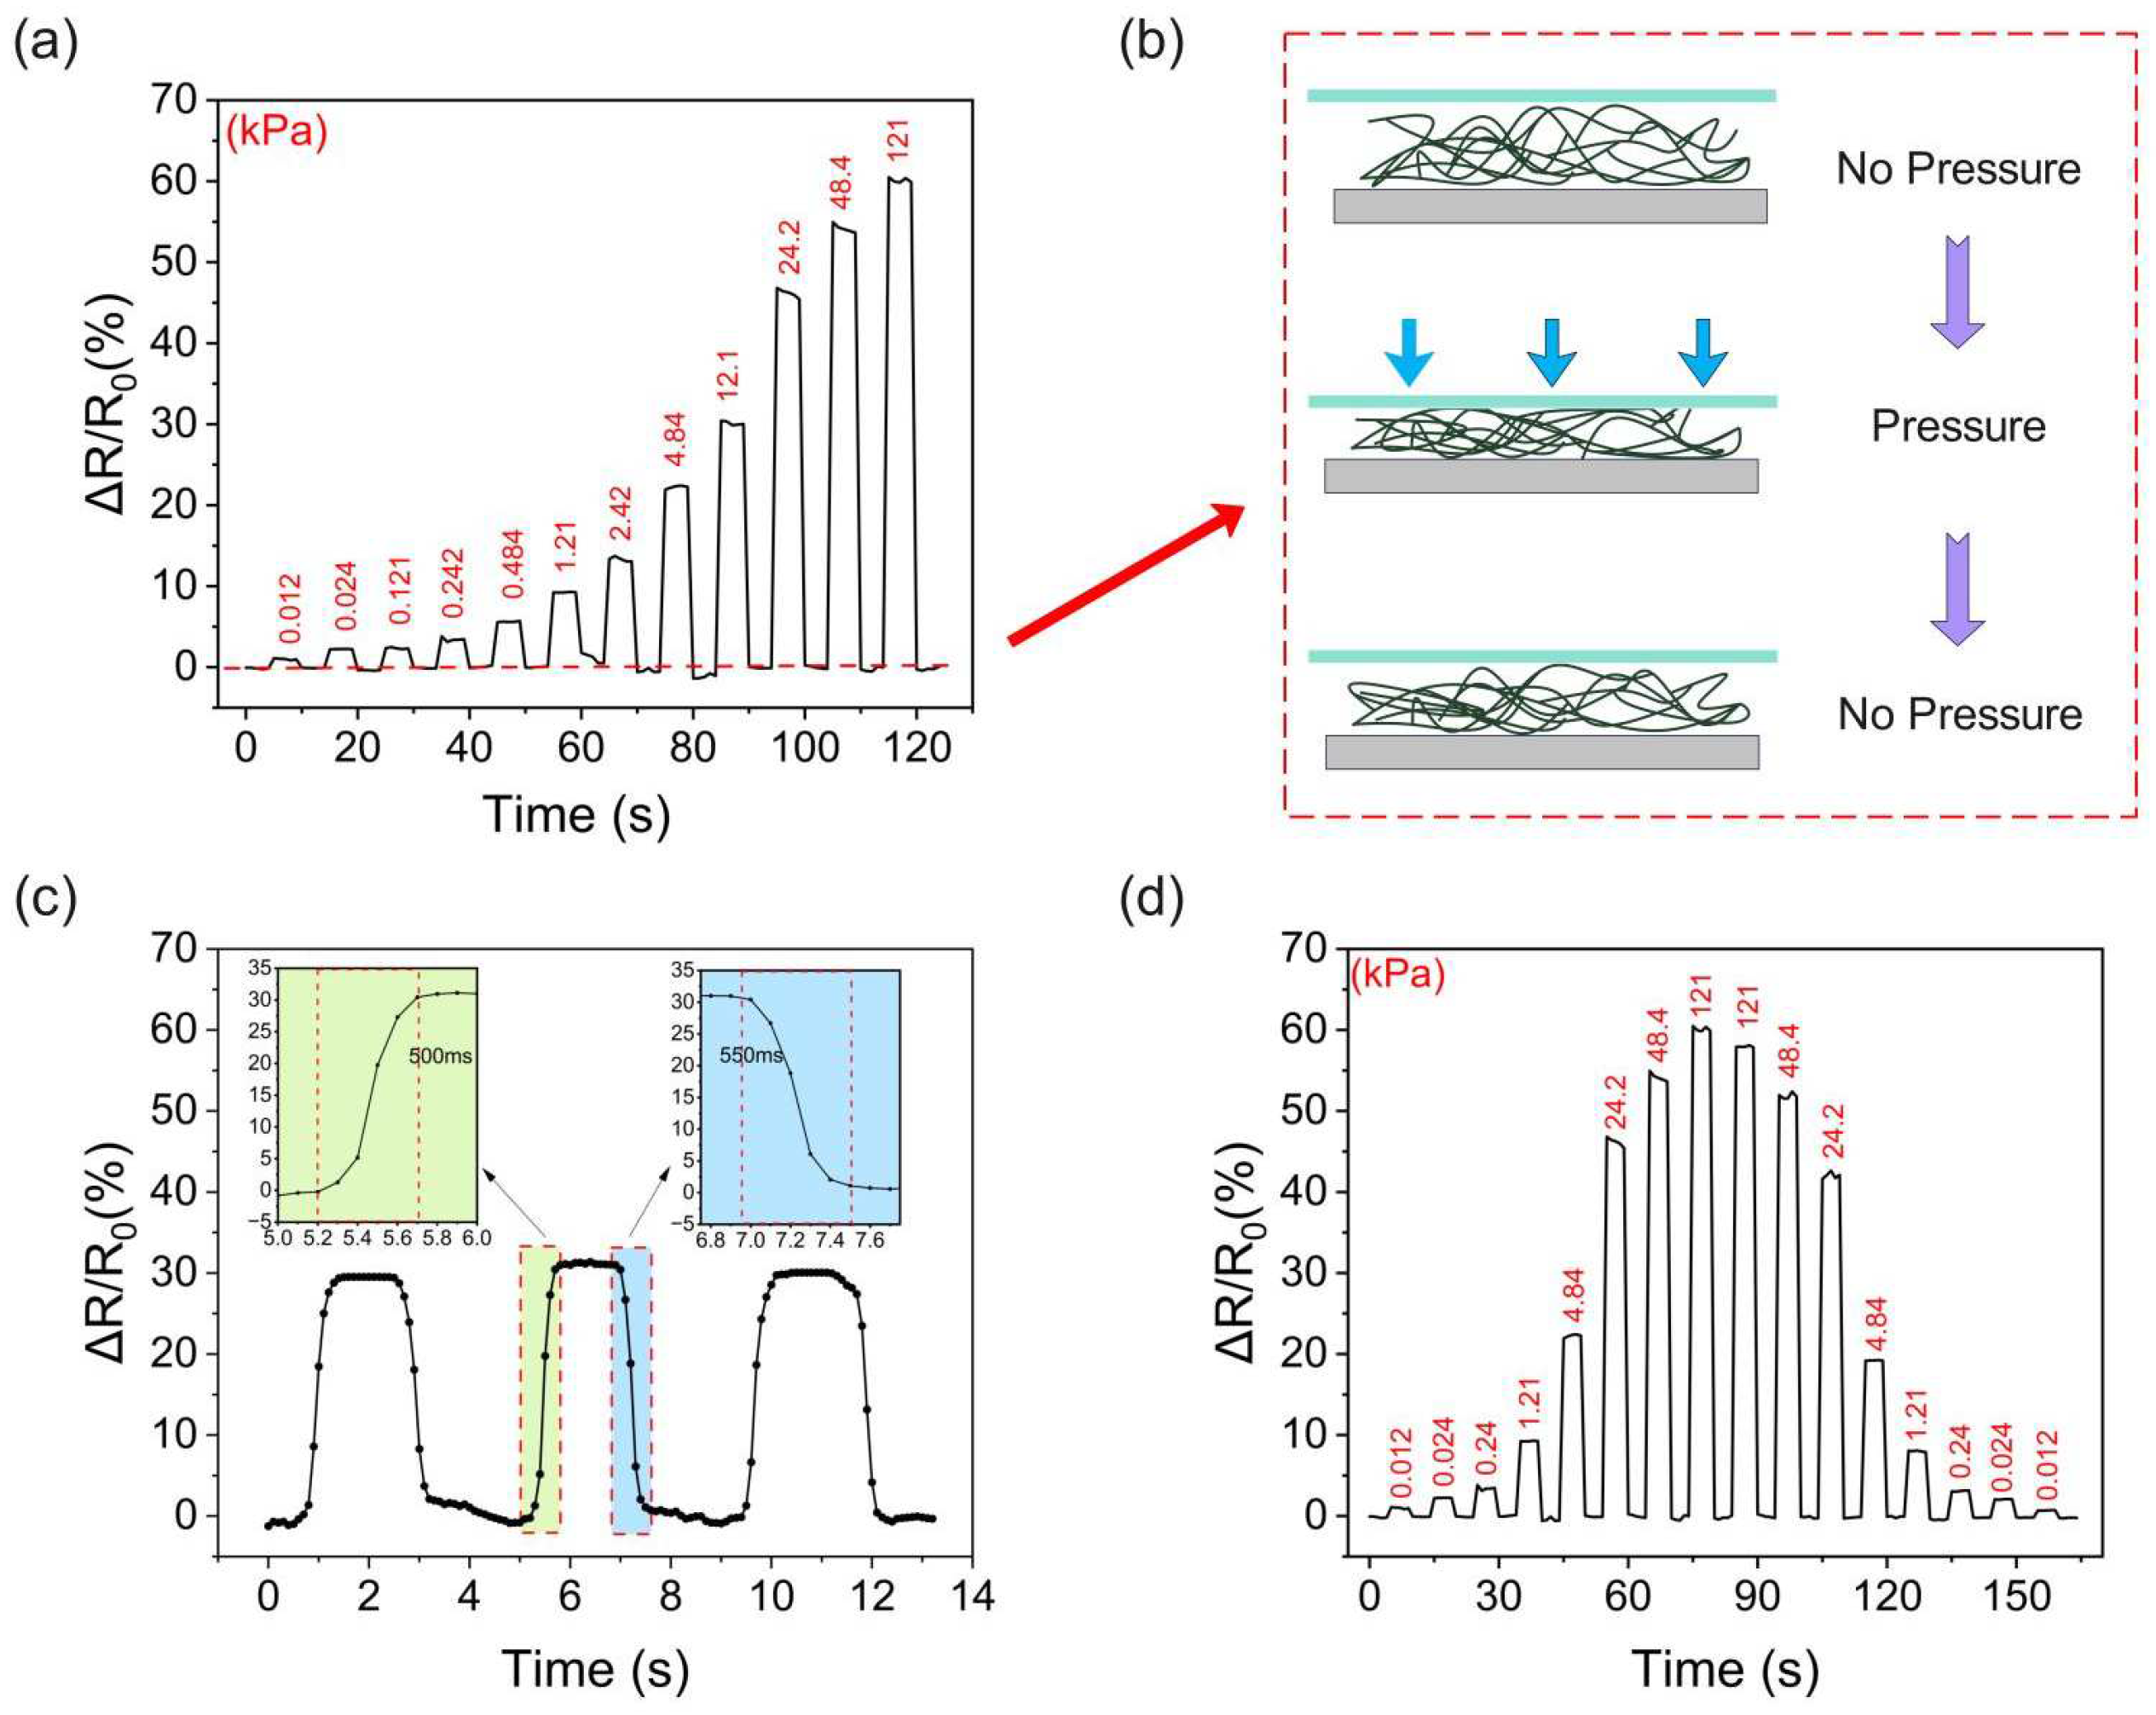
3.2. Sensing Performance of PVA/PANI-DBSA Tactile Sensor
3.3. Working Mechanism of PVA/PANI-DBSA Tactile Sensor
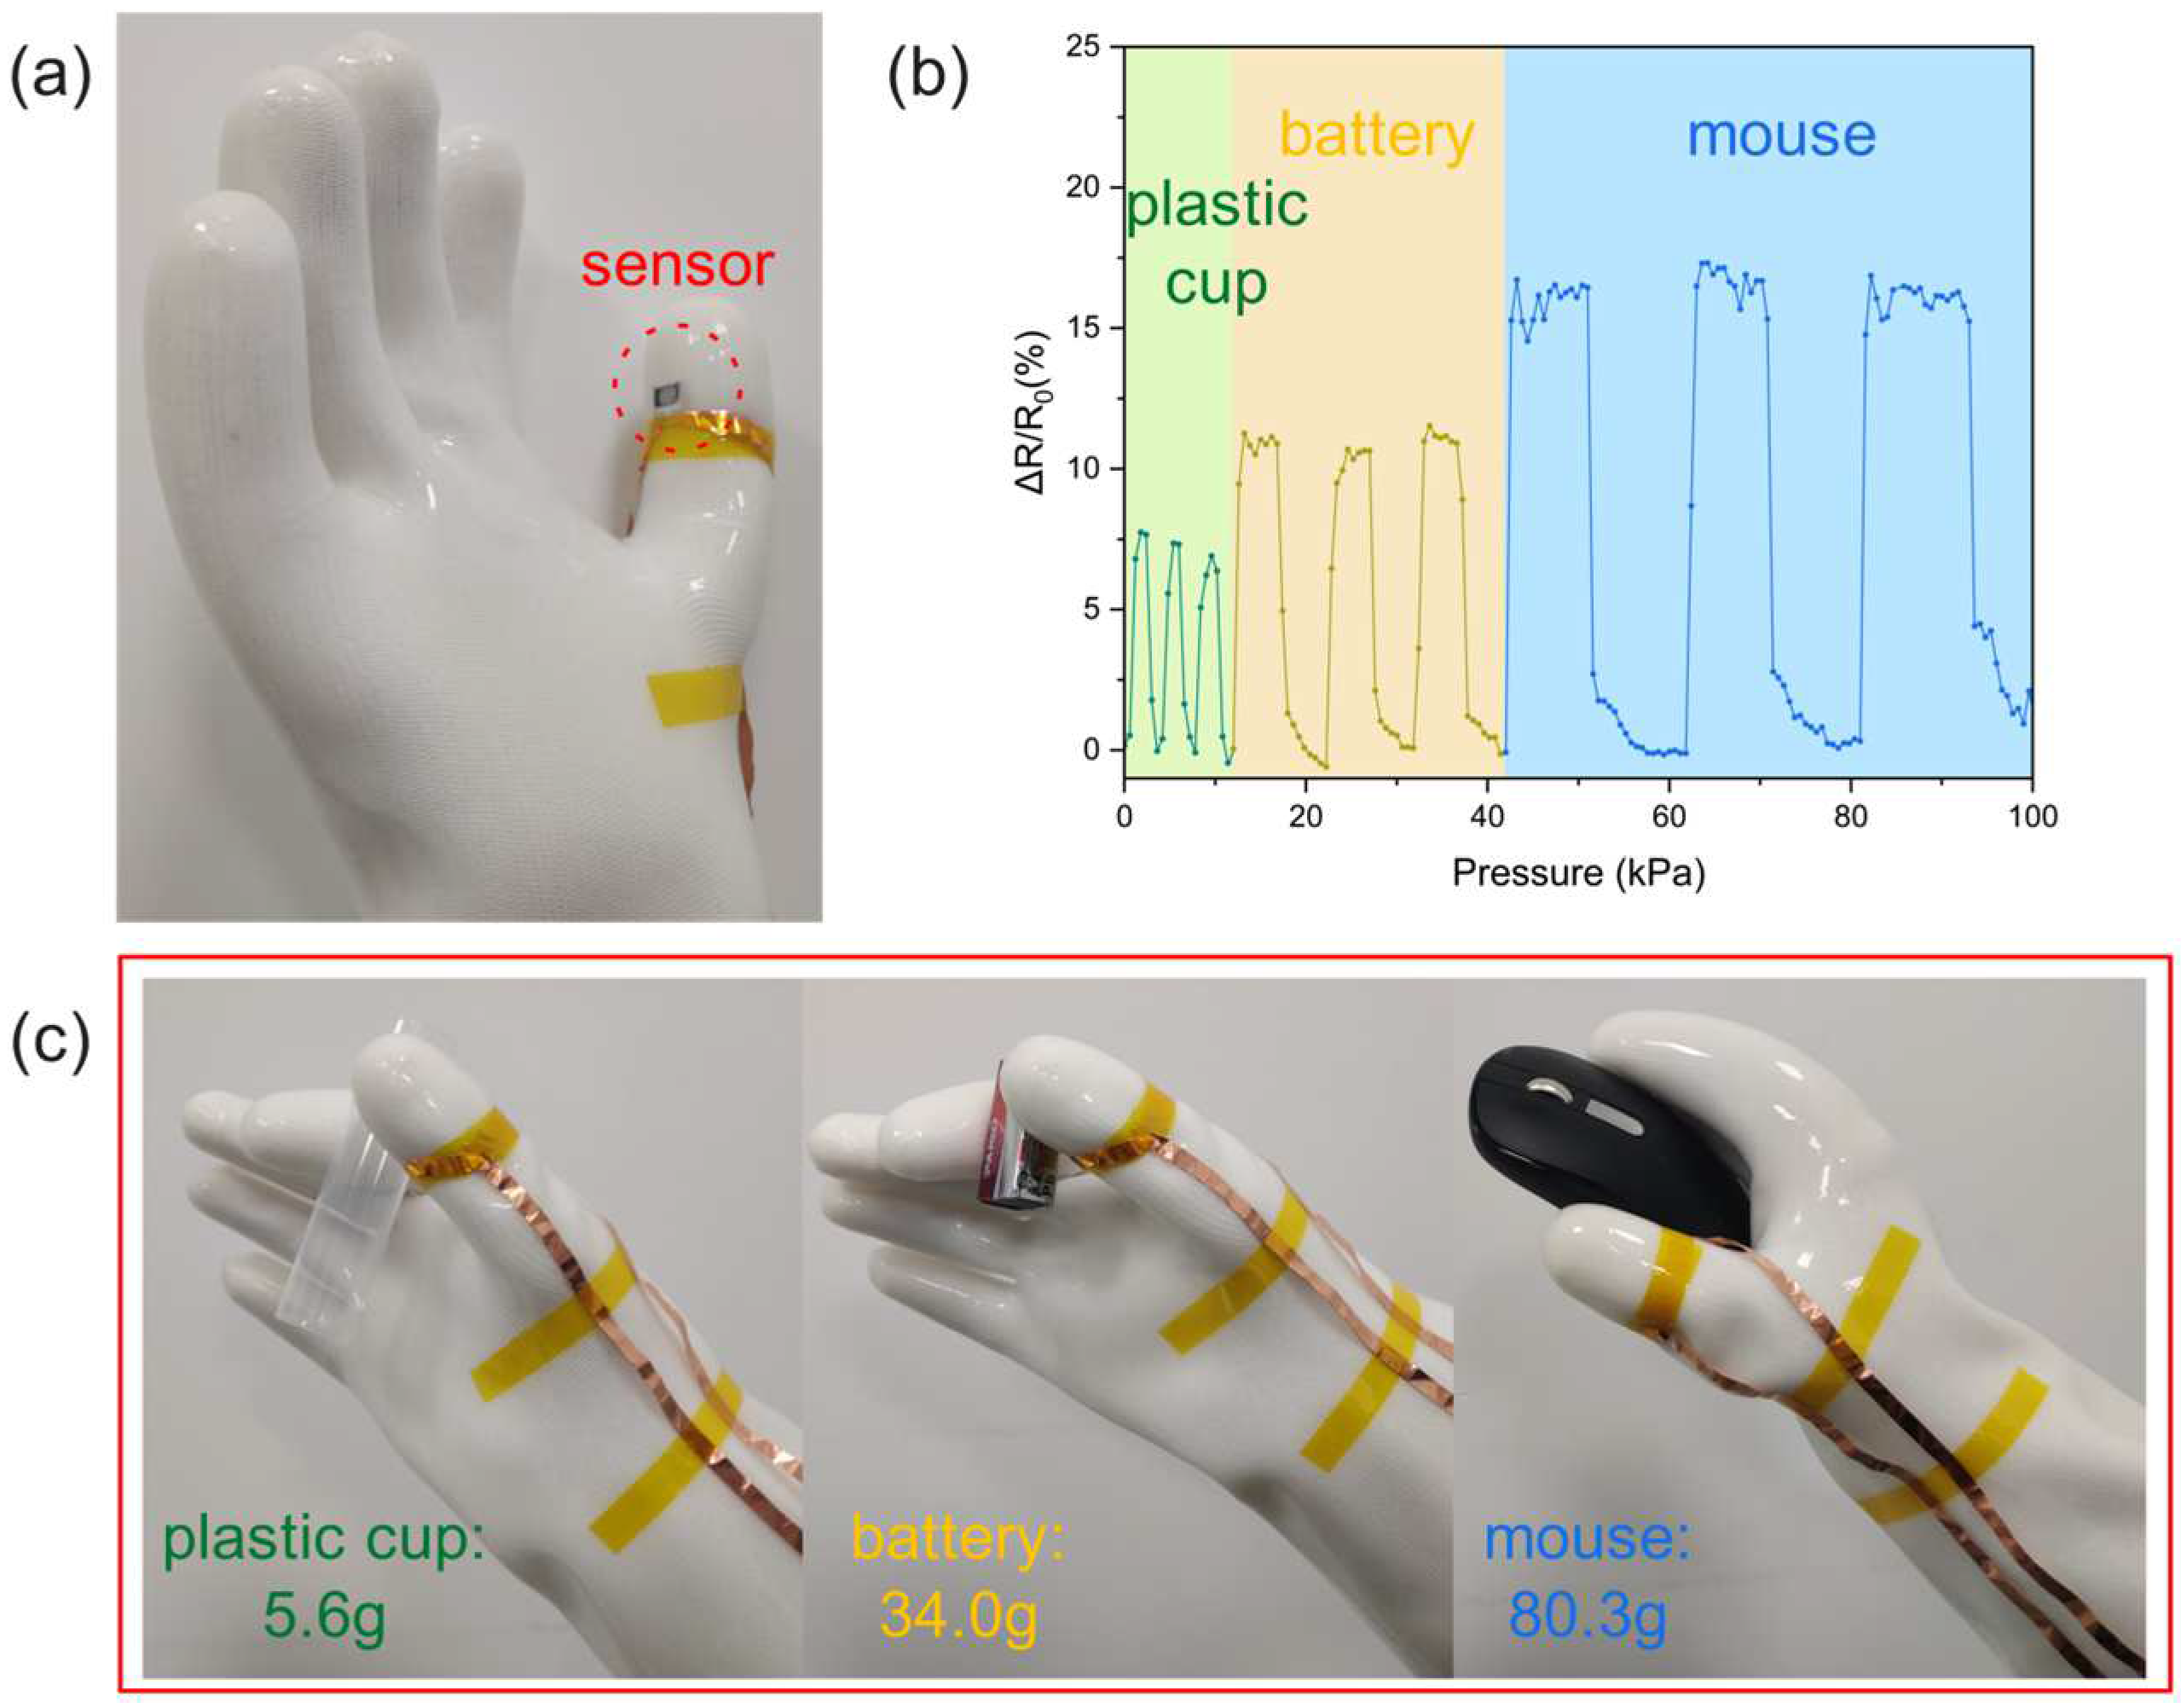
4. Application
5. Conclusions
Author Contributions
Funding
Institutional Review Board Statement
Informed Consent Statement
Data Availability Statement
Conflicts of Interest
References
- See, A.R.; Choco, J.A.G.; Chandramohan, K. Touch, Texture and Haptic Feedback: A Review on How We Feel the World around Us. Appl. Sci. 2022, 12, 4686. [Google Scholar] [CrossRef]
- Antfolk, C.; D’Alonzo, M.; Rosén, B.; Lundborg, G.; Sebelius, F.; Cipriani, C. Sensory feedback in upper limb prosthetics. Expert Rev. Med. Devices 2013, 10, 45–54. [Google Scholar] [CrossRef]
- Cordella, F.; Ciancio, A.L.; Sacchetti, R.; Davalli, A.; Cutti, A.G.; Guglielmelli, E.; Zollo, L. Literature Review on Needs of Upper Limb Prosthesis Users. Front. Neurosci. 2016, 10, 209. [Google Scholar] [CrossRef] [PubMed]
- Robles-De-La-Torre, G. The importance of the sense of touch in virtual and real environments. IEEE Multimedia 2006, 13, 24–30. [Google Scholar] [CrossRef]
- Augurelle, A.-S.; Smith, A.M.; Lejeune, T.; Thonnard, J.-L. Importance of cutaneous feedback in maintaining a secure grip during manipulation of hand-held objects. J. Neurophysiol. 2003, 89, 665–671. [Google Scholar] [CrossRef] [PubMed]
- McGlone, F.; Wessberg, J.; Olausson, H. Discriminative and Affective Touch: Sensing and Feeling. Neuron 2014, 82, 737–755. [Google Scholar] [CrossRef]
- Biddiss, E.; Beaton, D.; Chau, T. Consumer design priorities for upper limb prosthetics. Disabil. Rehabil. Assist. Technol. 2007, 2, 346–357. [Google Scholar] [CrossRef] [PubMed]
- Monzée, J.; Lamarre, Y.; Smith, A.M. The effects of digital anesthesia on force control using a precision grip. J. Neurophysiol. 2003, 89, 672–683. [Google Scholar] [CrossRef] [PubMed]
- Liao, X.; Wang, W.; Lin, M.; Li, M.; Wu, H.; Zheng, Y. Hierarchically distributed microstructure design of haptic sensors for personalized fingertip mechanosensational manipulation. Mater. Horiz. 2018, 5, 920–931. [Google Scholar] [CrossRef]
- Wan, Y.; Wang, Y.; Guo, C.F. Recent progresses on flexible tactile sensors. Mater. Today Phys. 2017, 1, 61–73. [Google Scholar] [CrossRef]
- Xue, B.; Xie, H.; Zhao, J.; Zheng, J.; Xu, C. Flexible Piezoresistive Pressure Sensor Based on Electrospun Rough Polyurethane Nanofibers Film for Human Motion Monitoring. Nanomaterials 2022, 12, 723. [Google Scholar] [CrossRef] [PubMed]
- Huang, L.; Chen, J.; Xu, Y.; Hu, D.; Cui, X.; Shi, D.; Zhu, Y. Three-dimensional light-weight piezoresistive sensors based on conductive polyurethane sponges coated with hybrid CNT/CB nanoparticles. Appl. Surf. Sci. 2021, 548, 149268. [Google Scholar] [CrossRef]
- Gao, Y.-H.; Jen, Y.-H.; Chen, R.; Aw, K.; Yamane, D.; Lo, C.-Y. Five-fold sensitivity enhancement in a capacitive tactile sensor by reducing material and structural rigidity. Sens. Actuators A Phys. 2019, 293, 167–177. [Google Scholar] [CrossRef]
- Tabi, G.D.; Kim, J.S.; Nketia-Yawson, B.; Kim, D.H.; Noh, Y.-Y. High-capacitance polyurethane ionogels for low-voltage operated organic transistors and pressure sensors. J. Mater. Chem. C 2020, 8, 17107–17113. [Google Scholar] [CrossRef]
- Guan, X.; Xu, B.; Gong, J. Hierarchically architected polydopamine modified BaTiO3@P(VDF-TrFE) nanocomposite fiber mats for flexible piezoelectric nanogenerators and self-powered sensors. Nano Energy 2020, 70, 104516. [Google Scholar] [CrossRef]
- Liu, Q.; Wang, X.-X.; Song, W.-Z.; Qiu, H.-J.; Zhang, J.; Fan, Z.; Yu, M.; Long, Y.-Z. Wireless Single-Electrode Self-Powered Piezoelectric Sensor for Monitoring. ACS Appl. Mater. Interfaces 2020, 12, 8288–8295. [Google Scholar] [CrossRef] [PubMed]
- Wen, Z.; Yang, Y.; Sun, N.; Li, G.; Liu, Y.; Chen, C.; Shi, J.; Xie, L.; Jiang, H.; Bao, D.; et al. A Wrinkled PEDOT:PSS Film Based Stretchable and Transparent Triboelectric Nanogenerator for Wearable Energy Harvesters and Active Motion Sensors. Adv. Funct. Mater. 2018, 28, 1803684. [Google Scholar] [CrossRef]
- Yang, D.; Guo, H.; Chen, X.; Wang, L.; Jiang, P.; Zhang, W.; Zhang, L.; Wang, Z.L. A flexible and wide pressure range triboelectric sensor array for real-time pressure detection and distribution mapping. J. Mater. Chem. A 2020, 8, 23827–23833. [Google Scholar] [CrossRef]
- Guan, X.; Wang, Z.; Zhao, W.; Huang, H.; Wang, S.; Zhang, Q.; Zhong, D.; Lin, W.; Ding, N.; Peng, Z. Flexible Piezoresistive Sensors with Wide-Range Pressure Measurements Based on a Graded Nest-like Architecture. ACS Appl. Mater. Interfaces 2020, 12, 26137–26144. [Google Scholar] [CrossRef]
- Ruth, S.R.A.; Feig, V.R.; Tran, H.; Bao, Z. Microengineering Pressure Sensor Active Layers for Improved Performance. Adv. Funct. Mater. 2020, 30, 2003491. [Google Scholar] [CrossRef]
- Zhao, J.; Wang, G.; Yang, R.; Lu, X.; Cheng, M.; He, C.; Xie, G.; Meng, J.; Shi, D.; Zhang, G. Tunable Piezoresistivity of Nanographene Films for Strain Sensing. ACS Nano 2015, 9, 1622–1629. [Google Scholar] [CrossRef] [PubMed]
- Yang, X.; Wang, Y.; Qing, X. A flexible capacitive sensor based on the electrospun PVDF nanofiber membrane with carbon nanotubes. Sens. Actuators A Phys. 2019, 299, 111579. [Google Scholar] [CrossRef]
- Wang, A.; Hu, M.; Zhou, L.; Qiang, X. Self-Powered Wearable Pressure Sensors with Enhanced Piezoelectric Properties of Aligned P(VDF-TrFE)/MWCNT Composites for Monitoring Human Physiological and Muscle Motion Signs. Nanomaterials 2018, 8, 1021. [Google Scholar] [CrossRef] [PubMed]
- Luo, Y.; Zhao, L.; Luo, G.; Dong, L.; Xia, Y.; Li, M.; Li, Z.; Wang, K.; Maeda, R.; Jiang, Z. Highly sensitive piezoresistive and thermally responsive fibrous networks from the in situ growth of PEDOT on MWCNT-decorated electrospun PU fibers for pressure and temperature sensing. Microsyst. Nanoeng. 2023, 9, 113. [Google Scholar] [CrossRef]
- Li, P.; Zhao, L.; Jiang, Z.; Yu, M.; Li, Z.; Li, X. Self-Powered Flexible Sensor Based on the Graphene Modified P(VDF-TrFE) Electrospun Fibers for Pressure Detection. Macromol. Mater. Eng. 2019, 304, 1900504. [Google Scholar] [CrossRef]
- Liu, M.; Liu, Y.; Zhou, L. Novel Flexible PVDF-TrFE and PVDF-TrFE/ZnO Pressure Sensor: Fabrication, Characterization and Investigation. Micromachines 2021, 12, 602. [Google Scholar] [CrossRef]
- Baker, C.O.; Huang, X.; Nelson, W.; Kaner, R.B. Polyaniline nanofibers: Broadening applications for conducting polymers. Chem. Soc. Rev. 2017, 46, 1510–1525. [Google Scholar] [CrossRef] [PubMed]
- Jin, X.; Xu, Z.; Wang, B.; Ding, S.; Ma, J.; Cui, M.; Wang, C.; Jiang, Y.; Liu, J.; Zhang, X. A highly sensitive and wide-range pressure sensor based on orientated and strengthened TPU nanofiber membranes fabricated by a conjugated electrospinning technology. Chem. Eng. J. Adv. 2023, 14, 100491. [Google Scholar] [CrossRef]
- Gao, L.; Zhu, C.; Li, L.; Zhang, C.; Liu, J.; Yu, H.-D.; Huang, W. All Paper-Based Flexible and Wearable Piezoresistive Pressure Sensor. ACS Appl. Mater. Interfaces 2019, 11, 25034–25042. [Google Scholar] [CrossRef]
- Park, J.; Lee, Y.; Hong, J.; Ha, M.; Jung, Y.-D.; Lim, H.; Kim, S.Y.; Ko, H. Giant Tunneling Piezoresistance of Composite Elastomers with Interlocked Microdome Arrays for Ultrasensitive and Multimodal Electronic Skins. ACS Nano 2014, 8, 4689–4697. [Google Scholar] [CrossRef]
- Park, J.; Kim, M.; Lee, Y.; Lee, H.S.; Ko, H. Fingertip skin–inspired microstructured ferroelectric skins discriminate static/dynamic pressure and temperature stimuli. Sci. Adv. 2015, 1, e1500661. [Google Scholar] [CrossRef] [PubMed]
- Park, J.; Kim, J.; Hong, J.; Lee, H.; Lee, Y.; Cho, S.; Kim, S.-W.; Kim, J.J.; Kim, S.Y.; Ko, H. Tailoring force sensitivity and selectivity by microstructure engineering of multidirectional electronic skins. NPG Asia Mater. 2018, 10, 163–176. [Google Scholar] [CrossRef]
- Choong, C.-L.; Shim, M.-B.; Lee, B.-S.; Jeon, S.; Ko, D.-S.; Kang, T.-H.; Bae, J.; Lee, S.H.; Byun, K.-E.; Im, J.; et al. Highly Stretchable Resistive Pressure Sensors Using a Conductive Elastomeric Composite on a Micropyramid Array. Adv. Mater. 2014, 26, 3451–3458. [Google Scholar] [CrossRef] [PubMed]
- Ha, M.; Lim, S.; Park, J.; Um, D.-S.; Lee, Y.; Ko, H. Bioinspired Interlocked and Hierarchical Design of ZnO Nanowire Arrays for Static and Dynamic Pressure-Sensitive Electronic Skins. Adv. Funct. Mater. 2015, 25, 2841–2849. [Google Scholar] [CrossRef]
- Xue, J.; Wu, T.; Dai, Y.; Xia, Y. Electrospinning and Electrospun Nanofibers: Methods, Materials, and Applications. Chem. Rev. 2019, 119, 5298–5415. [Google Scholar] [CrossRef] [PubMed]
- Wolf, C.; Tscherner, M.; Köstler, S. Ultra-fast opto-chemical sensors by using electrospun nanofibers as sensing layers. Sens Actuators B Chem. 2015, 209, 1064–1069. [Google Scholar] [CrossRef]
- Peng, S.; Blanloeuil, P.; Wu, S.; Wang, C.H. Rational Design of Ultrasensitive Pressure Sensors by Tailoring Microscopic Features. Adv. Mater. Interfaces 2018, 5, 1800403. [Google Scholar] [CrossRef]
- Sun, Q.-J.; Zhuang, J.; Venkatesh, S.; Zhou, Y.; Han, S.-T.; Wu, W.; Kong, K.-W.; Li, W.-J.; Chen, X.; Li, R.K.Y.; et al. Highly Sensitive and Ultrastable Skin Sensors for Biopressure and Bioforce Measurements Based on Hierarchical Microstructures. ACS Appl. Mater. Inter. 2018, 10, 4086–4094. [Google Scholar] [CrossRef]
- Wan, Y.; Qiu, Z.; Hong, Y.; Wang, Y.; Zhang, J.; Liu, Q.; Wu, Z.; Guo, C.F. A Highly Sensitive Flexible Capacitive Tactile Sensor with Sparse and High-Aspect-Ratio Microstructures. Adv. Electron. Mater. 2018, 4, 1700586. [Google Scholar] [CrossRef]
- Wang, X.; Gu, Y.; Xiong, Z.; Cui, Z.; Zhang, T. Silk-Molded Flexible, Ultrasensitive, and Highly Stable Electronic Skin for Monitoring Human Physiological Signals. Adv. Mater. 2014, 26, 1336–1342. [Google Scholar] [CrossRef]
- Pang, Y.; Zhang, K.; Yang, Z.; Jiang, S.; Ju, Z.; Li, Y.; Wang, X.; Wang, D.; Jian, M.; Zhang, Y.; et al. Epidermis Microstructure Inspired Graphene Pressure Sensor with Random Distributed Spinosum for High Sensitivity and Large Linearity. ACS Nano 2018, 12, 2346–2354. [Google Scholar] [CrossRef] [PubMed]
- Liu, Z.; Wang, J.; Zhang, Q.; Li, Z.; Li, Z.; Cheng, L.; Dai, F. Electrospinning Silk Fibroin/Graphene Nanofiber Membrane Used for 3D Wearable Pressure Sensor. Polymers 2022, 14, 3875. [Google Scholar] [CrossRef] [PubMed]


Disclaimer/Publisher’s Note: The statements, opinions and data contained in all publications are solely those of the individual author(s) and contributor(s) and not of MDPI and/or the editor(s). MDPI and/or the editor(s) disclaim responsibility for any injury to people or property resulting from any ideas, methods, instructions or products referred to in the content. |
© 2024 by the authors. Licensee MDPI, Basel, Switzerland. This article is an open access article distributed under the terms and conditions of the Creative Commons Attribution (CC BY) license (https://creativecommons.org/licenses/by/4.0/).
Share and Cite
Wang, B.; Du, R.; Liu, Y.; Song, H. PVA/PANI-DBSA Nanomesh Tactile Sensor for Force Feedback. Polymers 2024, 16, 1449. https://doi.org/10.3390/polym16111449
Wang B, Du R, Liu Y, Song H. PVA/PANI-DBSA Nanomesh Tactile Sensor for Force Feedback. Polymers. 2024; 16(11):1449. https://doi.org/10.3390/polym16111449
Chicago/Turabian StyleWang, Boyi, Rong Du, Yi Liu, and Han Song. 2024. "PVA/PANI-DBSA Nanomesh Tactile Sensor for Force Feedback" Polymers 16, no. 11: 1449. https://doi.org/10.3390/polym16111449