
Providing a Photovoltaic Performance Enhancement Relationship from Binary to Ternary Polymer Solar Cells via Machine Learning

Abstract
:1. Introduction
2. Materials and Methods
3. Results and Discussion
4. Conclusions
Supplementary Materials
Author Contributions
Funding
Institutional Review Board Statement
Data Availability Statement
Acknowledgments
Conflicts of Interest
References
- Wu, M.; Ma, B.; Li, S.; Han, J.; Zhao, W. Powering the Future: A Critical Review of Research Progress in Enhancing Stability of High-Efficiency Organic Solar Cells. Adv. Funct. Mater. 2023, 33, 2305445. [Google Scholar] [CrossRef]
- Zhang, Y.; Lang, Y.; Li, G. Recent advances of non-fullerene organic solar cells: From materials and morphology to devices and applications. EcoMat 2023, 5, e12281. [Google Scholar] [CrossRef]
- Yi, J.; Zhang, G.; Yu, H.; Yan, H. Advantages, challenges and molecular design of different material types used in organic solar cells. Nat. Rev. Mater. 2024, 9, 46–62. [Google Scholar] [CrossRef]
- Li, S.; Li, Z.; Wan, X.; Chen, Y. Recent progress in flexible organic solar cells. eScience 2023, 3, 100085. [Google Scholar] [CrossRef]
- Li, Y.; Liu, K.-K.; Lin, F.R.; Jen, A.K.-Y. Improving the Stability of Organic Solar Cells: From Materials to Devices. Sol. RRL 2023, 7, 2300531. [Google Scholar] [CrossRef]
- Zhang, X.; Zhang, H.; Li, S.; Xiao, L.; Zhang, S.; Han, B.; Kang, J.; Zhou, H. Development and application of blade-coating technique in organic solar cells. Nano Res. 2023, 16, 11571–11588. [Google Scholar] [CrossRef]
- Günther, M.; Kazerouni, N.; Blätte, D.; Perea, J.D.; Thompson, B.C.; Ameri, T. Models and mechanisms of ternary organic solar cells. Nat. Rev. Mater. 2023, 8, 456–471. [Google Scholar] [CrossRef]
- Suthar, R.; Dahiya, H.; Karak, S.; Sharma, G.D. Ternary Organic Solar Cells: Recent Insight on Structure–Processing–Property–Performance Relationships. Energy Technol. 2023, 11, 2201176. [Google Scholar] [CrossRef]
- Doumon, N.Y.; Yang, L.; Rosei, F. Ternary organic solar cells: A review of the role of the third element. Nano Energy 2022, 94, 106915. [Google Scholar] [CrossRef]
- Chang, L.; Sheng, M.; Duan, L.; Uddin, A. Ternary organic solar cells based on non-fullerene acceptors: A review. Org. Electron. 2021, 90, 106063. [Google Scholar] [CrossRef]
- Tan CA, W.; Wong, B.T. Unraveling the mystery of ternary organic solar cells: A review on the influence of third component on structure–morphology–performance relationships. Sol. RRL 2021, 5, 2100503. [Google Scholar] [CrossRef]
- Zhang, C.; Zhong, X.; Sun, X.; Lv, J.; Ji, Y.; Fu, J.; Zhao, C.; Yao, Y.; Zhang, G.; Deng, W. Designing a Novel Wide Bandgap Small Molecule Guest for Enhanced Stability and Morphology Mediation in Ternary Organic Solar Cells with over 19.3% Efficiency. Adv. Sci. 2024, 2401313. [Google Scholar] [CrossRef] [PubMed]
- Jung, S.; Cho, Y.; Kang, S.-H.; Yoon, S.-J.; Yang, C. Effect of third component on efficiency and stability in ternary organic solar cells: More than a simple superposition. Sol. RRL 2022, 6, 2100819. [Google Scholar] [CrossRef]
- Fan, Z.; Wang, Y.; Xu, S.; Hou, S.; Zhuang, C.; Wang, B. Versatile third components in organic ternary solar cells. Sol. Energy 2022, 231, 732–757. [Google Scholar] [CrossRef]
- Ma, R.; Liu, T.; Luo, Z.; Gao, K.; Chen, K.; Zhang, G.; Gao, W.; Xiao, Y.; Lau, T.-K.; Fan, Q. Adding a third component with reduced miscibility and higher LUMO level enables efficient ternary organic solar cells. ACS Energy Lett. 2020, 5, 2711–2720. [Google Scholar] [CrossRef]
- Xu, X.; Li, Y.; Peng, Q. Ternary blend organic solar cells: Understanding the morphology from recent progress. Adv. Mater. 2022, 34, 2107476. [Google Scholar] [CrossRef] [PubMed]
- Li, S.; Zhan, L.; Li, Y.; He, C.; Zuo, L.; Shi, M.; Chen, H. Achieving and Understanding of Highly Efficient Ternary Organic Photovoltaics: From Morphology and Energy Loss to Working Mechanism. Small Methods 2022, 6, 2200828. [Google Scholar] [CrossRef] [PubMed]
- Mohapatra, A.A.; Tiwari, V.; Patil, S. Energy transfer in ternary blend organic solar cells: Recent insights and future directions. Energy Environ. Sci. 2021, 14, 302–319. [Google Scholar] [CrossRef]
- Zhan, L.; Li, S.; Lau, T.-K.; Cui, Y.; Lu, X.; Shi, M.; Li, C.-Z.; Li, H.; Hou, J.; Chen, H. Over 17% efficiency ternary organic solar cells enabled by two non-fullerene acceptors working in an alloy-like model. Energy Environ. Sci. 2020, 13, 635–645. [Google Scholar] [CrossRef]
- Zhang, W.; Huang, J.; Xu, J.; Han, M.; Su, D.; Wu, N.; Zhang, C.; Xu, A.; Zhan, C. Phthalimide polymer donor guests enable over 17% efficient organic solar cells via parallel-like ternary and quaternary strategies. Adv. Energy Mater. 2020, 10, 2001436. [Google Scholar] [CrossRef]
- Mahmood, A.; Wang, J.-L. Machine learning for high performance organic solar cells: Current scenario and future prospects. Energy Environ. Sci. 2021, 14, 90–105. [Google Scholar] [CrossRef]
- Bansal, N.K.; Mishra, S.; Dixit, H.; Porwal, S.; Singh, P.; Singh, T. Machine learning in perovskite solar cells: Recent developments and future perspectives. Energy Technol. 2023, 11, 2300735. [Google Scholar] [CrossRef]
- Butler, K.T.; Davies, D.W.; Cartwright, H.; Isayev, O.; Walsh, A. Machine learning for molecular and materials science. Nature 2018, 559, 547–555. [Google Scholar] [CrossRef] [PubMed]
- Sahu, H.; Yang, F.; Ye, X.; Ma, J.; Fang, W.; Ma, H. Designing promising molecules for organic solar cells via machine learning assisted virtual screening. J. Mater. Chem. A 2019, 7, 17480–17488. [Google Scholar] [CrossRef]
- Kranthiraja, K.; Saeki, A. Experiment-oriented machine learning of polymer: Non-fullerene organic solar cells. Adv. Funct. Mater. 2021, 31, 2011168. [Google Scholar] [CrossRef]
- Huang, D.; Wang, K.; Li, Z.; Zhou, H.; Zhao, X.; Peng, X.; Wu, J.; Liang, J.; Meng, J.; Zhao, L. A machine learning prediction model for quantitative analyzing the influence of non-radiative voltage loss on non-fullerene organic solar cells. Chem. Eng. J. 2023, 475, 145958. [Google Scholar] [CrossRef]
- Jørgensen, P.B.; Mesta, M.; Shil, S.; García Lastra, J.M.; Jacobsen, K.W.; Thygesen, K.S.; Schmidt, M.N. Machine learning-based screening of complex molecules for polymer solar cells. J. Chem. Phys. 2018, 148, 241735. [Google Scholar] [CrossRef] [PubMed]
- Wang, K.; Guo, C.; Li, Z.; Zhang, R.; Feng, Z.; Fang, G.; Huang, D.; Liang, J.; Zhao, L.; Li, Z. Machine learning assisted identification of the matched energy level of materials for high open circuit voltage in binary organic solar cells. Mol. Syst. Des. Eng. 2023, 8, 799–809. [Google Scholar] [CrossRef]
- Buratti, Y.; Eijkens, C.; Hameiri, Z. Optimization of solar cell production lines using neural networks and genetic algorithms. ACS Appl. Energy Mater. 2020, 3, 10317–10322. [Google Scholar] [CrossRef]
- Malhotra, P.; Khandelwal, K.; Biswas, S.; Chen, F.-C.; Sharma, G.D. Opportunities and challenges for machine learning to select combination of donor and acceptor materials for efficient organic solar cells. J. Mater. Chem. C 2022, 10, 17781–17811. [Google Scholar] [CrossRef]
- Majeed, N.; Saladina, M.; Krompiec, M.; Greedy, S.; Deibel, C.; MacKenzie, R.C. Using deep machine learning to understand the physical performance bottlenecks in novel thin-film solar cells. Adv. Funct. Mater. 2020, 30, 1907259. [Google Scholar] [CrossRef]
- Wang, H.; Feng, J.; Dong, Z.; Jin, L.; Li, M.; Yuan, J.; Li, Y. Efficient screening framework for organic solar cells with deep learning and ensemble learning. npj Comput. Mater. 2023, 9, 200. [Google Scholar] [CrossRef]
- Shi, Y.; Shi, H.; Zhang, Y.; Zang, X.; Zhao, Z.; Zhao, S.; Qiao, B.; Liang, Z.; Xu, Z.; Wang, L. Identifying the Quantitative Relationship Between the Molecular Structure and the Horizontal Transition Dipole Orientation of TADF Emitters. Adv. Opt. Mater. 2024, 12, 2301768. [Google Scholar] [CrossRef]
- Liu, W.; Meng, N.; Huo, X.; Lu, Y.; Zhang, Y.; Huang, X.; Liang, Z.; Zhao, S.; Qiao, B.; Liang, Z. Machine learning enables intelligent screening of interface materials towards minimizing voltage losses for pin type perovskite solar cells. J. Energy Chem. 2023, 83, 128–137. [Google Scholar] [CrossRef]
- Sun, W.; Zheng, Y.; Yang, K.; Zhang, Q.; Shah, A.A.; Wu, Z.; Sun, Y.; Feng, L.; Chen, D.; Xiao, Z. Machine learning–assisted molecular design and efficiency prediction for high-performance organic photovoltaic materials. Sci. Adv. 2019, 5, eaay4275. [Google Scholar] [CrossRef] [PubMed]
- Cao, D.-S.; Xu, Q.-S.; Hu, Q.-N.; Liang, Y.-Z. ChemoPy: Freely available python package for computational biology and chemoinformatics. Bioinformatics 2013, 29, 1092–1094. [Google Scholar] [CrossRef]
- Cao, D.-S.; Hu, Q.-N.; Xu, Q.-S.; Yang, Y.-N.; Zhao, J.-C.; Lu, H.-M.; Zhang, L.-X.; Liang, Y.-Z. In silico classification of human maximum recommended daily dose based on modified random forest and substructure fingerprint. Anal. Chim. Acta 2011, 692, 50–56. [Google Scholar] [CrossRef] [PubMed]
- Muegge, I.; Mukherjee, P. An overview of molecular fingerprint similarity search in virtual screening. Expert Opin. Drug Discov. 2016, 11, 137–148. [Google Scholar] [CrossRef] [PubMed]
- Fang, W.; Zhou, J.; Li, X.; Zhu, K.Q. Unpack local model interpretation for gbdt. In Database Systems for Advanced Applications, Proceedings of the 23rd International Conference, DASFAA 2018, Gold Coast, QLD, Australia, 21–24 May 2018; Proceedings; Part II 23; Springer International Publishing: Berlin/Heidelberg, Germany, 2018; pp. 764–775. [Google Scholar]
- Cheng, P.; Yang, Y. Narrowing the band gap: The key to high-performance organic photovoltaics. Acc. Chem. Res. 2020, 53, 1218–1228. [Google Scholar] [CrossRef] [PubMed]
- Cui, Y.; Zhu, P.; Hu, H.; Xia, X.; Lu, X.; Yu, S.; Chen, Y. Impact of Electrostatic Interaction on Non-radiative Recombination Energy Losses in Organic Solar Cells Based on Asymmetric Acceptors. Angew. Chem. 2023, 135, e202304931. [Google Scholar] [CrossRef]
- Yang, M.; Tan, X.; Yin, B.; Kim, S.; Pang, S.; Chen, Z.; Yang, X.; Yang, C.; Liu, Z.; Duan, C. Near-Infrared Electron Acceptors with Cyano-Substituted 2-(3-Oxo-2, 3-dihydroinden-1-ylidene) malononitrile End-Groups for Organic Solar Cells. ACS Energy Lett. 2023, 8, 2641–2651. [Google Scholar] [CrossRef]
- Yan, L.; Zhang, H.; An, Q.; Jiang, M.; Mahmood, A.; Jee, M.H.; Bai, H.R.; Zhi, H.F.; Zhang, S.; Woo, H.Y. Regioisomer-free difluoro-monochloro terminal-based hexa-halogenated acceptor with optimized crystal packing for efficient binary organic solar cells. Angew. Chem. Int. Ed. 2022, 61, e202209454. [Google Scholar] [CrossRef] [PubMed]
- Chen, Y.; Bai, F.; Peng, Z.; Zhu, L.; Zhang, J.; Zou, X.; Qin, Y.; Kim, H.K.; Yuan, J.; Ma, L.K. Asymmetric alkoxy and alkyl substitution on nonfullerene acceptors enabling high-performance organic solar cells. Adv. Energy Mater. 2021, 11, 2003141. [Google Scholar] [CrossRef]
- Hao, T.; Leng, S.; Yang, Y.; Zhong, W.; Zhang, M.; Zhu, L.; Song, J.; Xu, J.; Zhou, G.; Zou, Y. Capture the high-efficiency non-fullerene ternary organic solar cells formula by machine-learning-assisted energy-level alignment optimization. Patterns 2021, 2, 100333. [Google Scholar] [CrossRef] [PubMed]
- Jiang, W.; Yu, R.; Liu, Z.; Peng, R.; Mi, D.; Hong, L.; Wei, Q.; Hou, J.; Kuang, Y.; Ge, Z. Ternary nonfullerene polymer solar cells with 12.16% efficiency by introducing one acceptor with cascading energy level and complementary absorption. Adv. Mater. 2018, 30, 1703005. [Google Scholar] [CrossRef] [PubMed]
- Liu, J.; Liu, X.; Xin, J.; Zhang, Y.; Wen, L.; Liang, Q.; Miao, Z. Dual Function of the Third Component in Ternary Organic Solar Cells: Broaden the Spectrum and Optimize the Morphology. Small 2024, 2308863. [Google Scholar] [CrossRef] [PubMed]
- Ding, X.; Li, Z. The effect of the third component on high performance ternary organic solar cells: A review. J. Polym. Sci. 2023, 61, 3022–3038. [Google Scholar] [CrossRef]
- Zhang, L.; Ma, W. Morphology optimization in ternary organic solar cells. Chin. J. Polym. Sci. 2017, 35, 184–197. [Google Scholar] [CrossRef]
- Vanden Broeck, G.; Lykov, A.; Schleich, M.; Suciu, D. On the tractability of SHAP explanations. J. Artif. Intell. Res. 2022, 74, 851–886. [Google Scholar] [CrossRef]
- Cui, Y.; Xu, Y.; Yao, H.; Bi, P.; Hong, L.; Zhang, J.; Zu, Y.; Zhang, T.; Qin, J.; Ren, J. Single-junction organic photovoltaic cell with 19% efficiency. Adv. Mater. 2021, 33, 2102420. [Google Scholar] [CrossRef] [PubMed]
- Lu, H.; Ran, G.; Liu, Y.; Pei, Z.; Liu, W.; Liu, Y.; Tang, Z.; Zhang, W.; Bo, Z. Green-Solvent-Processed High-Performance Ternary Organic Solar Cells Comprising a Highly Soluble and Fluorescent Third Component. Adv. Funct. Mater. 2023, 33, 2301866. [Google Scholar] [CrossRef]
- Cui, Y.; Yao, H.; Zhang, J.; Xian, K.; Zhang, T.; Hong, L.; Wang, Y.; Xu, Y.; Ma, K.; An, C. Single-junction organic photovoltaic cells with approaching 18% efficiency. Adv. Mater. 2020, 32, 1908205. [Google Scholar] [CrossRef] [PubMed]
- Luo, D.; Zhang, L.; Zeng, J.; Chi, W.; Zhou, J.; Zhou, E.; Li, L.; Iwahashi, T.; Michinobu, T.; Ouchi, Y. Revealing the Effect of Halogenation Strategy on the Regulation of Crystallization Kinetics and Molecular Packing for High-Performance Organic Solar Cells. Adv. Funct. Mater. 2024, 34, 2311736. [Google Scholar] [CrossRef]
- Yu, H.; Wang, Y.; Zou, X.; Han, H.; Kim, H.K.; Yao, Z.; Wang, Z.; Li, Y.; Ng, H.M.; Zhou, W. Effects of Halogenation of Small-Molecule and Polymeric Acceptors for Efficient Organic Solar Cells. Adv. Funct. Mater. 2023, 33, 2300712. [Google Scholar] [CrossRef]
- Ma, R.; Li, G.; Li, D.; Liu, T.; Luo, Z.; Zhang, G.; Zhang, M.; Wang, Z.; Luo, S.; Yang, T. Understanding the effect of end group halogenation in tuning miscibility and morphology of high-performance small molecular acceptors. Sol. RRL 2020, 4, 2000250. [Google Scholar] [CrossRef]
- Li, C.; Zhou, J.; Song, J.; Xu, J.; Zhang, H.; Zhang, X.; Guo, J.; Zhu, L.; Wei, D.; Han, G. Non-fullerene acceptors with branched side chains and improved molecular packing to exceed 18% efficiency in organic solar cells. Nat. Energy 2021, 6, 605–613. [Google Scholar] [CrossRef]
- Zhang, Y.; Deng, W.; Petoukhoff, C.E.; Xia, X.; Lang, Y.; Xia, H.; Tang, H.; Chandran, H.T.; Mahadevan, S.; Liu, K. Achieving 19.4% organic solar cell via an in situ formation of pin structure with built-in interpenetrating network. Joule 2024, 8, 509–526. [Google Scholar] [CrossRef]


| ML Models | Molecular Fingerprint Types | R2 Train/Test | RMSE Train/Test | MAE Train/Test | MAPE Train/Test |
|---|---|---|---|---|---|
| DT | E-state FPs | 0.876/0.802 | 1.374/1.884 | 1.155/1.619 | 0.394/0.534 |
| Substructure FPs | 0.893/0.828 | 1.426/1.753 | 0.843/1.504 | 0.745/0.426 | |
| 2D-atom-pair FPs | 0.905/0.833 | 1.305/1.728 | 0.918/1.433 | 0.485/0.485 | |
| RF | E-state FPs | 0.939/0.834 | 1.080/1.745 | 0.759/1.381 | 0.754/0.439 |
| Substructure FPs | 0.938/0.856 | 1.075/1.604 | 0.725/1.360 | 0.825/0.451 | |
| 2D-atom-pair FPs | 0.953/0.910 | 0.944/1.330 | 0.668/0.815 | 0.636/0.555 | |
| AdaBoost | E-state FPs | 0.822/0.725 | 1.844/2.490 | 1.484/1.775 | 0.417/0.311 |
| Substructure FPs | 0.849/0.759 | 1.708/2.154 | 1.398/1.481 | 0.464/0.394 | |
| 2D-atom-pair FPs | 0.885/0.795 | 1.396/1.915 | 1.012/1.607 | 0.576/0.439 | |
| XGBoost | E-state FPs | 0.958/0.846 | 0.866/1.661 | 0.637/1.342 | 0.187/0.425 |
| Substructure FPs | 0.947/0.866 | 0.924/1.547 | 0.675/1.355 | 0.176/0.499 | |
| 2D-atom-pair FPs | 0.966/0.901 | 0.821/1.334 | 0.613/0.943 | 0.210/0.479 | |
| GBDT | E-state FPs | 0.980/0.901 | 0.619/1.395 | 0.467/0.874 | 0.129/0.463 |
| Substructure FPs | 0.976/0.893 | 0.685/1.428 | 0.425/0.866 | 0.107/0.351 | |
| 2D-atom-pair FPs | 0.981/0.912 | 0.587/1.311 | 0.412/0.845 | 0.102/0.237 |
| ML Models | Molecular Fingerprint Types | R2 Train/Test | RMSE Train/Test | MAE Train/Test | MAPE Train/Test |
|---|---|---|---|---|---|
| GBDT | E-state FPs | 0.991/0.921 | 0.307/0.854 | 0.239/0.636 | 0.019/0.049 |
| Substructure FPs | 0.992/0.928 | 0.300/0.819 | 0.222/0.587 | 0.018/0.046 | |
| 2D-atom-pair FPs | 0.996/0.934 | 0.218/0.781 | 0.168/0.552 | 0.013/0.043 | |
| 9 Key FPs from BPSCs | 0.968/0.908 | 0.548/0.921 | 0.454/0.695 | 0.032/0.053 | |
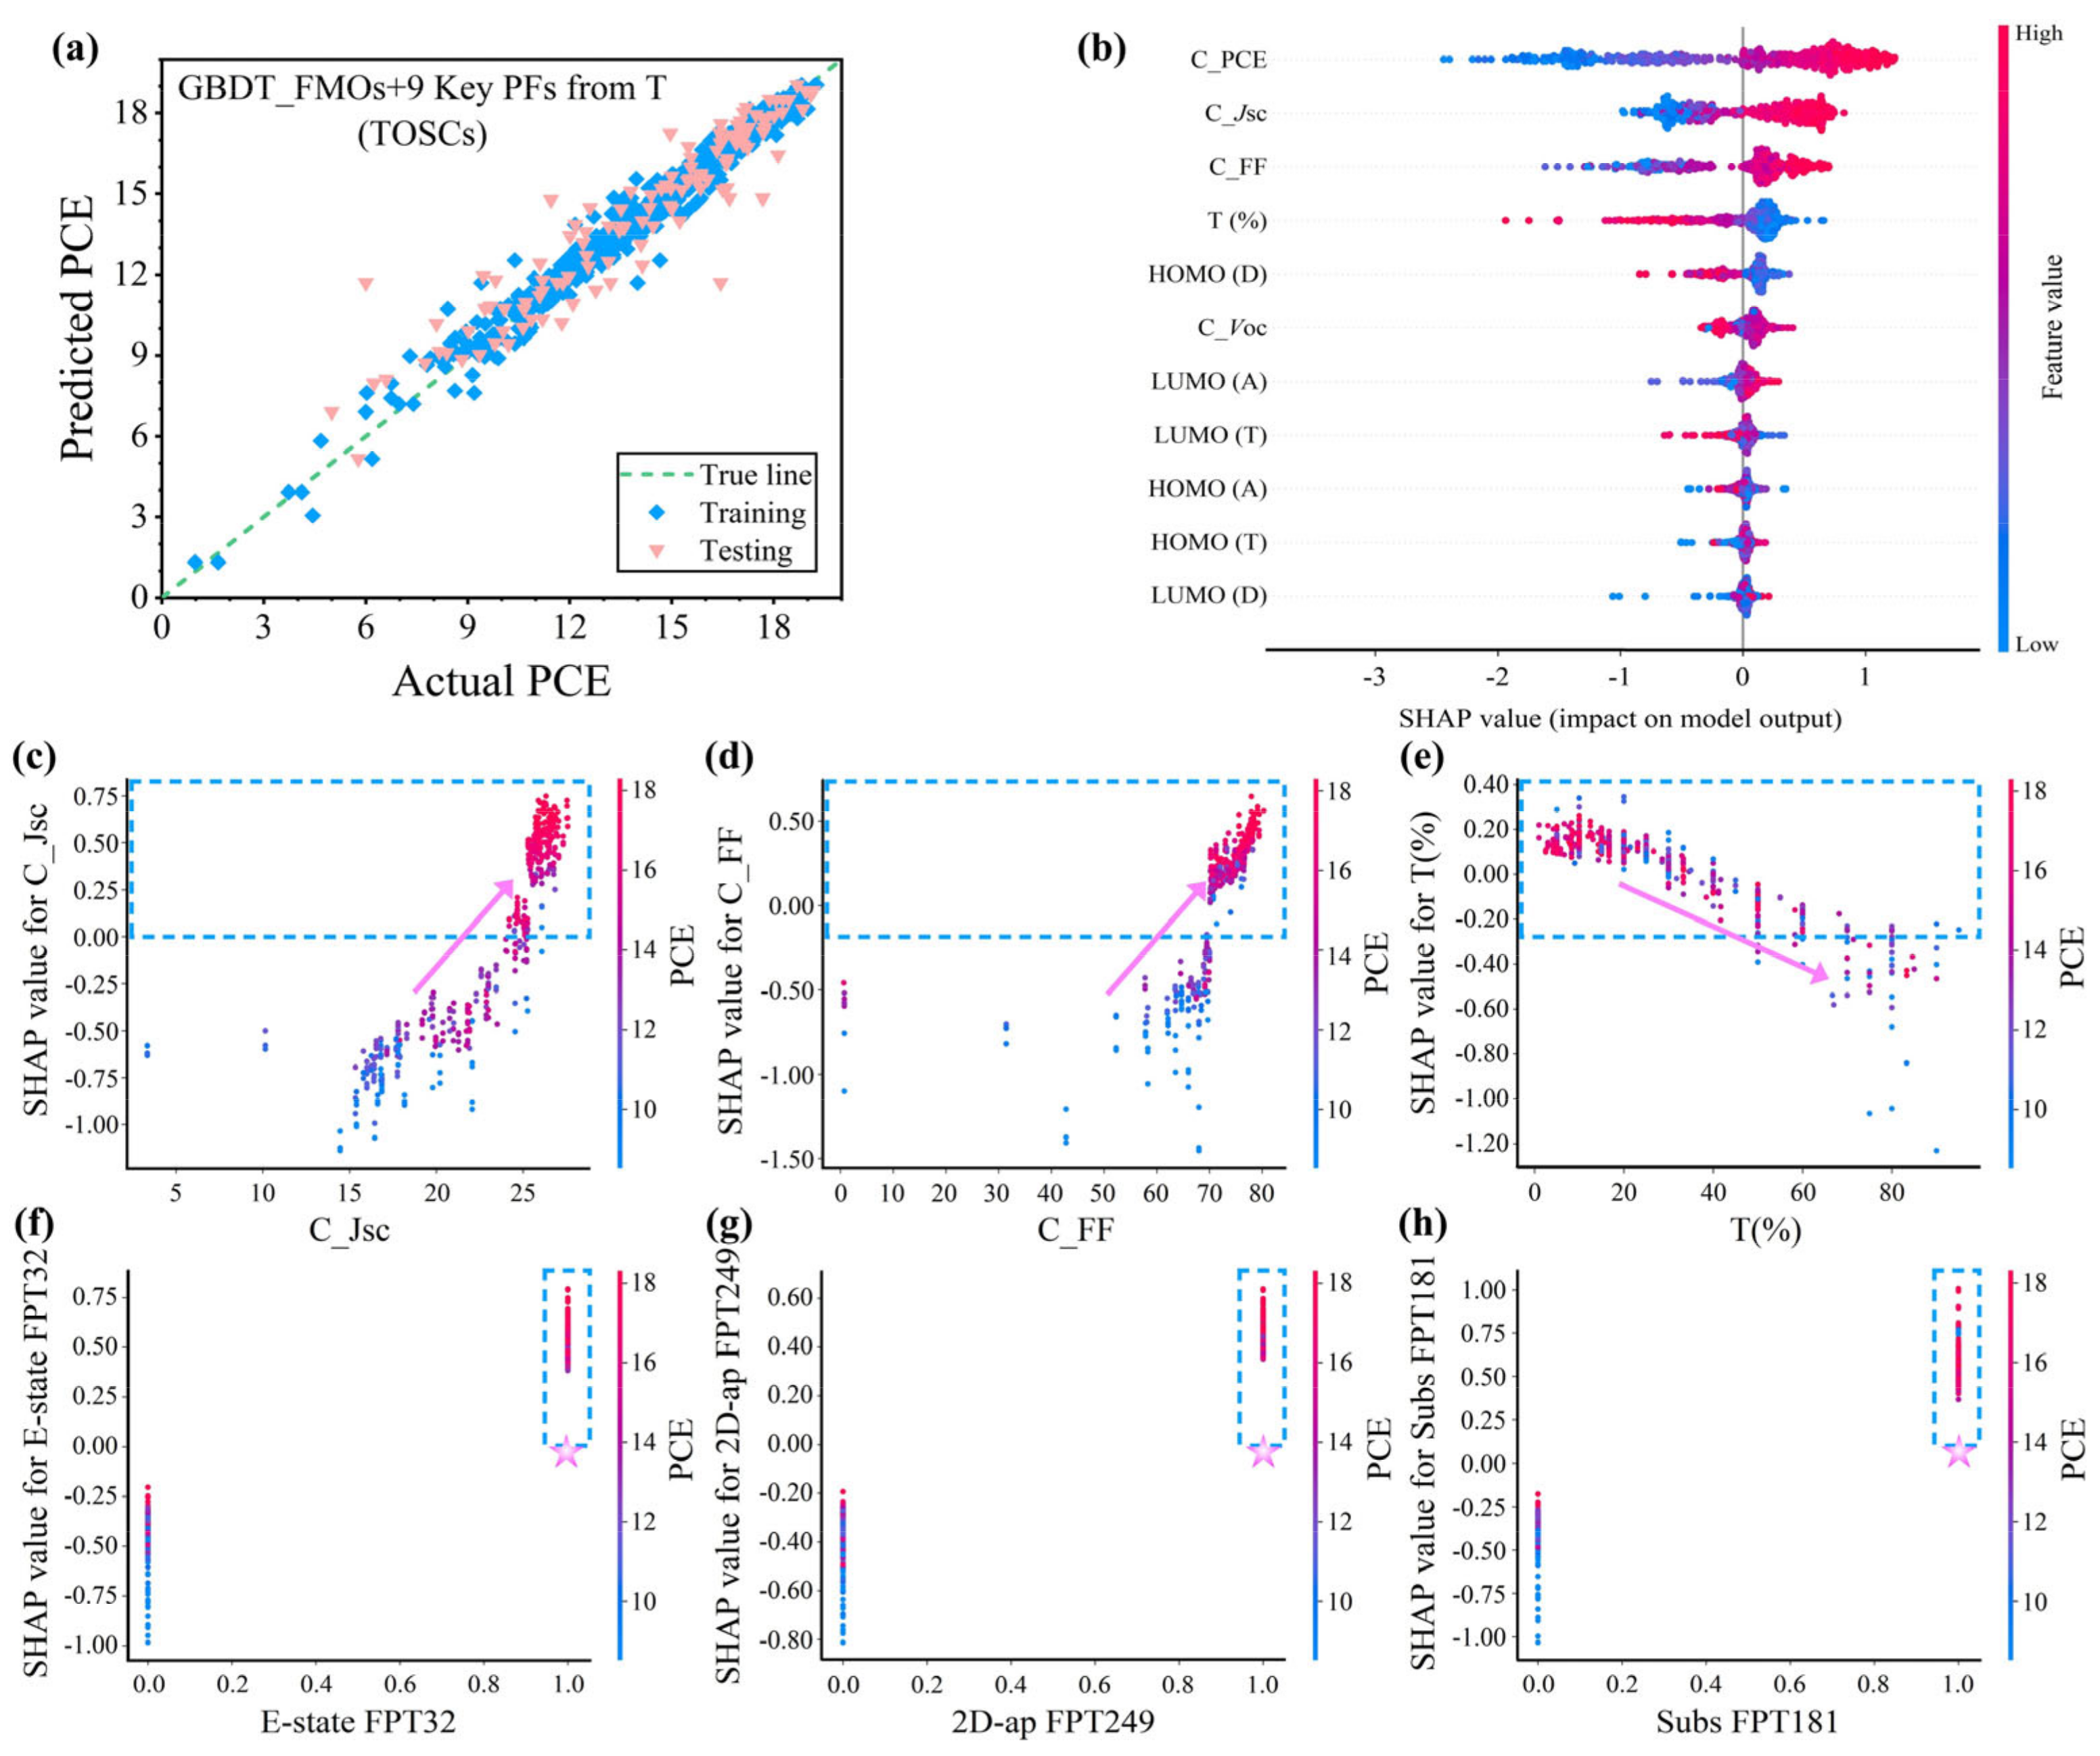
| 9 Key FPs from T | 0.935/0.876 | 0.778/1.190 | 0.561/0.796 | 0.044/0.069 |
| Systems | Devices | Voc (V) | Jsc (mA cm−2) | FF (%) | PCE (%) | Predicted PCE (%) | Relative Error (%) |
|---|---|---|---|---|---|---|---|
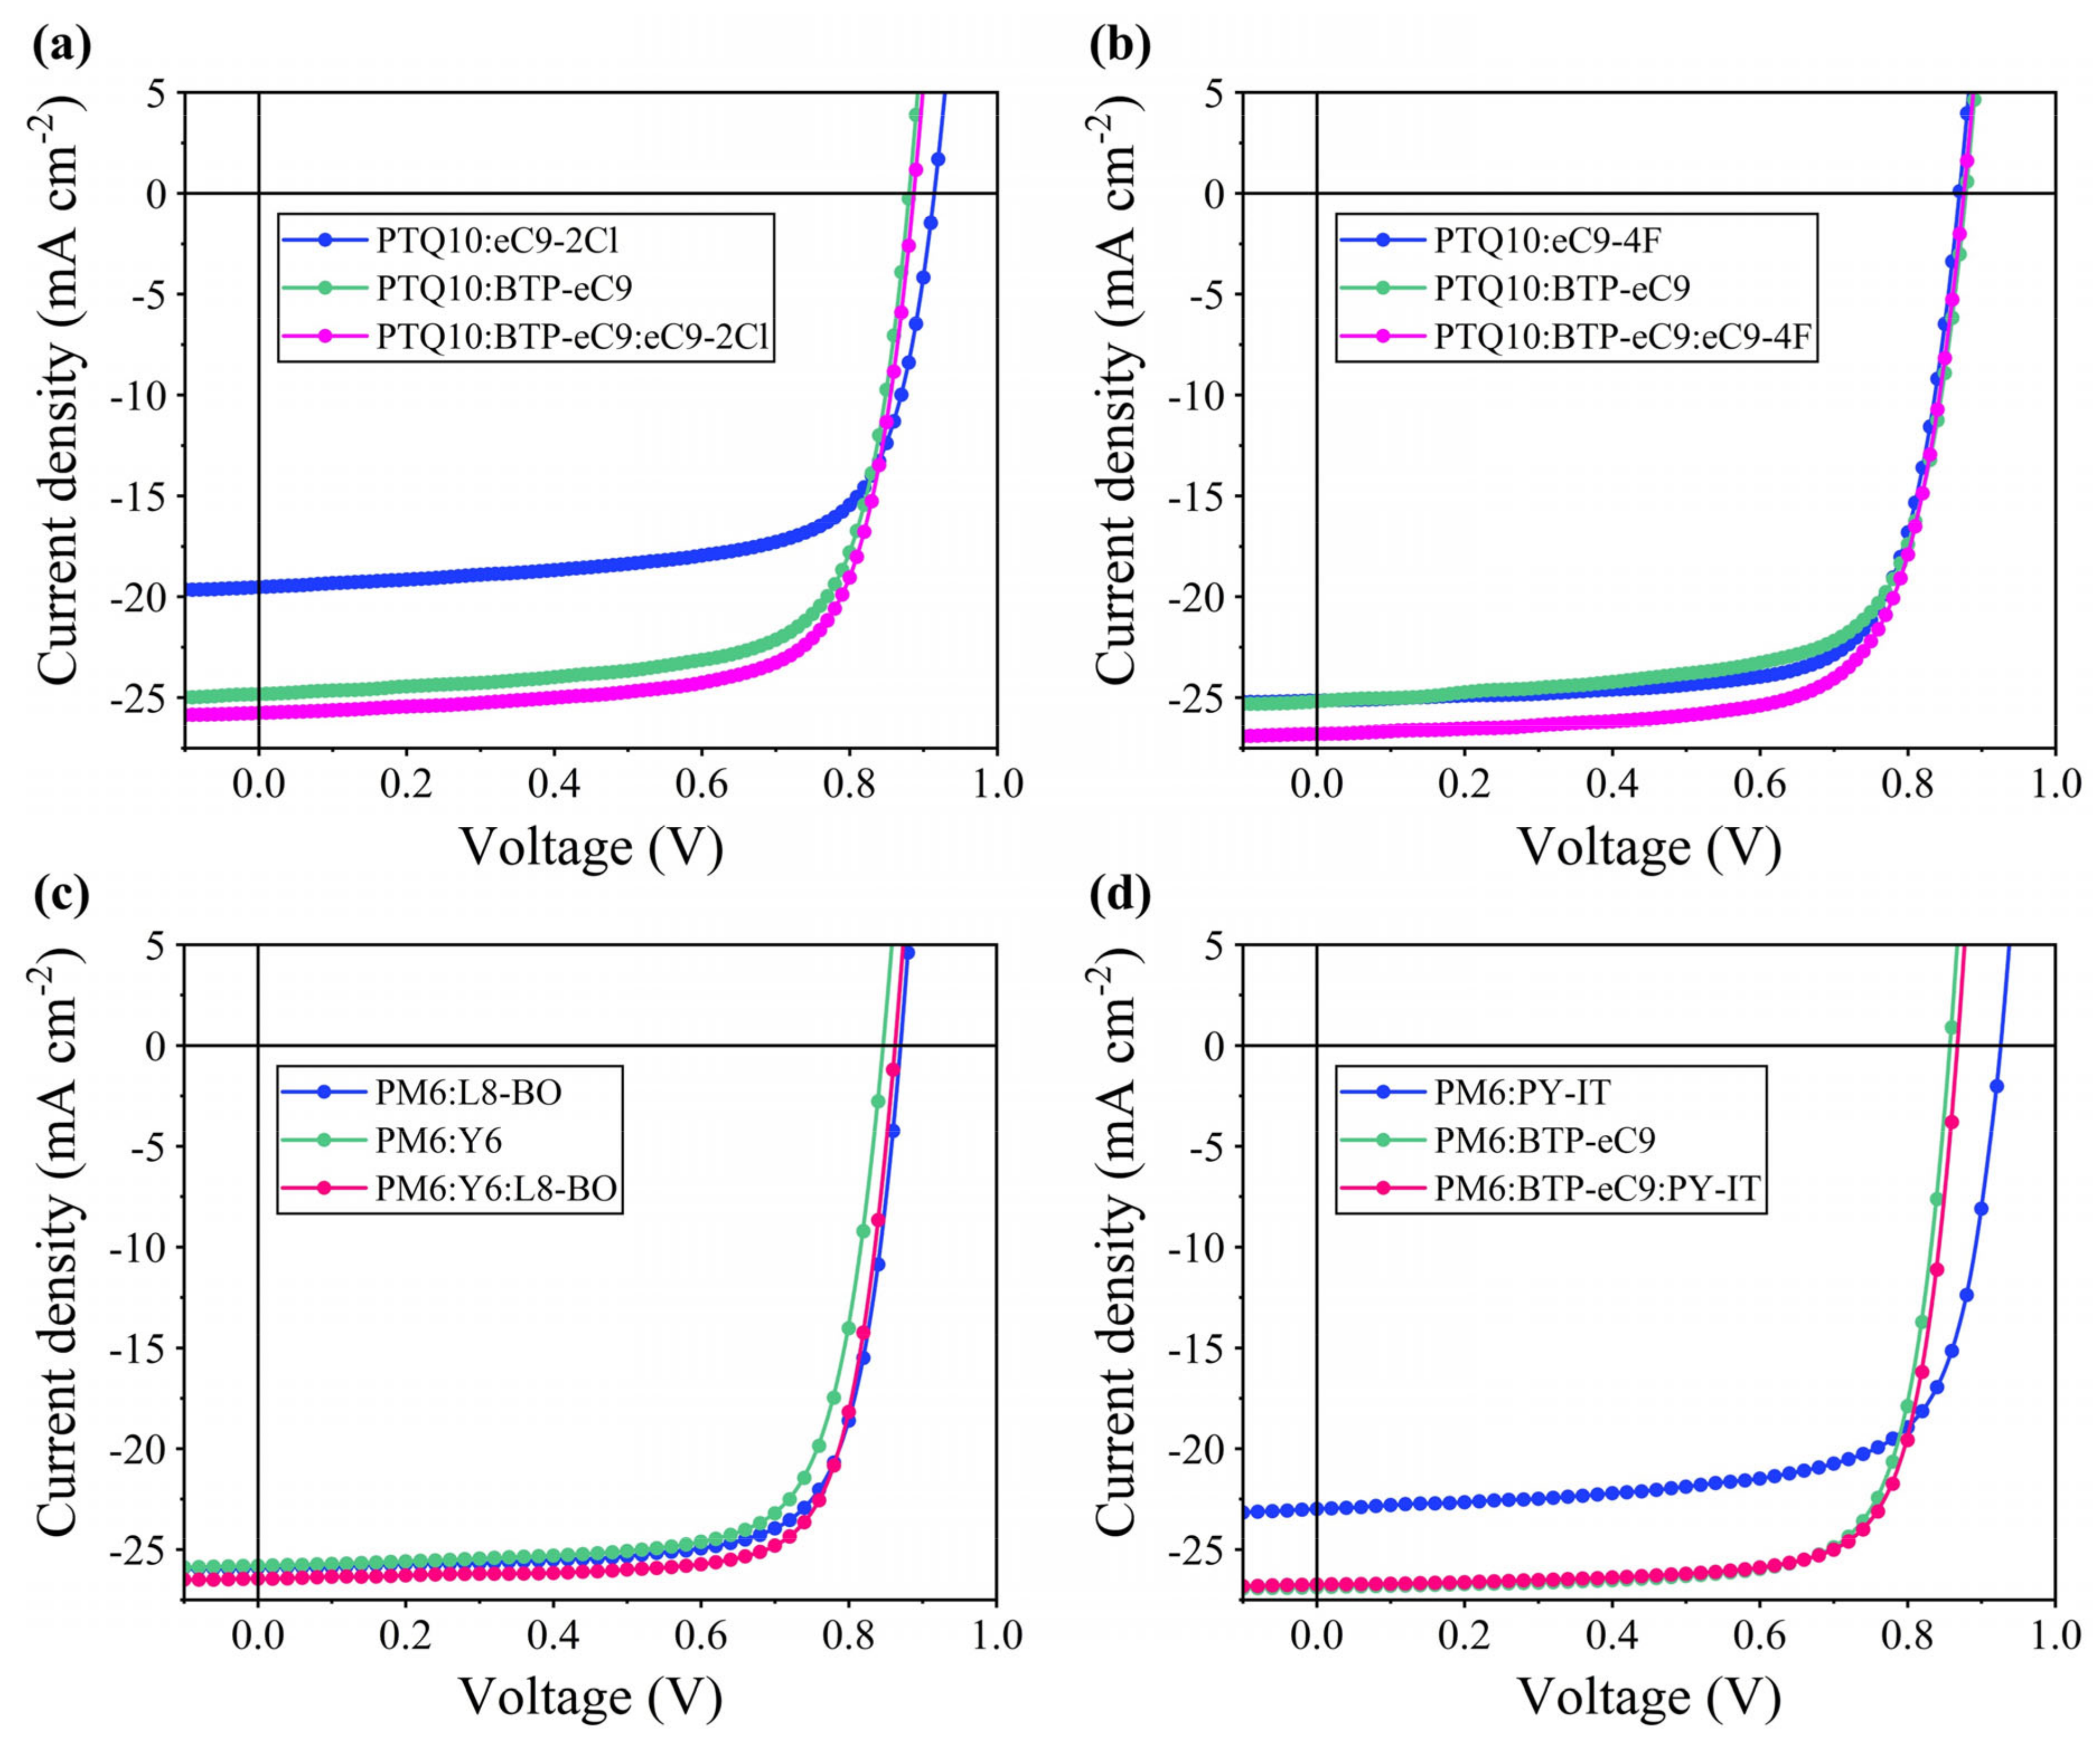
| PTQ10 | PTQ10:eC9-2Cl | 0.915 | 19.53 | 70.25 | 12.55 | 13.12 | 4.54 |
| PTQ10:BTP-eC9 | 0.880 | 24.83 | 71.75 | 15.68 | 15.74 | 0.38 | |
| PTQ10:BTP-eC9:eC9-2Cl | 0.887 | 25.76 | 72.48 | 16.56 | 16.79 | 1.39 | |
| PTQ10:eC9-4F | 0.870 | 25.15 | 73.58 | 16.10 | 15.88 | 1.37 | |
| PTQ10:BTP-eC9 | 0.878 | 25.20 | 70.81 | 15.66 | 16.12 | 2.94 | |
| PTQ10:BTP-eC9:eC9-4F | 0.876 | 26.80 | 72.06 | 16.92 | 17.14 | 1.30 | |
| PM6 | PM6:L8-BO | 0.871 | 25.91 | 75.32 | 16.99 | 17.31 | 1.88 |
| PM6:Y6 | 0.847 | 25.79 | 74.38 | 16.25 | 15.78 | 2.89 | |
| PM6:Y6:L8-BO | 0.863 | 26.46 | 76.90 | 17.57 | 17.86 | 1.65 | |
| PM6:PY-IT | 0.926 | 22.93 | 71.46 | 15.20 | 15.75 | 3.62 | |
| PM6:BTP-eC9 | 0.858 | 26.87 | 76.11 | 17.55 | 17.23 | 1.82 | |
| PM6:BTP-eC9:PY-IT | 0.868 | 26.74 | 76.60 | 17.78 | 18.03 | 1.41 |
Disclaimer/Publisher’s Note: The statements, opinions and data contained in all publications are solely those of the individual author(s) and contributor(s) and not of MDPI and/or the editor(s). MDPI and/or the editor(s) disclaim responsibility for any injury to people or property resulting from any ideas, methods, instructions or products referred to in the content. |
© 2024 by the authors. Licensee MDPI, Basel, Switzerland. This article is an open access article distributed under the terms and conditions of the Creative Commons Attribution (CC BY) license (https://creativecommons.org/licenses/by/4.0/).
Share and Cite
Cao, J.; Xu, Z. Providing a Photovoltaic Performance Enhancement Relationship from Binary to Ternary Polymer Solar Cells via Machine Learning. Polymers 2024, 16, 1496. https://doi.org/10.3390/polym16111496
Cao J, Xu Z. Providing a Photovoltaic Performance Enhancement Relationship from Binary to Ternary Polymer Solar Cells via Machine Learning. Polymers. 2024; 16(11):1496. https://doi.org/10.3390/polym16111496
Chicago/Turabian StyleCao, Jingyue, and Zheng Xu. 2024. "Providing a Photovoltaic Performance Enhancement Relationship from Binary to Ternary Polymer Solar Cells via Machine Learning" Polymers 16, no. 11: 1496. https://doi.org/10.3390/polym16111496