
Influence of the Manufacturing Method (3D Printing and Injection Molding) on Water Absorption and Mechanical and Thermal Properties of Polymer Composites Based on Poly(lactic acid)


Abstract
:1. Introduction
2. Materials and Methods
2.1. Materials
2.2. Methods
2.2.1. 3D Printing
2.2.2. Injection Molding
2.3. Characterization
2.3.1. Water Absorption Test
2.3.2. Mechanical Tests
2.3.3. Thermal Analysis
2.3.4. Microscopic Analysis
3. Results
3.1. Water Absorption Test
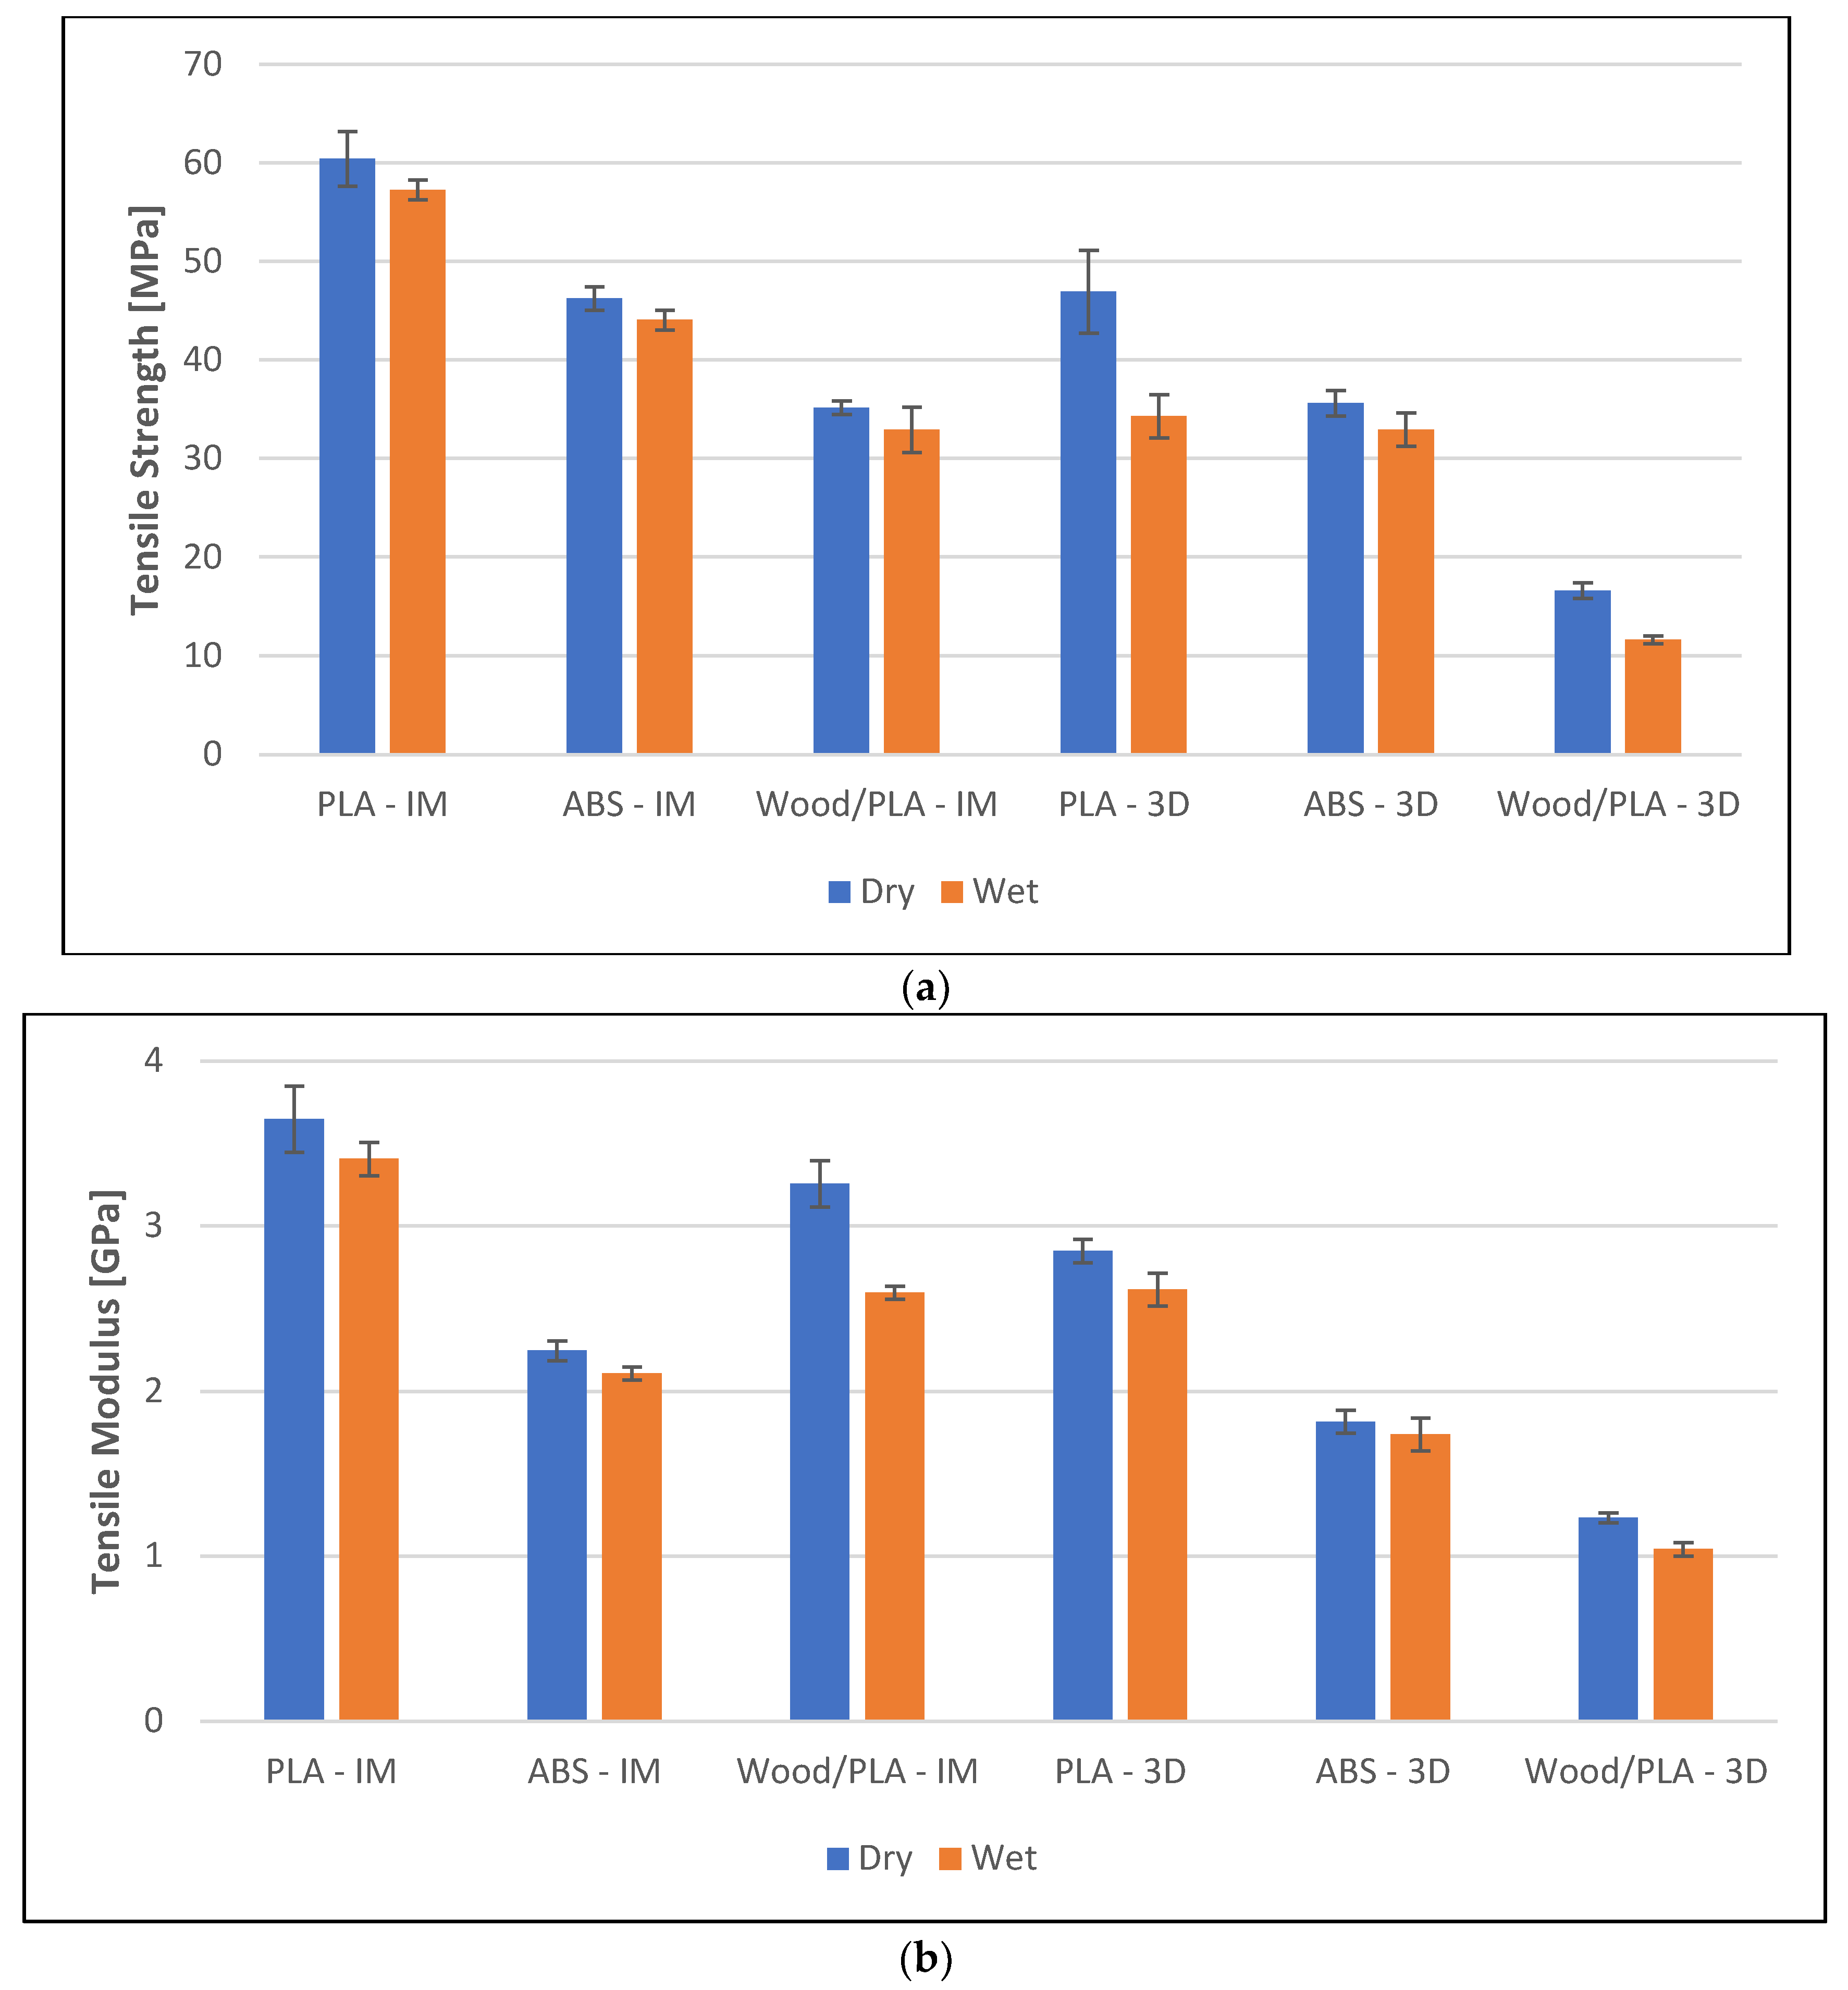
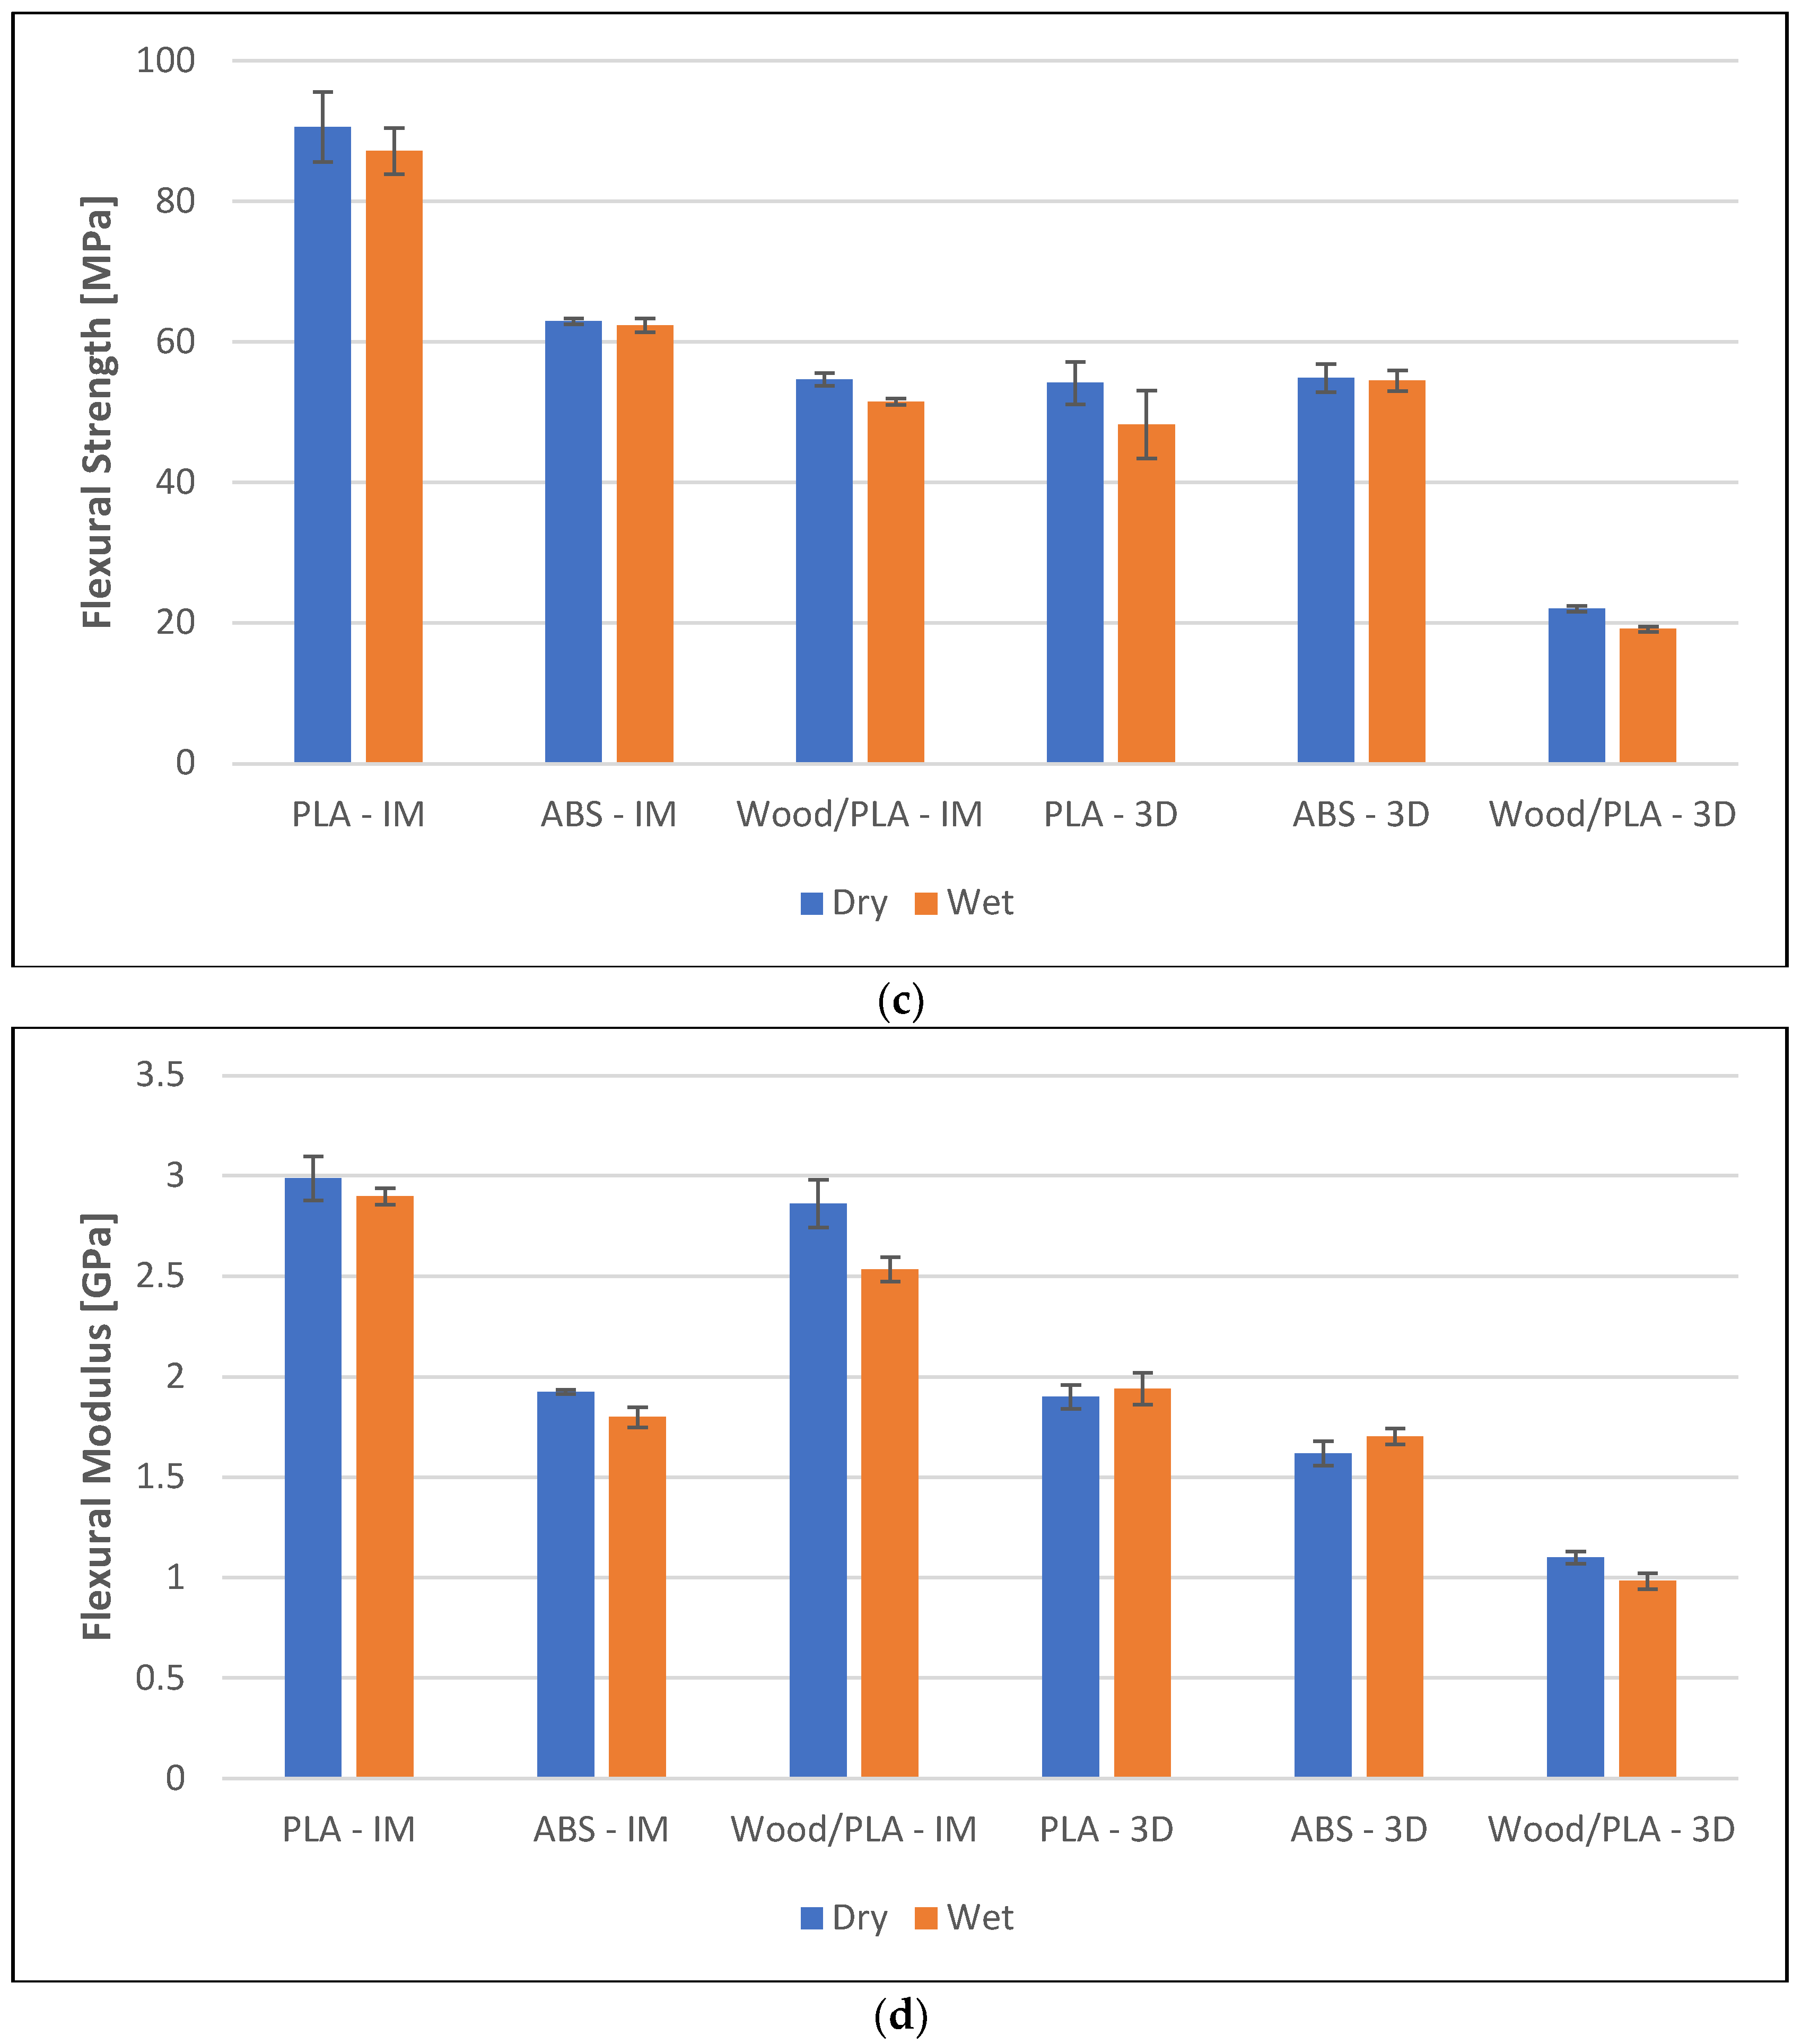
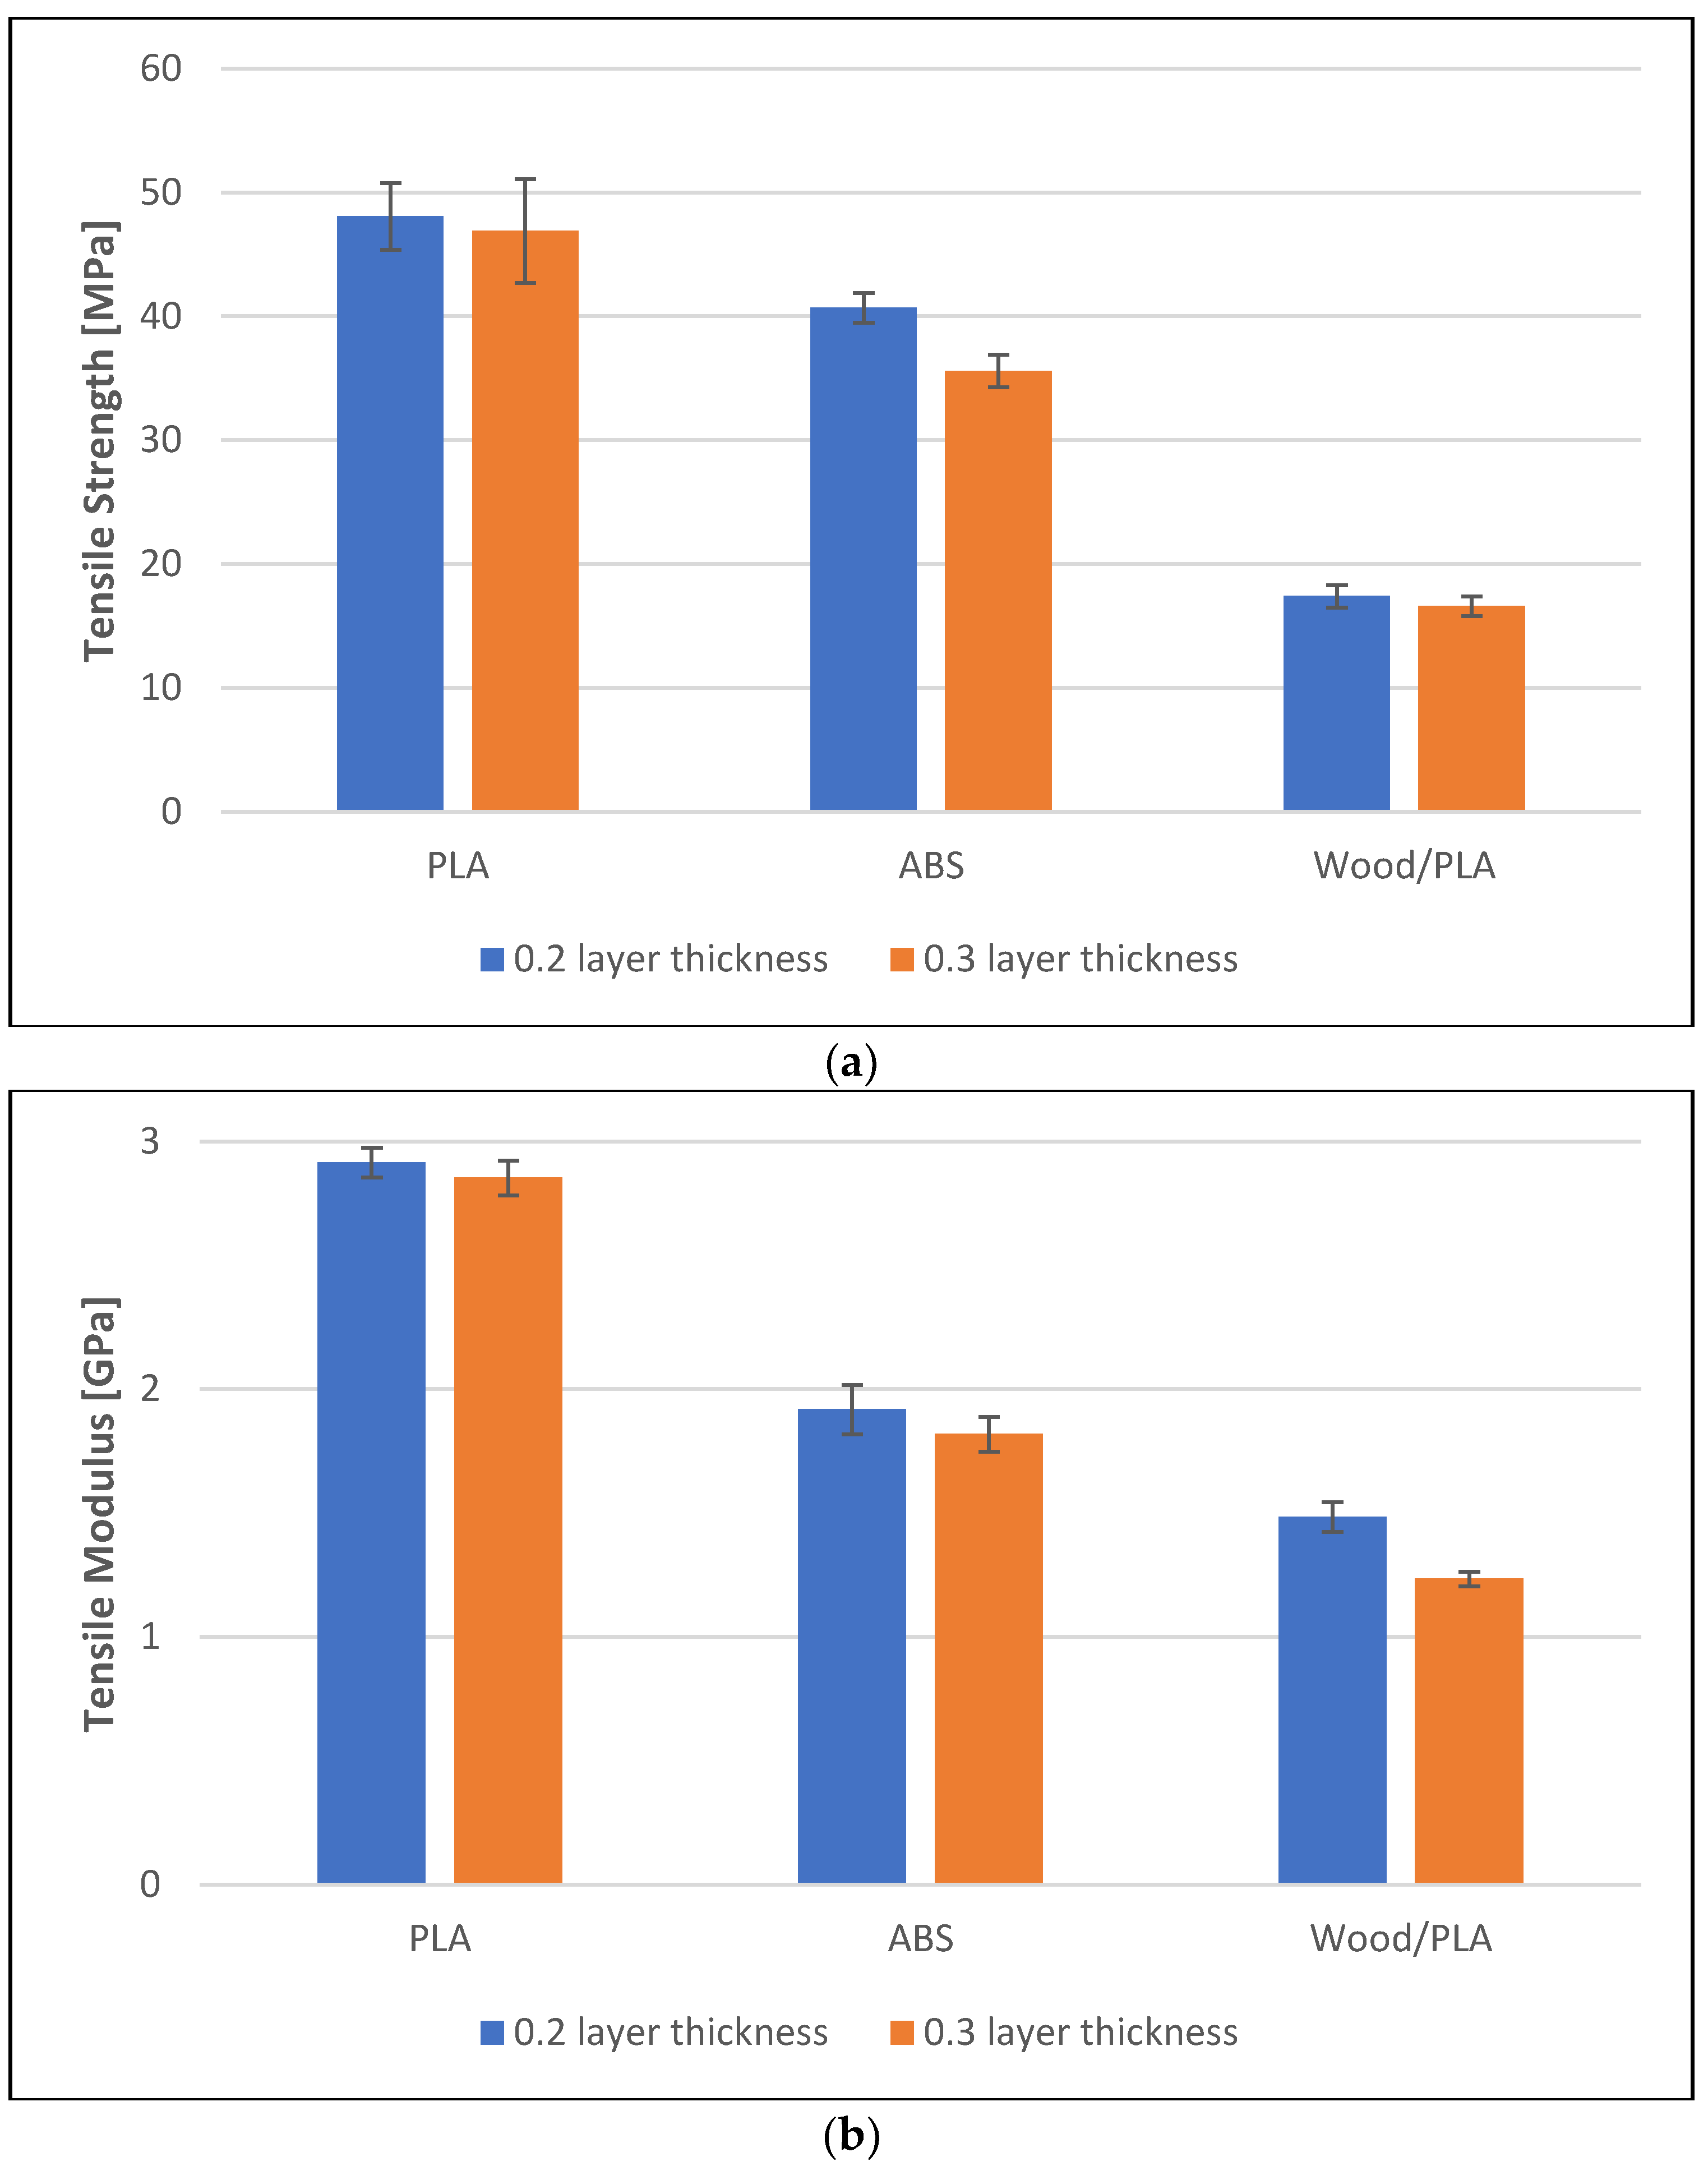
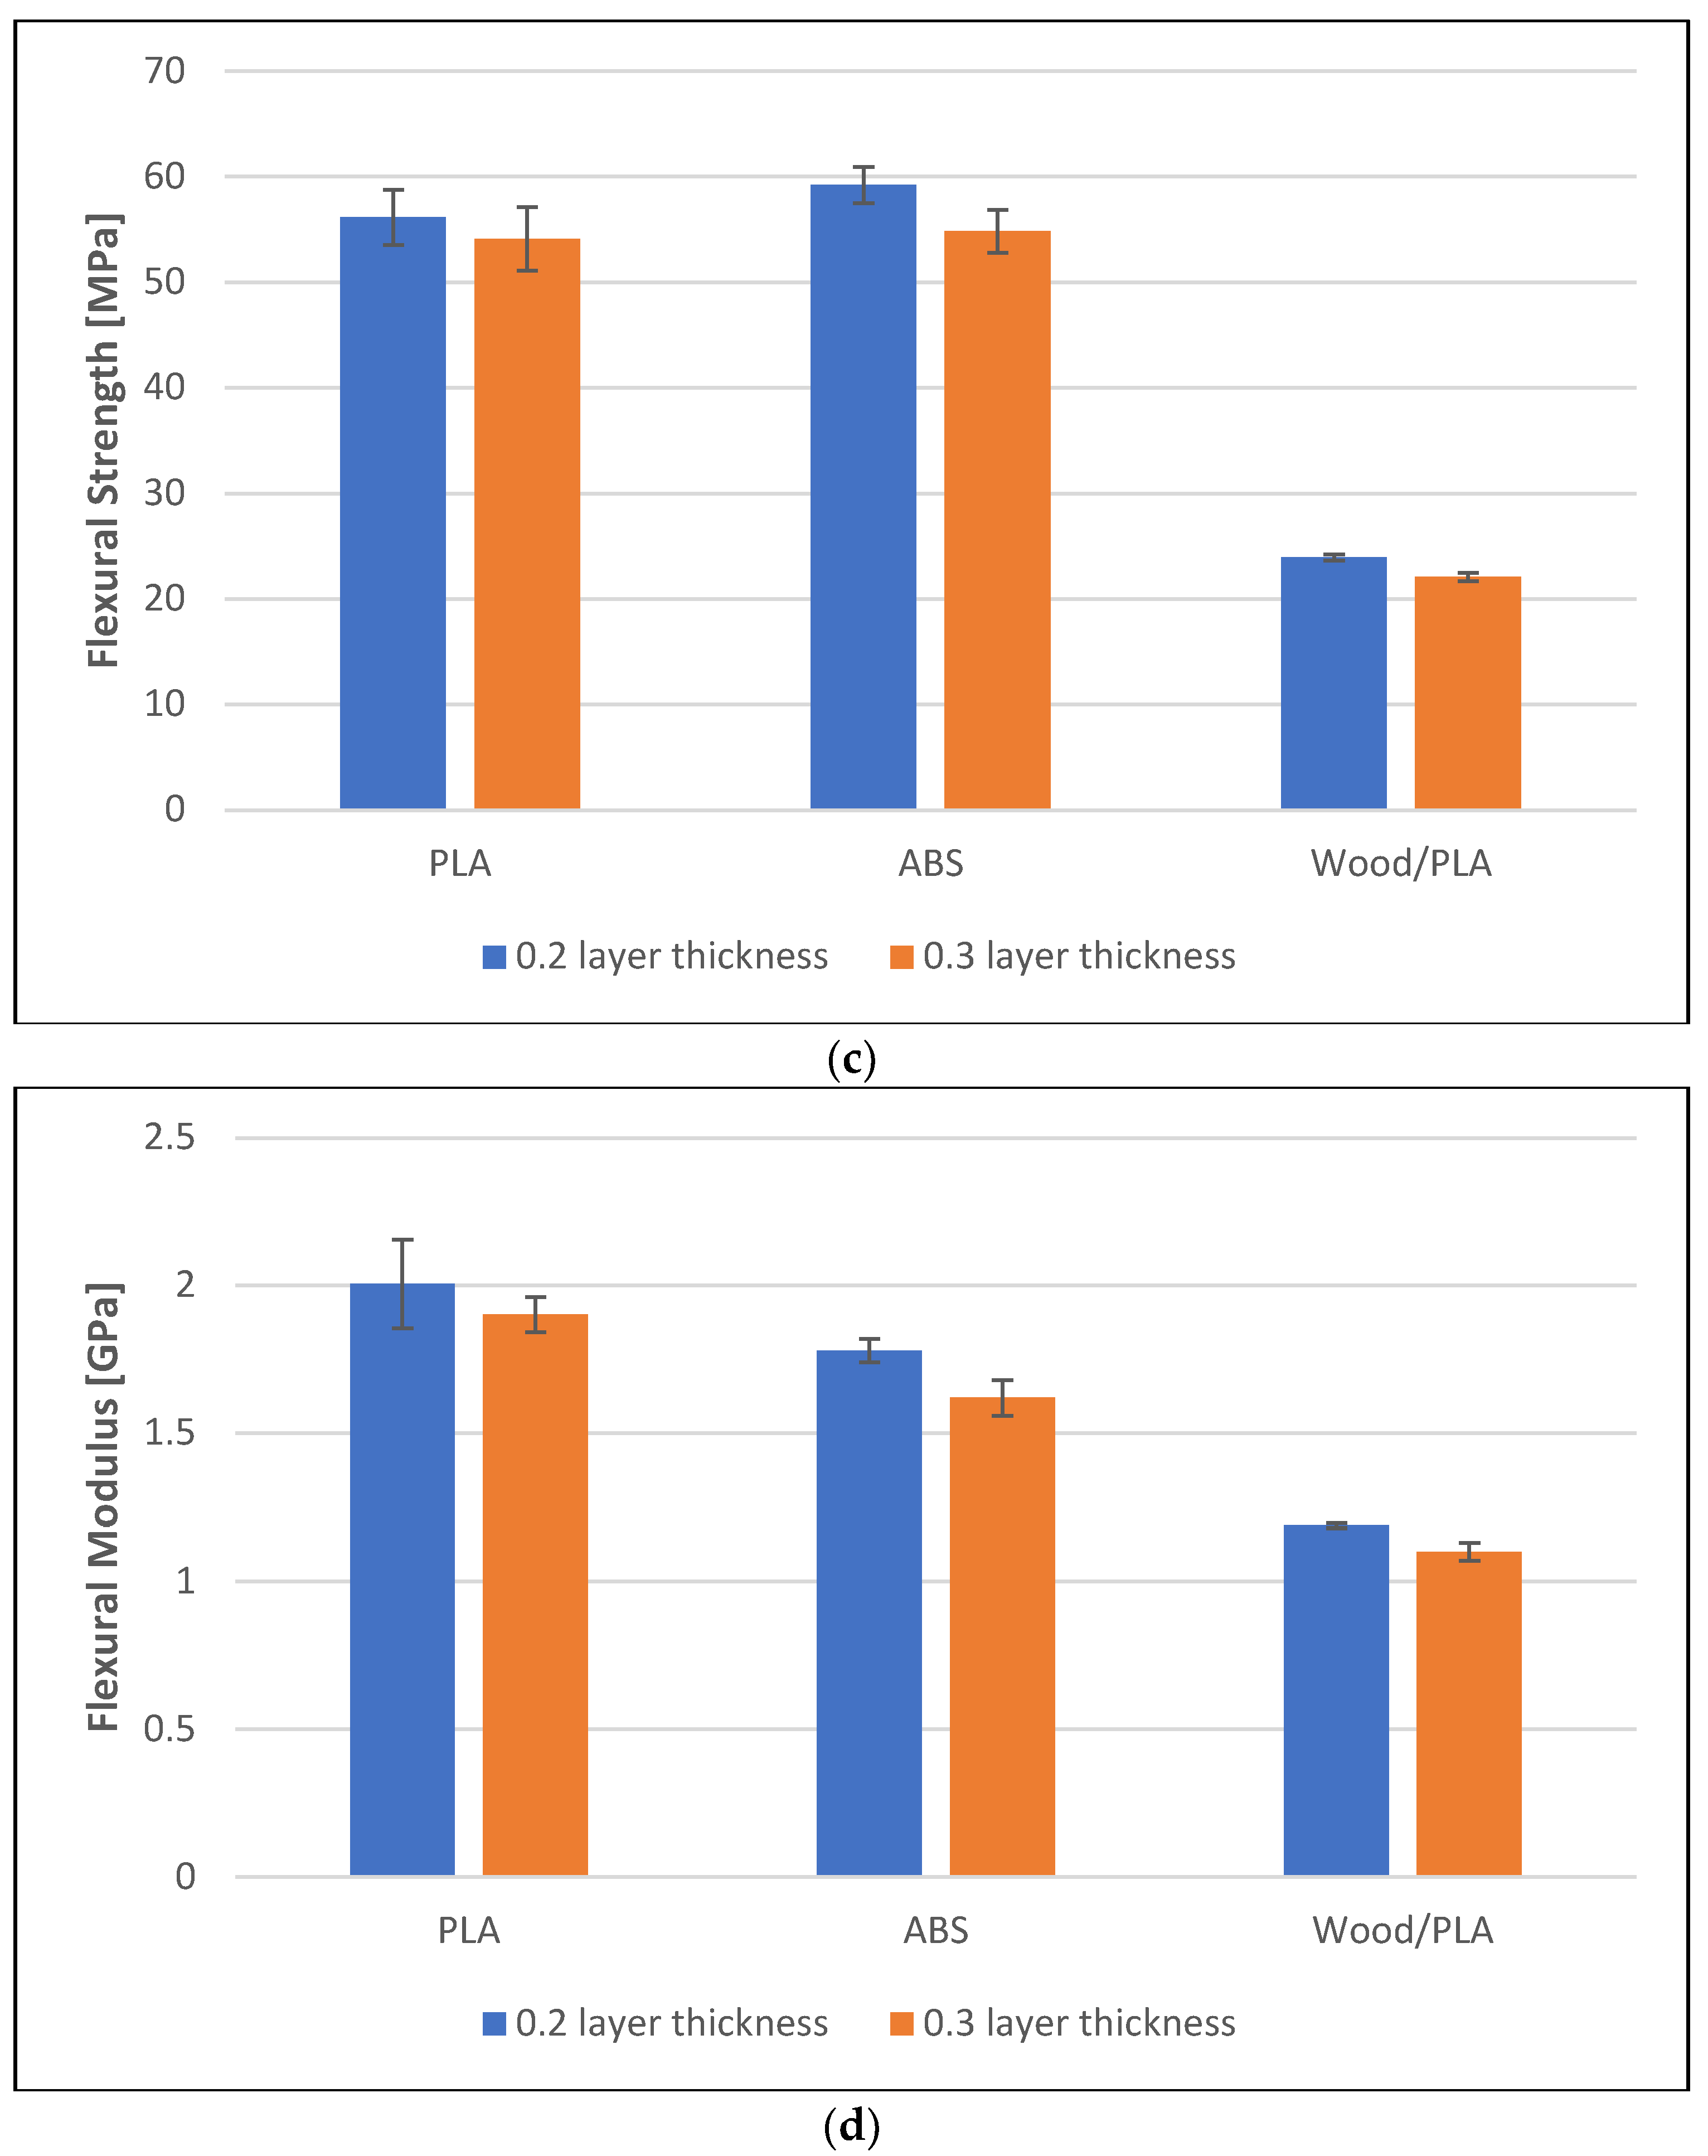
3.2. Mechanical Tests
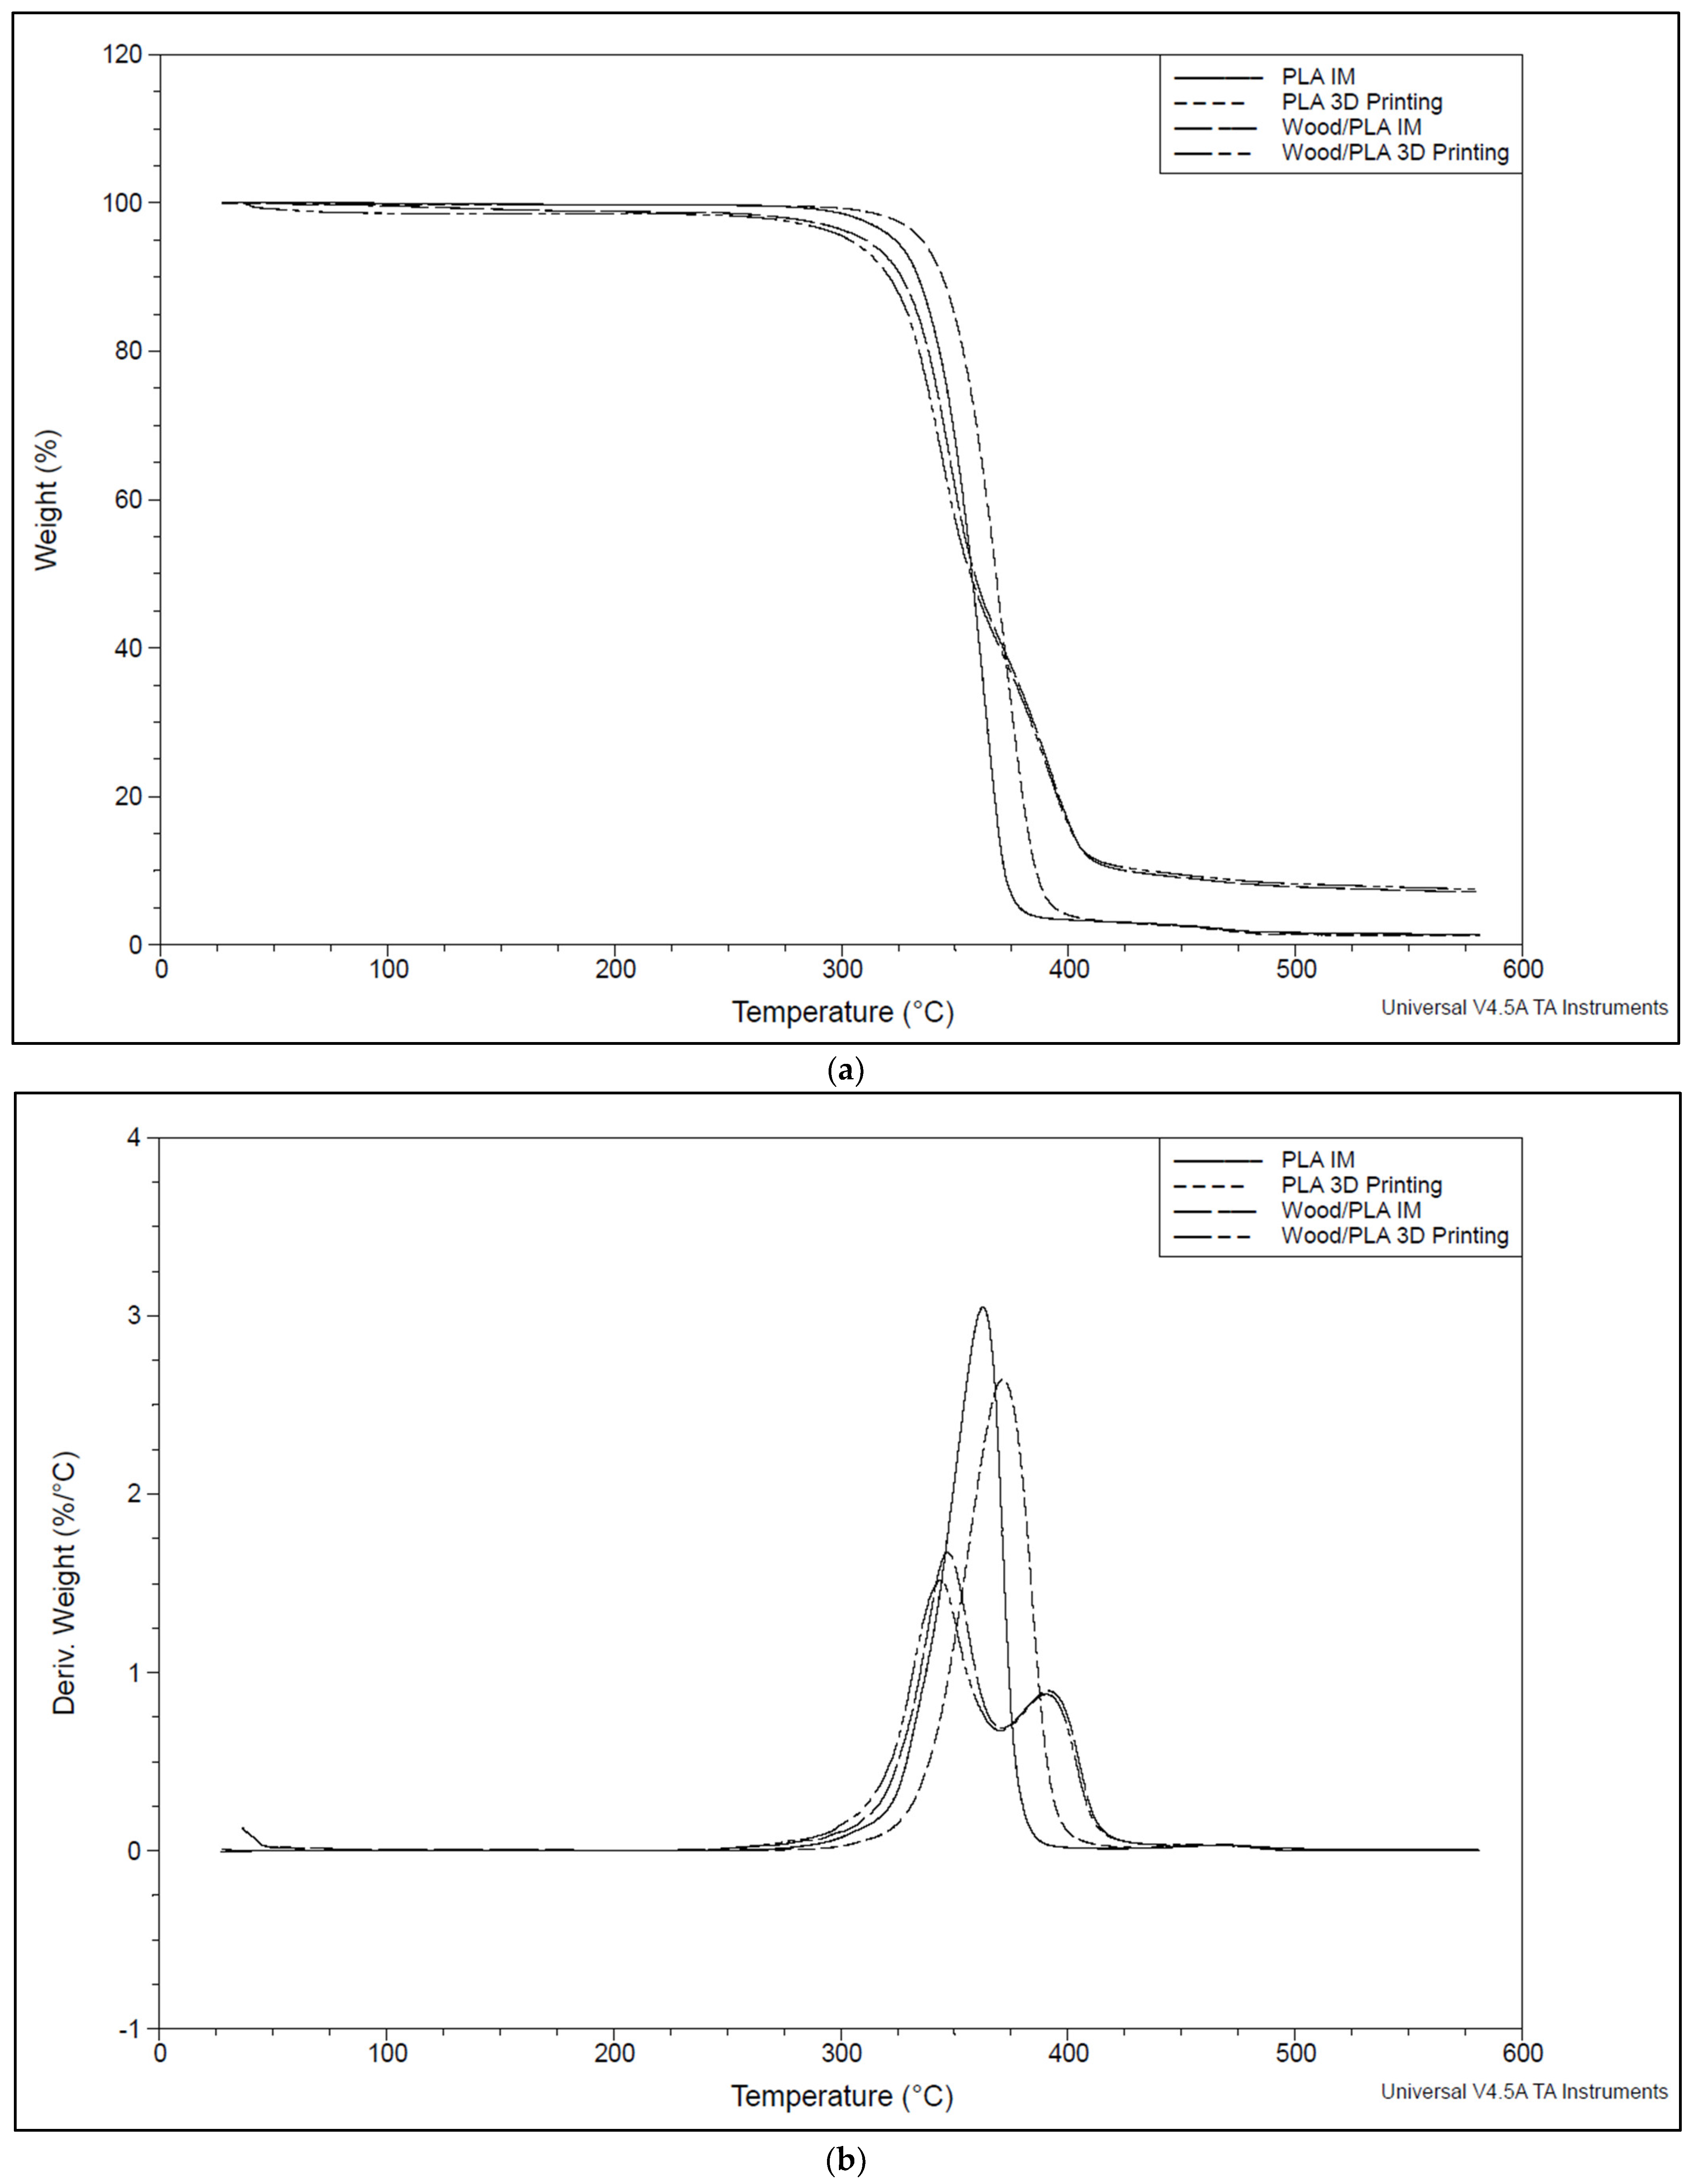
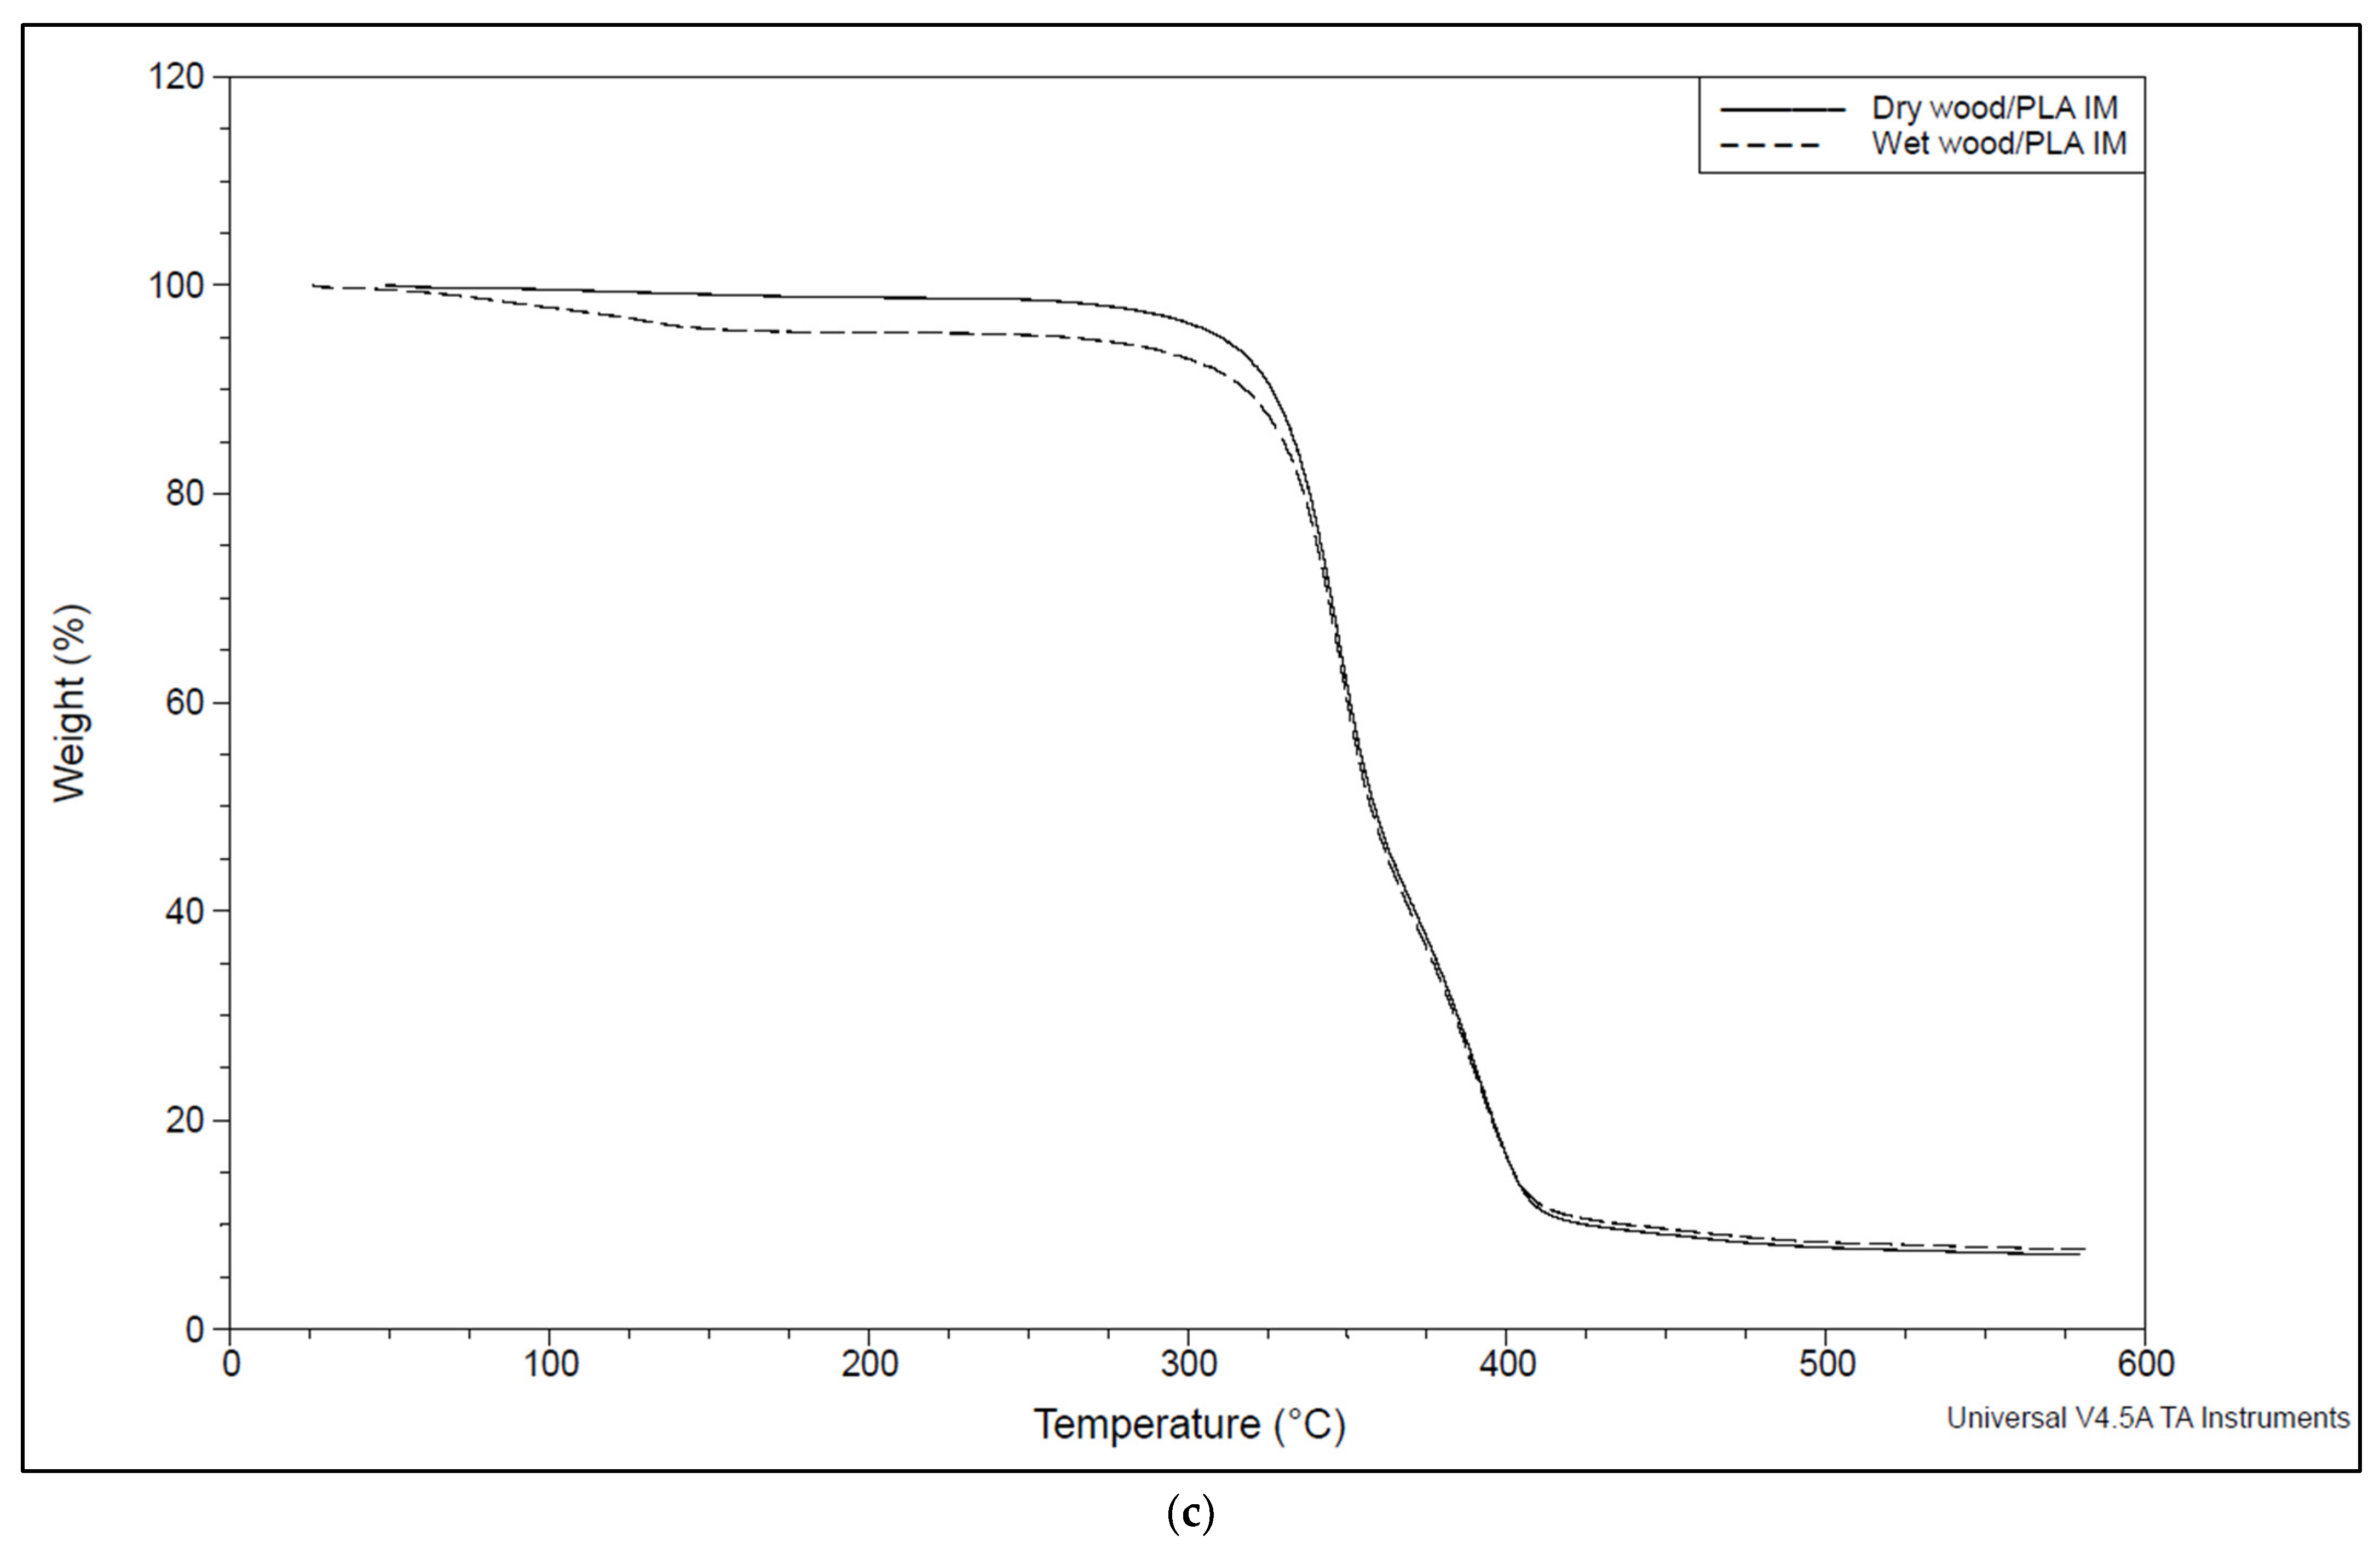
3.3. Thermal Analysis
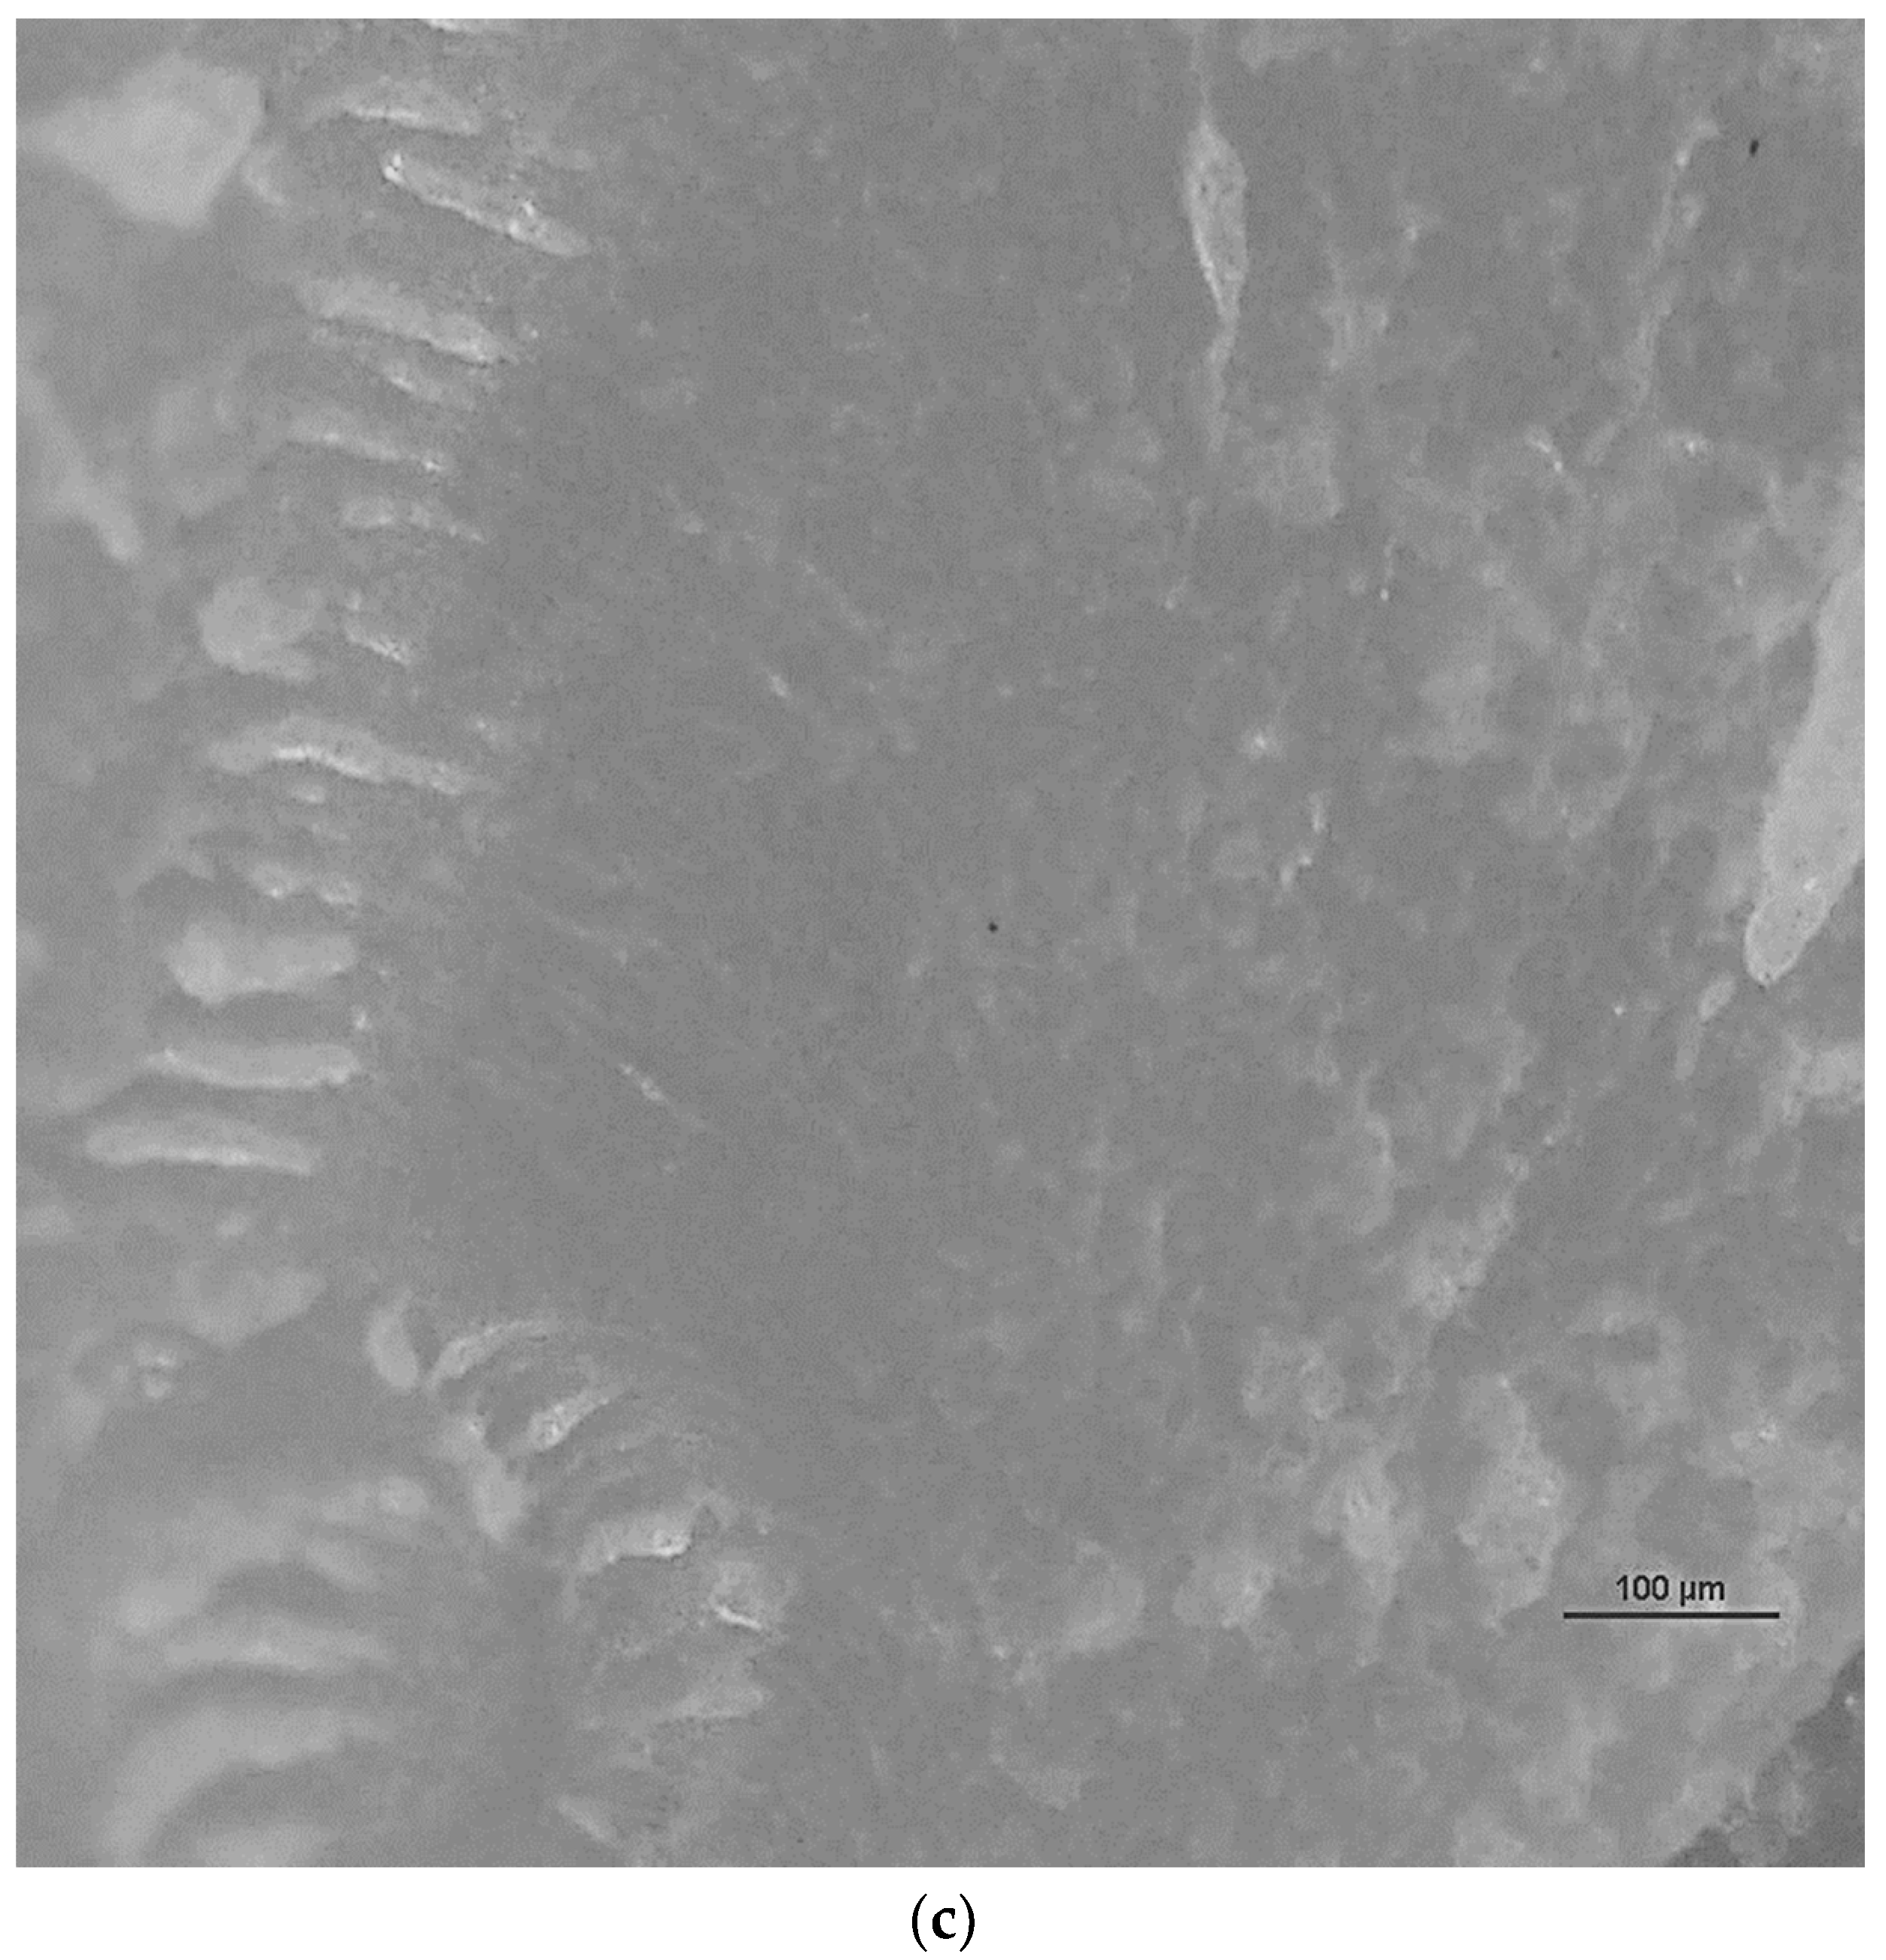
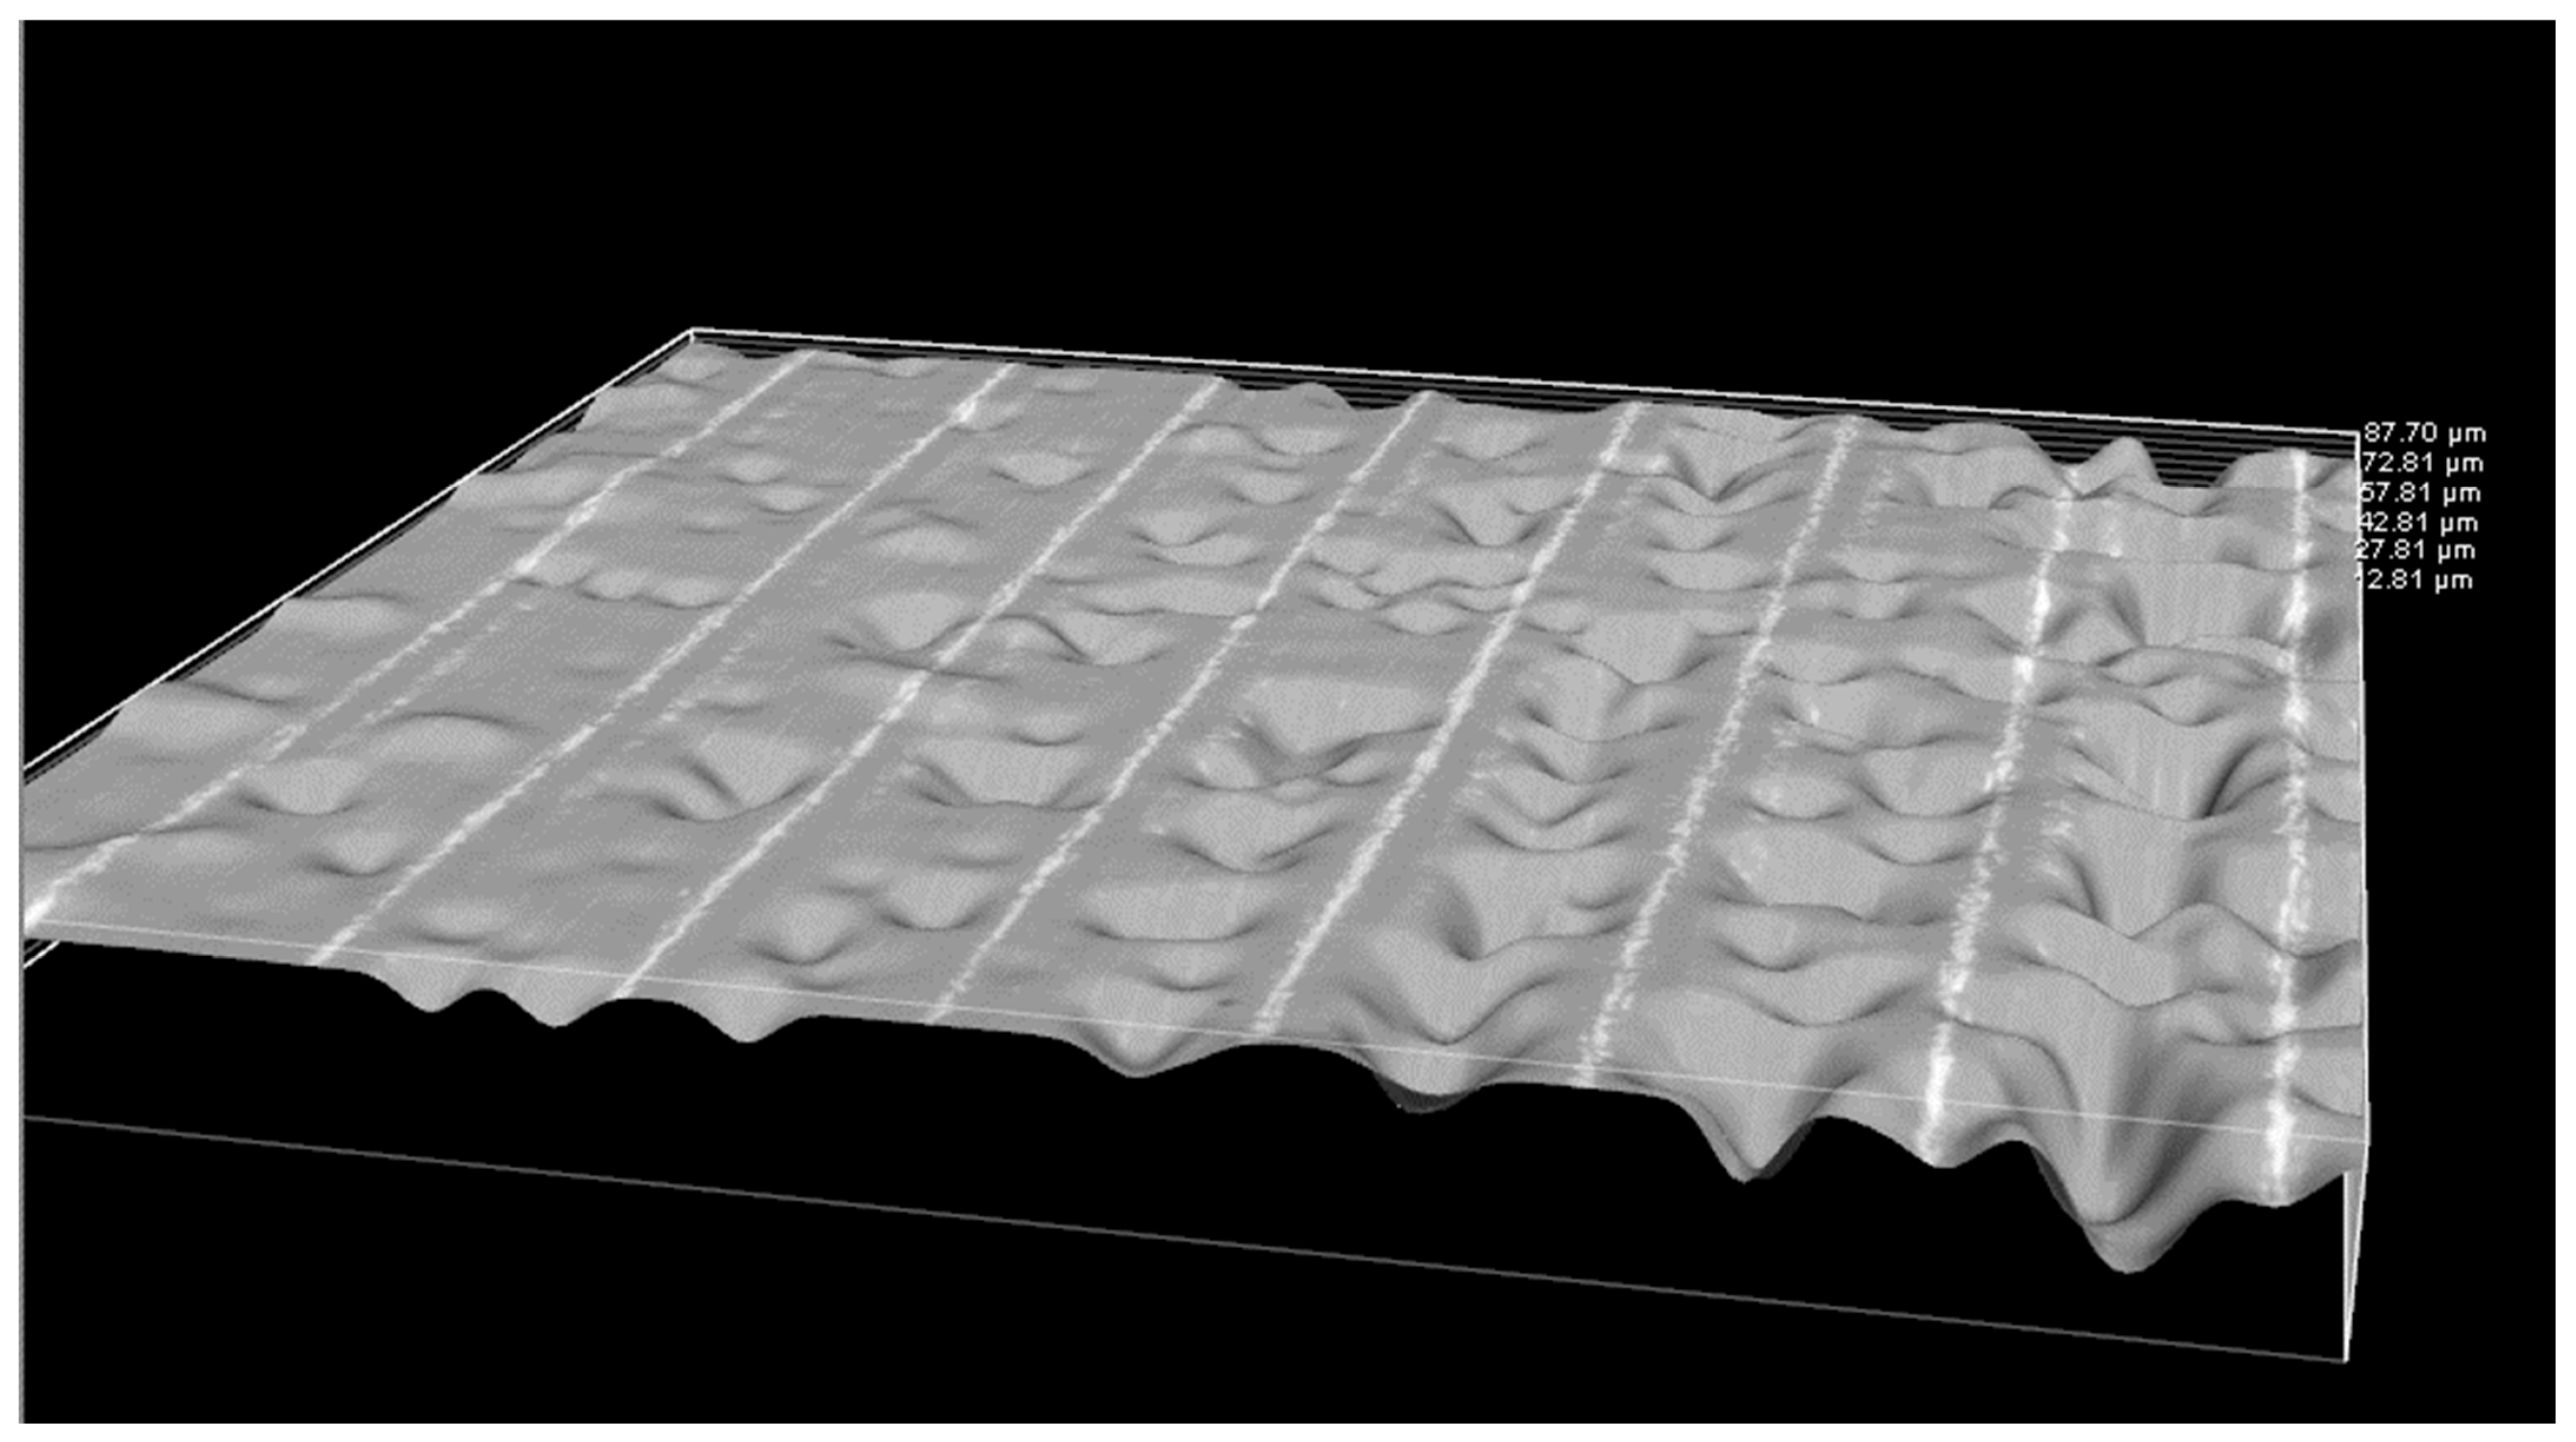
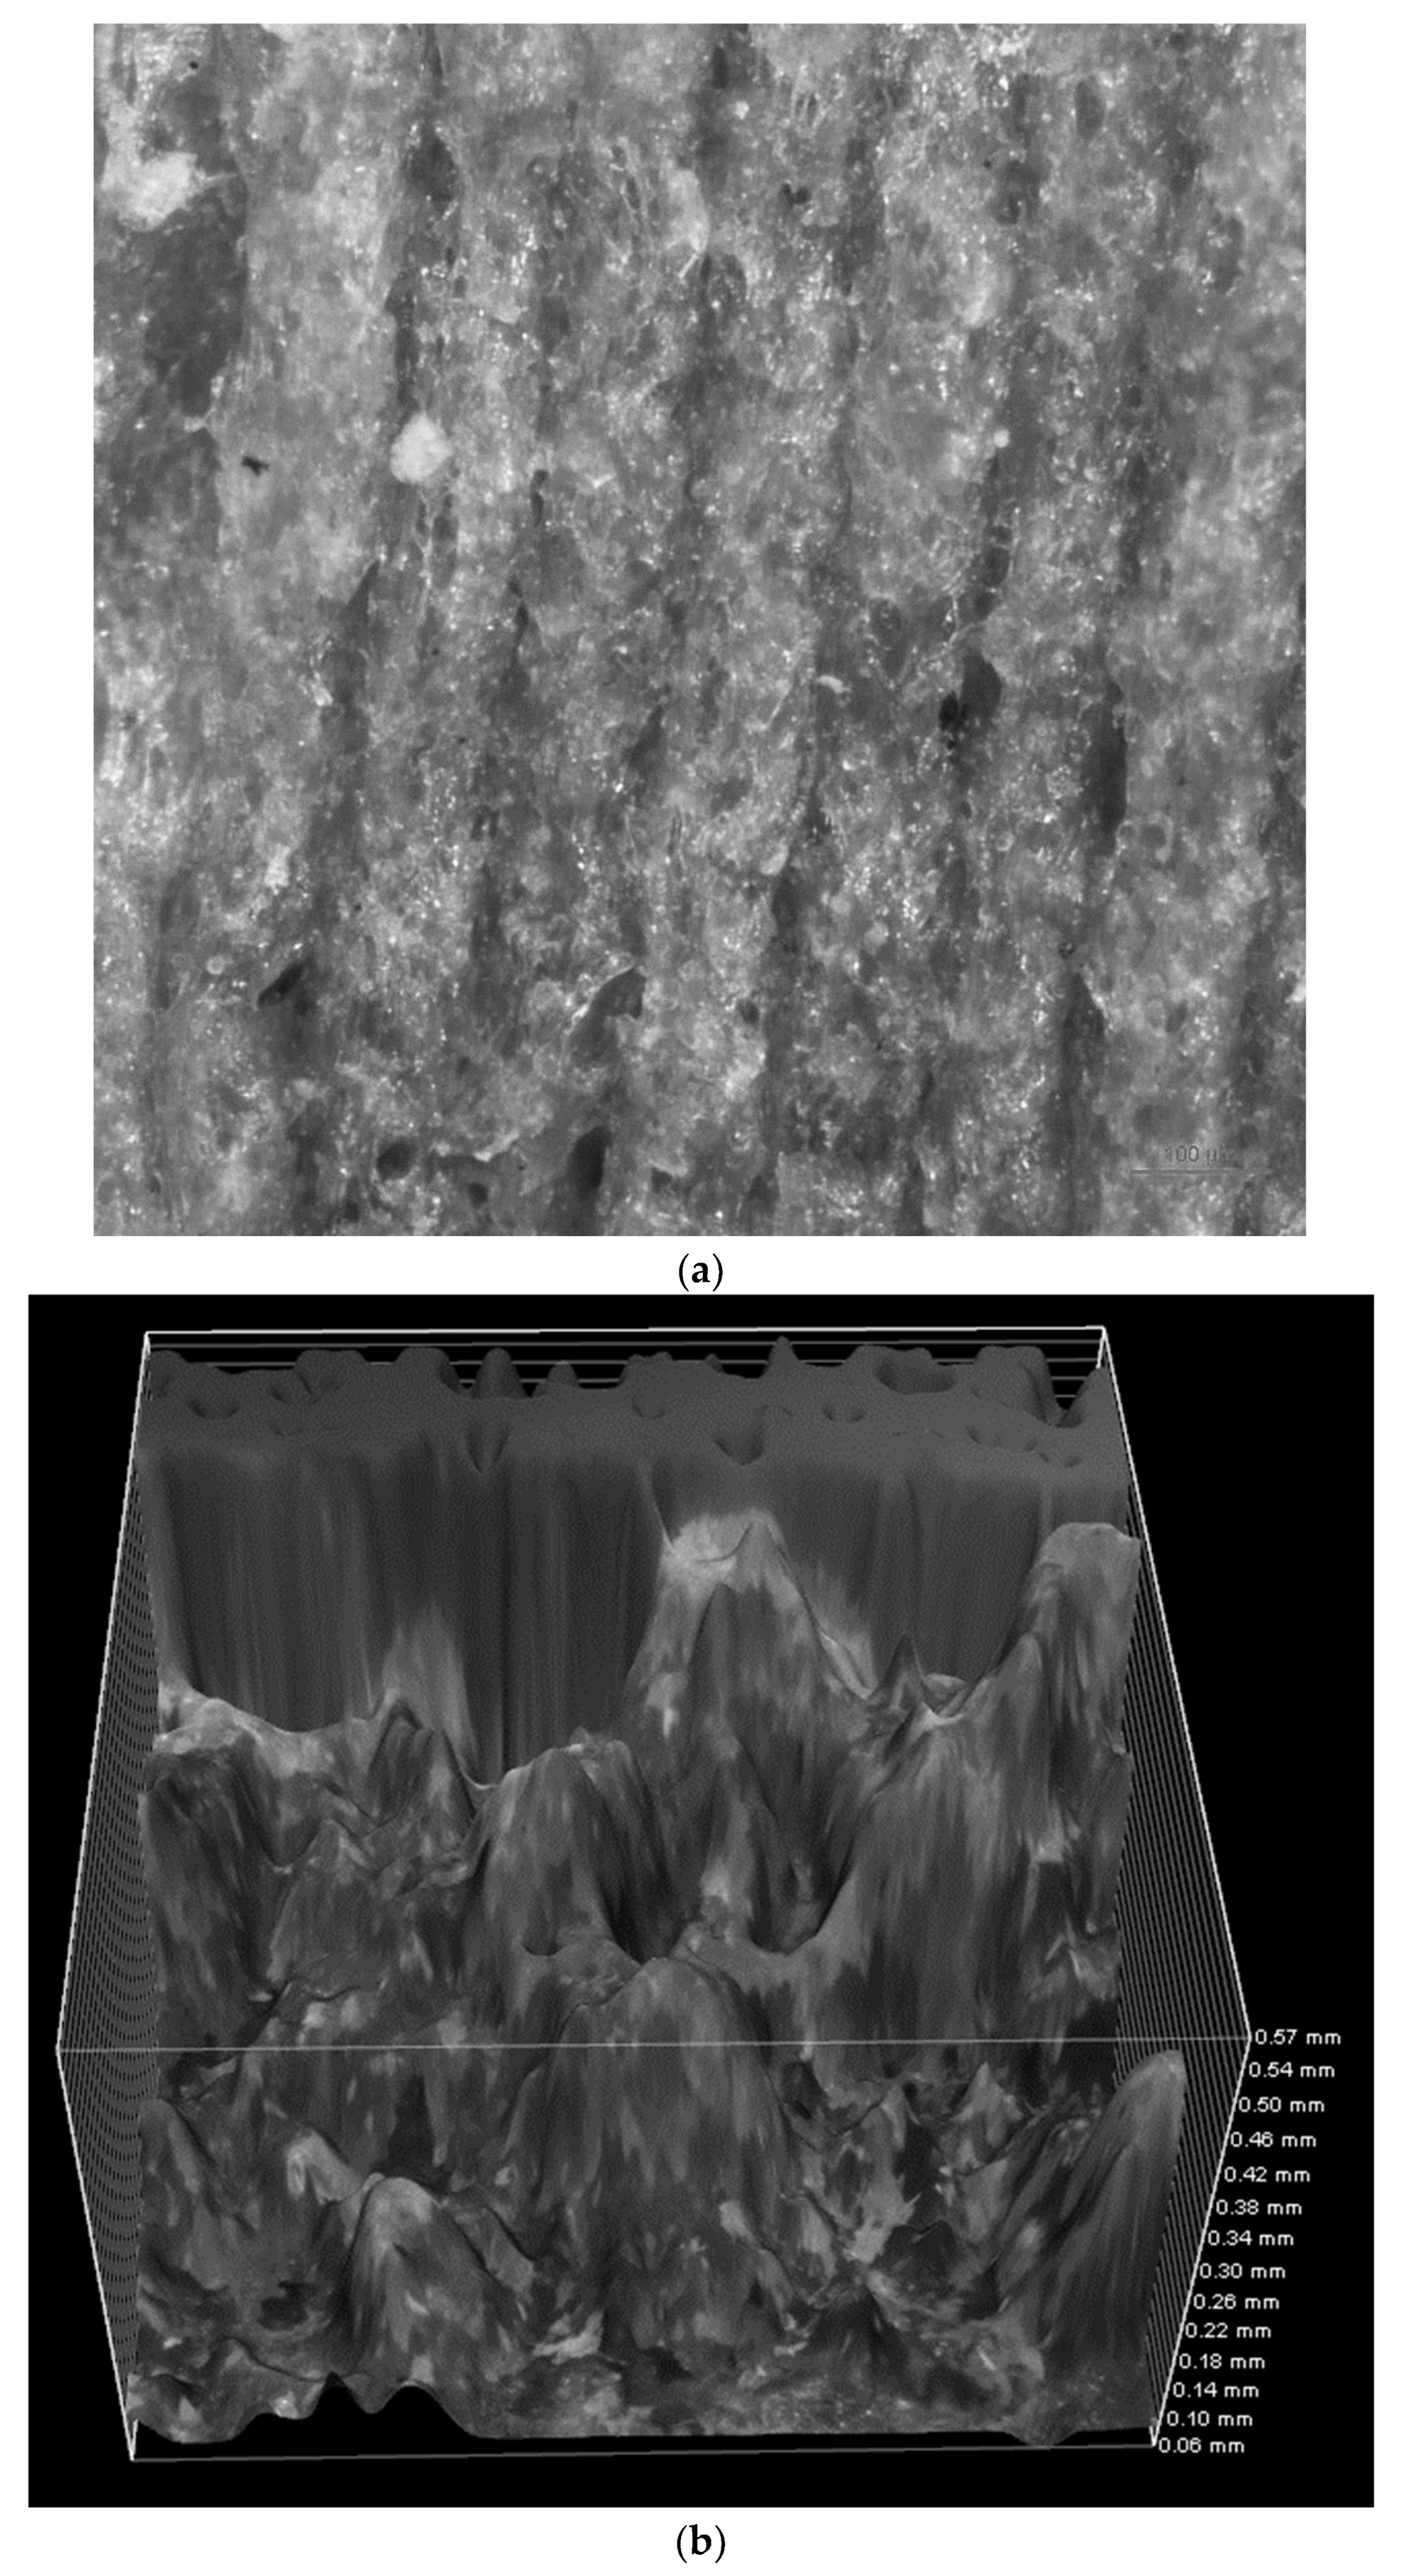
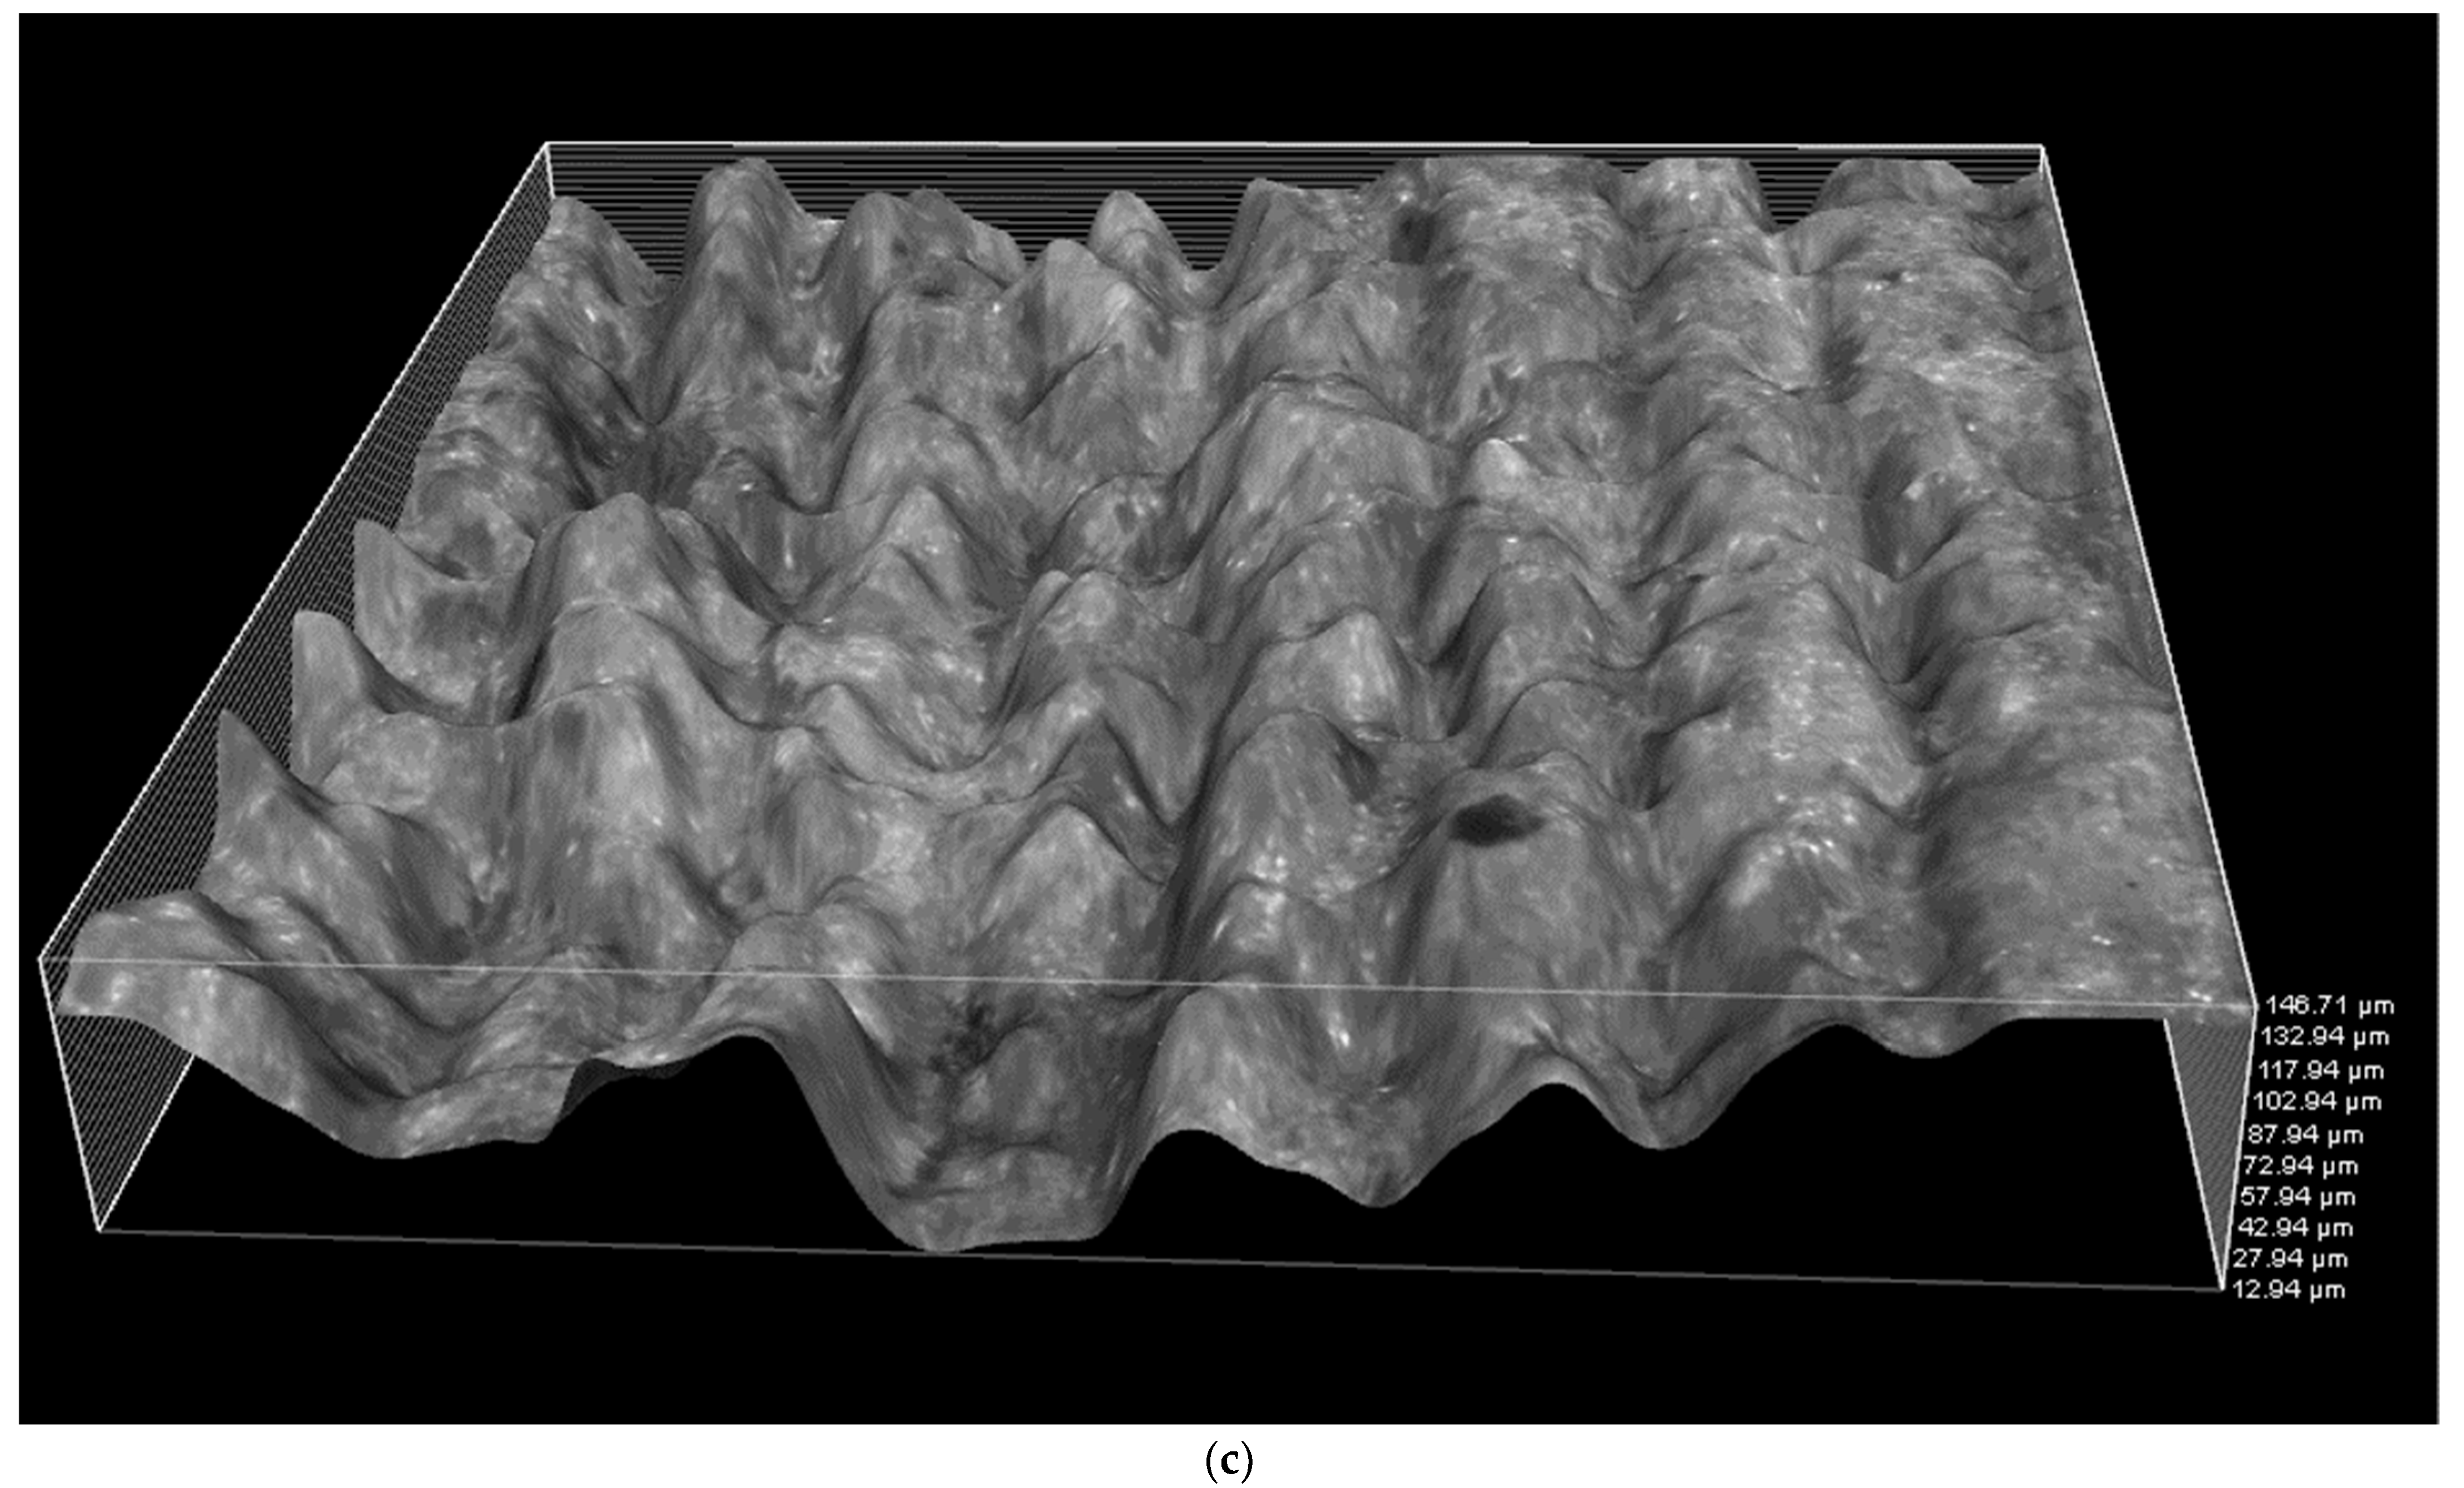
3.4. Microscopic Analysis
4. Discussion
5. Conclusions
- Mechanical properties, such as tensile, flexural, and impact properties, of the specimens produced from two different manufacturing methods, such as 3D printing and injection molding, vary.
- Manufacturing methods do not have a significant effect on thermal properties.
- Morphological analysis shows the increase in the porosity upon increasing the layer thickness.
- Water absorption of the specimens was affected by the manufacturing methods.
- Layer distortion in 3D-printed specimens was noticed upon water absorption, affecting the dimensional stability and mechanical properties of the specimens.
Supplementary Materials
Author Contributions
Funding
Institutional Review Board Statement
Data Availability Statement
Conflicts of Interest
References
- Kristiawan, R.B.; Imaduddin, F.; Ariawan, D.; Arifin, Z. A review on the fused deposition modeling (FDM) 3D printing: Filament processing, materials, and printing parameters. Open Eng. 2021, 11, 639–649. [Google Scholar] [CrossRef]
- Ayrilmis, N.; Kariz, M.; Kwon, J.H.; Kuzman, M. Effect of printing layer thickness on water absorption and mechanical properties of 3D-Printed wood/PLA composite materials. Int. J. Adv. Manuf. Technol. 2019, 102, 2195–2200. [Google Scholar] [CrossRef]
- Ayrilmis, N. Effect of layer thickness on surface properties of 3D printed materials produced from wood flour/PLA filament. Polym. Test. 2018, 71, 163–166. [Google Scholar] [CrossRef]
- Zandi, M.D.; Jerez-Mesa, R.; Llumà, J.; Jorba-Peiro, J.; Travieso-Rodriguez, A. A comparative study of Tensile Properties between Fused Filament Fabricated and Injection-Molded Wood-PLA composite parts. Int. J. Adv. Manuf. Technol. 2020, 108, 1725–1735. [Google Scholar] [CrossRef]
- Almansoori, K.; Pervaiz, S. Effect of layer height, print speed and cell geometry on mechanical properties of marble PLA based 3D printed parts. Smart Mater. Manuf. 2023, 1, 100023. [Google Scholar] [CrossRef]
- Tranter, J.B.; Refalo, P.; Rochman, A. Towards Sustainable Injection molding of ABS plastic products. J. Manuf. Process. 2017, 29, 399–406. [Google Scholar] [CrossRef]
- Chandran, V.; Kalman, J.; Fayazbakhsh, K.; Bougherara, H. A comparative study of tensile properties of injection molded and 3D printed PLA specimens in dry and water saturated conditions. J. Mech. Sci. Technol. 2020, 23, 1261–1269. [Google Scholar] [CrossRef]
- Vaezi, M.; Kai Chua, C. Effects of layer thickness and binder saturation level parameters on 3D printing process. Int. J. Adv. Manuf. Technol. 2010, 53, 275–284. [Google Scholar] [CrossRef]
- Wu, W.; Geng, P.; Li, G.; Zhao, D.; Zhang, H.; Zhao, J. Influence of layer thickness and raster angle on the mechanical properties of 3D-printed PEEK and a comparative mechanical study between PEEK and ABS. Materials 2015, 8, 5834–5846. [Google Scholar] [CrossRef]
- Rankouhi, B.; Javadpour, S.; Delfanian, F.; Letcher, T. Failure analysis and mechanical characterization of 3D printed ABS with respect to layer thickness and orientation. J. Fail. Anal. Prev. 2016, 16, 467–481. [Google Scholar] [CrossRef]
- Selva Priya, N.; Naresh, K.; Jayaganthan, R.; Velmurugan, R. A comparative study between in-house 3D printed and injection molded ABS and PLA polymers for low-frequency applications. Mater. Res. Express 2019, 6, 1–23. [Google Scholar] [CrossRef]
- Komal, U.K.; Kasaudhan, B.K.; Singh, I. Comparative performance analysis of polylactic acid parts fabricated by 3D printing and injection molding. J. Mater. Eng. Perform. 2021, 30, 6522–6528. [Google Scholar] [CrossRef]
- ISO 14125:1998; Fibre-Reinforced Plastic Composites—Determination of Flexural Properties. International Organization for Standardization: Geneva, Switzerland, 1998.
- Bhayana, M.; Singh, J.; Sharma, A.; Gupta, M. A review on optimized FDM 3D printed Wood/PLA bio composite. Mater. Today Proc. 2023, 2214–7853. [Google Scholar] [CrossRef]
- ISO 62:2008; Plastics—Determination of Water Absorption. International Organization for Standardization: Geneva, Switzerland, 2008.
- Romero, A.; Piovan, M.; Mainetti, C.; Stechina, D.; Mendoza, S.; Martín, H.; Maggi, C. Tensile Properties of 3D printed polymeric pieces:comparison of several testing setups. Ing. Investig. 2021, 41, 1–7. [Google Scholar] [CrossRef]
- ISO 527-1:2019; Plastics: Determination of Tensile Properties. International Organization for Standardization: Geneva, Switzerland, 2019.
- ISO 178:2019; Plastics: Determination of Flexural Properties. International Organization for Standardization: Geneva, Switzerland, 2019.
- Kovan, V.; Tezel, T.; Camurlu, H.E.; Topal, E.S. Effect of printing Parameters on mechanical properties of 3D-Printed PLA/carbon fibre composites. Mater. Science. Non-Equilib. Phase Transform. 2018, 4, 126–128. [Google Scholar]
- Siva, R.; Nemali, S.S.R.; Kunchapu, S.K.; Gokul, K.; Kumar, T.A. Comparison of Mechanical Properties and Water Absorption Test on Injection Molding and Extrusion—Injection Molding Thermoplastic Hemp Fiber Composite. Mater. Today Proc. 2021, 47, 4382–4386. [Google Scholar] [CrossRef]
- ISO 179-2:2020; Plastics: Determination of Charpy Impact Properties. International Organization for Standardization: Geneva, Switzerland, 2020.
- Mohamed, O.A.; Masood, S.H.; Bhowmik, J.L. Characterization and dynamic mechanical analysis of PC-ABS material processed by fused deposition modelling: An investigation through I-optimal response surface methodology. Measurement 2017, 107, 128–141. [Google Scholar] [CrossRef]
- ISO 11357-1:2023; Plastics—Differential Scanning Calorimetry (DSC). International Organization for Standardization: Geneva, Switzerland, 2023.
- Blum, F.D.; Krisanangkura, P. Comparison of differential scanning calorimetry, FTIR, and NMR to measurements of adsorbed polymers. Thermochim. Acta 2009, 492, 55–60. [Google Scholar] [CrossRef]
- Åkesson, D.; Vrignaud, T.; Tissot, C.; Skrifvars, M. Mechanical recycling of PLA filled with a high level of cellulose fibres. J. Polym. Environ. 2016, 24, 185–195. [Google Scholar] [CrossRef]
- Wang, S.; Ma, Y.; Deng, Z.; Zhang, S.; Cai, J. Effects of fused deposition modeling process parameters on tensile, dynamic mechanical properties of 3D printed polylactic acid materials. Polym. Test. 2020, 86, 106483. [Google Scholar] [CrossRef]
- Ramamoorthy, S.K.; Bakare, F.; Herrmann, R.; Skrifvars, M. Performance of biocomposites from surface modified regenerated cellulose fibers and lactic acid thermoset bioresin. Cellulose 2015, 22, 2507–2528. [Google Scholar] [CrossRef]


| Settings | PLA | ABS | Wood/PLA |
|---|---|---|---|
| Nozzle diameter, mm | 0.4 | 0.4 | 0.4 |
| Infill/% | 100 | 100 | 100 |
| Layer thickness, mm | 0.2, 0.3 | 0.2, 0.3 | 0.2, 0.3 |
| Print speed, mm/s | 5 | 5 | 5 |
| Nozzle temperature, °C | 200 | 250 | 210 |
| Bed temperature, °C | 60 | 80 | 60 |
| Manufacturing Method | Specimen | Impact Strength, Edgewise (kJ/m2) | Impact Strength, Flatwise (kJ/m2) | |
|---|---|---|---|---|
| DRY | IM | PLA | 67.7 (22.8) | 15.7 (2.5) |
| ABS | 19.9 (1.6) | 84.6 (0.1) | ||
| Wood/PLA | 25.2 (2.5) | 17.2 (0.7) | ||
| 3D Printing (0.2) | PLA | 12.3 (2.8) | 11.1 (2.0) | |
| ABS | 25.5 (2.9) | 37.9 (2.5) | ||
| Wood/PLA | 8.3 (0.4) | 7.8 (0.1) | ||
| 3D Printing (0.3) | PLA | 13.5 (1.3) | 9.9 (1.3) | |
| ABS | 26.7 (3.4) | 27.9 (1.3) | ||
| Wood/PLA | 9.5 (1.3) | 7.3 (0.6) | ||
| WET | IM | PLA | 50.1 (20.1) | 15.9 (1.1) |
| ABS | 15.4 (1.8) | 83.3 (0.1) | ||
| Wood/PLA | 22.3 (0.9) | 17.2 (1.7) | ||
| 3D Printing (0.2) | PLA | 13.6 (2.4) | 12.7 (2.8) | |
| ABS | 22.2 (4.9) | 29.3 (3.6) | ||
| Wood/PLA | 9.9 (0.8) | 9.2 (0.4) | ||
| 3D Printing (0.3) | PLA | 12.5 (0.4) | 9.5 (1.5) | |
| ABS | 25.2 (1.9) | 23.7 (2.6) | ||
| Wood/PLA | 7.3 (1.2) | 7.2 (0.8) |
| Manufacturing Method | Specimen | Storage Modulus, E′ Max (MPa) | Loss Modulus, E″ Max (MPa) | Damping Factor Tan δ (×10−2) |
|---|---|---|---|---|
| IM | PLA | 2321 | 432 | 18.6 |
| ABS | 1236 | 172 | 13.9 | |
| Wood/PLA | 1682 | 220 | 13.0 | |
| 3D Printing (0.2) | PLA | 2365 | 440 | 18.6 |
| ABS | 1450 | 195 | 13.4 | |
| Wood/PLA | 1044 | 128 | 12.3 | |
| 3D Printing (0.3) | PLA | 1906 | 326 | 17.1 |
| ABS | 1247 | 163 | 13.1 | |
| Wood/PLA | 928 | 117 | 12.6 |
| Manufacturing Method | Specimen | Tg °C | Tc °C | Tm °C | |
|---|---|---|---|---|---|
| DRY | IM | PLA | 54.0 | 109.7 | 159.4 |
| Wood/PLA | 57.3 | 86.7 | 148.8 | ||
| 3D Printing | PLA | 53.9 | 109.7 | 159.9 | |
| Wood/PLA | 57.1 | 86.7 | 149.2 | ||
| WET | IM | PLA | 53.3 | 109.3 | 159.2 |
| Wood/PLA | 56.4 | 86.9 | 149.0 | ||
| 3D Printing | PLA | 53.8 | 109.3 | 159.2 | |
| Wood/PLA | 57.7 | 86.7 | 149.5 |
| Manufacturing Method | Specimen | Tg from E′ °C | Tg from E″ °C | Tg from tan δ °C |
|---|---|---|---|---|
| IM | PLA | 54.3 | 54.7 | 61.3 |
| Wood/PLA | 61.3 | 61.9 | 66.7 | |
| 3D Printing (0.2) | PLA | 53.5 | 53.9 | 60.7 |
| Wood/PLA | 60.8 | 61.1 | 67.0 | |
| 3D Printing (0.3) | PLA | 53.6 | 53.6 | 61.1 |
| Wood/PLA | 61.2 | 61.5 | 68.0 |
Disclaimer/Publisher’s Note: The statements, opinions and data contained in all publications are solely those of the individual author(s) and contributor(s) and not of MDPI and/or the editor(s). MDPI and/or the editor(s) disclaim responsibility for any injury to people or property resulting from any ideas, methods, instructions or products referred to in the content. |
© 2024 by the authors. Licensee MDPI, Basel, Switzerland. This article is an open access article distributed under the terms and conditions of the Creative Commons Attribution (CC BY) license (https://creativecommons.org/licenses/by/4.0/).
Share and Cite
Mukoroh, P.F.; Gouda, F.; Skrifvars, M.; Ramamoorthy, S.K. Influence of the Manufacturing Method (3D Printing and Injection Molding) on Water Absorption and Mechanical and Thermal Properties of Polymer Composites Based on Poly(lactic acid). Polymers 2024, 16, 1619. https://doi.org/10.3390/polym16121619
Mukoroh PF, Gouda F, Skrifvars M, Ramamoorthy SK. Influence of the Manufacturing Method (3D Printing and Injection Molding) on Water Absorption and Mechanical and Thermal Properties of Polymer Composites Based on Poly(lactic acid). Polymers. 2024; 16(12):1619. https://doi.org/10.3390/polym16121619
Chicago/Turabian StyleMukoroh, Paul Forbid, Fathi Gouda, Mikael Skrifvars, and Sunil Kumar Ramamoorthy. 2024. "Influence of the Manufacturing Method (3D Printing and Injection Molding) on Water Absorption and Mechanical and Thermal Properties of Polymer Composites Based on Poly(lactic acid)" Polymers 16, no. 12: 1619. https://doi.org/10.3390/polym16121619
APA StyleMukoroh, P. F., Gouda, F., Skrifvars, M., & Ramamoorthy, S. K. (2024). Influence of the Manufacturing Method (3D Printing and Injection Molding) on Water Absorption and Mechanical and Thermal Properties of Polymer Composites Based on Poly(lactic acid). Polymers, 16(12), 1619. https://doi.org/10.3390/polym16121619