
An Innovative Approach for Elemental Mercury Adsorption Using X-ray Irradiation and Electrospun Nylon/Chitosan Nanofibers

 ,
, 
 ,
,  ,
,  and
and
Abstract
1. Introduction
2. Materials and Methods
2.1. Experimental Materials
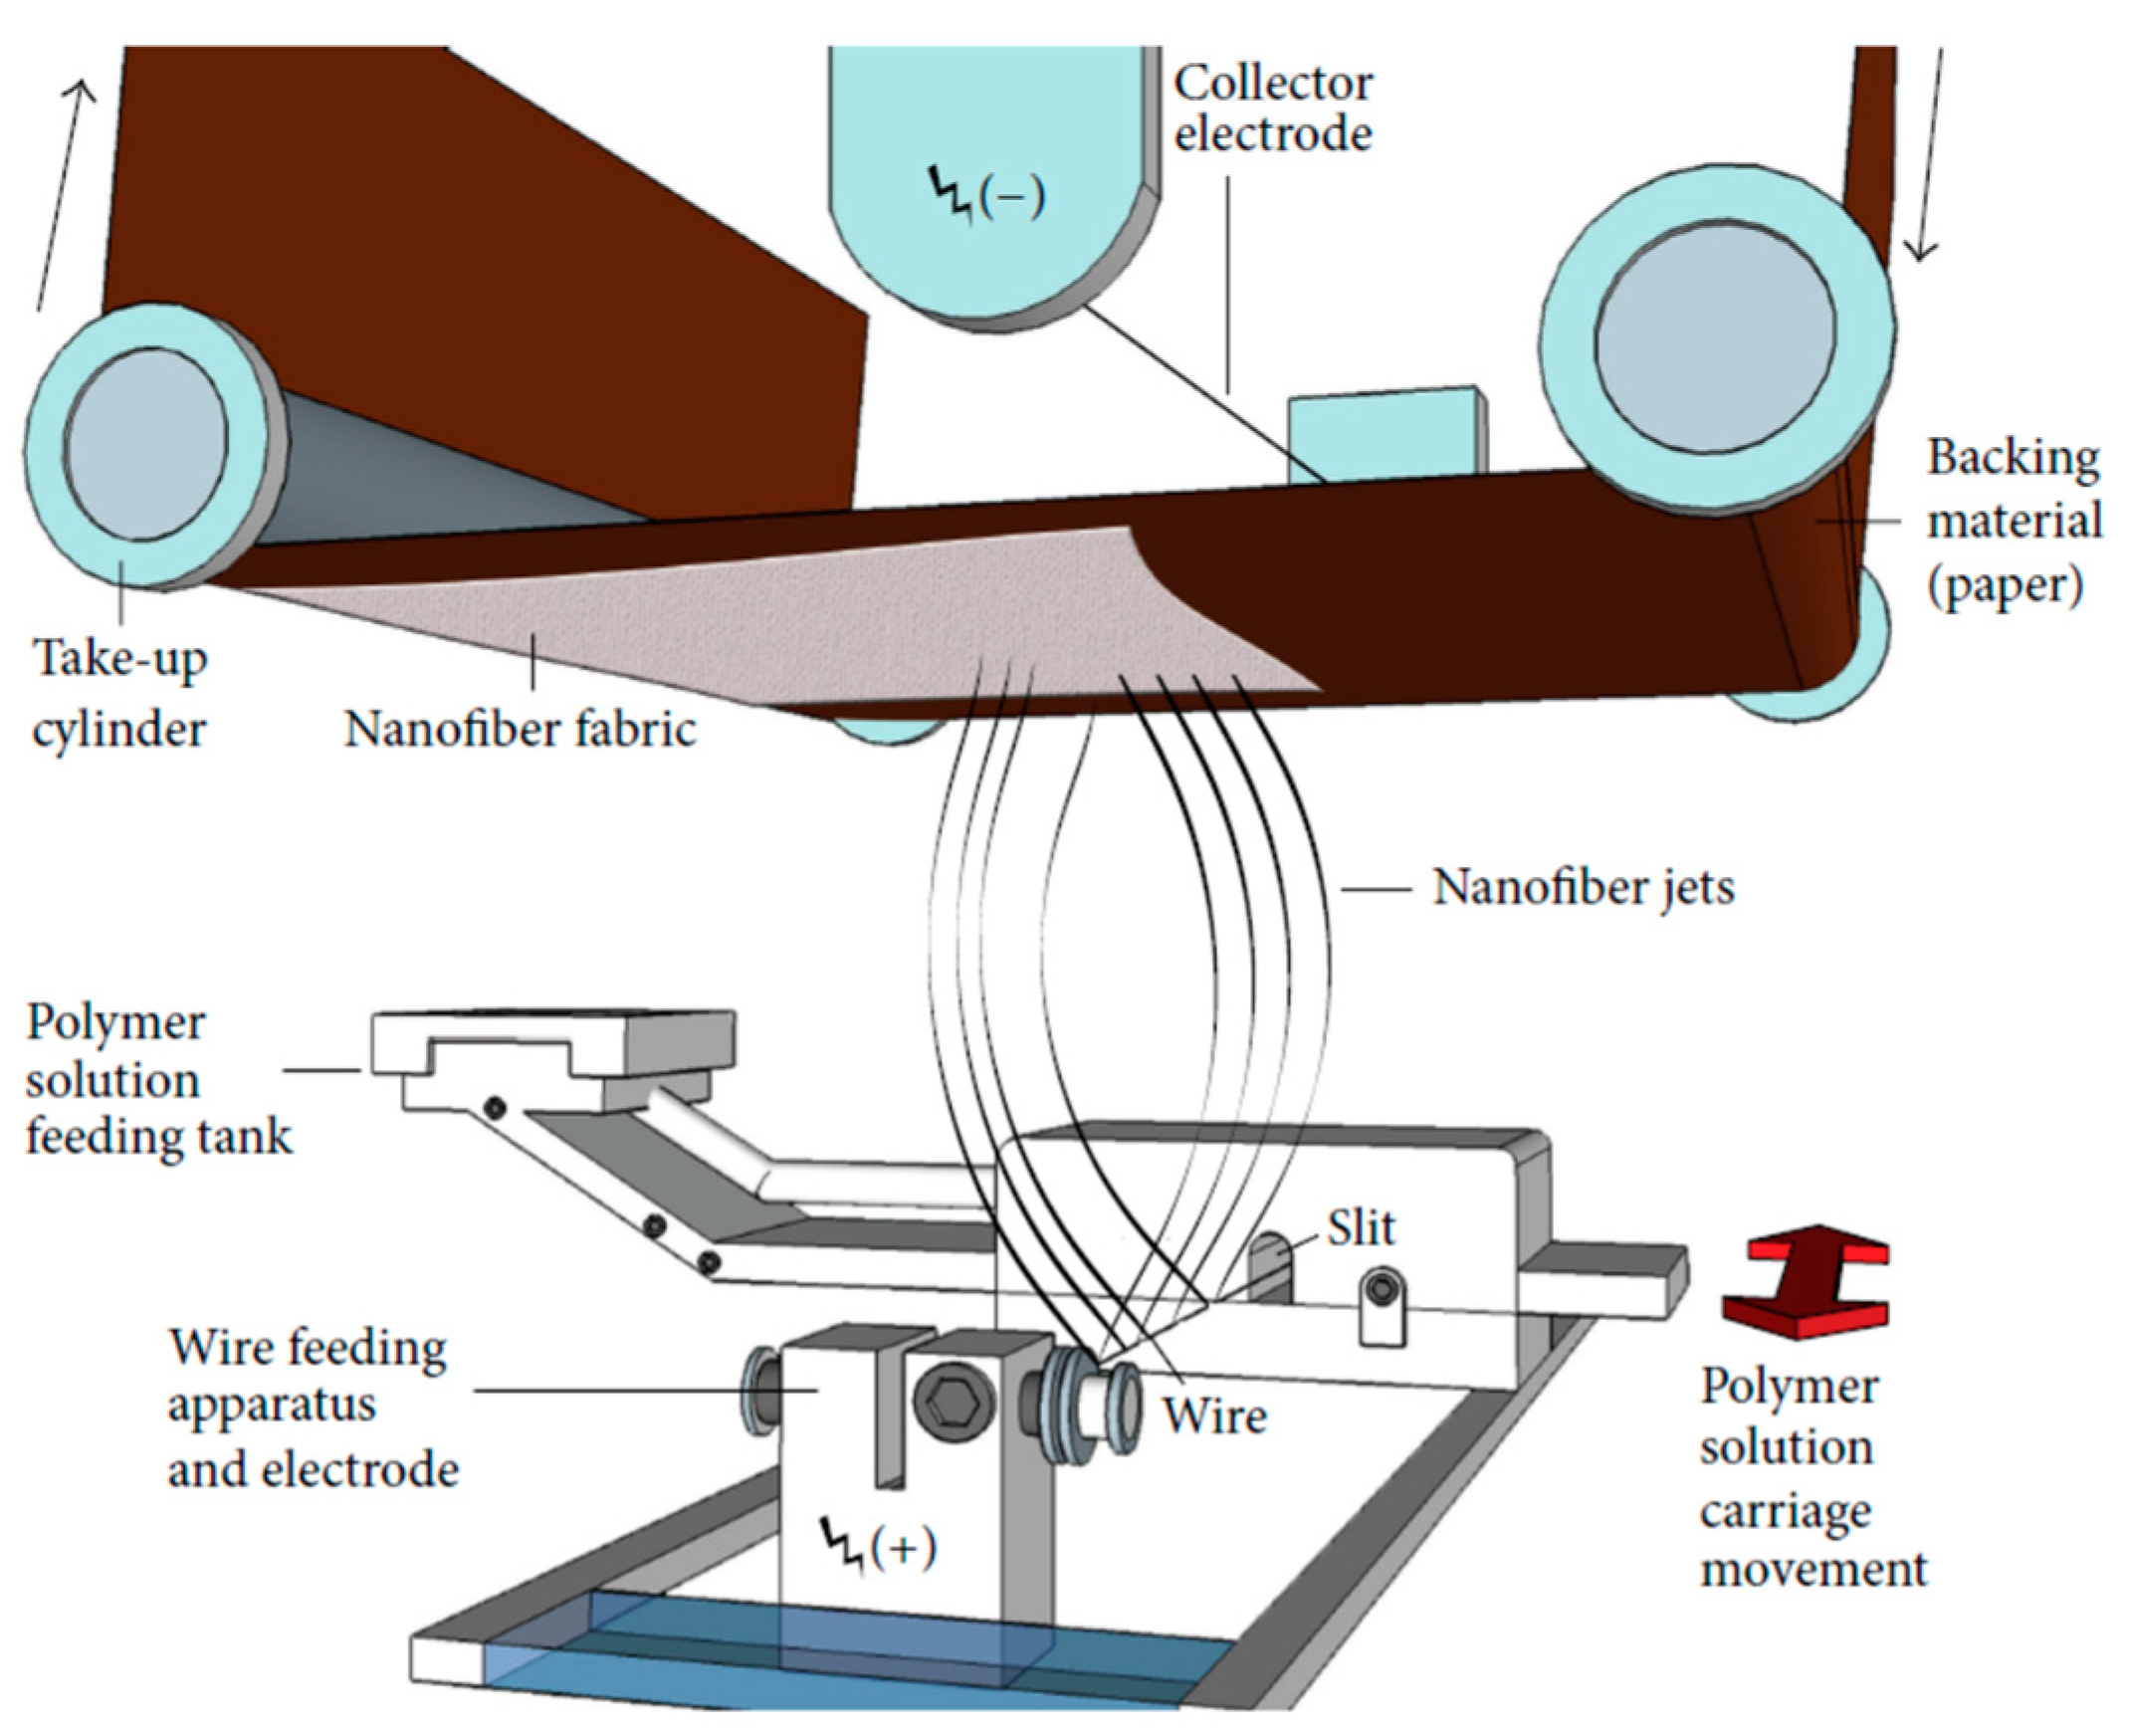
2.2. Preparation of Polyamide 6/Chitosan Nanofibers
2.3. Characterization and Evaluations of Nanofibers
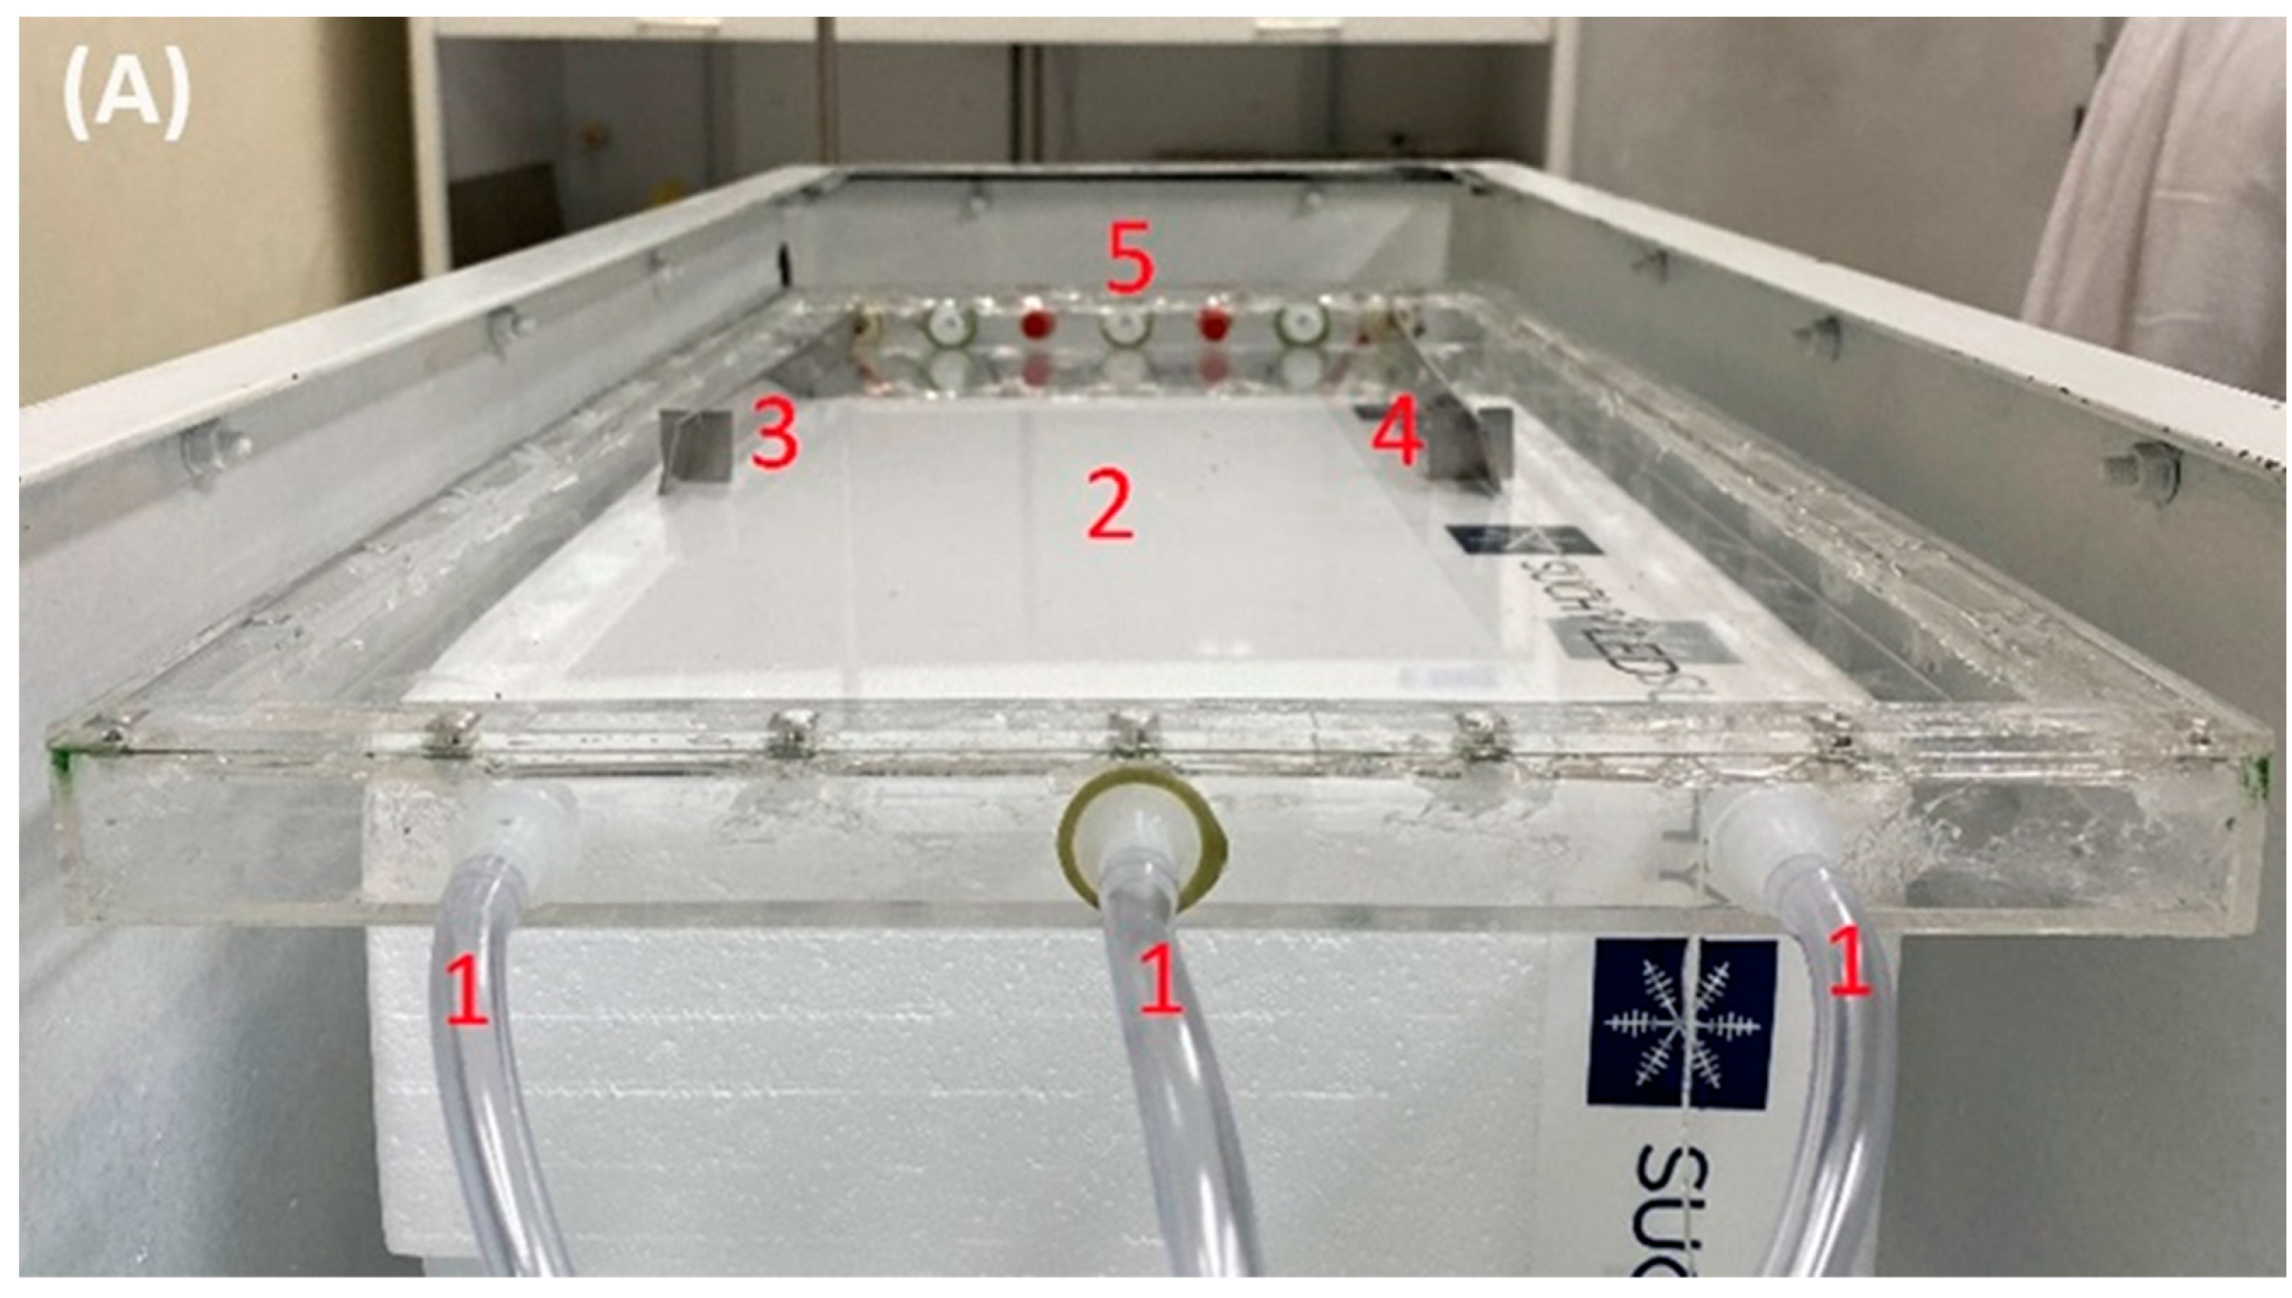
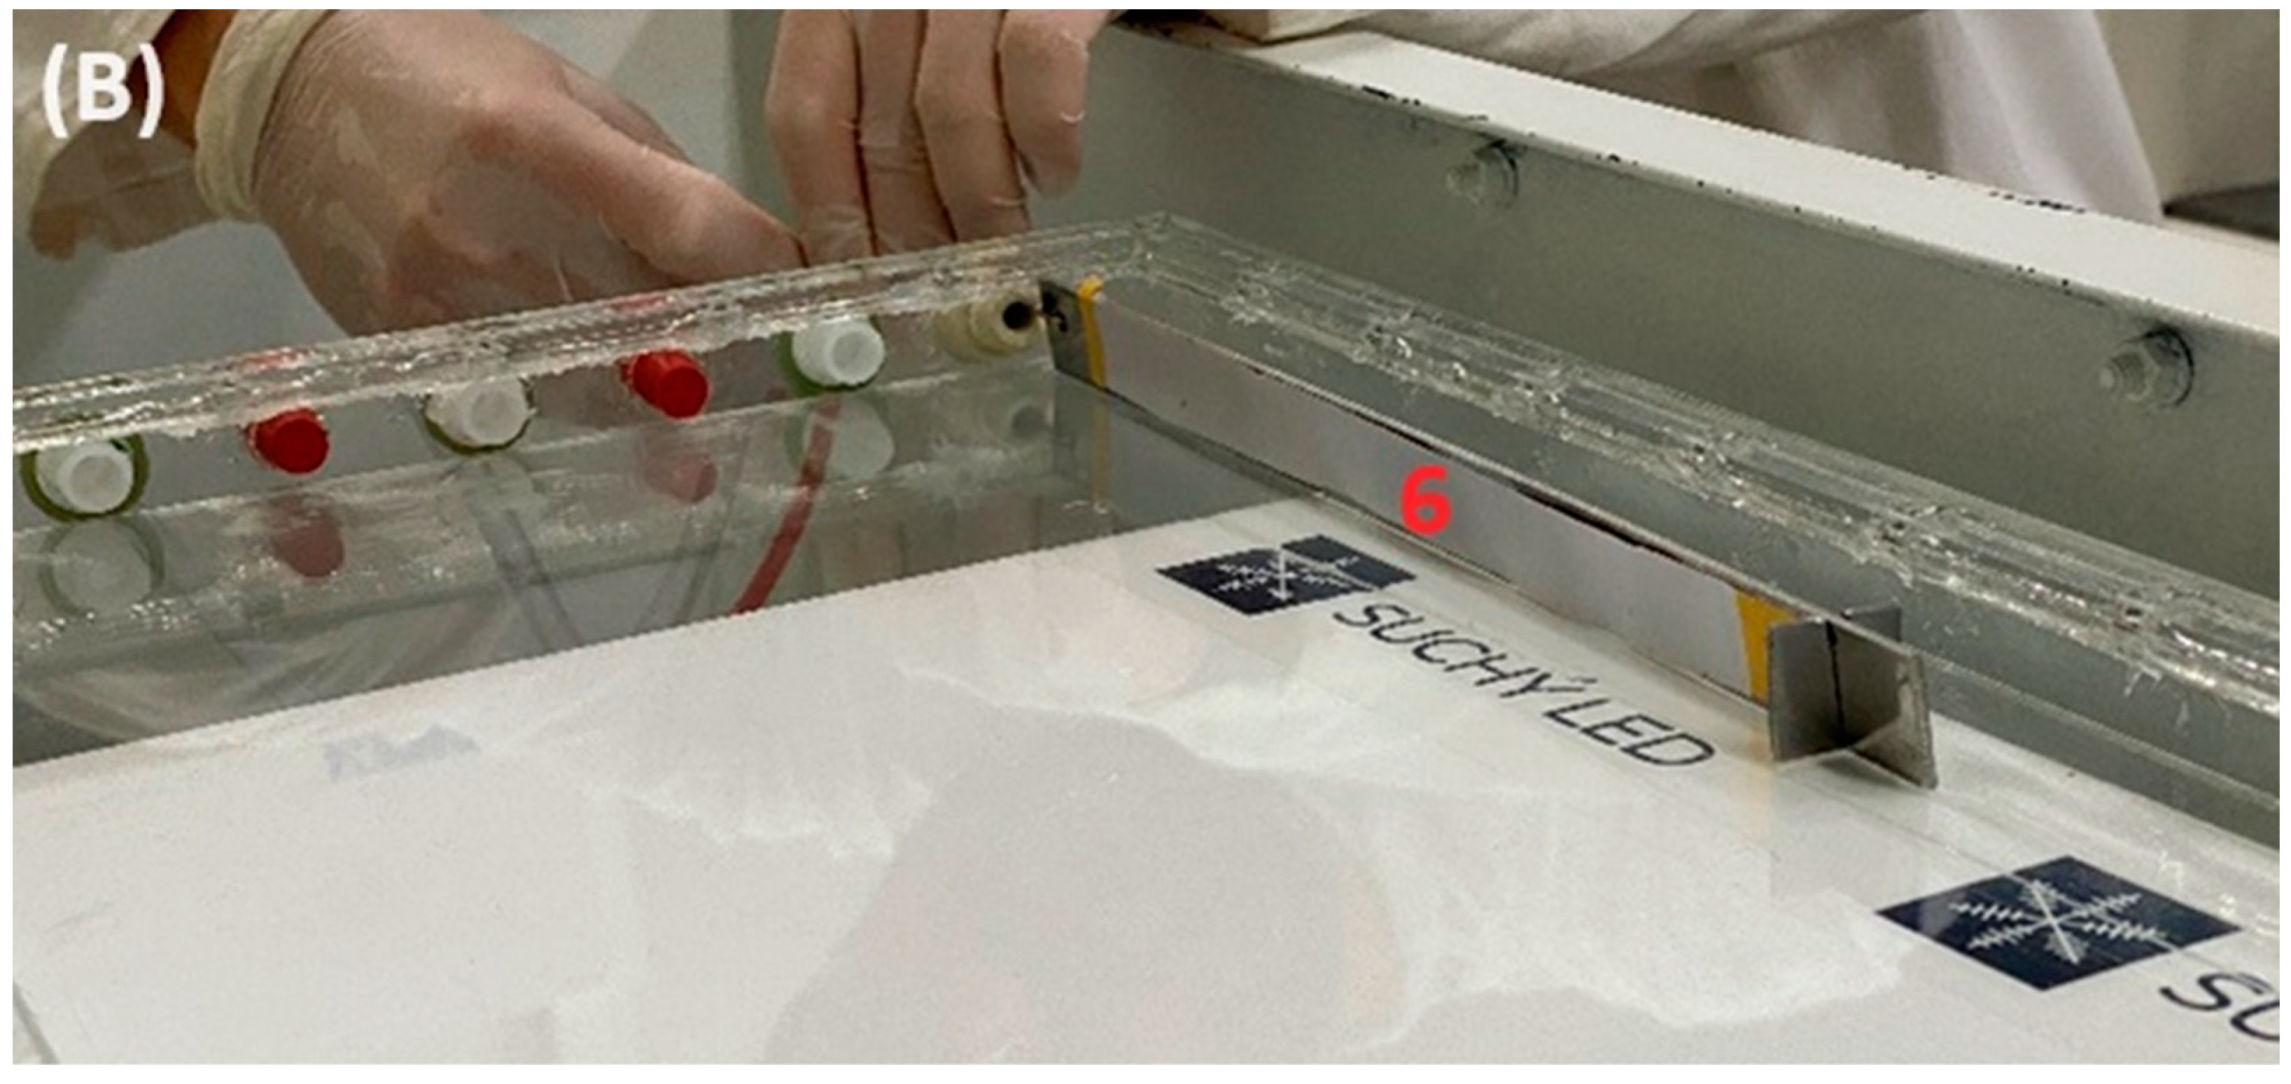
2.4. Mercury Adsorption Test
2.5. Measurements of Mercury Content Adsorbed to the PA6/CS Nanofibers
3. Results and Discussion
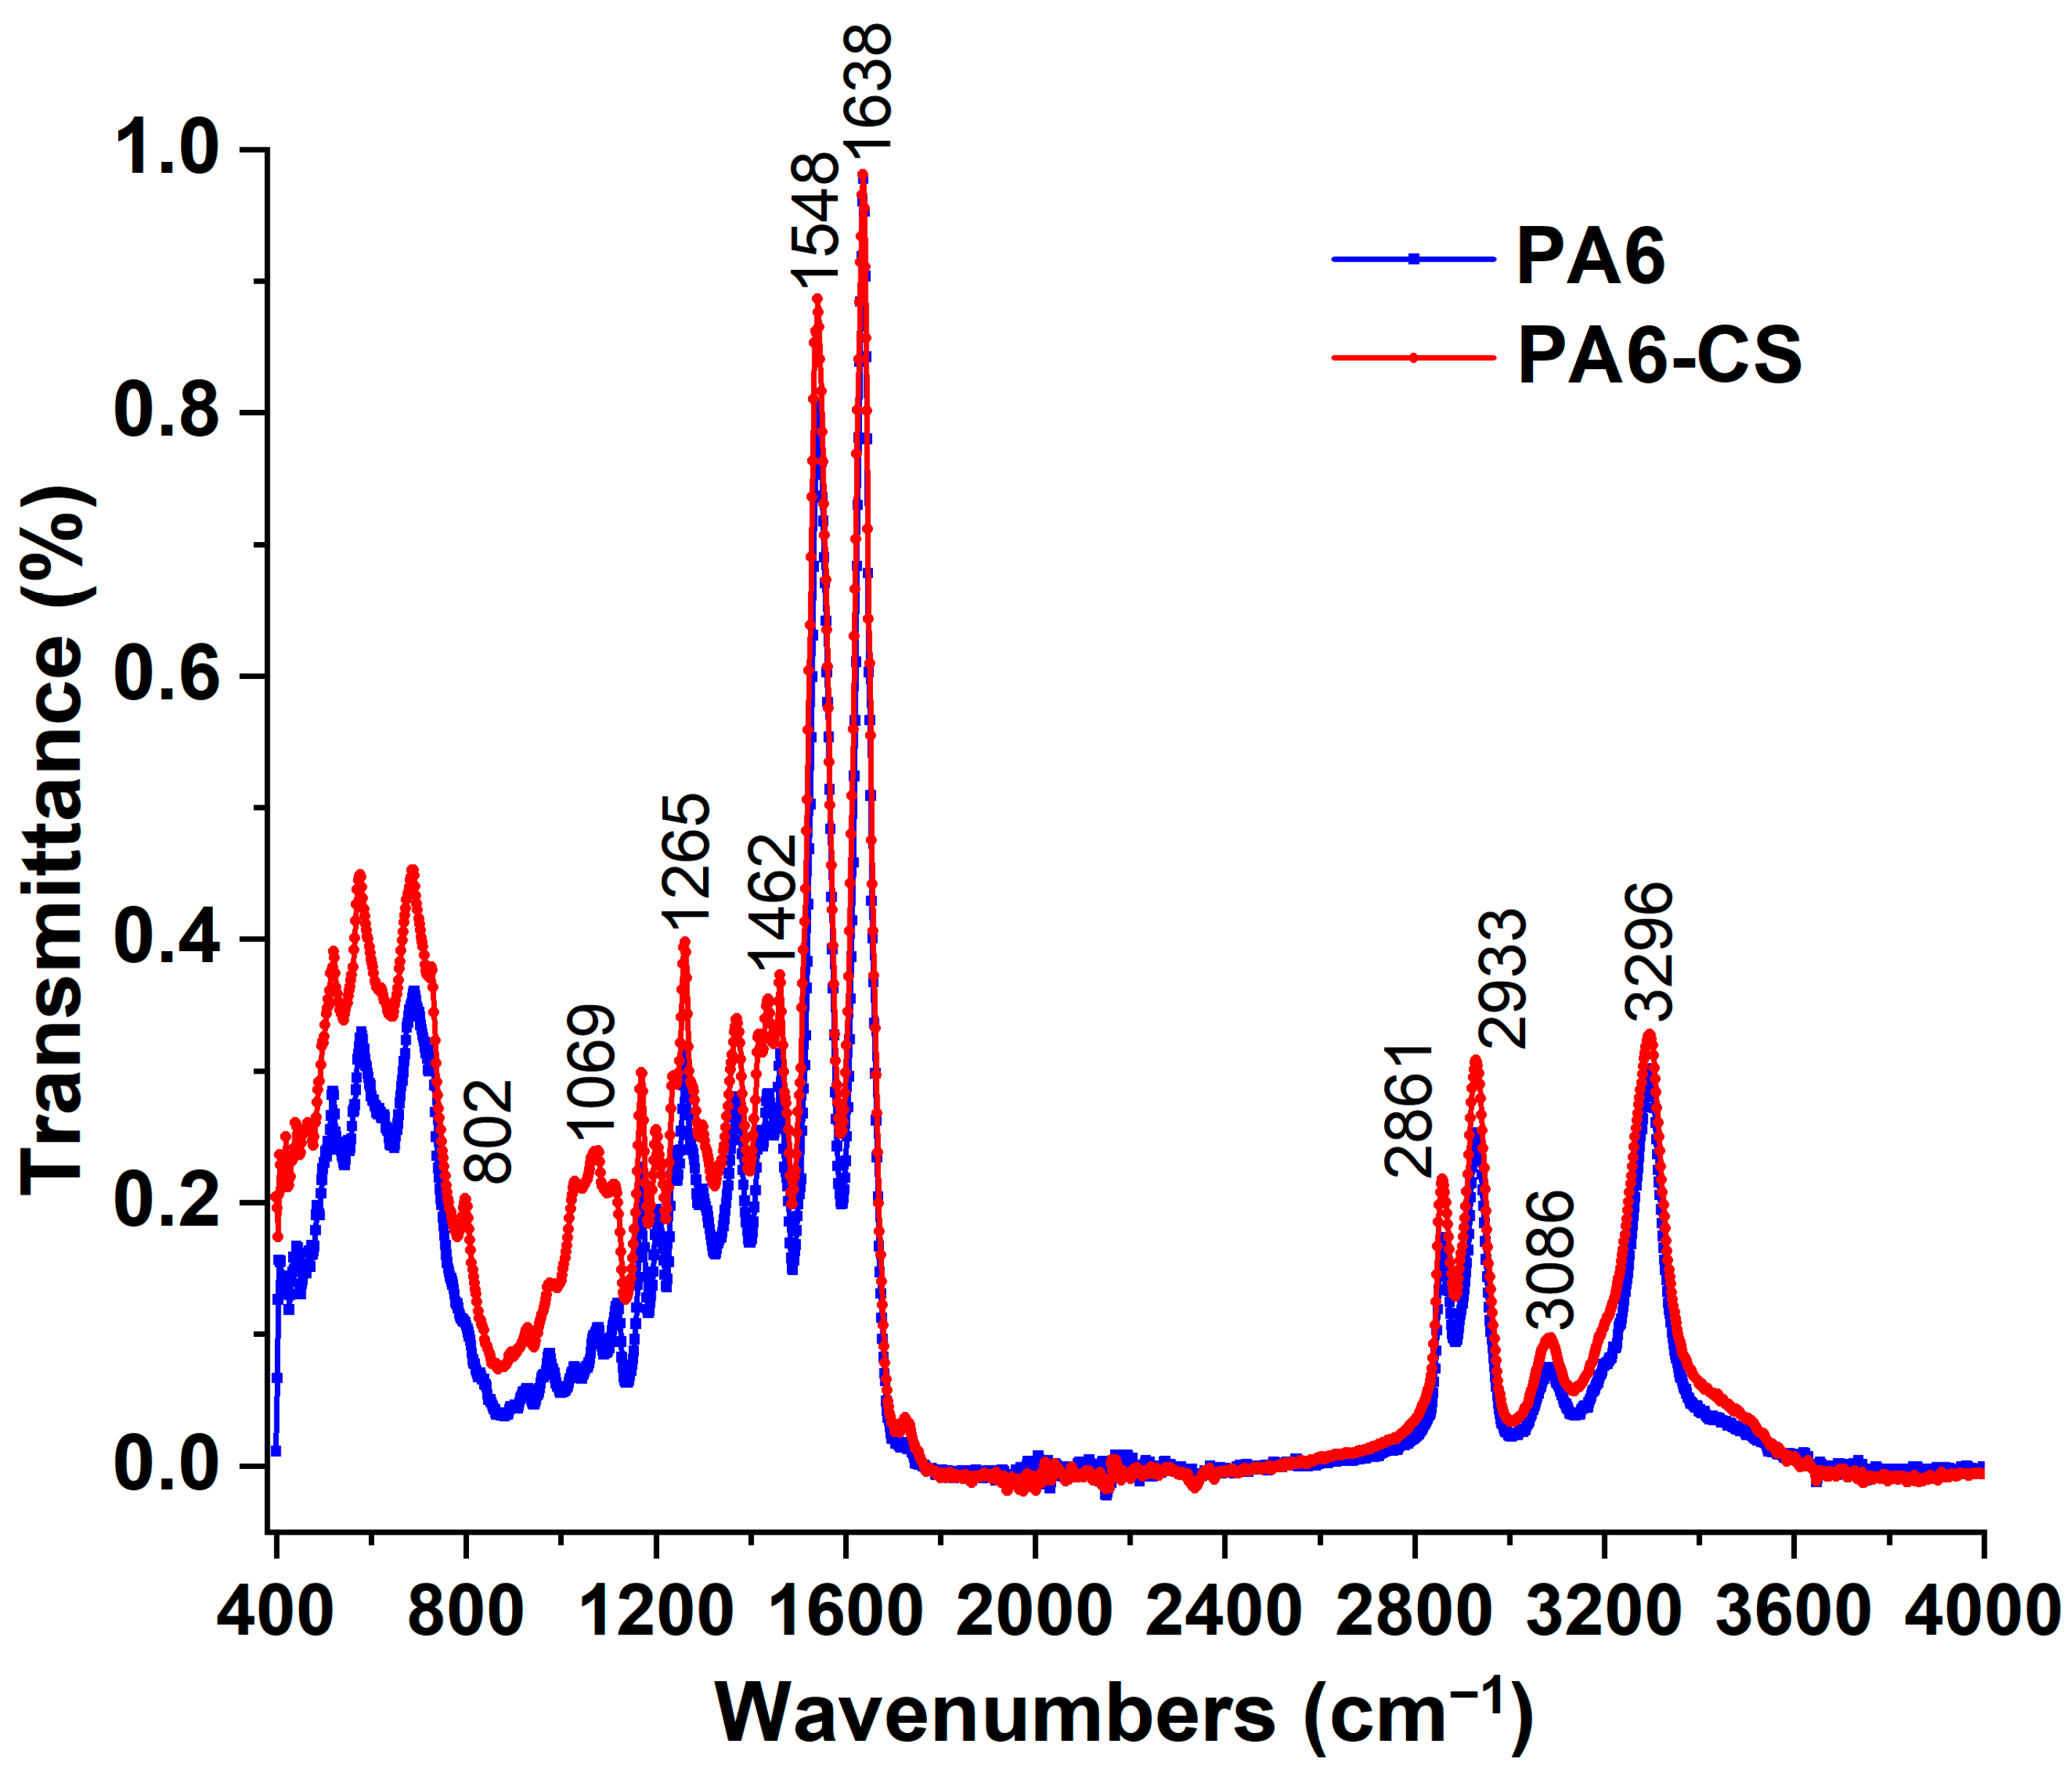
3.1. Characterization of PA6/CS Nanofibers
3.2. Adsorption of Elemental Mercury
4. Conclusions
- Increasing the concentration of chitosan in the nanofibers’ matrix to increase the chemical adsorption of mercury.
- Increasing the size of the nanofiber sample and the size of the electrode in the gas steam.
- Using a stronger X-ray device to induce a higher amount of mercury.
- Modification of the system, which will allow to remove contaminated nanofibers from the cell before the cooling step.
- The potential limitations of the current work are listed as follows:
- The amount of adsorbed mercury is relatively low. Increasing the amount of chitosan molecules in the polymer solution and turning them into a nanofiber form is a sensitive and long optimization procedure. This task may need significant effort and a considerable amount of time.
- Installing a sophisticated and revolutionary filtering device in a coal-fired power station with an X-ray source and electrodes to create an electrical field is difficult due to the presence of solid and old-fashioned structures in the flue gas hazardous reduction system after the combustion process.
- Setting up X-ray irradiation equipment can be expensive, requiring significant capital investment. Handling X-ray equipment requires stringent safety protocols to protect workers from radiation exposure.
- Electrospun nanofibers provide a large surface area-to-volume ratio, increasing the adsorption sites for mercury.
- Nylon and chitosan are environmentally friendly materials. Chitosan, being a natural biopolymer, is biodegradable. This method minimizes the need for chemical reagents, making the process more environmentally safe.
Author Contributions
Funding
Institutional Review Board Statement
Data Availability Statement
Conflicts of Interest
References
- Shamshad, A.; Fulekar, M.; Bhawana, P. Impact of Coal Based Thermal Power Plant on Environment and Its Mitigation Measure. Int. Res. J. Environ. Sci. 2012, 1, 60–64. [Google Scholar]
- Page, A.; Elseewi, A.A.; Straughan, I. Physical and Chemical Properties of Fly Ash from Coal-Fired Power Plants with Reference to Environmental Impacts; Springer: Berlin/Heidelberg, Germany, 1979; pp. 83–120. [Google Scholar]
- Habib, M.A.; Khan, R. Environmental Impacts of Coal-Mining and Coal-Fired Power-Plant Activities in a Developing Country with Global Context. In Spatial Modeling and Assessment of Environmental Contaminants; Springer: Cham, Switzerland, 2021; pp. 421–493. [Google Scholar]
- Finkelman, R.B. Trace Elements in Coal: Environmental and Health Significance. Biol. Trace Elem. Res. 1999, 67, 197–204. [Google Scholar] [CrossRef] [PubMed]
- Amster, E.; Lew Levy, C. Impact of Coal-Fired Power Plant Emissions on Children’s Health: A Systematic Review of the Epidemiological Literature. Int. J. Environ. Res. Public Health 2019, 16, 2008. [Google Scholar] [CrossRef] [PubMed]
- Kravchenko, J.; Lyerly, H.K. The Impact of Coal-Powered Electrical Plants and Coal Ash Impoundments on the Health of Residential Communities. North Carol. Med. J. 2018, 79, 289–300. [Google Scholar] [CrossRef] [PubMed]
- Zhang, H.; Da, Y.; Zhang, X.; Fan, J.-L. The Impacts of Climate Change on Coal-Fired Power Plants: Evidence from China. Energy Environ. Sci. 2021, 14, 4890–4902. [Google Scholar] [CrossRef]
- Widiawaty, M.A.; Nurhanifah, N.; Ismail, A.; Dede, M. The The Impact of Cirebon Coal-Fired Power Plants on Water Quality in Mundu Bay, Cirebon Regency. Sustinere J. Environ. Sustain. 2020, 4, 189–204. [Google Scholar] [CrossRef]
- Wang, S.; Zhang, L. Water Pollution in Coal Wharfs for Coal Loading and Unloading in Coal-Fired Power Plants and Its Countermeasures. J. Coast. Res. 2020, 103, 496–499. [Google Scholar] [CrossRef]
- Güleç, N.; Günal, B.; Erler, A. Assessment of Soil and Water Contamination around an Ash-Disposal Site: A Case Study from the Seyitömer Coal-Fired Power Plant in Western Turkey. Environ. Geol. 2001, 40, 331–344. [Google Scholar] [CrossRef]
- Teng, Y.; Li, P.; Wang, G.; Wang, C.; Qi, N.; Zhang, K.; Wang, M. Effects of SCR Catalyst Breakage on Mercury Emission Properties in Coal-Fired Power Plant: Field Testing and Laboratory Evaluation. Appl. Catal. A Gen. 2023, 650, 118962. [Google Scholar] [CrossRef]
- Li, C.; Wen, C.; Wang, D.; Zhao, C.; Li, R. Emission Characteristics of Gaseous and Particulate Mercury from a Subcritical Power Plant Co-Firing Coal and Sludge. Atmosphere 2022, 13, 1656. [Google Scholar] [CrossRef]
- NRDC. Available online: https://www.nrdc.org/stories/mercurys-journey-coal-burning-power-plants-your-plate (accessed on 4 June 2024).
- Sjostrom, S.; Durham, M.; Bustard, C.J.; Martin, C. Activated Carbon Injection for Mercury Control: Overview. Fuel 2010, 89, 1320–1322. [Google Scholar] [CrossRef]
- Zhao, W.; Geng, X.; Lu, J.; Duan, Y.; Liu, S.; Hu, P.; Xu, Y.; Huang, Y.; Tao, J.; Gu, X. Mercury Removal Performance of Brominated Biomass Activated Carbon Injection in Simulated and Coal-Fired Flue Gas. Fuel 2021, 285, 119131. [Google Scholar] [CrossRef]
- Takahashi, F.; Kida, A.; Shimaoka, T. Statistical Estimate of Mercury Removal Efficiencies for Air Pollution Control Devices of Municipal Solid Waste Incinerators. Sci. Total Environ. 2010, 408, 5472–5477. [Google Scholar] [CrossRef] [PubMed]
- Pavlish, J.H.; Sondreal, E.A.; Mann, M.D.; Olson, E.S.; Galbreath, K.C.; Laudal, D.L.; Benson, S.A. Status Review of Mercury Control Options for Coal-Fired Power Plants. Fuel Process. Technol. 2003, 82, 89–165. [Google Scholar] [CrossRef]
- Kairies, C.L.; Schroeder, K.T.; Cardone, C.R. Mercury in Gypsum Produced from Flue Gas Desulfurization. Fuel 2006, 85, 2530–2536. [Google Scholar] [CrossRef]
- Wo, J.; Zhang, M.; Cheng, X.; Zhong, X.; Xu, J.; Xu, X. Hg2+ Reduction and Re-Emission from Simulated Wet Flue Gas Desulfurization Liquors. J. Hazard. Mater. 2009, 172, 1106–1110. [Google Scholar] [CrossRef] [PubMed]
- Zhao, S.; Peng, J.; Ge, R.; Wu, S.; Zeng, K.; Huang, H.; Yang, K.; Sun, Z. Research Progress on Selective Catalytic Reduction (SCR) Catalysts for NOx Removal from Coal-Fired Flue Gas. Fuel Process. Technol. 2022, 236, 107432. [Google Scholar] [CrossRef]
- Li, Y.; Yu, J.; Liu, Y.; Huang, R.; Wang, Z.; Zhao, Y. A Review on Removal of Mercury from Flue Gas Utilizing Existing Air Pollutant Control Devices (APCDs). J. Hazard. Mater. 2022, 427, 128132. [Google Scholar] [CrossRef]
- Kurniawan, T.A.; Lo, W.; Liang, X.; Goh, H.H.; Othman, M.H.D.; Chong, K.-K.; Chew, K.W. Remediation Technologies for Contaminated Groundwater Due to Arsenic (As), Mercury (Hg), and/or Fluoride (F): A Critical Review and Way Forward to Contribute to Carbon Neutrality. Sep. Purif. Technol. 2023, 314, 123474. [Google Scholar] [CrossRef]
- Omer, A.M.; Dey, R.; Eltaweil, A.S.; Abd El-Monaem, E.M.; Ziora, Z.M. Insights into Recent Advances of Chitosan-Based Adsorbents for Sustainable Removal of Heavy Metals and Anions. Arab. J. Chem. 2022, 15, 103543. [Google Scholar] [CrossRef]
- Haripriyan, U.; Gopinath, K.; Arun, J. Chitosan Based Nano Adsorbents and Its Types for Heavy Metal Removal: A Mini Review. Mater. Lett. 2022, 312, 131670. [Google Scholar] [CrossRef]
- Yalcinkaya, F. Preparation of Various Nanofiber Layers Using Wire Electrospinning System. Arab. J. Chem. 2019, 12, 5162–5172. [Google Scholar] [CrossRef]
- Rosli, N.; Yahya, W.Z.N.; Wirzal, M.D.H. Crosslinked Chitosan/Poly (Vinyl Alcohol) Nanofibers Functionalized by Ionic Liquid for Heavy Metal Ions Removal. Int. J. Biol. Macromol. 2022, 195, 132–141. [Google Scholar] [CrossRef] [PubMed]
- Adil, H.I.; Thalji, M.R.; Yasin, S.A.; Saeed, I.A.; Assiri, M.A.; Chong, K.F.; Ali, G.A. Metal–Organic Frameworks (MOFs) Based Nanofiber Architectures for the Removal of Heavy Metal Ions. RSC Adv. 2022, 12, 1433–1450. [Google Scholar] [CrossRef] [PubMed]
- Haider, S.; Park, S.-Y. Preparation of the Electrospun Chitosan Nanofibers and Their Applications to the Adsorption of Cu (II) and Pb (II) Ions from an Aqueous Solution. J. Membr. Sci. 2009, 328, 90–96. [Google Scholar] [CrossRef]
- Mallik, A.K.; Kabir, S.F.; Rahman, F.B.A.; Sakib, M.N.; Efty, S.S.; Rahman, M.M. Cu (II) Removal from Wastewater Using Chitosan-Based Adsorbents: A Review. J. Environ. Chem. Eng. 2022, 10, 108048. [Google Scholar] [CrossRef]
- Algieri, C.; Chakraborty, S.; Candamano, S. A Way to Membrane-Based Environmental Remediation for Heavy Metal Removal. Environments 2021, 8, 52. [Google Scholar] [CrossRef]
- Escudero-Oñate, C.; Martínez-Francés, E. A Review of Chitosan-Based Materials for the Removal of Organic Pollution from Water and Bioaugmentation. In Chitin-Chitosan - Myriad Functionalities in Science and Technology; IntechOpen: London, UK, 2018; Volume 4. [Google Scholar]
- Dhandayuthapani, B.; Krishnan, U.M.; Sethuraman, S. Fabrication and Characterization of Chitosan-gelatin Blend Nanofibers for Skin Tissue Engineering. J. Biomed. Mater. Res. Part B Appl. Biomater. 2010, 94, 264–272. [Google Scholar] [CrossRef] [PubMed]
- Haaparanta, A.-M.; Järvinen, E.; Cengiz, I.F.; Ellä, V.; Kokkonen, H.T.; Kiviranta, I.; Kellomäki, M. Preparation and Characterization of Collagen/PLA, Chitosan/PLA, and Collagen/Chitosan/PLA Hybrid Scaffolds for Cartilage Tissue Engineering. J. Mater. Sci. Mater. Med. 2014, 25, 1129–1136. [Google Scholar] [CrossRef]
- Prasad, T.; Shabeena, E.; Vinod, D.; Kumary, T.; Anil Kumar, P. Characterization and in Vitro Evaluation of Electrospun Chitosan/Polycaprolactone Blend Fibrous Mat for Skin Tissue Engineering. J. Mater. Sci. Mater. Med. 2015, 26, 1–13. [Google Scholar] [CrossRef]
- Wang, Z.; Yan, F.; Pei, H.; Li, J.; Cui, Z.; He, B. Antibacterial and Environmentally Friendly Chitosan/Polyvinyl Alcohol Blend Membranes for Air Filtration. Carbohydr. Polym. 2018, 198, 241–248. [Google Scholar] [CrossRef] [PubMed]
- Liu, Y.; Wang, S.; Lan, W. Fabrication of Antibacterial Chitosan-PVA Blended Film Using Electrospray Technique for Food Packaging Applications. Int. J. Biol. Macromol. 2018, 107, 848–854. [Google Scholar] [CrossRef] [PubMed]
- Kuntzler, S.G.; Costa, J.A.V.; de Morais, M.G. Development of Electrospun Nanofibers Containing Chitosan/PEO Blend and Phenolic Compounds with Antibacterial Activity. Int. J. Biol. Macromol. 2018, 117, 800–806. [Google Scholar] [CrossRef] [PubMed]
- Zarayneh, S.; Sepahi, A.A.; Jonoobi, M.; Rasouli, H. Comparative Antibacterial Effects of Cellulose Nanofiber, Chitosan Nanofiber, Chitosan/Cellulose Combination and Chitosan Alone against Bacterial Contamination of Iranian Banknotes. Int. J. Biol. Macromol. 2018, 118, 1045–1054. [Google Scholar] [CrossRef] [PubMed]
- Kim, S.S.; Lee, J. Antibacterial Activity of Polyacrylonitrile–Chitosan Electrospun Nanofibers. Carbohydr. Polym. 2014, 102, 231–237. [Google Scholar] [CrossRef] [PubMed]
- Christou, C.; Philippou, K.; Krasia-Christoforou, T.; Pashalidis, I. Uranium Adsorption by Polyvinylpyrrolidone/Chitosan Blended Nanofibers. Carbohydr. Polym. 2019, 219, 298–305. [Google Scholar] [CrossRef] [PubMed]
- Ghani, M.; Gharehaghaji, A.A.; Arami, M.; Takhtkuse, N.; Rezaei, B. Fabrication of Electrospun Polyamide-6/Chitosan Nanofibrous Membrane toward Anionic Dyes Removal. J. Nanotechnol. 2014, 2014, 278418. [Google Scholar] [CrossRef]
- Yalcinkaya, B.; Yalcinkaya, F.; Chaloupek, J. Thin Film Nanofibrous Composite Membrane for Dead-End Seawater Desalination. J. Nanomater. 2016, 2694373. [Google Scholar] [CrossRef]
- Wang, S.; Hui-Min, W.; Zhu, F.-H.; Chen, H.; Sun, X.-L.; Zuo, Y.; Li, G. Mercury Emission Characteristics from Coal-Fired Power Plants Based on Actual Measurement. Huan Jing Ke Xue 2011, 32, 33–37. [Google Scholar]
- Xie, G.; Liu, Z.; Zhu, Z.; Liu, Q.; Ge, J.; Huang, Z. Simultaneous Removal of SO2 and NOx from Flue Gas Using a CuO/Al2O3 Catalyst Sorbent: I. Deactivation of SCR Activity by SO2 at Low Temperatures. J. Catal. 2004, 224, 36–41. [Google Scholar] [CrossRef]
- Zheng, C.; Luo, C.; Liu, Y.; Wang, Y.; Lu, Y.; Qu, R.; Zhang, Y.; Gao, X. Experimental Study on the Removal of SO3 from Coal-Fired Flue Gas by Alkaline Sorbent. Fuel 2020, 259, 116306. [Google Scholar] [CrossRef]
- Al-Deyab, S.S.; El-Newehy, M.H.; Nirmala, R.; Abdel-Megeed, A.; Kim, H.Y. Preparation of Nylon-6/Chitosan Composites by Nanospider Technology and Their Use as Candidate for Antibacterial Agents. Korean J. Chem. Eng. 2013, 30, 422–428. [Google Scholar] [CrossRef]
- Kummer, G.; Schonhart, C.; Fernandes, M.; Dotto, G.; Missio, A.; Bertuol, D.; Tanabe, E. Development of Nanofibers Composed of Chitosan/Nylon 6 and Tannin/Nylon 6 for Effective Adsorption of Cr (VI). J. Polym. Environ. 2018, 26, 4073–4084. [Google Scholar] [CrossRef]
- Nirmala, R.; Navamathavan, R.; El-Newehy, M.H.; Kim, H.Y. Preparation and Characterization of Electrospun Ultrafine Polyamide-6 Nanofibers. Polym. Int. 2011, 60, 1475–1480. [Google Scholar] [CrossRef]
- Qua, E.; Hornsby, P. Preparation and Characterisation of Nanocellulose Reinforced Polyamide-6. Plast. Rubber Compos. 2011, 40, 300–306. [Google Scholar] [CrossRef]
- Yang, W.; Li, R.; Fang, C.; Hao, W. Surface Modification of Polyamide Nanofiber Membranes by Polyurethane to Simultaneously Improve Their Mechanical Strength and Hydrophobicity for Breathable and Waterproof Applications. Prog. Org. Coat. 2019, 131, 67–72. [Google Scholar] [CrossRef]
- Shrestha, B.K.; Mousa, H.M.; Tiwari, A.P.; Ko, S.W.; Park, C.H.; Kim, C.S. Development of Polyamide-6, 6/Chitosan Electrospun Hybrid Nanofibrous Scaffolds for Tissue Engineering Application. Carbohydr. Polym. 2016, 148, 107–114. [Google Scholar] [CrossRef] [PubMed]
- Aridi, A.; Yusof, Y.; Chin, N.; Ishak, N.; Yusof, N.; Manaf, Y. Physicochemical Properties of Chitosan Extracted from Leucaena Leucocephala Pods Using Deprotenization and Decolorization Steps; IOP Publishing: Bristol, UK, 2021; Volume 709, p. 012038. [Google Scholar]
- Gao, P.; Gao, B.; Gao, J.; Zhang, K.; Yang, Y.; Chen, H. Chitosan and Its Composites for Removal of Mercury Ion from Aqueous Solution. Prog. Chem. 2016, 28, 1834. [Google Scholar]
- Kyzas, G.Z.; Deliyanni, E.A. Mercury (II) Removal with Modified Magnetic Chitosan Adsorbents. Molecules 2013, 18, 6193–6214. [Google Scholar] [CrossRef]


| Value | Unit | |
|---|---|---|
| Solution Parameters | ||
| PA6/CS concentration in AA/FA (2:1) | 10 (9.9:0.1) | (w/w) % |
| Process parameters | ||
| Humidity | 35 | % Rh |
| Temperature | 22 | °C |
| Applied voltage on the lower electrode | −15 | kV |
| Applied voltage on the upper electrode | +65 | kV |
| Distance between electrode | 180 | mm |
| Air input | 70.6 | m3/h |
| Air output | 80.4 | m3/h |
| Rewinding speed | 12 | mm/min |
| Polymer carriage speed | 350 | mm/s |
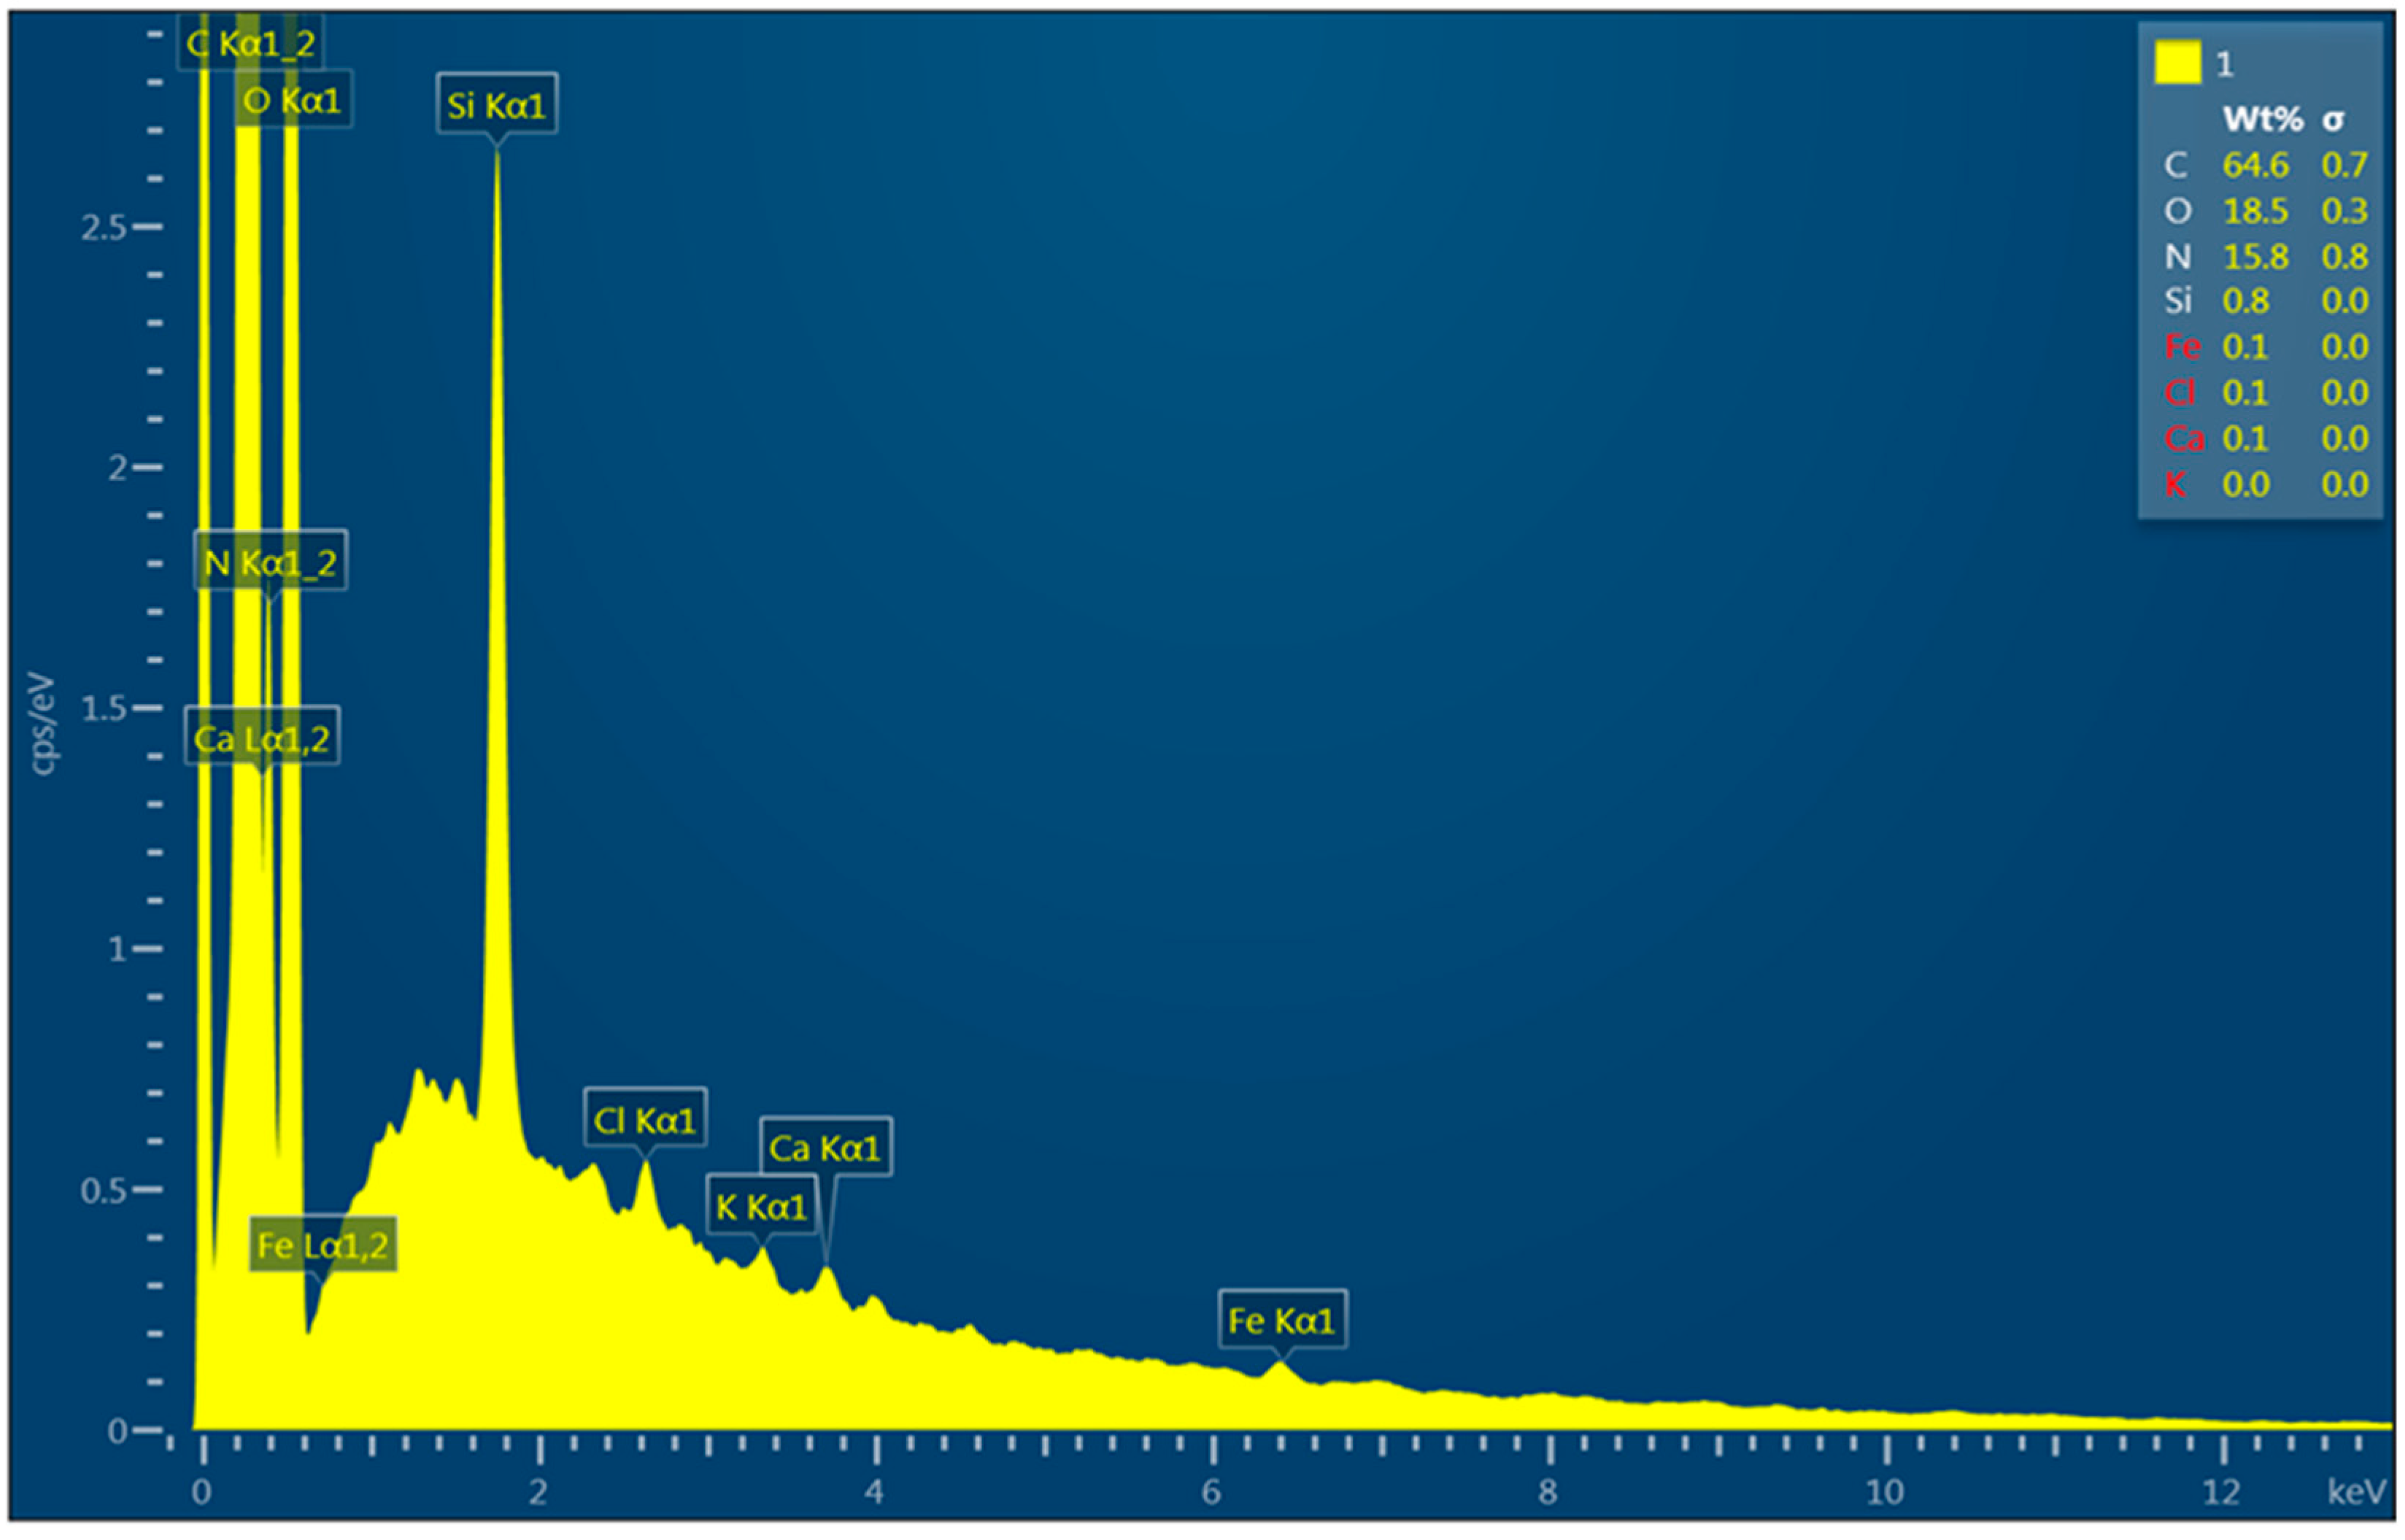
| Element | Electron Transition | Wt. % | Wt. % Deviation | At % |
|---|---|---|---|---|
| C | K | 64.6 | 0.7 | 69.9 |
| N | K | 15.8 | 0.8 | 14.6 |
| O | K | 18.5 | 0.3 | 15.0 |
| Si | K | 0.8 | 0.0 | 0.4 |
| Allocated Number of PA6/CS Nanofibers’ Sample | Sample Weight (mg) | Detected Mercury Amount (ng Hg) | Detected Mercury Amount (ng Hg/cm2) |
|---|---|---|---|
| 1 | 2.82 | 0.20 | 0.03 |
| 2 | 2.55 | 0.53 | 0.08 |
| 3 | 2.91 | 0.33 | 0.05 |
| 4 | 3.33 | 10.9 | 3.28 |
| Total | 11.96 |
Disclaimer/Publisher’s Note: The statements, opinions and data contained in all publications are solely those of the individual author(s) and contributor(s) and not of MDPI and/or the editor(s). MDPI and/or the editor(s) disclaim responsibility for any injury to people or property resulting from any ideas, methods, instructions or products referred to in the content. |
© 2024 by the authors. Licensee MDPI, Basel, Switzerland. This article is an open access article distributed under the terms and conditions of the Creative Commons Attribution (CC BY) license (https://creativecommons.org/licenses/by/4.0/).
Share and Cite
Yalcinkaya, B.; Strejc, M.; Yalcinkaya, F.; Spirek, T.; Louda, P.; Buczkowska, K.E.; Bousa, M. An Innovative Approach for Elemental Mercury Adsorption Using X-ray Irradiation and Electrospun Nylon/Chitosan Nanofibers. Polymers 2024, 16, 1721. https://doi.org/10.3390/polym16121721
Yalcinkaya B, Strejc M, Yalcinkaya F, Spirek T, Louda P, Buczkowska KE, Bousa M. An Innovative Approach for Elemental Mercury Adsorption Using X-ray Irradiation and Electrospun Nylon/Chitosan Nanofibers. Polymers. 2024; 16(12):1721. https://doi.org/10.3390/polym16121721
Chicago/Turabian StyleYalcinkaya, Baturalp, Martin Strejc, Fatma Yalcinkaya, Tomas Spirek, Petr Louda, Katarzyna Ewa Buczkowska, and Milan Bousa. 2024. "An Innovative Approach for Elemental Mercury Adsorption Using X-ray Irradiation and Electrospun Nylon/Chitosan Nanofibers" Polymers 16, no. 12: 1721. https://doi.org/10.3390/polym16121721
APA StyleYalcinkaya, B., Strejc, M., Yalcinkaya, F., Spirek, T., Louda, P., Buczkowska, K. E., & Bousa, M. (2024). An Innovative Approach for Elemental Mercury Adsorption Using X-ray Irradiation and Electrospun Nylon/Chitosan Nanofibers. Polymers, 16(12), 1721. https://doi.org/10.3390/polym16121721