
Preparation and Evaluation of PVDF-HFP-Based Gel Electrolyte for Ge-Sensitized Thermal Cell

Abstract
:
1. Introduction
2. Materials and Methods
2.1. Chemicals
2.2. Electrodes
2.3. Electrolyte
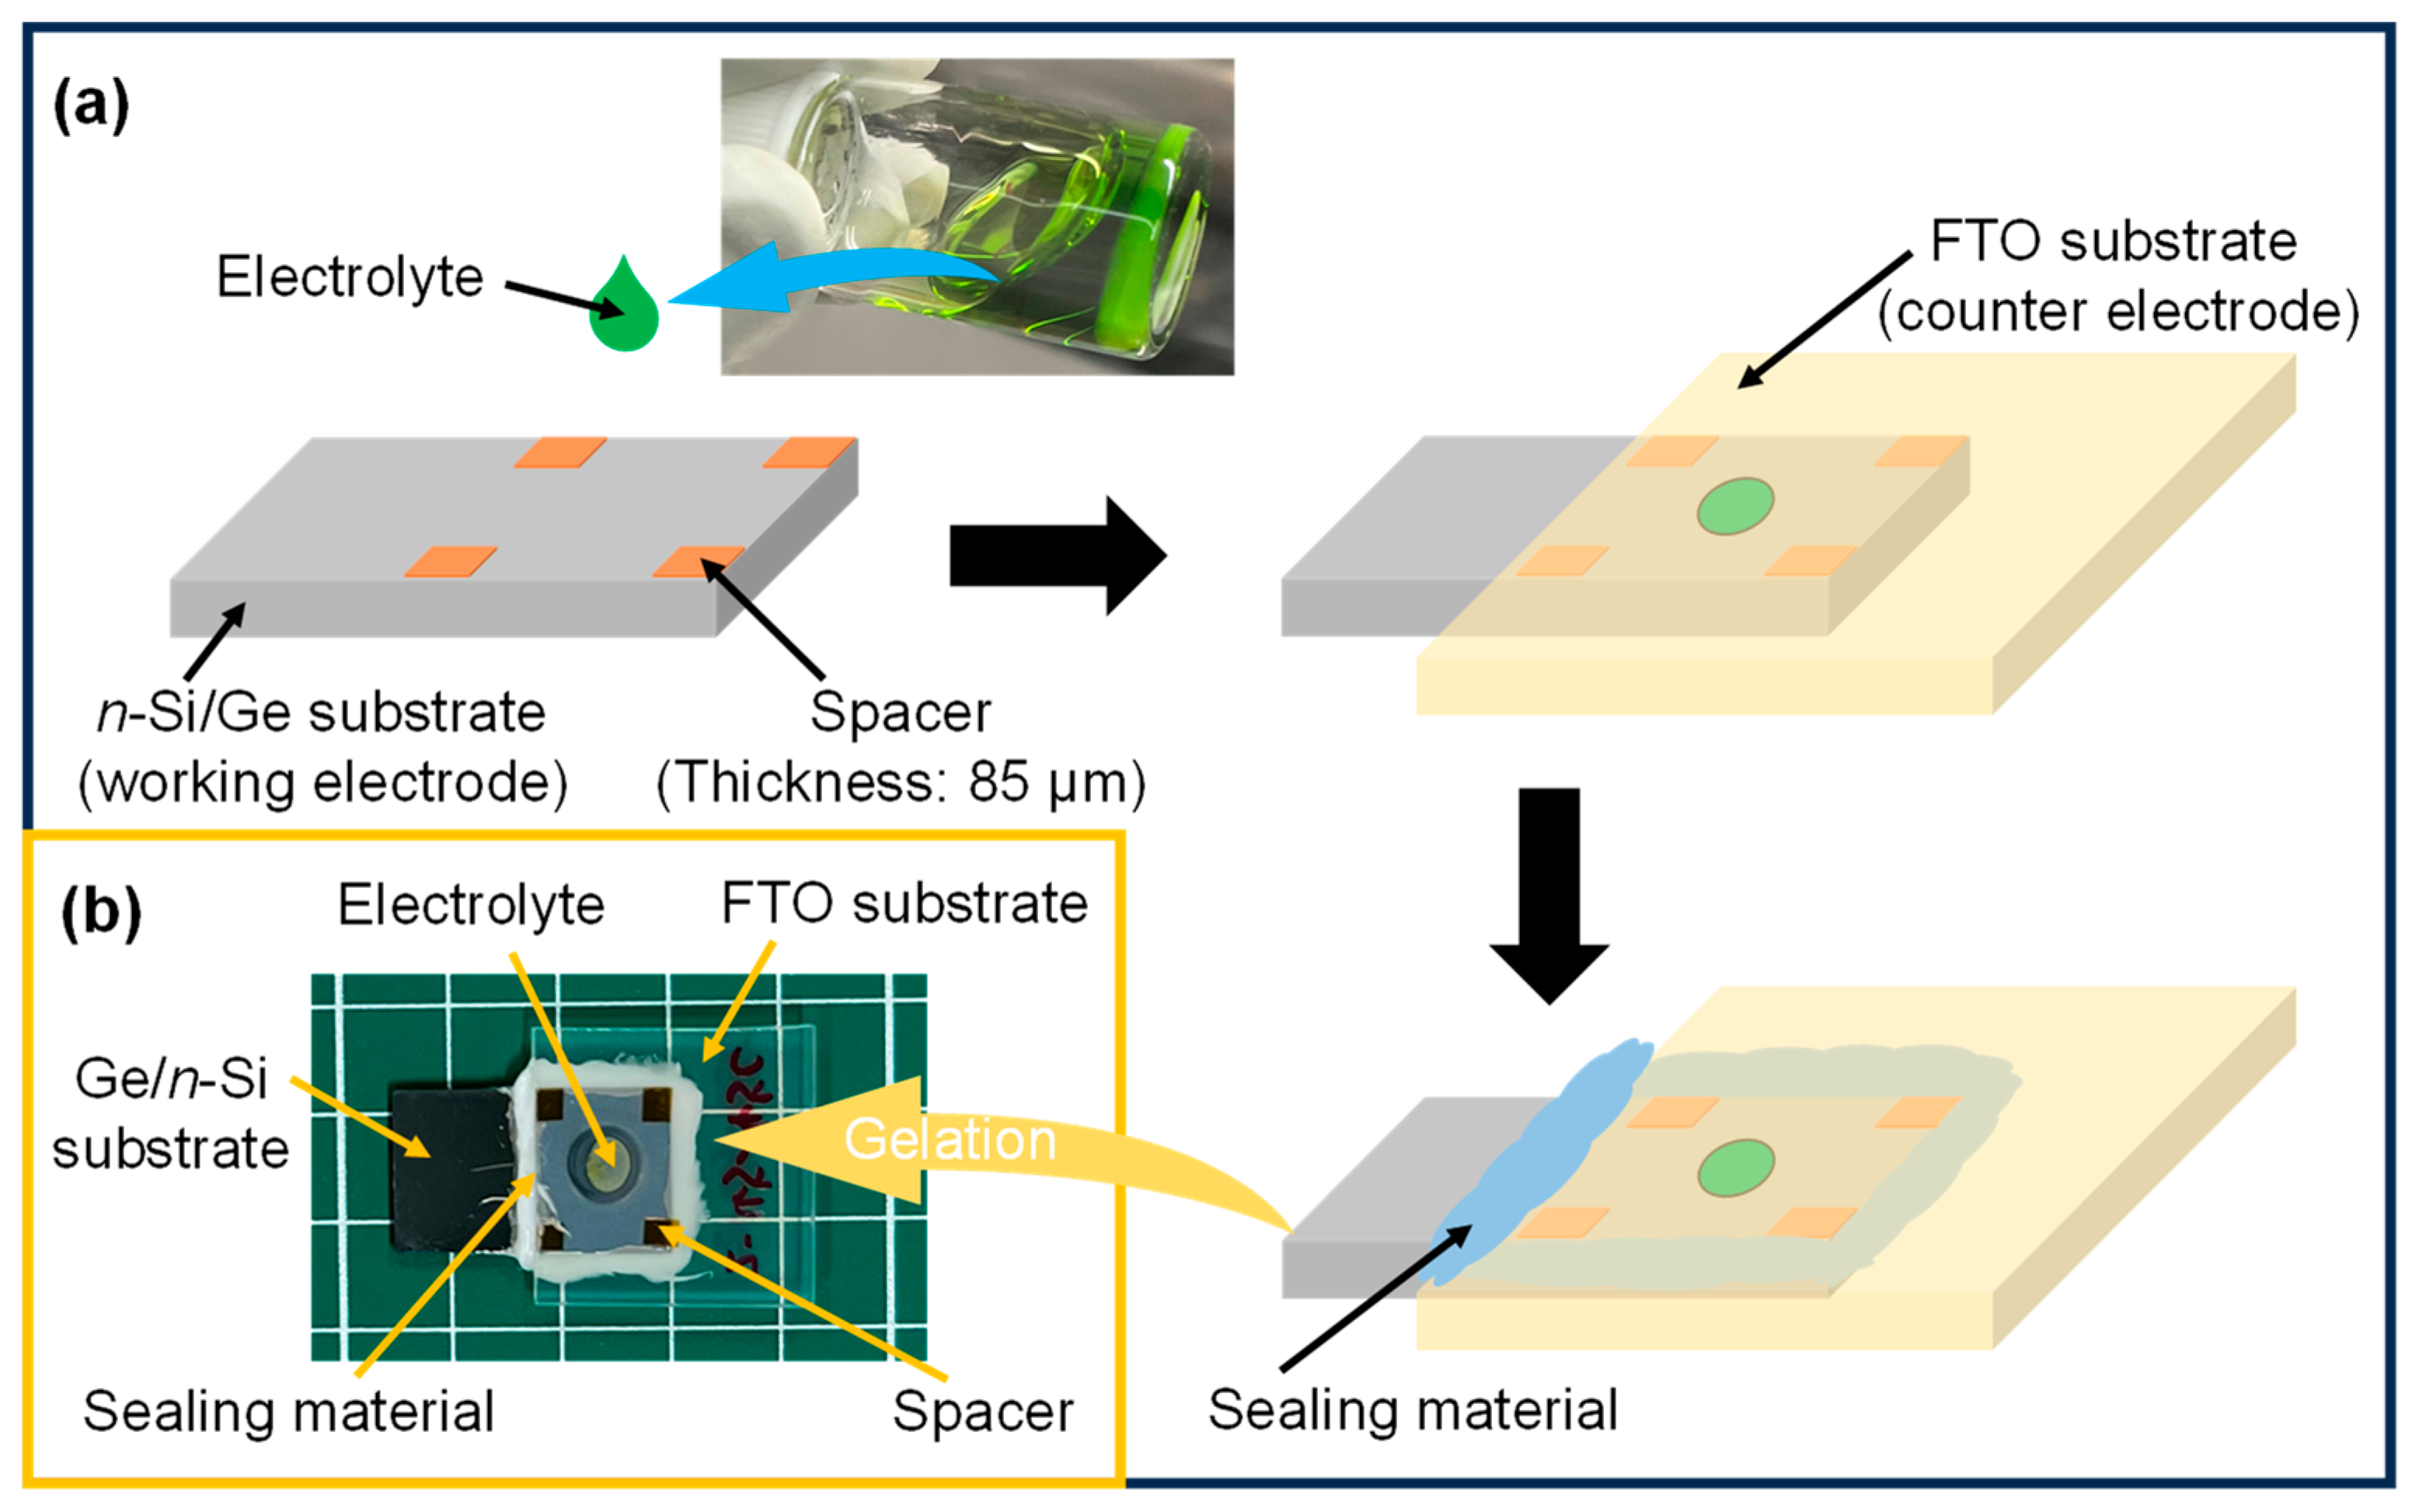
2.4. Cell Assembly
2.5. Characterization
3. Results
3.1. Chemical Bonding States and Morphologies of GPEs
3.2. Electrochemical Performances of GPEs
4. Conclusions
Supplementary Materials
Author Contributions
Funding
Institutional Review Board Statement
Data Availability Statement
Conflicts of Interest
References
- Pambudi, N.A. Geothermal Power Generation in Indonesia, a Country within the Ring of Fire: Current Status, Future Development and Policy. Renew. Sustain. Energy Rev. 2018, 81, 2893–2901. [Google Scholar] [CrossRef]
- Mukherjee, M.; Srivastava, A.; Singh, A.K. Recent Advances in Designing Thermoelectric Materials. J. Mater. Chem. C 2022, 10, 12524–12555. [Google Scholar] [CrossRef]
- Narducci, D.; Giulio, F. Recent Advances on Thermoelectric Silicon for Low-Temperature Applications. Materials 2022, 15, 1214. [Google Scholar] [CrossRef]
- Matsushita, S.; Tsuruoka, A.; Kobayashi, E.; Isobe, T.; Nakajima, A. Redox Reactions by Thermally Excited Charge Carriers: Towards Sensitized Thermal Cells. Mater. Horizons 2017, 4, 649–656. [Google Scholar] [CrossRef]
- Inagawa, Y.; Isobe, T.; Nakajima, A.; Matsushita, S. Ag2S-Sensitized Thermal Cell. J. Phys. Chem. C 2019, 123, 12135–12141. [Google Scholar] [CrossRef]
- Sekiya, H.; Isobe, T.; Nakajima, A.; Matsushita, S. Can CuFeS2 Be Used in a Sensitized Thermal Cell? Mater. Today Energy 2020, 17, 100469. [Google Scholar] [CrossRef]
- Matsushita, S.; Araki, T.; Mei, B.; Sugawara, S.; Inagawa, Y.; Nishiyama, J.; Isobe, T.; Nakajima, A. A Sensitized Thermal Cell Recovered Using Heat. J. Mater. Chem. A 2019, 7, 18249–18256. [Google Scholar] [CrossRef]
- Matsushita, S.; Sugawara, S.; Ikeda, T.; Araki, T.; Sekiya, H.; Kohata, H.; Isobe, T.; Nakajima, A. Fermi Level Dependence of a Working Electrode on the Open Circuit Voltage in a Sensitized Thermal Cell. Chem. Lett. 2020, 49, 1013–1016. [Google Scholar] [CrossRef]
- Ikeda, T.; Sekiya, H.; Kohata, H.; Isobe, T.; Nakajima, A.; Matsushita, S. Role of the Ions in the Ge/(CuCl, CuCl2 and LiCl)/FTO-Sensitized Thermal Cell. J. Electroanal. Chem. 2021, 895, 115413. [Google Scholar] [CrossRef]
- Luo, W.; Gong, Y.; Zhu, Y.; Fu, K.K.; Dai, J.; Lacey, S.D.; Wang, C.; Liu, B.; Han, X.; Mo, Y.; et al. Transition from Superlithiophobicity to Superlithiophilicity of Garnet Solid-State Electrolyte. J. Am. Chem. Soc. 2016, 138, 12258–12262. [Google Scholar] [CrossRef]
- Hao, S.M.; Liang, S.; Sewell, C.D.; Li, Z.; Zhu, C.; Xu, J.; Lin, Z. Lithium-Conducting Branched Polymers: New Paradigm of Solid-State Electrolytes for Batteries. Nano Lett. 2021, 21, 7435–7447. [Google Scholar] [CrossRef] [PubMed]
- Smitha, B.; Sridhar, S.; Khan, A.A. Solid Polymer Electrolyte Membranes for Fuel Cell Applications—A Review. J. Membr. Sci. 2005, 259, 10–26. [Google Scholar] [CrossRef]
- Murata, K.; Izuchi, S.; Yoshihisa, Y. Overview of the Research and Development of Solid Polymer Electrolyte Batteries. Electrochim. Acta 2000, 45, 1501–1508. [Google Scholar] [CrossRef]
- Bocharova, V.; Sokolov, A.P. Perspectives for Polymer Electrolytes: A View from Fundamentals of Ionic Conductivity. Macromolecules 2020, 53, 4141–4157. [Google Scholar] [CrossRef]
- Su, Y.; Xu, F.; Zhang, X.; Qiu, Y.; Wang, H. Rational Design of High-Performance PEO/Ceramic Composite Solid Electrolytes for Lithium Metal Batteries. Nano-Micro Lett. 2023, 15, 82. [Google Scholar] [CrossRef] [PubMed]
- Xue, Z.; He, D.; Xie, X. Poly(Ethylene Oxide)-Based Electrolytes for Lithium-Ion Batteries. J. Mater. Chem. A 2015, 3, 19218–19253. [Google Scholar] [CrossRef]
- Aruchamy, K.; Ramasundaram, S.; Divya, S.; Chandran, M.; Yun, K.; Oh, T.H. Gel Polymer Electrolytes: Advancing Solid-State Batteries for High-Performance Applications. Gels 2023, 9, 585. [Google Scholar] [CrossRef] [PubMed]
- Pan, J.; Wang, N.; Fan, H.J. Gel Polymer Electrolytes Design for Na-Ion Batteries. Small Methods 2022, 6, 2201032. [Google Scholar] [CrossRef] [PubMed]
- Ren, W.; Ding, C.; Fu, X.; Huang, Y. Advanced Gel Polymer Electrolytes for Safe and Durable Lithium Metal Batteries: Challenges, Strategies, and Perspectives. Energy Storage Mater. 2021, 34, 515–535. [Google Scholar] [CrossRef]
- Huang, X.; Xu, D.; Chen, W.; Yin, H.; Zhang, C.; Luo, Y.; Yu, X. Preparation, Characterization and Properties of Poly(Propylene Carbonate)/Poly(Methyl Methacrylate)-Coated Polyethylene Gel Polymer Electrolyte for Lithium-Ion Batteries. J. Electroanal. Chem. 2017, 804, 133–139. [Google Scholar] [CrossRef]
- Cheng, X.; Pan, J.; Zhao, Y.; Liao, M.; Peng, H. Gel Polymer Electrolytes for Electrochemical Energy Storage. Adv. Energy Mater. 2018, 8, 1702184. [Google Scholar] [CrossRef]
- Wang, S.H.; Kuo, P.L.; Hsieh, C.T.; Teng, H. Design of Poly(Acrylonitrile)-Based Gel Electrolytes for High-Performance Lithium Ion Batteries. ACS Appl. Mater. Interfaces 2014, 6, 19360–19370. [Google Scholar] [CrossRef] [PubMed]
- Gao, H.; Xue, L.; Xin, S.; Goodenough, J.B. A High-Energy-Density Potassium Battery with a Polymer-Gel Electrolyte and a Polyaniline Cathode. Angew. Chem. 2018, 130, 5547–5551. [Google Scholar] [CrossRef]
- Shen, X.; Xu, W.; Xu, J.; Liang, G.; Yang, H.; Yao, M. Quasi-Solid-State Dye-Sensitized Solar Cells Based on Gel Electrolytes Containing Different Alkali Metal Iodide Salts. Solid State Ion. 2008, 179, 2027–2030. [Google Scholar] [CrossRef]
- Saito, Y.; Kataoka, H.; Quartarone, E.; Mustarelli, P. Carrier Migration Mechanism of Physically Cross-Linked Polymer Gel Electrolytes Based on PVDF Membranes. J. Phys. Chem. B 2002, 106, 7200–7204. [Google Scholar] [CrossRef]
- Abbrent, S.; Plestil, J.; Hlavata, D.; Lindgren, J.; Tegenfeldt, J.; Wendsjö, Å. Crystallinity and Morphology of PVdF-HFP-Based Gel Electrolytes. Polymer 2001, 42, 1407–1416. [Google Scholar] [CrossRef]
- Wang, X.; Xiao, C.; Liu, H.; Huang, Q.; Fu, H. Fabrication and Properties of PVDF and PVDF-HFP Microfiltration Membranes. J. Appl. Polym. Sci. 2018, 135, 46711. [Google Scholar] [CrossRef]
- Wang, X.; Xiao, C.; Liu, H.; Huang, Q.; Hao, J.; Fu, H. Poly(Vinylidene Fluoride-Hexafluoropropylene) Porous Membrane with Controllable Structure and Applications in Efficient Oil/Water Separation. Materials 2018, 11, 443. [Google Scholar] [CrossRef]
- Jie, J.; Liu, Y.; Cong, L.; Zhang, B.; Lu, W.; Zhang, X.; Liu, J.; Xie, H.; Sun, L. High-Performance PVDF-HFP Based Gel Polymer Electrolyte with a Safe Solvent in Li Metal Polymer Battery. J. Energy Chem. 2020, 49, 80–88. [Google Scholar] [CrossRef]
- Samberg, J.P.; Carlin, C.Z.; El-Masry, N.A.; Bradshaw, G.K.; Colter, P.C.; Harmon, J.; Bedair, S.M.; Hauser, J.R. Characterization of Strained Layer Superlattice Solar Cells by X-Ray Diffraction and Current-Voltage Measurements. Mater. Res. Soc. Symp. Proc. 2010, 1211, 103–108. [Google Scholar] [CrossRef]
- Tang, S.B.; Lai, M.O.; Lu, L. Li-Ion Diffusion in Highly (0 0 3) Oriented LiCoO2 Thin Film Cathode Prepared by Pulsed Laser Deposition. J. Alloys Compd. 2008, 449, 300–303. [Google Scholar] [CrossRef]
- Ding, N.; Xu, J.; Yao, Y.X.; Wegner, G.; Fang, X.; Chen, C.H.; Lieberwirth, I. Determination of the Diffusion Coefficient of Lithium Ions in Nano-Si. Solid State Ion. 2009, 180, 222–225. [Google Scholar] [CrossRef]
- Rui, X.H.; Yesibolati, N.; Li, S.R.; Yuan, C.C.; Chen, C.H. Determination of the Chemical Diffusion Coefficient of Li+ in Intercalation-Type Li3V2(PO4)3 Anode Material. Solid State Ion. 2011, 187, 58–63. [Google Scholar] [CrossRef]
- Grewal, M.S.; Kisu, K.; Orimo, S.I.; Yabu, H. Increasing the Ionic Conductivity and Lithium-Ion Transport of Photo-Cross-Linked Polymer with Hexagonal Arranged Porous Film Hybrids. iScience 2022, 25, 104910. [Google Scholar] [CrossRef] [PubMed]
- Nguyen, T.Q.; Breitkopf, C. Determination of Diffusion Coefficients Using Impedance Spectroscopy Data. J. Electrochem. Soc. 2018, 165, E826–E831. [Google Scholar] [CrossRef]
- Zhao, C.; Zhang, X.; He, Z.; Guan, Q.; Li, W. Demystifying the Mechanism of NMP Ligands in Promoting Cu-Catalyzed Acetylene Hydrochlorination: Insights from a Density Functional Theory Study. Inorg. Chem. Front. 2020, 7, 3204–3216. [Google Scholar] [CrossRef]
- Luo, R.; Li, H.; Du, B.; Zhou, S.; Chen, Y. A Printed and Flexible NO2 Sensor Based on a Solid Polymer Electrolyte. Front. Chem. 2019, 7, 286. [Google Scholar] [CrossRef]
- Daneshkhah, A.; Shrestha, S.; Siegel, A.; Varahramyan, K.; Agarwal, M. Cross-Selectivity Enhancement of Poly(Vinylidene Fluoride-Hexafluoropropylene)-Based Sensor Arrays for Detecting Acetone and Ethanol. Sensors 2017, 17, 595. [Google Scholar] [CrossRef]
- Simoes, R.D.; Rodriguez-Perez, M.A.; De Saja, J.A.; Constantino, C.J.L. Thermomechanical Characterization of PVDF and P(VDF-TrFE) Blends Containing Corn Starch and Natural Rubber. J. Therm. Anal. Calorim. 2009, 99, 621–629. [Google Scholar] [CrossRef]
- Wu, Z.; Ran, R.; Ma, Y.; Wu, X.; Si, Z.; Weng, D. Quantitative Control and Identification of Copper Species in Cu–SAPO-34: A Combined UV–Vis Spectroscopic and H2-TPR Analysis. Res. Chem. Intermed. 2019, 45, 1309–1325. [Google Scholar] [CrossRef]
- Kumari, N.; Bahadur, V.; Butcher, R.J.; Kumbhar, A.A. Synthesis, Characterization and Single Crystal X-Ray Structures of Trifluroacetylacetonate Copper(II) Complexes. J. Chem. Crystallogr. 2022, 52, 525–533. [Google Scholar] [CrossRef]
- Czekański, Ł.; Hoffmann, S.K.; Barczyński, P.; Gąsowska, A.; Bregier-Jarzebowska, R.; Zalewska, A.; Goslar, J.; Ratajczak-Sitarz, M.; Katrusiak, A. Crystal Structure and Physical Properties of 1-Methyl-3-(Carboxymethyl)Benzimidazolium Betaine·CuBr2 in Crystal and Water Solution. New J. Chem. 2016, 40, 10526–10535. [Google Scholar] [CrossRef]
- Salih, K.S.M.; Shraim, A.M.; Al-Mhini, S.R.; Al-Soufi, R.E.; Warad, I. New Tetradentate Schiff Base Cu(II) Complexes: Synthesis, Physicochemical, Chromotropism, Fluorescence, Thermal, and Selective Catalytic Oxidation. Emergent Mater. 2021, 4, 423–434. [Google Scholar] [CrossRef]
- Matsushita, S.; Sugawara, S.; Isobe, T.; Nakajima, A. Temperature Dependence of a Perovskite-Sensitized Solar Cell: A Sensitized “Thermal” Cell. ACS Appl. Energy Mater. 2019, 2, 13–18. [Google Scholar] [CrossRef]
- Kataoka, H.; Saito, Y.; Sakai, T.; Quartarone, E.; Mustarelli, P. Conduction Mechanisms of PVDF-Type Gel Polymer Electrolytes of Lithium Prepared by a Phase Inversion Process. J. Phys. Chem. B 2000, 104, 11460–11464. [Google Scholar] [CrossRef]
- Kohata, H.; Mei, B.; Wang, Y.; Mizukoshi, K.; Isobe, T.; Nakajima, A.; Matsushita, S. Electrolyte Thickness Dependence upon Ge-Sensitized Thermal Cells. Energy Fuels 2022, 36, 11619–11626. [Google Scholar] [CrossRef]


| Gelation Temperature (°C) | σ (×10−2, cm−1 Ω−1) | D (×10−12, m2 s−1) | W (×10−2, s) | l (μm) |
|---|---|---|---|---|
| 35 | 1.73 | 7.61 | 1.80 | 0.37 |
| 40 | 1.72 | 5.31 | 0.49 | 0.16 |
| 45 | 1.68 | 7.82 | 0.24 | 0.14 |
Disclaimer/Publisher’s Note: The statements, opinions and data contained in all publications are solely those of the individual author(s) and contributor(s) and not of MDPI and/or the editor(s). MDPI and/or the editor(s) disclaim responsibility for any injury to people or property resulting from any ideas, methods, instructions or products referred to in the content. |
© 2024 by the authors. Licensee MDPI, Basel, Switzerland. This article is an open access article distributed under the terms and conditions of the Creative Commons Attribution (CC BY) license (https://creativecommons.org/licenses/by/4.0/).
Share and Cite
Chai, Y.; Matsushita, S. Preparation and Evaluation of PVDF-HFP-Based Gel Electrolyte for Ge-Sensitized Thermal Cell. Polymers 2024, 16, 1732. https://doi.org/10.3390/polym16121732
Chai Y, Matsushita S. Preparation and Evaluation of PVDF-HFP-Based Gel Electrolyte for Ge-Sensitized Thermal Cell. Polymers. 2024; 16(12):1732. https://doi.org/10.3390/polym16121732
Chicago/Turabian StyleChai, Yadong, and Sachiko Matsushita. 2024. "Preparation and Evaluation of PVDF-HFP-Based Gel Electrolyte for Ge-Sensitized Thermal Cell" Polymers 16, no. 12: 1732. https://doi.org/10.3390/polym16121732