
Sound Absorption Performance of Ultralight Honeycomb Sandwich Panels Filled with “Network” Fibers—Juncus effusus


Abstract
1. Introduction
2. Materials and Methods
2.1. Materials
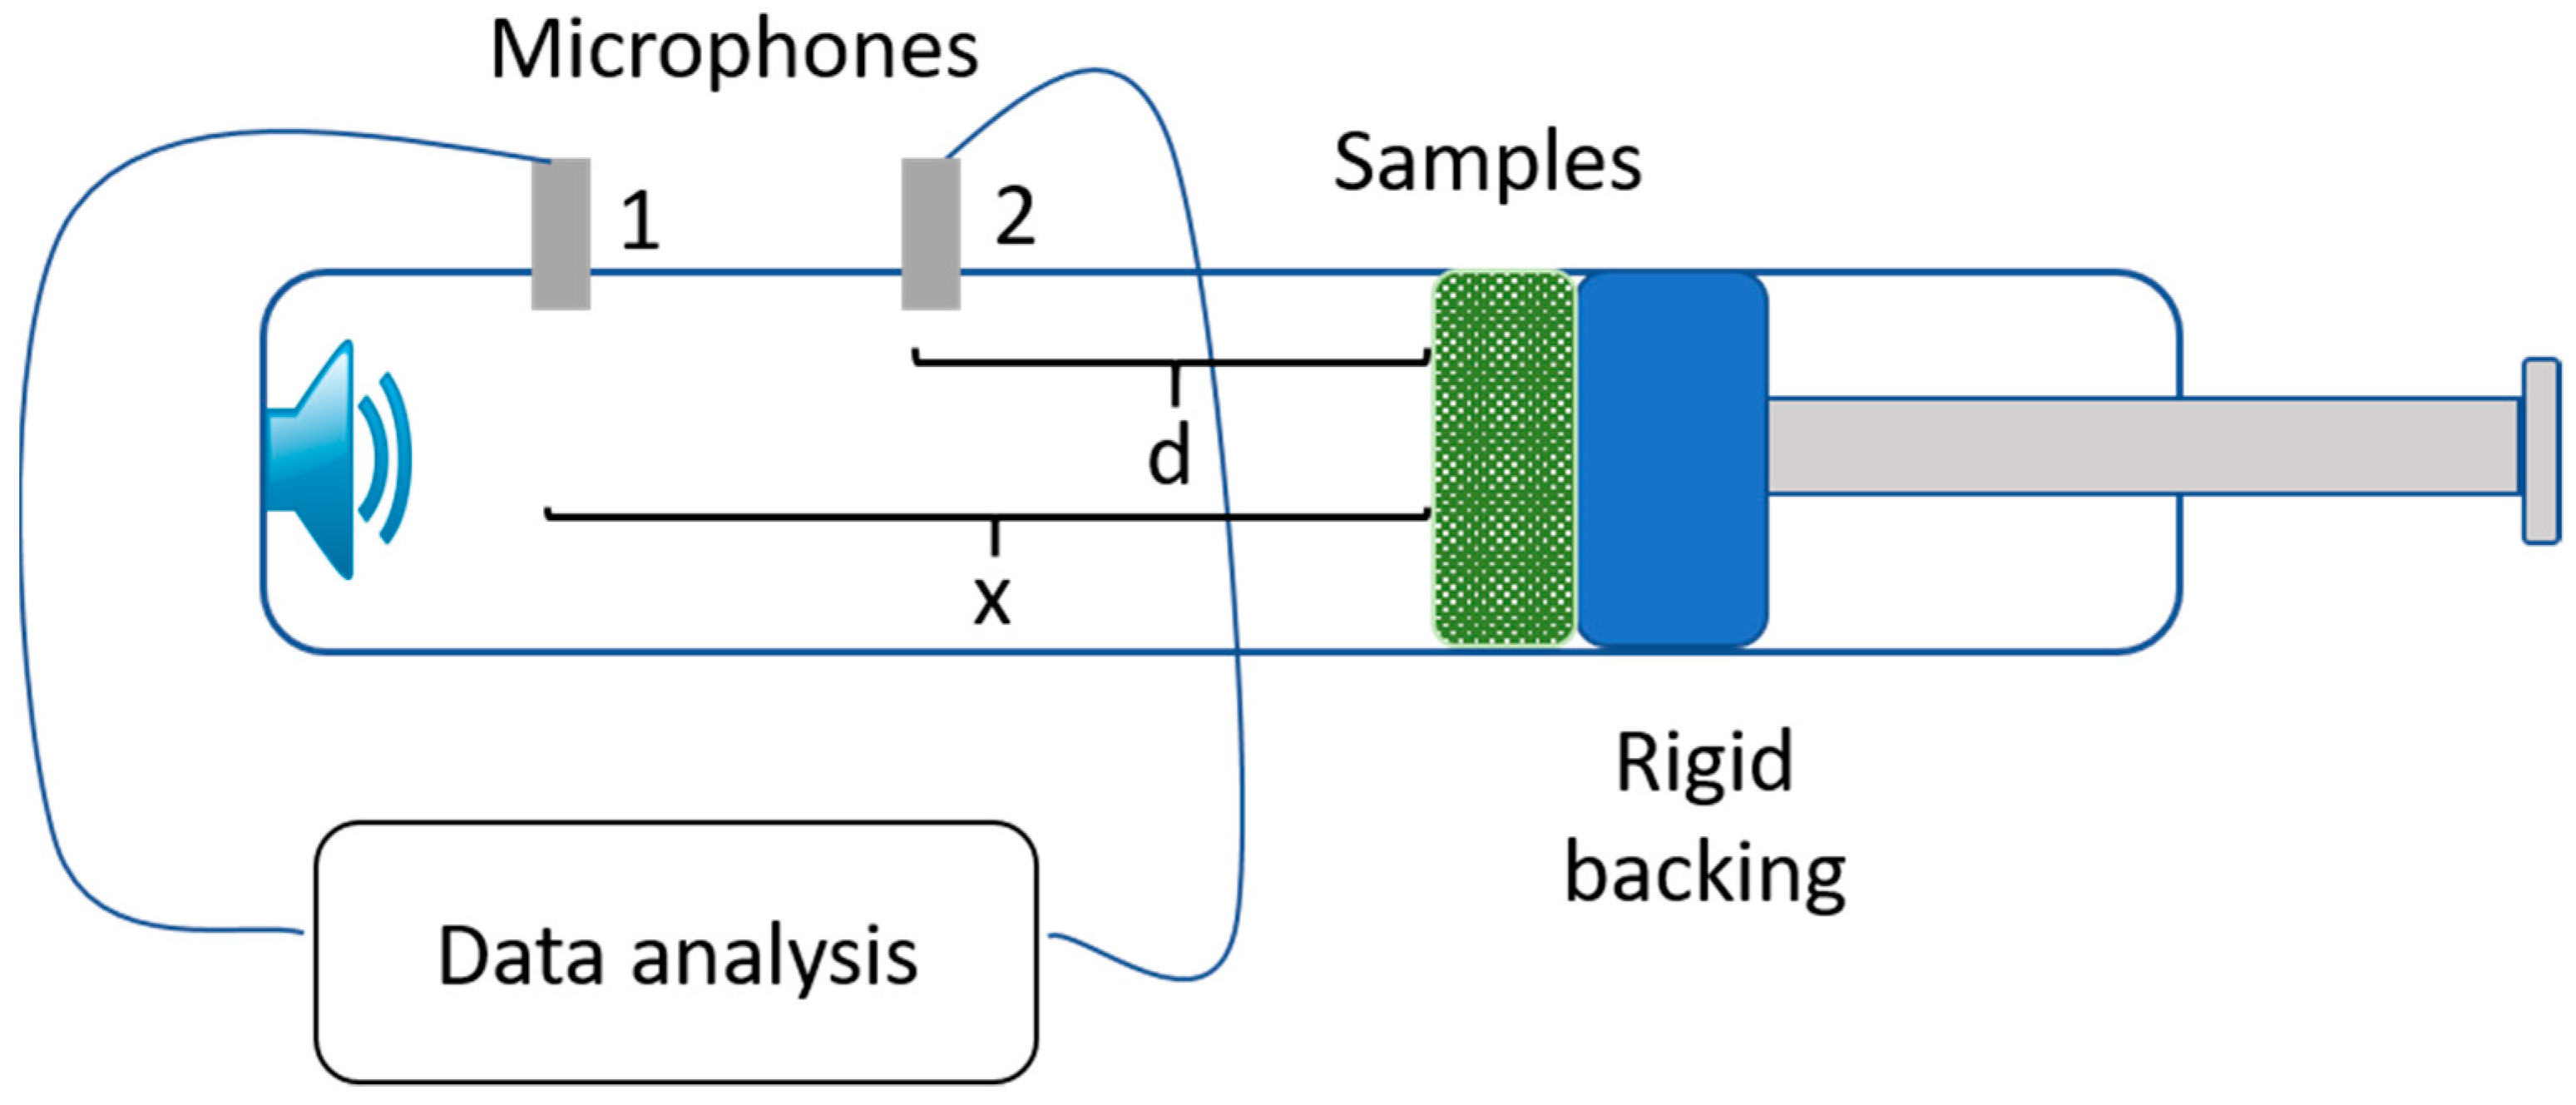
2.2. Characteristics and the Sound Absorption Experiment
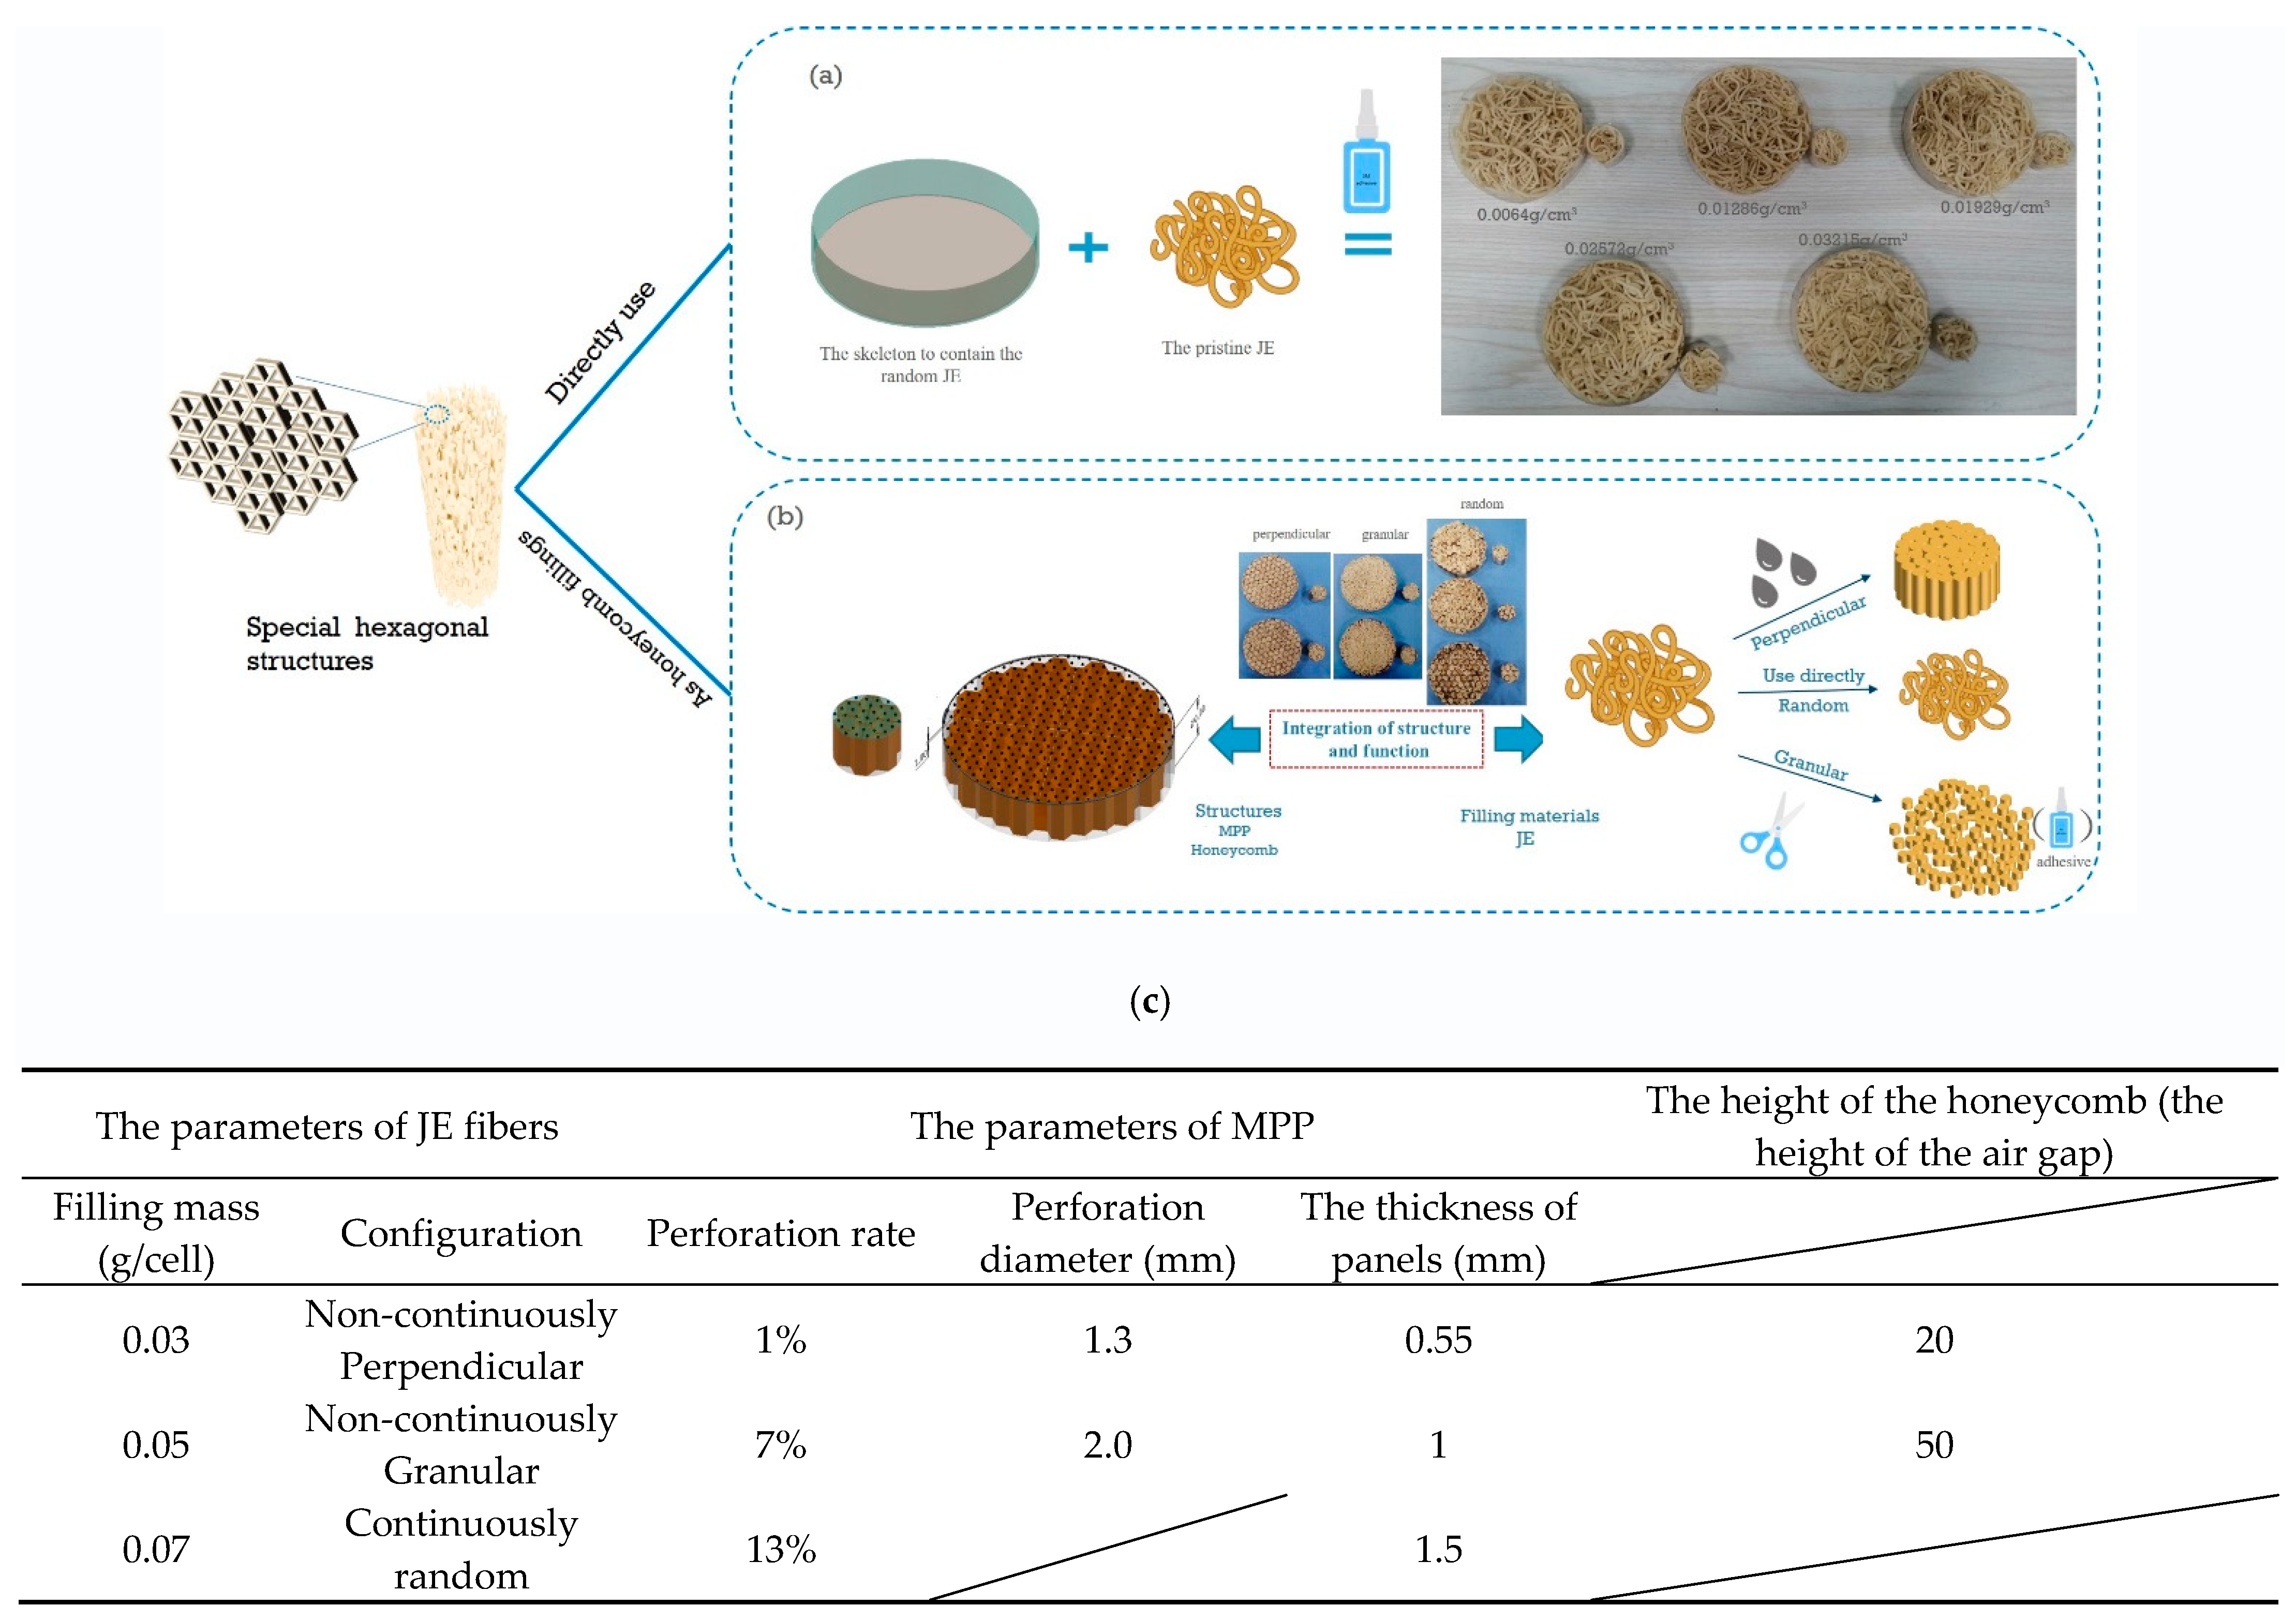
2.3. Manufacturing of the Acoustic Absorption Sample
2.4. The Calculation of Porosity
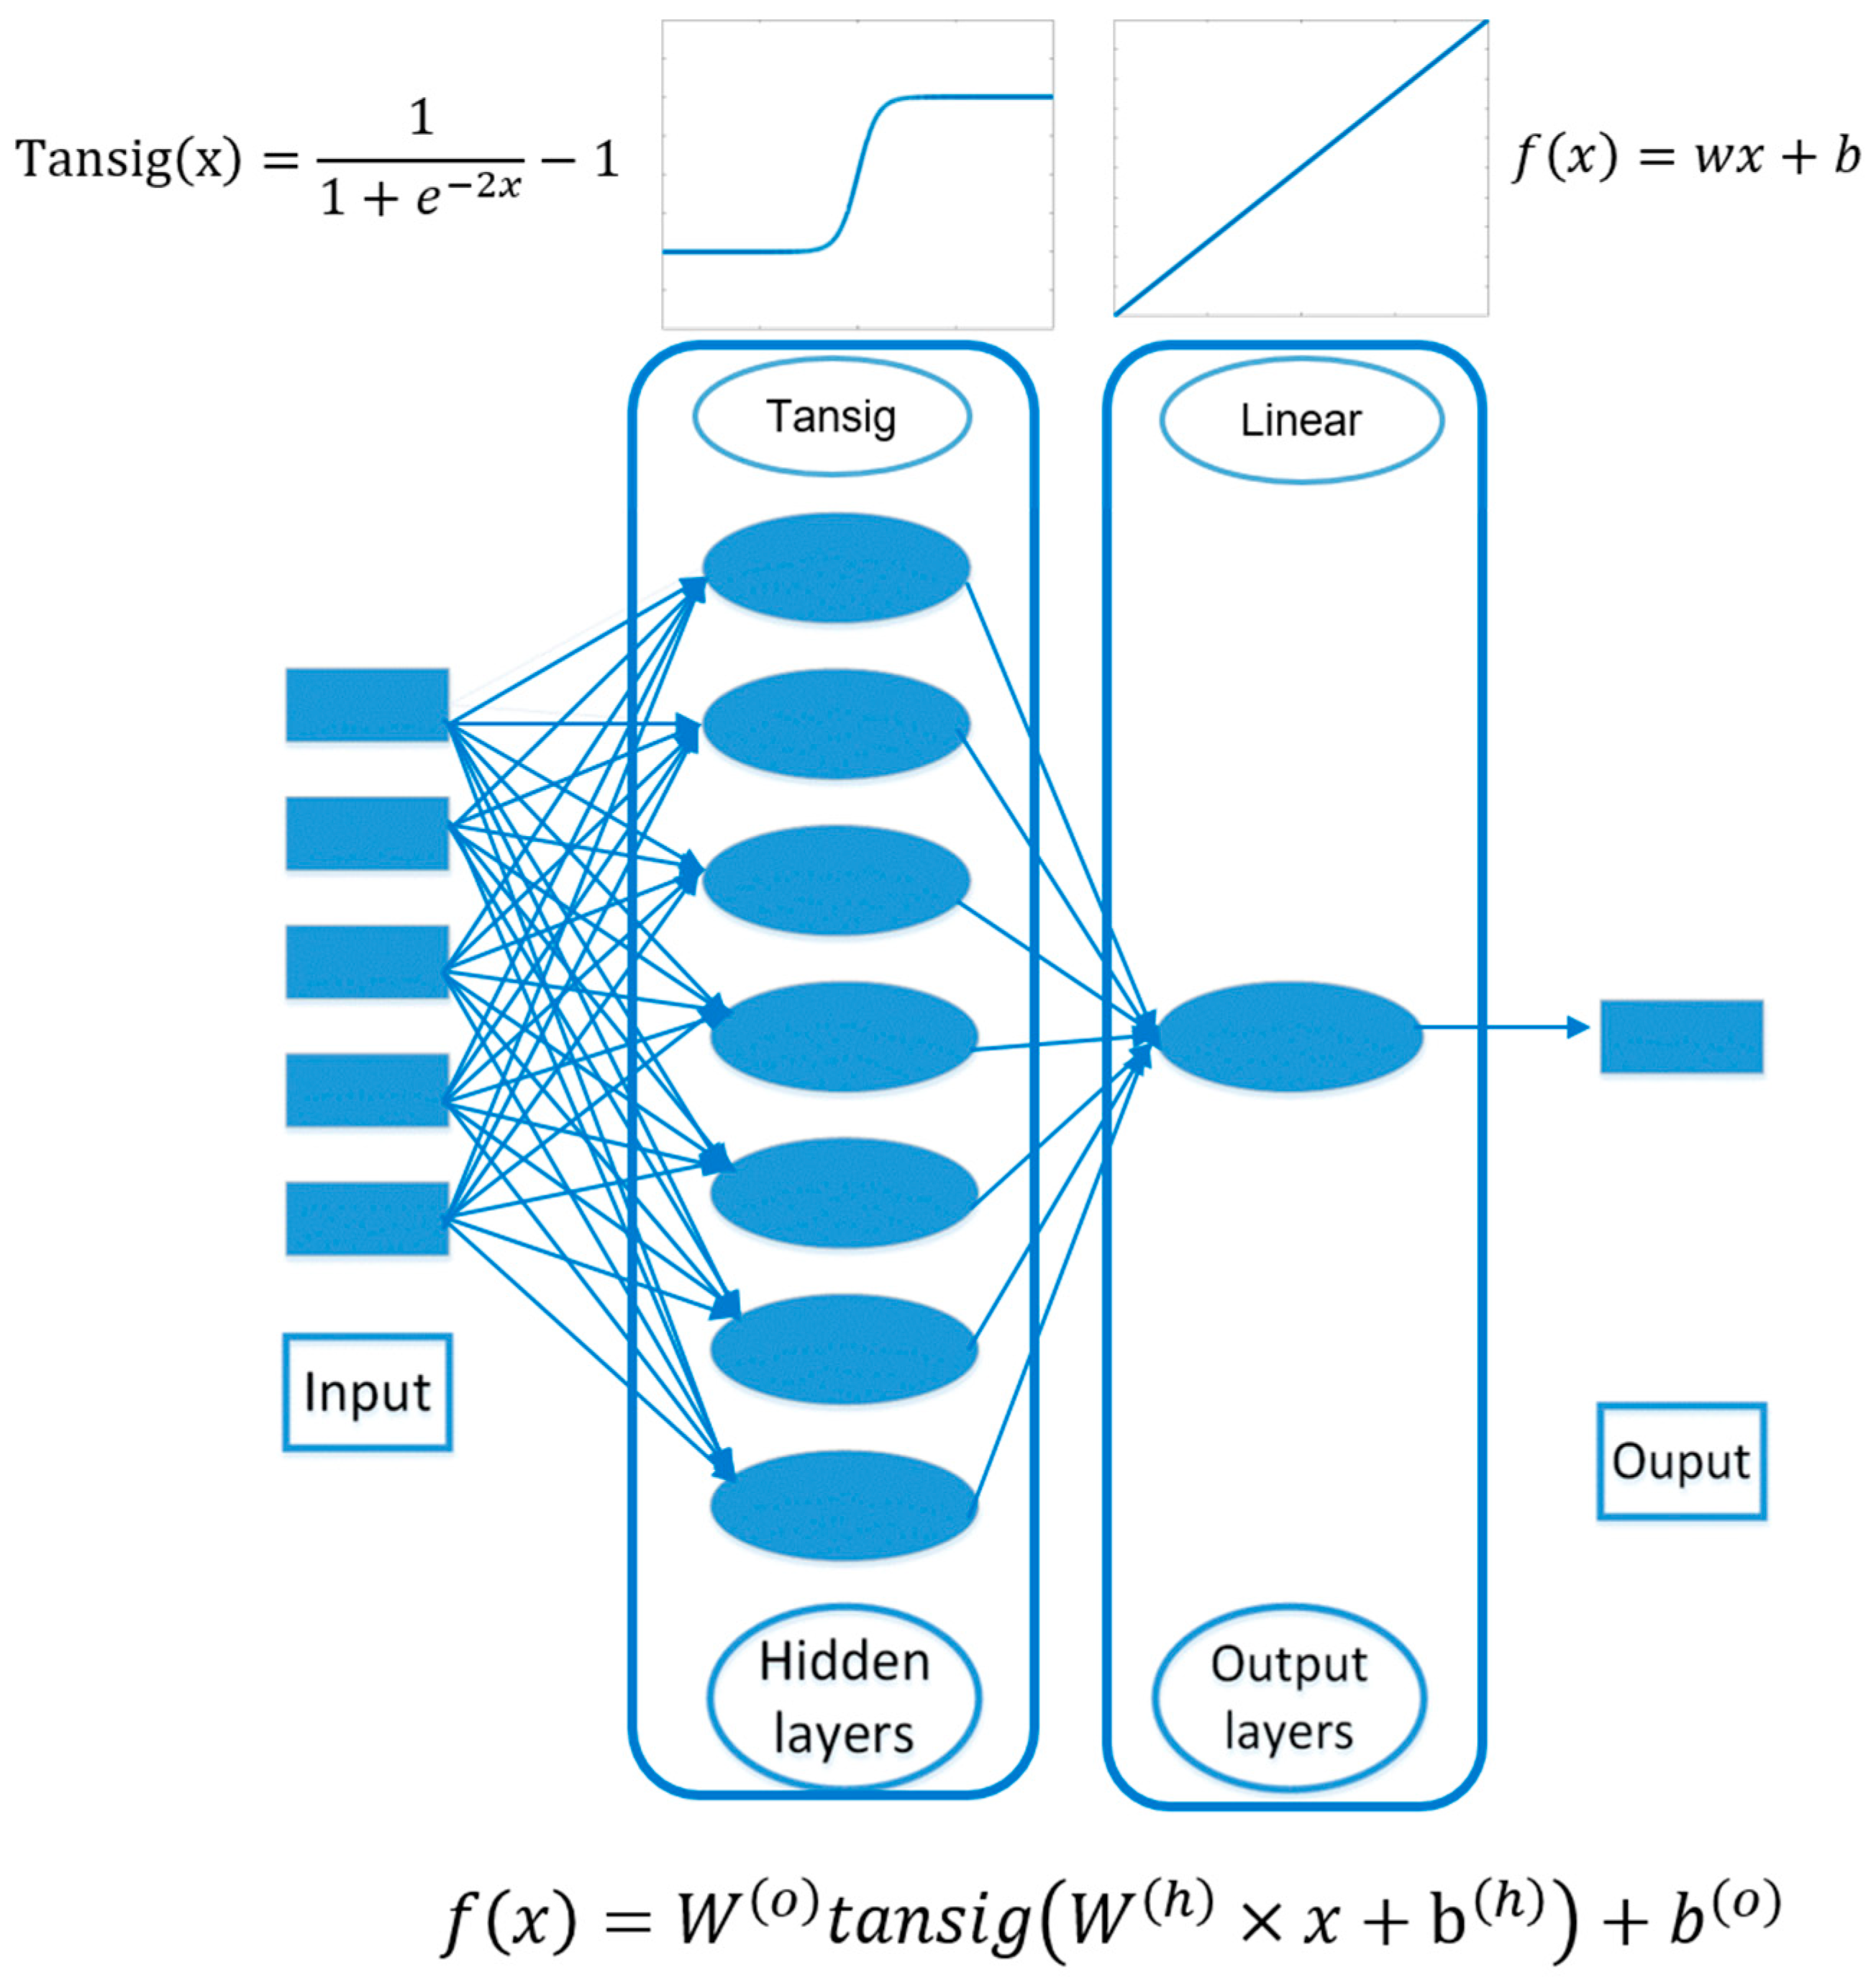
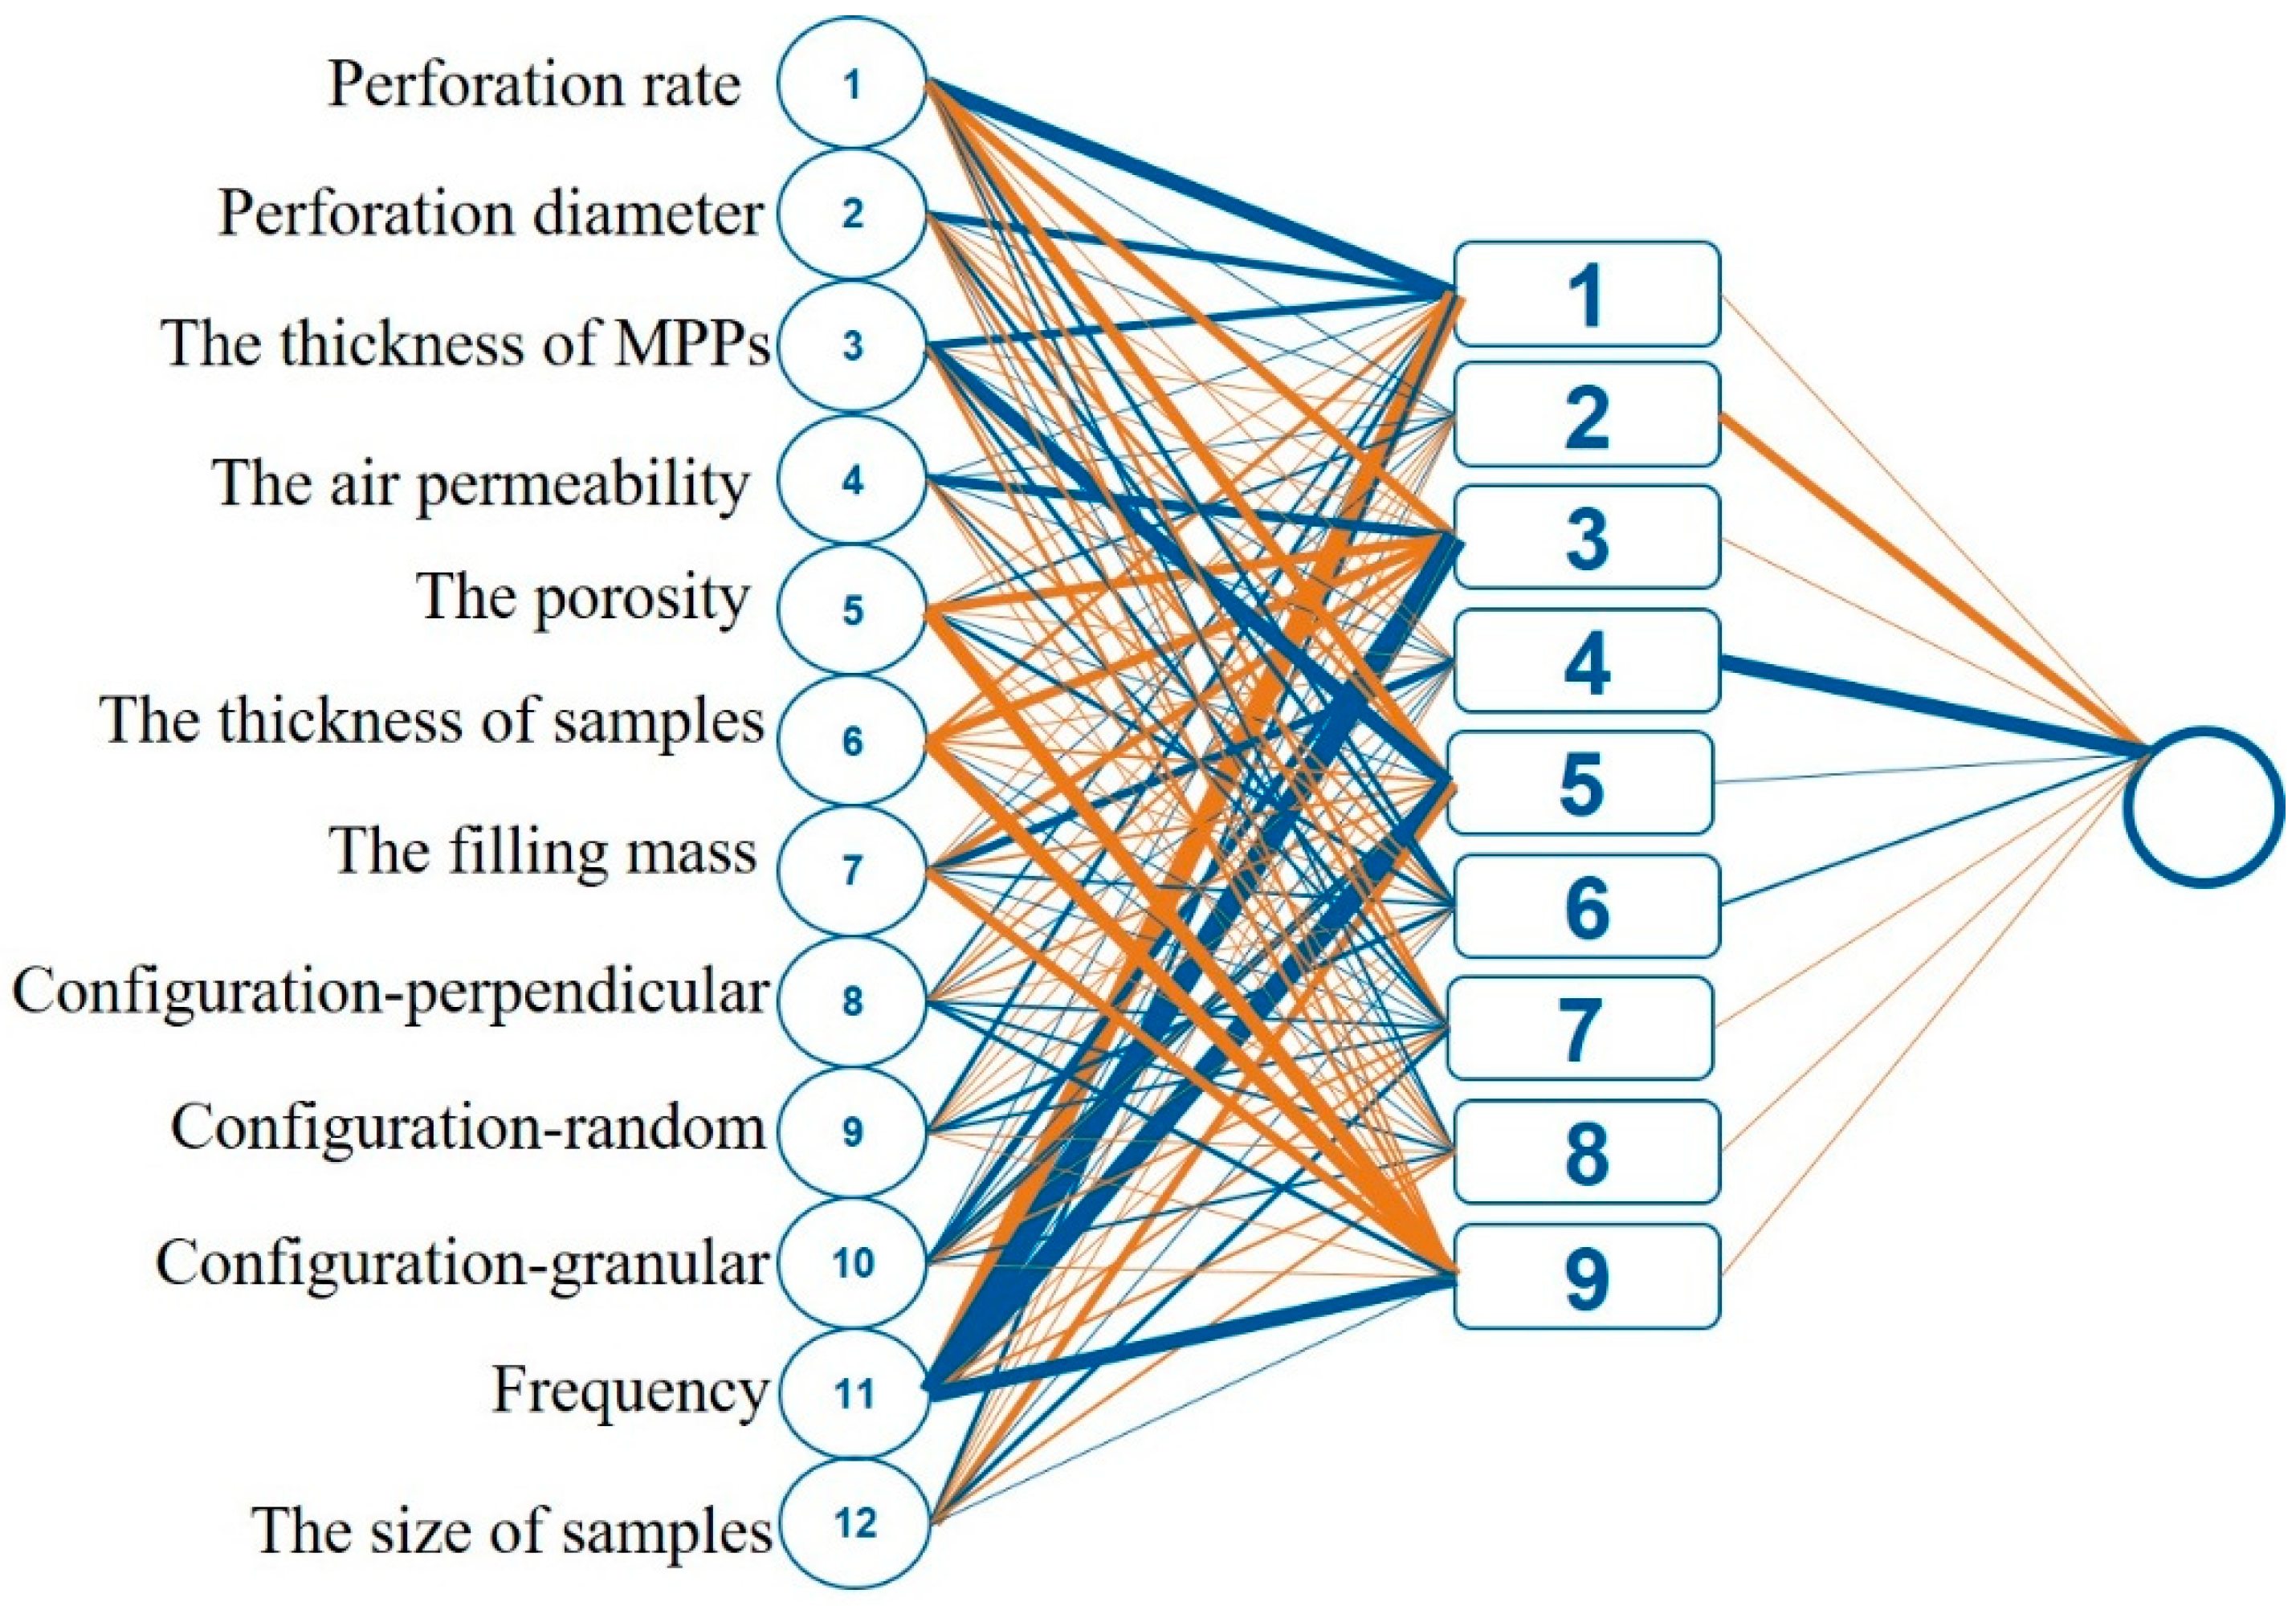
2.5. Artificial Neural Network Model
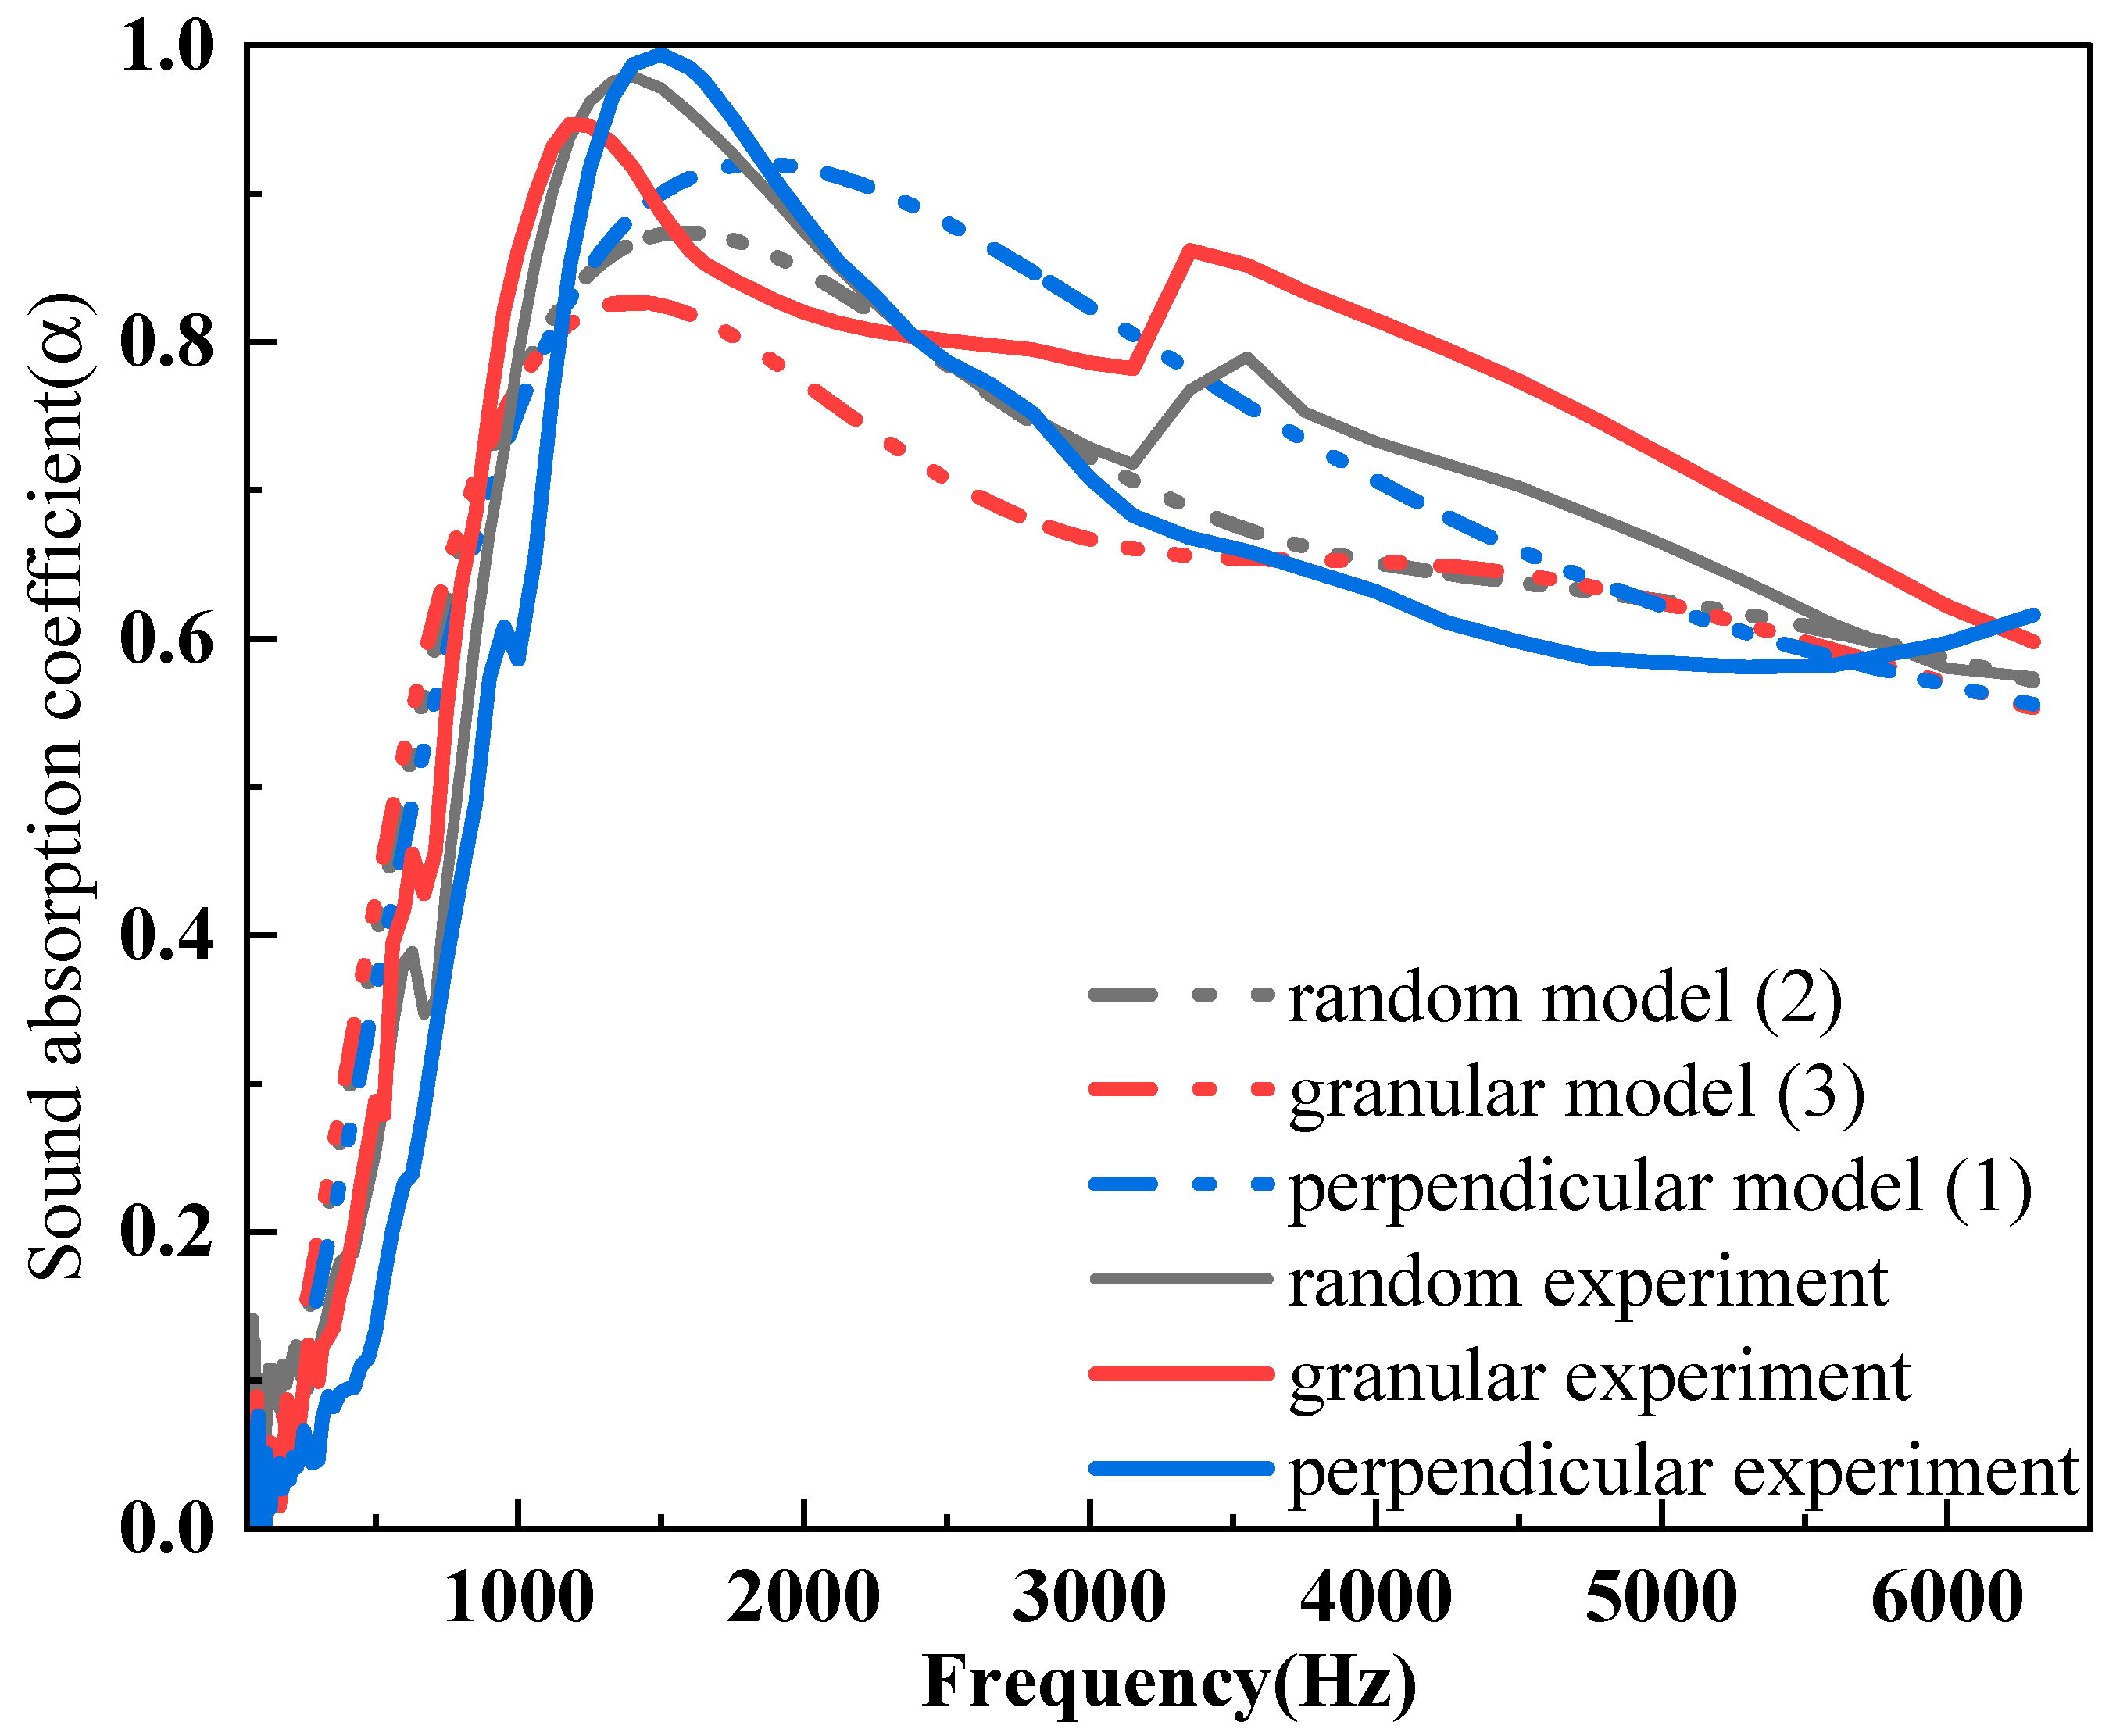
2.6. Analytical Model
2.7. Sound Absorption Peak Prediction
2.8. The Calculation of the Average Sound Absorption Coefficient and Noise Reduction Coefficient
3. Results and Discussion
4. Conclusions
Supplementary Materials
Author Contributions
Funding
Institutional Review Board Statement
Data Availability Statement
Conflicts of Interest
References
- Asdrubali, F.; D’Alessandro, F.; Schiavoni, S. A review of unconventional sustainable building insulation materials. Sustain. Mater. Technol. 2015, 4, 1–17. [Google Scholar] [CrossRef]
- Hill, C.; Norton, A.; Dibdiakova, J. A comparison of the environmental impacts of different categories of insulation materials. Energy Build. 2018, 162, 12–20. [Google Scholar] [CrossRef]
- Zhao, X.; Liu, Y.; Zhao, L.; Yazdkhasti, A.; Mao, Y.; Siciliano, A.P.; Dai, J.; Jing, S.; Xie, H.; Li, Z.; et al. A scalable high-porosity wood for sound absorption and thermal insulation. Nat. Sustain. 2023, 6, 306–315. [Google Scholar] [CrossRef]
- Taban, E.; Mirzaei, R.; Faridan, M.; Samaei, E.; Salimi, F.; Tajpoor, A.; Ghalenoei, M. Morphological, acoustical, mechanical and thermal properties of sustainable green Yucca (Y. gloriosa) fibers: An exploratory investigation. J. Environ. Health Sci. Eng. 2020, 18, 883–889. [Google Scholar] [CrossRef] [PubMed]
- Fattahi, M.; Taban, E.; Soltani, P.; Berardi, U.; Khavanin, A.; Zaroushani, V. Waste corn husk fibers for sound absorption and thermal insulation applications: A step towards sustainable buildings. J. Build. Eng. 2023, 77, 107468. [Google Scholar] [CrossRef]
- Ehsan Samaei, S.; Berardi, U.; Asilian Mahabadi, H.; Soltani, P.; Taban, E. Optimization and modeling of the sound absorption behavior of polyurethane composite foams reinforced with kenaf fiber. Appl. Acoust. 2023, 202, 109176. [Google Scholar] [CrossRef]
- Yang, T.; Hu, L.; Xiong, X.; Petrů, M.; Noman, M.T.; Mishra, R.; Militký, J. Sound absorption properties of natural fibers: A review. Sustainability 2020, 12, 8477. [Google Scholar] [CrossRef]
- Malakooti, S.; Vivod, S.L.; Pereira, M.; Ruggeri, C.R.; Revilock, D.M.; Scheiman, D.A.; Guo, H.; Salem, J.A.; Benafan, O.; Johnston, J.C.; et al. Fabric reinforced polyimide aerogel matrix composites with low thermal conductivity, high flexural strength, and high sound absorption coefficient. Compos. Part B Eng. 2023, 260, 110751. [Google Scholar] [CrossRef]
- Sukontasukkul, P.; Tontiwattanakul, K.; Puttiwongrak, A.; Zhang, H.; Parichatprecha, R.; Suksiripattanapong, C.; Phoo-ngernkham, T.; Imjai, T.; Chindaprasirt, P. Use of viscoelastic polymer sheet as an acoustic control treatment in ceramic tiles to improve sound insertion loss. Results Eng. 2023, 17, 100897. [Google Scholar] [CrossRef]
- Tiuc, A.E.; Nemeş, O.; Vermeşan, H.; Toma, A.C. New sound absorbent composite materials based on sawdust and polyurethane foam. Compos. Part B Eng. 2019, 165, 120–130. [Google Scholar] [CrossRef]
- Berardi, U.; Iannace, G. Acoustic characterization of natural fibers for sound absorption applications. Build. Environ. 2015, 94, 840–852. [Google Scholar] [CrossRef]
- Putra, A.; Or, K.H.; Selamat, M.Z.; Nor, M.J.M.; Hassan, M.H.; Prasetiyo, I. Sound absorption of extracted pineapple-leaf fibres. Appl. Acoust. 2018, 136, 9–15. [Google Scholar] [CrossRef]
- Samael, S.E.; Berardi, U.; Taban, E.; Soltani, P.; Mousavi, S.M. Natural fibro-granular composite as a novel sustainable sound-absorbing material. Appl. Acoust. 2021, 181, 108157. [Google Scholar]
- Fu, Z.; Zhou, S.; Xia, L.; Mao, Y.; Zhu, L.; Cheng, Y.; Wang, A.; Zhang, C.; Xu, W. Juncus effusus fiber-based cellulose cigarette filter with 3D hierarchically porous structure for removal of PAHs from mainstream smoke. Carbohydr. Polym. 2020, 241, 116308. [Google Scholar] [CrossRef] [PubMed]
- Zhang, J.; Xia, L.; Fu, Z.; Sun, X.; Zhou, S.; Liu, X.; Zhang, C.; Xu, W. Fabrication of polyurethane porous composite films using biomass-based Juncus effusus fibers for oil removal from water. Ind. Crops Prod. 2022, 176, 114290. [Google Scholar] [CrossRef]
- Ren, L.; Zhao, G.; Pan, L.; Chen, B.; Chen, Y.; Zhang, Q.; Xiao, X.; Xu, W. Efficient Removal of Dye from Wastewater without Selectivity Using Activated Carbon-Juncus effusus Porous Fibril Composites. ACS Appl. Mater Interfaces 2021, 13, 19176–19186. [Google Scholar] [CrossRef]
- Xia, T.; Wu, W.; Zhao, J.; Li, Q.; Ao, C.; Zhang, J.; Wang, Q.; Zhang, W.; Lu, C. A highly porous fiber electrode derived from Juncus effusus and its shape recovery and electrochemical capacitive properties. Mater. Today Energy 2020, 17, 100430. [Google Scholar] [CrossRef]
- Ge, Y.; Xue, J.; Liu, L.; Wan, H.; Yang, Y. Advances in multiple assembly acoustic structural design strategies for honeycomb composites: A review. Mater. Today Commun. 2024, 38, 108013. [Google Scholar] [CrossRef]
- Luu, H.T.; Perrot, C.; Panneton, R. Influence of Porosity, Fiber Radius and Fiber Orientation on the Transport and Acoustic Properties of Random Fiber Structures. Acta Acust. United Acust. 2017, 103, 1050–1063. [Google Scholar] [CrossRef]
- Yang, Y.; Li, B.; Chen, Z.; Sui, N.; Chen, Z.; Saeed, M.-U.; Li, Y.; Fu, R.; Wu, C.; Jing, Y. Acoustic properties of glass fiber assembly-filled honeycomb sandwich panels. Compos. Part B: Eng. 2016, 96, 281–286. [Google Scholar] [CrossRef]
- Xie, S.; Yang, S.; Yang, C.; Wang, D. Sound absorption performance of a filled honeycomb composite structure. Appl. Acoust. 2020, 162, 107202. [Google Scholar] [CrossRef]
- Liu, Z.; Dong, C.; Tong, L.; Rudd, C.; Liu, X.; Yi, X. A pre-screening study of honeycomb sandwich structure filled with green materials for noise reduction. Compos. Part A Appl. Sci. Manuf. 2022, 163, 107226. [Google Scholar] [CrossRef]
- Morgan, D.; Jacobs, R. Opportunities and Challenges for Machine Learning in Materials Science. Annu. Rev. Mater. Res. 2020, 50, 71–103. [Google Scholar] [CrossRef]
- Kadulkar, S.; Sherman, Z.M.; Ganesan, V.; Truskett, T.M. Machine Learning–Assisted Design of Material Properties. Annu. Rev. Chem. Biomol. Eng. 2022, 13, 235–254. [Google Scholar] [CrossRef] [PubMed]
- Gao, C.; Min, X.; Fang, M.; Tao, T.; Zheng, X.; Liu, Y.; Wu, X.; Huang, Z. Innovative Materials Science via Machine Learning. Adv. Funct. Mater. 2021, 32, 2108044. [Google Scholar] [CrossRef]
- Moosavi, S.M.; Jablonka, K.M.; Smit, B. The Role of Machine Learning in the Understanding and Design of Materials. J. Am. Chem. Soc. 2020, 142, 20273–20287. [Google Scholar] [CrossRef] [PubMed]
- Crandall, I.B. Theory of Vibrating Systems and Sound; D. Van Nostrand Company: New York, NY, USA, 1926. [Google Scholar]
- Maa, D.-Y. Engineering Manual for Noise and Vibration Control; China Machine Press: Beijing, China, 2002; p. 427. [Google Scholar]
- Lim, Z.Y.; Putra, A.; Nor, M.J.M.; Yaakob, M.Y. Sound absorption performance of natural kenaf fibres. Appl. Acoust. 2018, 130, 107–114. [Google Scholar] [CrossRef]
- Cao, L.; Fu, Q.; Si, Y.; Ding, B.; Yu, J. Porous materials for sound absorption. Compos. Commun. 2018, 10, 25–35. [Google Scholar] [CrossRef]
- Zhang, C.; Li, H.; Gong, J.; Chen, J.; Li, Z.; Li, Q.; Cheng, M.; Li, X.; Zhang, J. The review of fiber-based sound-absorbing structures. Text. Res. J. 2022, 93, 434–449. [Google Scholar] [CrossRef]
- Tao, Y.; Ren, M.; Zhang, H.; Peijs, T. Recent progress in acoustic materials and noise control strategies—A review. Appl. Mater. Today 2021, 24, 101141. [Google Scholar] [CrossRef]
- He, W.; Peng, X.; Xin, F.; Lu, T.J. Ultralight micro-perforated sandwich panel with hierarchical honeycomb core for sound absorption. J. Sandw. Struct. Mater. 2022, 24, 201–217. [Google Scholar] [CrossRef]
- Zhang, X.; Wu, J.W.; Mao, Q.B.; Zhou, W.Q.; Xiong, Y. Design of a honeycomb-microperforated panel with an adjustable sound absorption frequency. Appl. Acoust. 2020, 164, 10. [Google Scholar] [CrossRef]
- Yan, S.; Wu, J.; Chen, J.; Xiong, Y.; Mao, Q.; Zhang, X. Optimization design and analysis of honeycomb micro-perforated plate broadband sound absorber. Appl. Acoust. 2022, 186, 108487. [Google Scholar] [CrossRef]
- Caniato, M.; D’Amore, G.K.O.; Kaspar, J.; Gasparella, A. Sound absorption performance of sustainable foam materials: Application of analytical and numerical tools for the optimization of forecasting models. Appl. Acoust. 2020, 161, 107166. [Google Scholar] [CrossRef]
- Chevillotte, F.; Perrot, C. Effect of the three-dimensional microstructure on the sound absorption of foams: A parametric study. J. Acoust. Soc. Am. 2017, 142, 1130–1140. [Google Scholar] [CrossRef]
- Dong, C.; Liu, Z.; Pierce, R.; Liu, X.; Yi, X. Sound absorption performance of amicro perforated sandwich panel with honeycomb-hierarchical porestructure core. Appl. Acoust. 2023, 203, 109200. [Google Scholar] [CrossRef]


| Property | Value |
|---|---|
| Air density, ρ0 (Kg/m3) | 1.295 |
| Atmosphere pressure, P0 (Pa) | 1.01 × 10⁵ |
| Dynamic viscosity of air, η | 1.85 × 10⁻⁵ |
| Specific heat ratio of air, γ | 1.4 |
| Perforation ratio of the perforated plate, p1 | 0.07 |
| Porosity of JE fibers (0.05g/cell), φ | 0.96 |
| Thickness of the micro-perforated plate, t1 (mm) | 1 |
| Thickness of the porous material, l (m) | 0.02 |
| Diameter of the perforation, d2 (mm) | 1.3 |
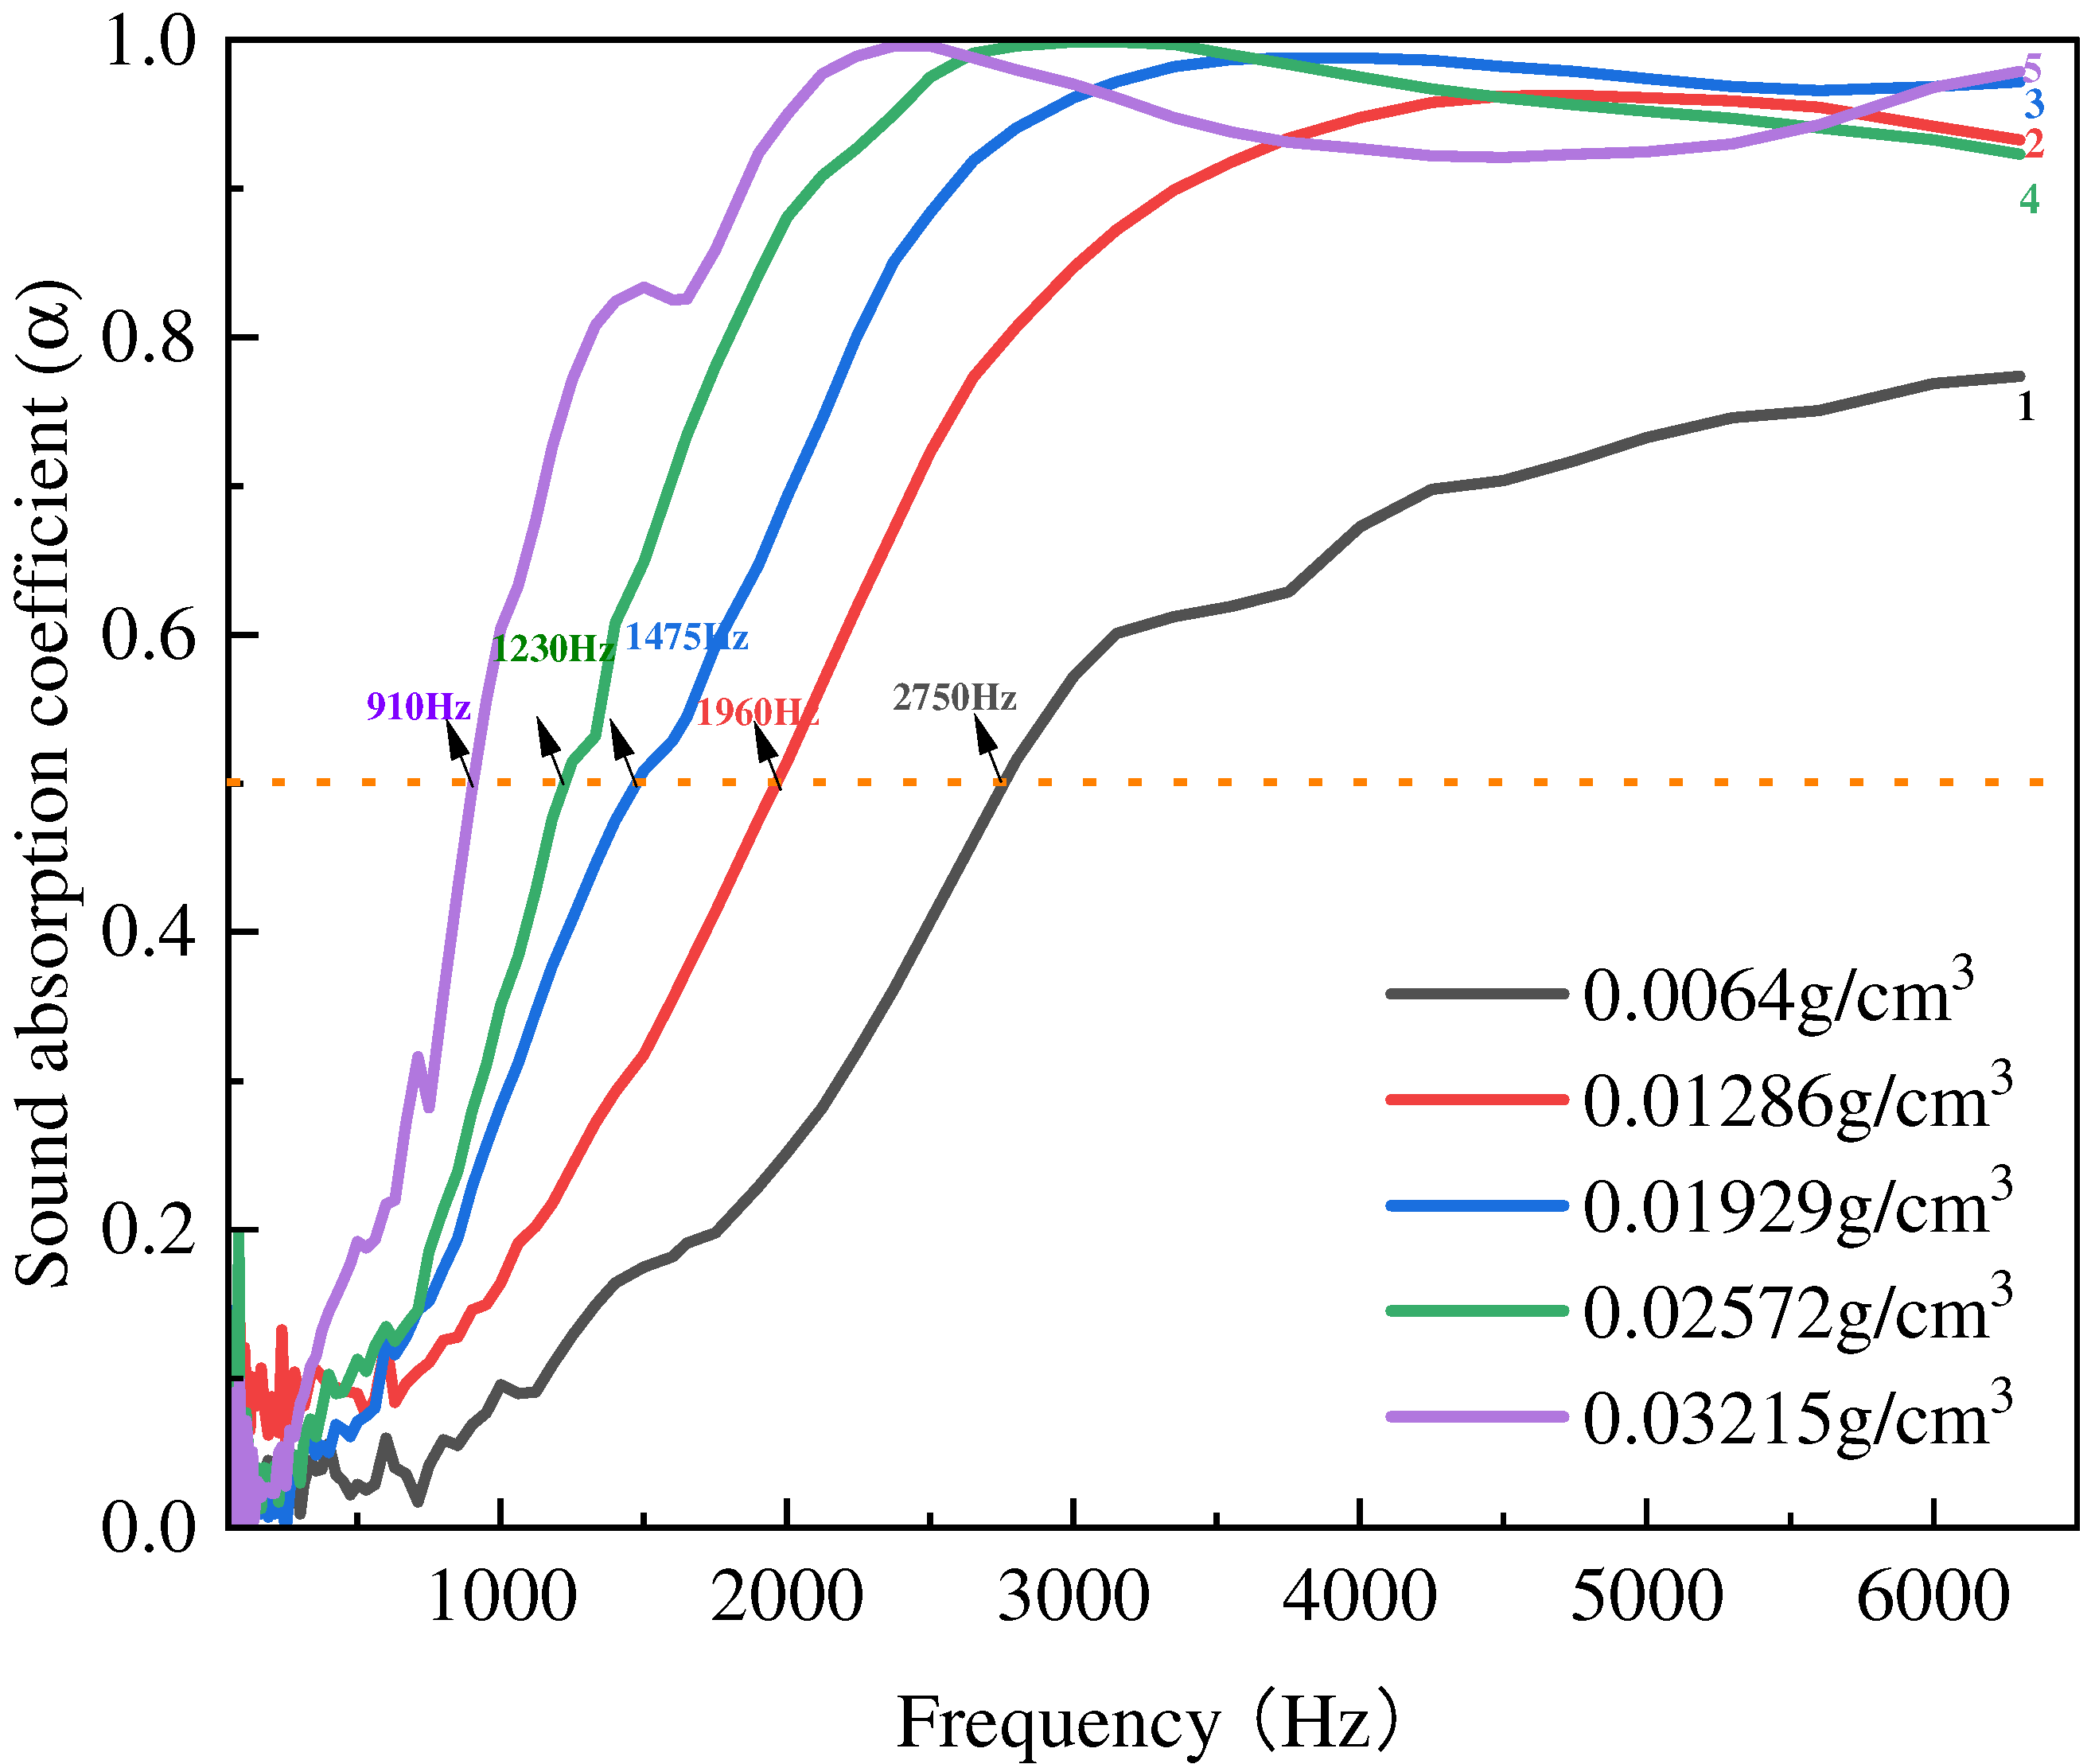
| Filling Density (g/cm3) | Porosity | 125 Hz | 250 Hz | 500 Hz | 1000 Hz | 2000 Hz | 4000 Hz | ASAC | NRC |
|---|---|---|---|---|---|---|---|---|---|
| 0.0064 | 0.98 | 0.02 | 0.026 | 0.029 | 0.096 | 0.252 | 0.673 | 0.122 | 0.10 |
| 0.01286 | 0.96 | 0.065 | 0.054 | 0.09 | 0.164 | 0.515 | 0.948 | 0.306 | 0.20 |
| 0.01929 | 0.95 | 0.04 | 0 | 0.071 | 0.283 | 0.693 | 0.988 | 0.346 | 0.30 |
| 0.02572 | 0.93 | 0.043 | 0.048 | 0.113 | 0.351 | 0.881 | 0.975 | 0.402 | 0.35 |
| 0.03215 | 0.91 | 0 | 0.028 | 0.192 | 0.604 | 0.95 | 0.927 | 0.450 | 0.45 |
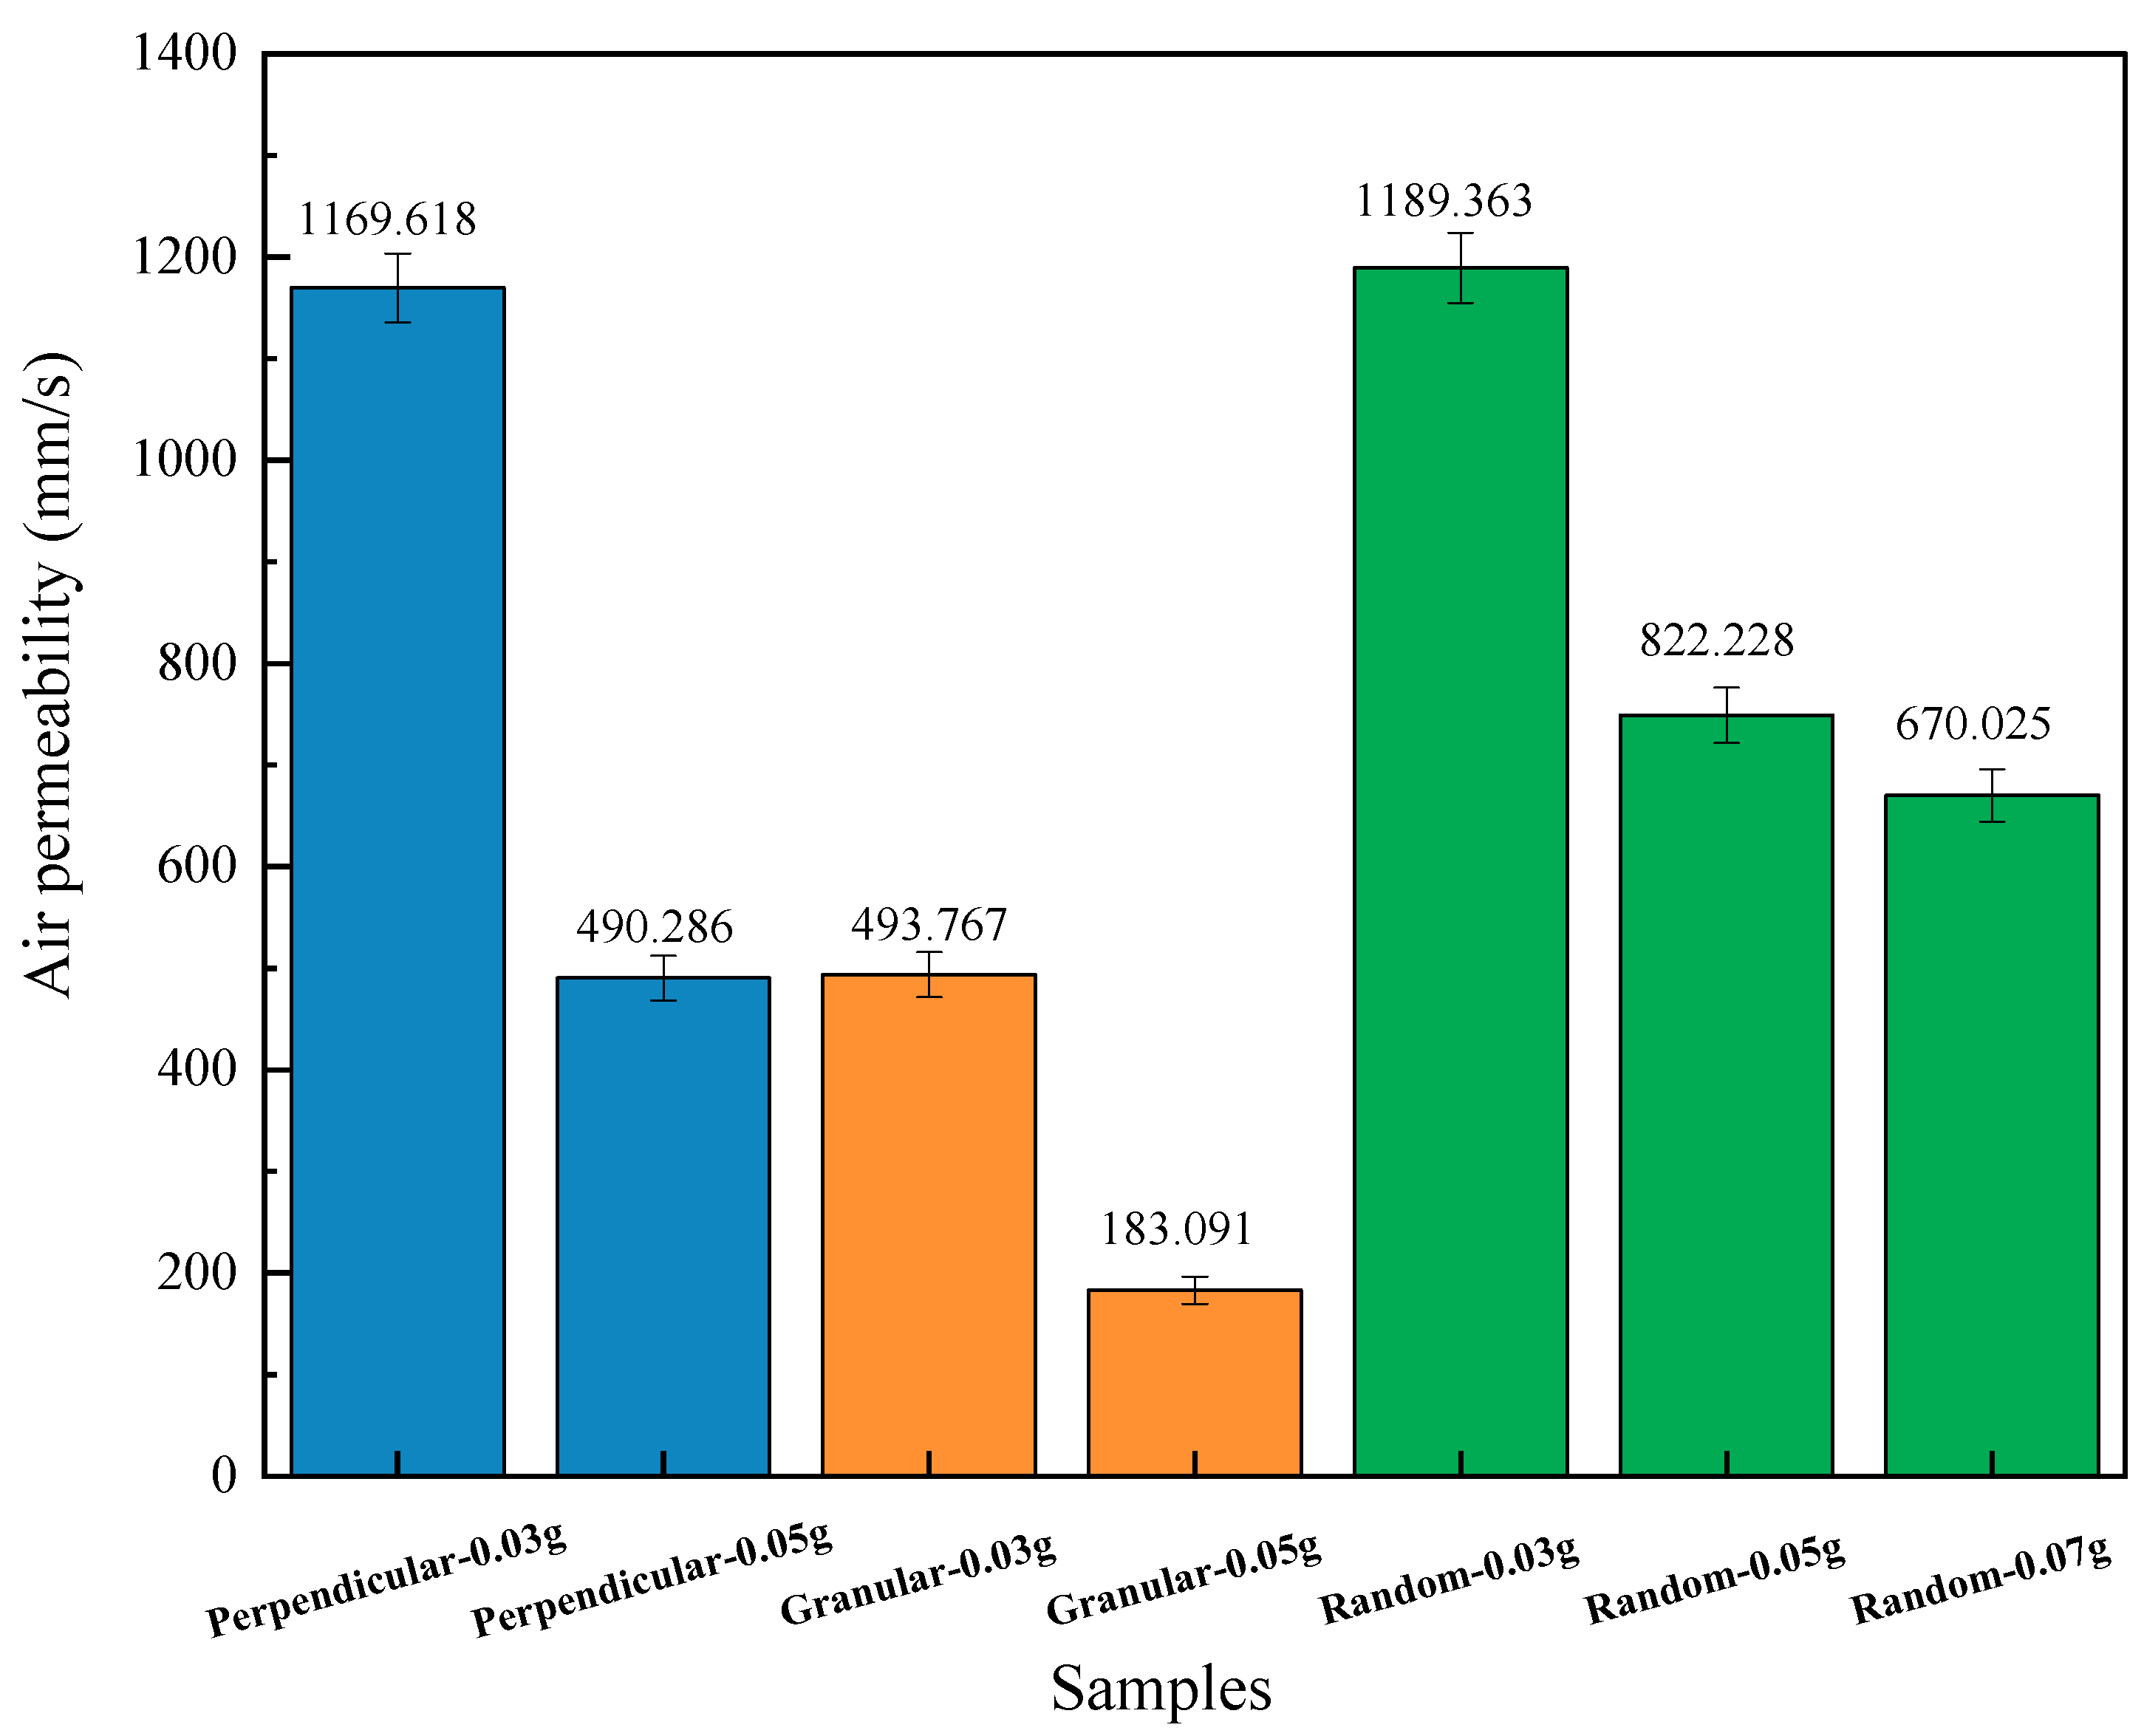
| Mass in One Cell | Porosity | Arrangement | 125 Hz | 250 Hz | 500 Hz | 1000 Hz | 2000 Hz | 4000 Hz | ASAC | NRC |
|---|---|---|---|---|---|---|---|---|---|---|
| 0.03g | 0.98 | Granular | 0.038 | 0.029 | 0.149 | 0.634 | 0.905 | 0.617 | 0.395 | 0.45 |
| Perpendicular | 0.099 | 0.078 | 0.119 | 0.462 | 0.845 | 0.561 | 0.361 | 0.40 | ||
| Random | 0.024 | 0.031 | 0.079 | 0.396 | 0.872 | 0.483 | 0.314 | 0.30 | ||
| 0.05g | 0.96 | Granular | 0.015 | 0.097 | 0.288 | 0.862 | 0.82 | 0.815 | 0.483 | 0.50 |
| Perpendicular | 0.027 | 0.066 | 0.133 | 0.586 | 0.883 | 0.632 | 0.388 | 0.40 | ||
| Random | 0.108 | 0.103 | 0.253 | 0.791 | 0.874 | 0.733 | 0.477 | 0.50 | ||
| 0.07g | 0.95 | Random | 0.048 | 0.07 | 0.154 | 0.771 | 0.761 | 0.677 | 0.413 | 0.45 |
| Details of Fillings | JE Thickness | 125 Hz | 250 Hz | 500 Hz | 1000 Hz | 2000 Hz | 4000 Hz | ASAC | NRC |
|---|---|---|---|---|---|---|---|---|---|
| 0.05g/cell | 20 mm | 0.108 | 0.103 | 0.253 | 0.791 | 0.874 | 0.733 | 0.477 | 0.50 |
| 0.125g/cell | 50 mm | 0.068 | 0.196 | 0.817 | 0.932 | 0.894 | 0.658 | 0.594 | 0.70 |
| Perforation Diameter | Thickness of Panel | Perforation Rate | 125 Hz | 250 Hz | 500 Hz | 1000 Hz | 2000 Hz | 4000 Hz | ASAC | NRC |
|---|---|---|---|---|---|---|---|---|---|---|
| 1.3 mm | 1 mm | 1% | 0.06 | 0.083 | 0.281 | 0.876 | 0.274 | 0.227 | 0.300 | 0.40 |
| 1 mm | 7% | 0.108 | 0.103 | 0.253 | 0.791 | 0.874 | 0.733 | 0.477 | 0.50 | |
| 1 mm | 13% | 0.015 | 0.058 | 0.13 | 0.602 | 0.994 | 0.927 | 0.454 | 0.45 | |
| 2 mm | 1 mm | 7% | 0.029 | 0.023 | 0.119 | 0.619 | 0.846 | 0.595 | 0.372 | 0.40 |
| 1.3 mm | 0.55 mm | 7% | 0.01 | 0.04 | 0.121 | 0.464 | 0.934 | 0.726 | 0.383 | 0.40 |
| 1.5 mm | 7% | 0.007 | 0.029 | 0.119 | 0.674 | 0.836 | 0.607 | 0.379 | 0.40 |
| (a) Factors Influencing the Sound Absorption Performance of Porous Materials/MPP-type honeycomb absorbers | The details of how to influence the sound absorption coefficient of the porous absorbers in reference | The details of how to influence the sound absorption coefficient of MPP-type acoustic absorbers |
| Air permeability | Optimal Air Permeability for Improving the Sound Absorption of Porous Materials | Similar impact trends on porous materials |
| Porosity | The porosity of porous materials is generally over 90% and the porosity of dense materials is low, which is not beneficial to the sound absorption performance | The values of porosity are high in this work. According to machine learning models, porosity may be the second most influential factor among these variables |
| Tortuosity (structural factor and arrangements) | Structural factors have less influence on low-frequency sounds. When the air permeability is high, increasing the structural factor leads to periodic changes in the sound absorption coefficient of the material within the mid- to high-frequency range | This parameter is difficult to test and visualize. It can be verified through the numerical models |
| Sample thickness | The enhanced thickness of samples will increase low-frequency absorption. Peak absorption occurs at the resonant frequency of one-quarter of the wavelength of the incident sound | An increase in thickness will shift the peak to lower frequencies and the absorption peak width will increase The presence of MPP shifts the absorption peak toward lower frequencies |
| Density of samples | Changing the bulk density will first cause the middle and high absorption change | An optimal density exists in this work |
| (b) Factors Influencing the Sound Absorption Performance of MPP/MPP-type honeycomb absorbers | The details of how to influence the sound absorption coefficient of porous absorbers in reference | The details of how to influence the sound absorption coefficient of MPP-type acoustic absorbers |
| The perforation rate | The lower perforation rate of MPP will move the absorption peak to a lower frequency range | Filling provides less enhancement for low perforation yet more enhancement for higher perforation range |
| The perforation diameter | Reducing the pore size is equivalent to decreasing the perforation rate, causing the absorption peak to shift toward lower frequencies | The pore size difference in this work is not significant, so the sound absorption curves look similar |
| The panel thickness | An enhancement in thickness will result in a slight shift in the peak toward the lower frequency range | The sound absorption performance does not change significantly in this work |
Disclaimer/Publisher’s Note: The statements, opinions and data contained in all publications are solely those of the individual author(s) and contributor(s) and not of MDPI and/or the editor(s). MDPI and/or the editor(s) disclaim responsibility for any injury to people or property resulting from any ideas, methods, instructions or products referred to in the content. |
© 2024 by the authors. Licensee MDPI, Basel, Switzerland. This article is an open access article distributed under the terms and conditions of the Creative Commons Attribution (CC BY) license (https://creativecommons.org/licenses/by/4.0/).
Share and Cite
Liu, Z.; Dong, C.; Tong, L.; Rudd, C.; Yi, X.; Liu, X. Sound Absorption Performance of Ultralight Honeycomb Sandwich Panels Filled with “Network” Fibers—Juncus effusus. Polymers 2024, 16, 1953. https://doi.org/10.3390/polym16131953
Liu Z, Dong C, Tong L, Rudd C, Yi X, Liu X. Sound Absorption Performance of Ultralight Honeycomb Sandwich Panels Filled with “Network” Fibers—Juncus effusus. Polymers. 2024; 16(13):1953. https://doi.org/10.3390/polym16131953
Chicago/Turabian StyleLiu, Zhao, Chenhao Dong, Lu Tong, Chris Rudd, Xiaosu Yi, and Xiaoling Liu. 2024. "Sound Absorption Performance of Ultralight Honeycomb Sandwich Panels Filled with “Network” Fibers—Juncus effusus" Polymers 16, no. 13: 1953. https://doi.org/10.3390/polym16131953
APA StyleLiu, Z., Dong, C., Tong, L., Rudd, C., Yi, X., & Liu, X. (2024). Sound Absorption Performance of Ultralight Honeycomb Sandwich Panels Filled with “Network” Fibers—Juncus effusus. Polymers, 16(13), 1953. https://doi.org/10.3390/polym16131953