Abstract
Polymeric positive temperature coefficient (PTC) materials with low switching temperature points are crucial for numerous electronic devices, which typically function within the room temperature range (0–40 °C). Ideal polymeric PTC materials for flexible electronic thermal control should possess a room-temperature switching temperature, low room-temperature resistivity, exceptional mechanical flexibility, and adaptive thermal control properties. In this study, a novel PTC material with a room-temperature switching temperature and superb mechanical properties has been designed. A blend of a semi-crystalline polymer EVA with a low melting temperature (Tm) and an amorphous polymer (PVAc) with a low glass transition temperature (Tg) was prepared. Low-cost graphite was chosen as the conductive filler, while CNF was incorporated as a hybrid filler to enhance the material’s heating stability. PVAc0.4/EVA0.6/GP-3wt.% CNF exhibited the lowest room temperature resistivity, and its PTC strength (1.1) was comparable to that without CNF addition, with a Curie temperature of 29.4 °C. Room temperature Joule heating tests revealed that PVAc0.4/EVA0.6/GP-3wt.% CNF achieved an equilibrium temperature of approximately 42 °C at 25 V, with a heating power of 3.04 W and a power density of 3.04 W/cm2. The Young’s modulus of PVAc0.4/EVA0.6/GP-3wt.% CNF was 9.24 MPa, and the toughness value was 1.68 MJ/m3, indicating that the elasticity and toughness of the composites were enhanced after mixing the fillers, and the mechanical properties of the composites were improved by blending graphite with CNF.
1. Introduction
Conductive polymer composites (CPCs) are of widespread interest due to their versatility and dexterity in various engineering applications, such as in overcurrent protectors, electronic devices, electromagnetic shielding, flexible sensors, and self-regulating heaters [1,2,3,4,5,6,7]. Specifically, certain CPCs exhibit a thermal resistance behavior, whereby the resistivity increases sharply when the temperature exceeds a certain point, referred to as the switching temperature. This is attributed to the severe thermal expansion near the melting point of the polymer matrix, resulting in an increase in the spacing between conductive particles. This phenomenon is defined as the positive temperature coefficient (PTC) effect and is caused by the mismatch of thermal expansion between the polymer matrix and the filler, as well as by the disruption of the conductive network [8,9]. In general, above the melting point, the resistivity decreases inversely with increasing temperature, exhibiting a negative temperature coefficient effect (NTC) [10]. However, the NTC effect can significantly impact the performance of PTC materials due to the aggregation of conductive particles and the random reconfiguration of the conductive network.
To date, there have been numerous attempts to obtain PTC materials with superior performance, but most of the research has concentrated on the high temperature region, with switching temperatures ranging from 50 to 400 °C [11,12,13,14,15]. However, in numerous regions, the operating temperature range of electronic devices is often required to be within the room temperature range of 0–40 °C [16,17,18]. To achieve effective temperature control, PTC materials should possess a switching temperature slightly below the control temperature of the electrical device. Therefore, preparing PTC materials with a low switching temperature ranging from 0 to 40 °C has been a crucial issue [19,20,21].
Ideal polymeric PTC materials for thermal control should possess room-temperature switching temperatures [22,23,24], low room-temperature resistivity [25,26,27,28,29], good PTC repeatability [14], high PTC strength [19], good mechanical flexibility [30,31,32,33], and adaptive thermal control properties [21]. It has been demonstrated that PTC materials with low Curie temperatures can be achieved using low melting point semi-crystalline polymers and low glass transition temperature amorphous polymers as matrix materials. These materials exhibit excellent PTC repeatability and mechanical properties, with PVAc0.4/EVA0.6/GP composites showing the best Joule heating performance, yet their heating stability requires improvement. For polymer-based PTC composites to be practical, heating stability is crucial, directly affecting the material’s service life. To enhance heating stability, focus should be on improving PTC repeatability while avoiding exceeding the material’s tolerance temperature for extended periods, as this can also shorten its lifespan. Numerous studies have been conducted to improve PTC repeatability, primarily through filler modification [34,35], hybrid fillers [34,36], polymer blending [37,38,39,40], and macroscopic assembly of different PTC materials [41,42,43]. The current study considered polymer blending to enhance PTC reproducibility during the initial design phase, and the results validated this approach. However, further performance enhancement necessitates considering other methods. Modified fillers can improve compatibility between fillers and polymers, preventing large agglomerates and allowing conductive fillers to be reversibly repositioned. The polymer matrix bonds to filler surface-grafted molecules through physical entanglement or chemical bonding. However, due to the complexity of filler modification and potential conductivity losses with increasing grafting modifiers, this strategy is rarely implemented in practical products. Rational device structure design can also enhance PTC performance, but the manufacturing process is intricate, increasing costs and limiting applications in scenarios requiring lighter, simpler materials, such as aircraft wing de-icing or wearable devices. Hybrid fillers leverage the synergy between fillers to hinder cluster formation. The second filler connects conductive filler clusters over long distances, increasing the likelihood of conductive network formation. This approach often reduces room temperature resistivity while enhancing PTC repeatability. High aspect ratio fillers have been reported to restrict other filler movements, inhibiting the NTC effect [44].
In this paper, carbon nanofibers (CNF) with high aspect ratios were chosen as the second conductive filler to be added to the optimal PVAc0.4/EVA0.6/GP composite in order to further enhance the heating stability of the material. Additionally, the heating stability of the material was tested at low temperatures (<0 °C). The material’s heating performance at low temperatures (<0 °C) was also examined to explore its potential for de-icing applications.
2. Experimental
2.1. Materials
Graphite (average size about 6.5 μm, density 2.2 g/cm3) was purchased from Shenzhen Jinda Power Technology Co. (Shenzhan China) PS (density 1.047 g/cm3, melt flow index 7.9–8.9 g/10 min, 200 °C/5 kg) was provided by Shanghai Aladdin Biochemical Technology Co. EVA (40 w, Mr = 70,000–120,000, density 0.965 g/cm3, melt flow index 52 g/10 min, 190 °C/2.16 kg) was purchased from DuPont de Nemours & Company (Guangzhou, China). Toluene (AR, Mr = 92.14) was produced by Shanghai Tianteng Technology Co. (Shanghai, China) CNF (purity > 70%, OD 200–600 nm, length 5–50 μm) was provided by Shanghai Aladdin Biochemical Technology Co. (Shanghai, China).
2.2. Sample Preparation
The PVAc/EVA/GP-CNF composites were prepared using the solution blending method. Firstly, a 2/3 mass ratio of PVAc and EVA (total mass 0.4 g) was added to 2.9 mL of toluene at the same time, followed by magnetic stirring at 60 °C for 12 h until the polymer was completely dissolved. After being dissolved, 20 wt.% of graphite as well as mass ratios (1 wt.%, 2 wt.%, 3 wt.%, 4 wt.%, and 5 wt.%) of CNF were weighed and added to the mixed solution, and then the multi-step cyclic dispersion method was performed: magnetic stirring for 1.5 h, sonication for 10 min, oscillation on a vortex mixer for 1 min, and then magnetic stirring for 10 min, sonication for 10 min, oscillation on a vortex mixer for 1 min. Immediately after the dispersion process, the mixed solution in the bottle was sucked up with a rubber-tipped dropper and squeezed out onto a clean glass sheet, which was naturally stretched on the surface using the tension of the liquid. The glass sheet was put into an oven at 60 °C and kept warm for 24 h to allow the solvent to evaporate. After the end of the holding period, it was cooled to room temperature and then annealed: the temperature was slowly increased to 70 °C for 10 min, and then cooled to room temperature. Finally, the sample was obtained by stripping the film, and the thickness of the sample was about 200 μm. The composition of the polymer and conductive filler used in the experiment is shown in Table 1.

Table 1.
Surface free energies of the fillers and polymers.
2.3. Characterization
The microscopic morphology of the fracture surface and the distribution of graphite in the co-polymer were characterized by field emission scanning electron microscopy. The fracture surfaces of the samples were obtained by breaking the samples after immersion in liquid nitrogen for 5 min. Gold spraying was performed on all studied surfaces before testing.
The thermal properties of PTC materials were determined by differential scanning calorimetry. A sample weighing about 5 mg was heated from 10 °C to 180 °C at a heating rate of 10 °C/min, held at this temperature for 5 min to remove the thermal history, and then cooled from 180 °C to 10 °C at a cooling rate of 10 °C/min, held for 5 min, and then heated from 10 °C to 180 °C at a rate of 10 °C/min.
The DC resistance of the sample along the thickness direction was measured continuously using the PTCR-T characteristic test system with a heating rate of 2 °C/min. The resistivity was calculated as , where R, S, and d represent the resistance, area, and thickness of the sample, respectively. The sample was cut to a size of 10 mm × 10 mm before testing, and the upper and lower surfaces of the material were sprayed with gold.
A DC power supply was used to apply a voltage to the samples, and the Joule heating properties of the materials at different voltages were tested by varying the voltage and testing their electrical heating stability. The mechanical properties of the samples were tested using an Instron tensile testing machine to evaluate their mechanical properties.
3. Results and Discussion
3.1. Microscopic Morphological Analysis of PVAc0.4/EVA0.6/GP-CNF Conductive Composites
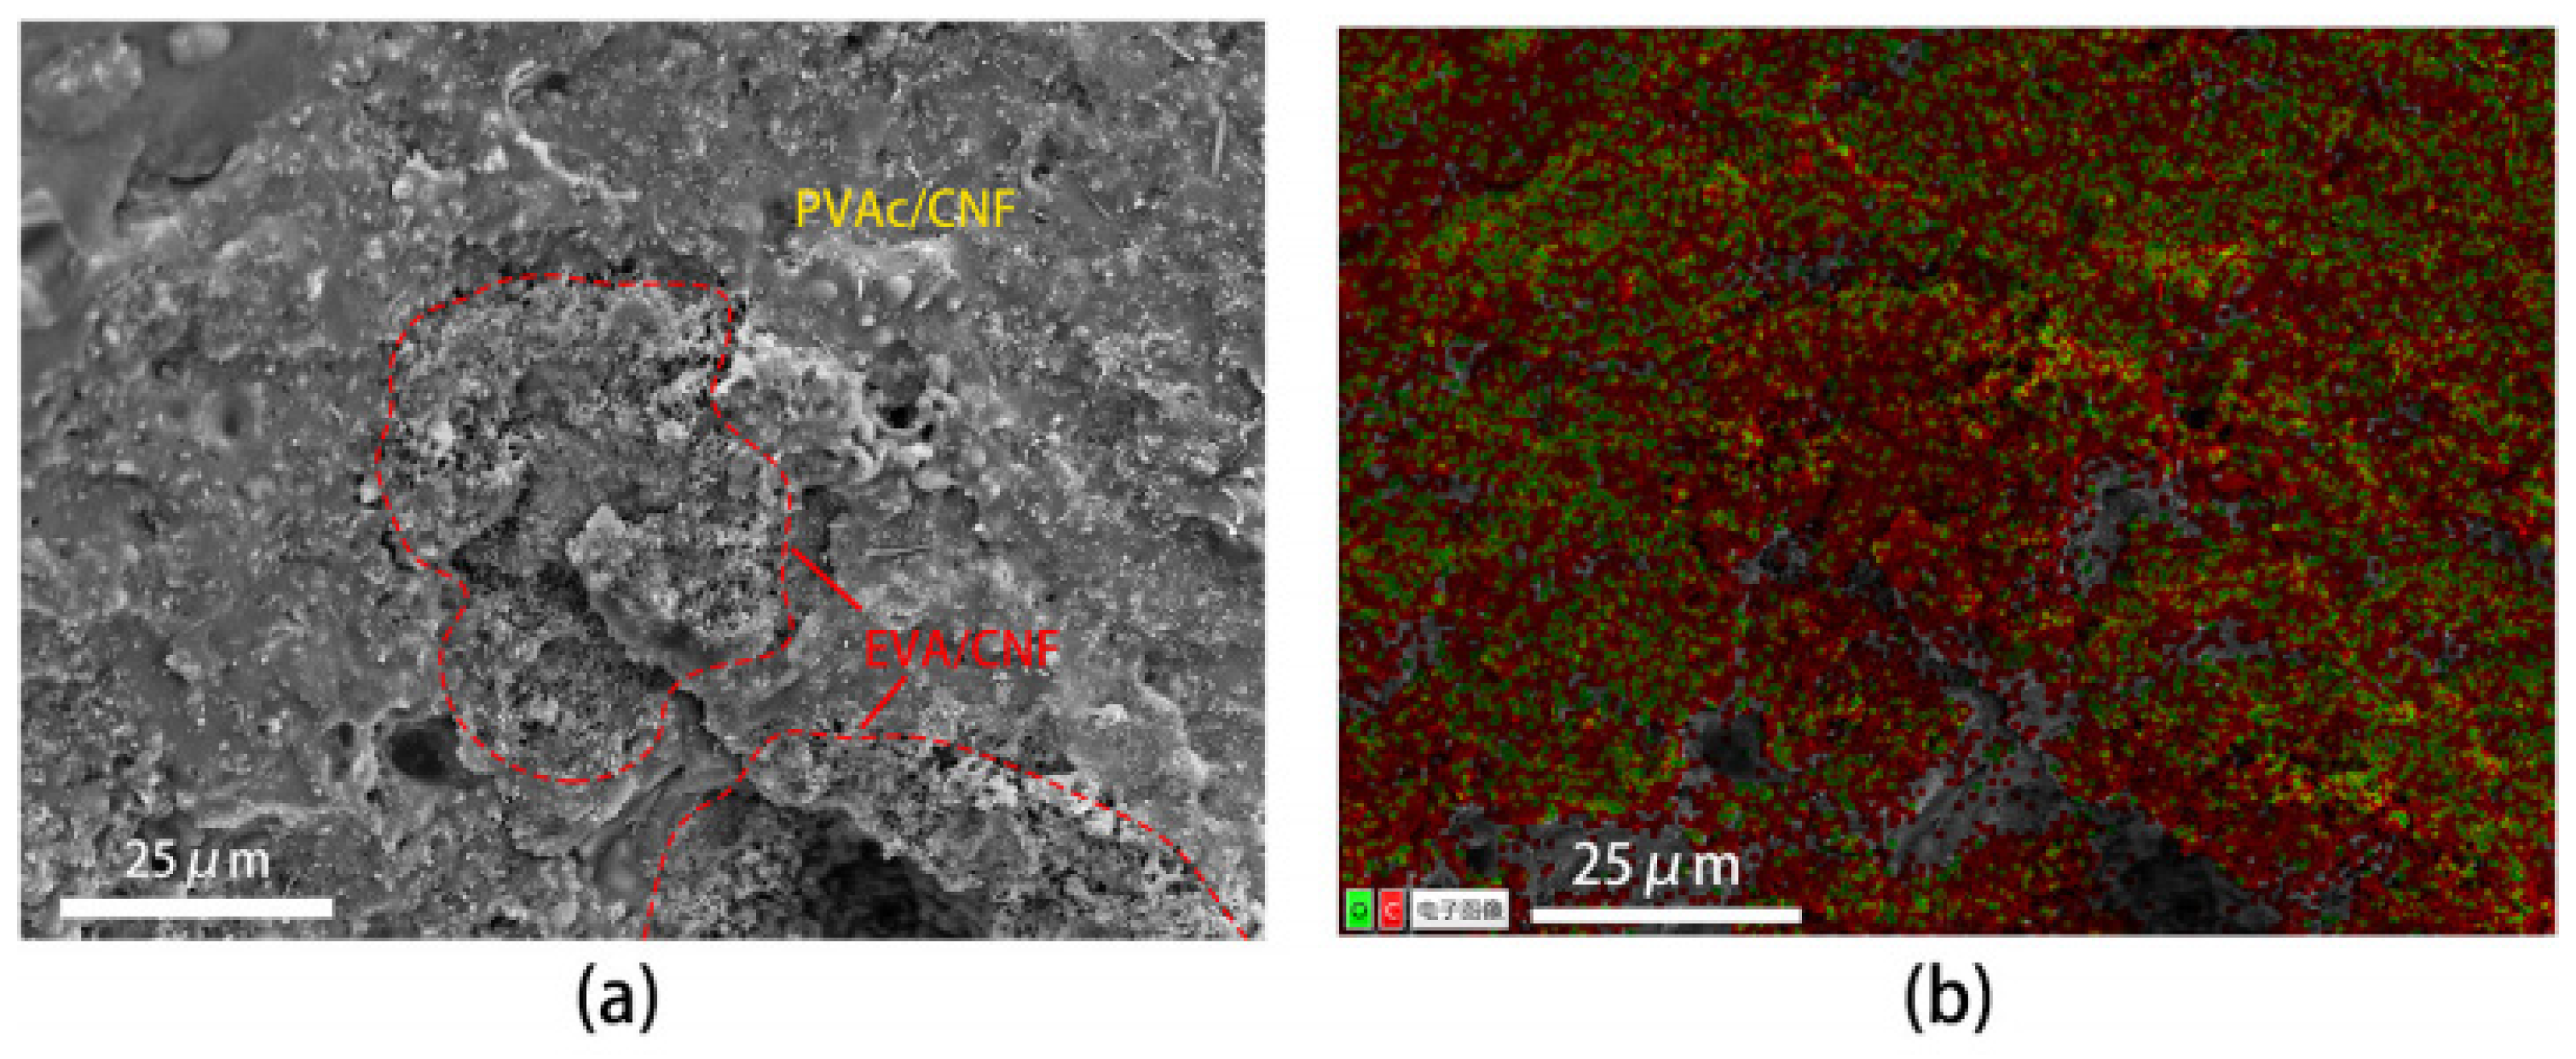
Figure 1 shows the cross-sectional view of PVAc0.4/EVA0.6/20 wt.% CNF and the corresponding energy dispersive spectroscopy (EDS) image. When the PVAc/EVA mass ratio is 2/3, the morphology of the composite undergoes significant changes when graphite is replaced with the same content of CNF. It has been observed that the region with relatively high O content in the EDS image is primarily PVAc, while the region with low O content is primarily EVA, thus enabling the distinction of regions in Figure 1a based on the EDS (Figure 1b). Initially, when the polymer matrix components were identical, the two phases of the biphasic polymer lost their longitudinal co-continuity after the filler was changed to CNF, resulting in a more distinct division between the EVA and PVAc phases. The EVA phase filled with CNF was more porous and loose, with finer and rougher pores overall. Meanwhile, some pores were observable in the PVAc phase filled with CNF, but they were coarser, and the PVAc phase in the cross-section appeared relatively smoother. Additionally, there were differences in the pattern of CNF filling in the two phases. In the EVA phase, the CNF was smaller, while in the PVAc phase, not only were there some fine CNF interspersed, but also some relatively large CNF tips were visible through the PVAc phase, leading to larger holes in this phase. The reason for this morphological difference may be that EVA is a semi-crystalline polymer, comprising both crystalline and amorphous phases. The introduction of CNF disrupts the crystalline phase structure, resulting in the formation of many loose pores. Conversely, PVAc is a pure amorphous phase with better affinity for CNF, leading to CNF being wrapped in the polymer, resulting in narrower voids and fewer pores.

Figure 1.
PVAc0.4/EVA0.6/20wt.% CNF: (a) SEM image of cross section; (b) EDS surface image (the Chinese characters in the figure mean: “Digital Image”).
Figure 2 shows SEM cross-sectional images of the PVAc0.4/EVA0.6/GP-CNF composites at different CNF contents. From the figures, it can be seen that the addition of a small amount of second filler CNF on top of 20 wt.% graphite does not significantly affect the morphology of the composites, and the biphasic polymers still exhibit a co-continuous state at these five CNF contents, with no obvious dividing line or partition between the two phases.
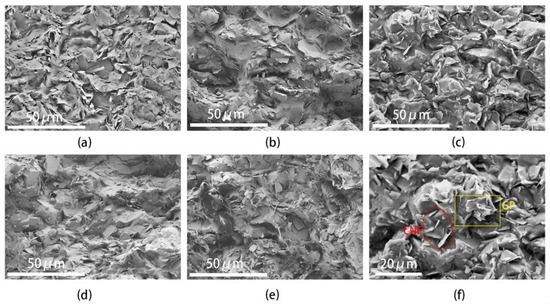
Figure 2.
SEM images of PVAc0.4/EVA0.6/GP-CNF composites: SEM images of CNF content of (a) 1 wt.%; (b) 2 wt.%; (c) 3 wt.%; (d) 4 wt.%; and (e) 5 wt.%. (f) Local amplification of (c), respectively.
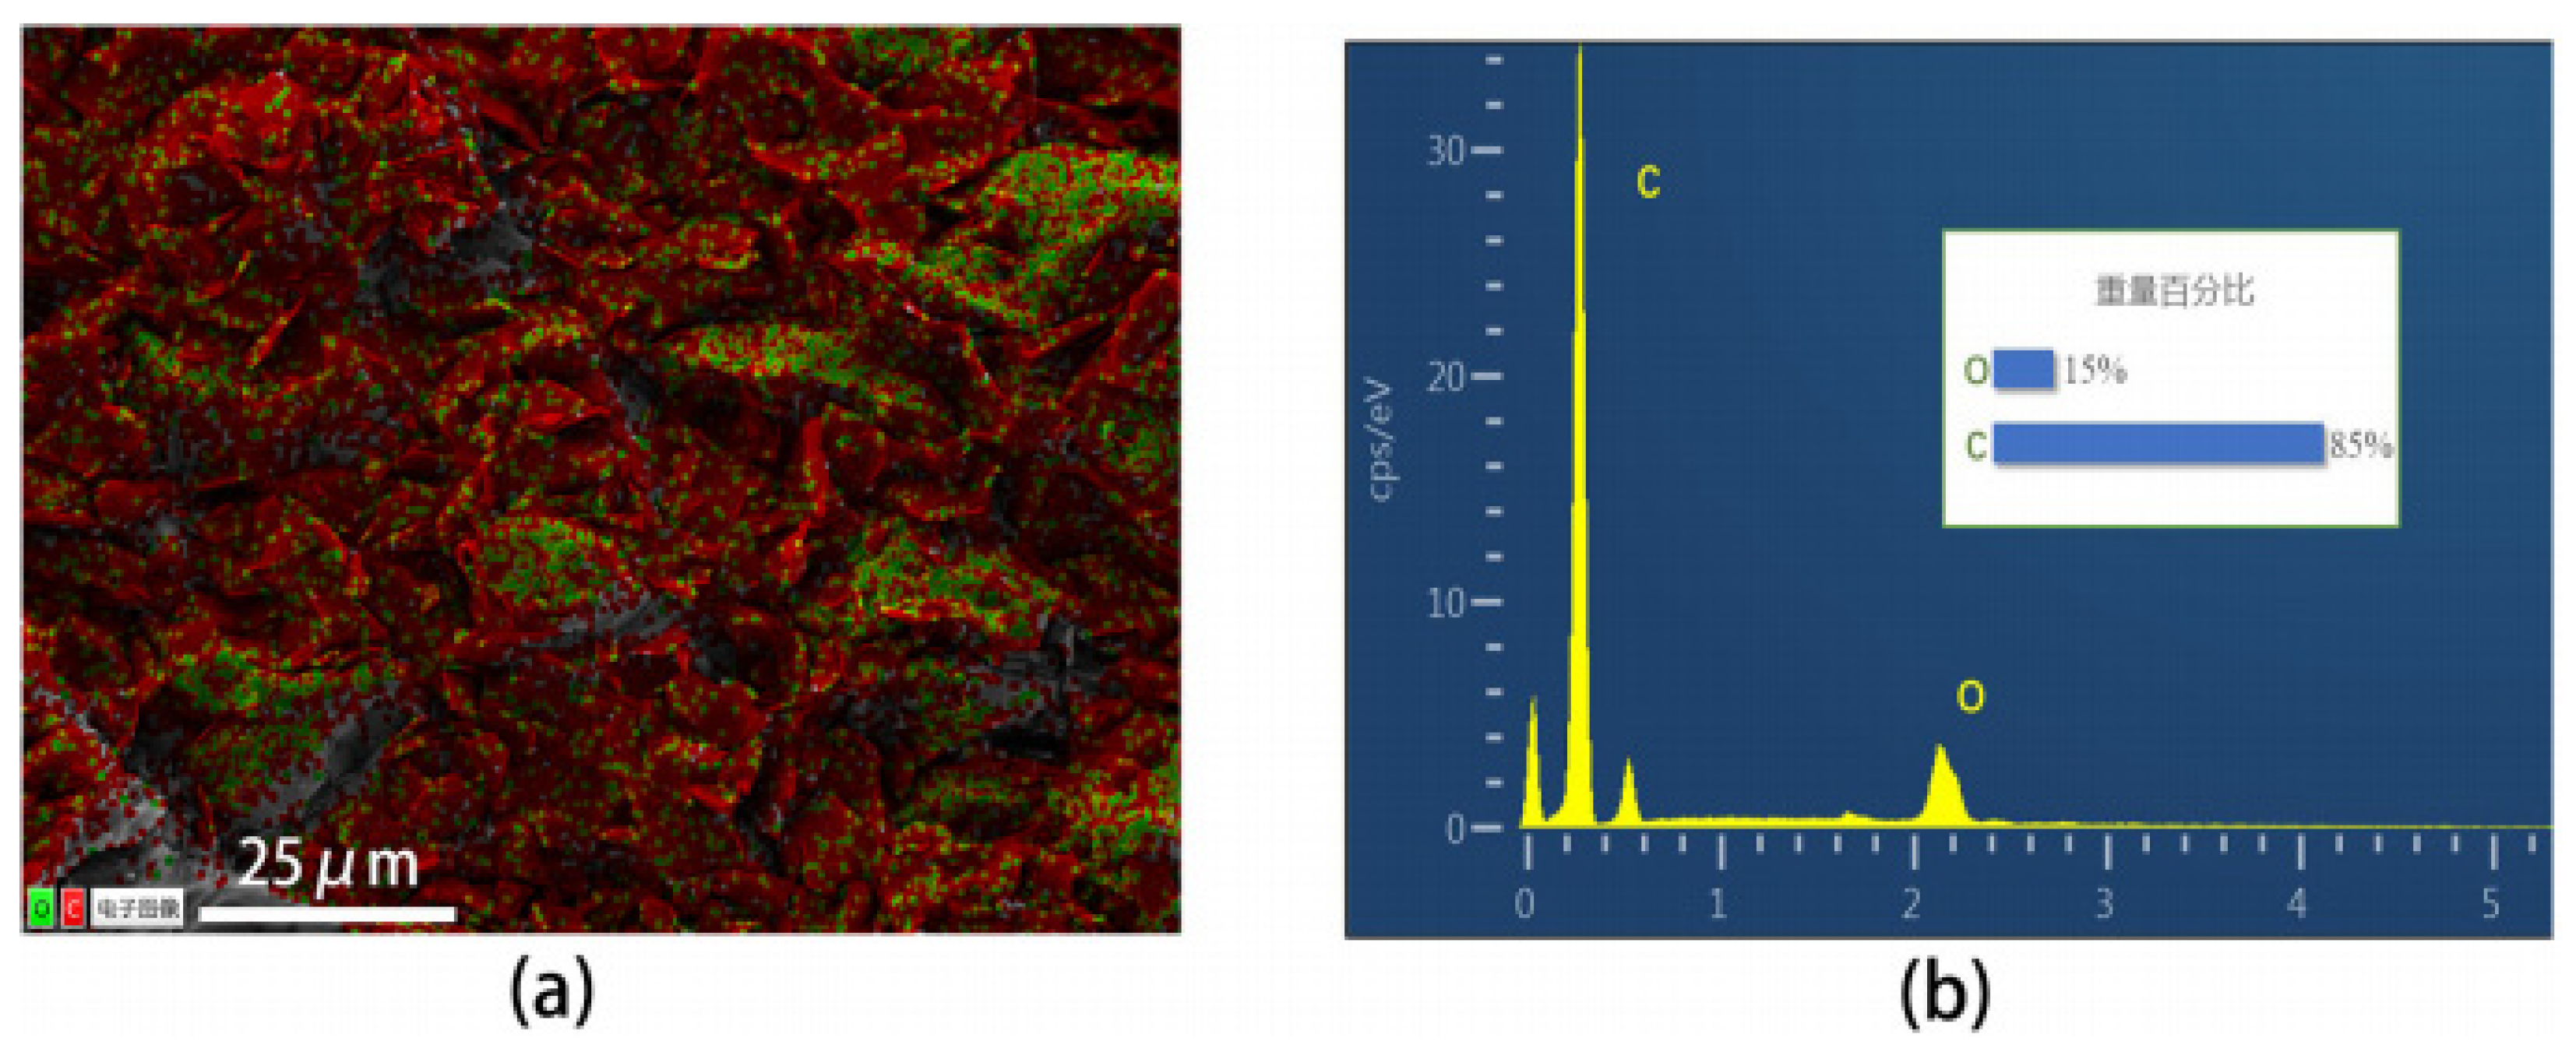
According to Figure 3, the distribution of PVAc and EVA phases is similar to that of graphite in the absence of CNF addition. It can be observed that the graphite is well dispersed in the matrix regardless of the CNF content. Graphite plays a significant role in the formation of the conductive network, while CNFs of varying sizes function as a “bridge” connecting graphite particles and forming graphite–CNF–graphite channels. Additionally, some CNFs are directly or indirectly in contact with each other, forming CNF–CNF networks (see Figure S1 in Supporting Information), thus creating a dual conductive network and enhancing the likelihood of forming a conductive pathway. Figure 2f depicts a partial enlargement of the cross-section at a CNF content of 3 wt.%. Notably, CNFs can traverse the polymer phase, serving as a bridge between two-phase regions, which can compensate for the smaller size of graphite particles that may not form long conductive channels alone. This indicates that graphite and CNFs have a synergistic effect on the formation of the conductive network, resulting in a more stable and superior conductive network.

Figure 3.
PVAc0.4/EVA0.6/GP-3wt.%CNF composite: (a) EDS image: green indicates the distribution of O elements, red indicates the distribution of C elements (the Chinese characters in the figure mean: “Digital Image”).; (b) EDS energy spectrum (the Chinese characters in the figure mean: “wt.%”).
In order to predict the preferential distribution of graphite in the binary-polymer, classical thermodynamics is used. When the equilibrium state is reached, the graphite is either distributed in a specific phase or at the interface of two immiscible polymers, which is dictated by the minimum interfacial energy [45]. The wetting coefficient (ωa) can assess the equilibrium state of the conductive fillers based on Young’s equation, shown as Equation (1) [46]:
where γCA, γCB, and γAB are the interfacial energies between polymer A and the filler, polymer B and the filler, and between polymer A and polymer B, respectively. The values of ωa > 1, ωa < −1, or −1 < ωa < 1 mean that the fillers would preferentially be localized in polymer B, in polymer A, or at the interface, respectively [47].
The interfacial energies can be calculated from the surface energies of the dispersion and polar parts. According to the type of surfaces, two main approaches are often used to calculate γij, including the harmonic mean equation and the geometric mean equation [48].
Harmonic mean equation:
Geometric mean equation:
where γ1 and γ2 are the surface tensions of components 1 and 2; and are the dispersive parts of the surface tensions of components 1 and 2; and and are the polar parts of the surface tension of components 1 and 2.
The results of the interfacial energy obtained using Equations (2) and (3) are presented in Table 2, and the results of the wetting coefficient are shown in Table 3. The wettability coefficients calculated using the harmonic mean equation and the geometric mean equation are 0.3 and 0.4, respectively, suggesting that graphite is primarily situated at the interface between EVA and PVAc, which aligns with our observed findings. However, for CNF, the wettability coefficients determined by the harmonic mean equation and the geometric mean equation are −2.9 and −3.2, respectively, implying that CNF predominantly resides in the EVA phase. Nevertheless, this inference contradicts the observed packing distribution.
Table 2.
Interfacial energies as calculated using harmonic mean equation and geometric mean equation.
Table 3.
Wetting coefficient and predicted location of graphite.
3.2. Influence of Mixed Fillers on Electrical and Thermal Resistance Properties
Figure 4 shows the room temperature resistivity of PVAc0.4/EVA0.6/GP-CNF with different levels of CNF addition (errors are given in Supporting Information). The room temperature resistivity increased by three orders of magnitude after adding only 1 wt.% CNF or 2 wt.% CNF compared to that without CNF. As the CNF content continued to increase, the room temperature resistivity decreased and then increased, reaching a minimum value of 205.4 Ω·m at 3 wt.% CNF, approximately twice the resistivity without the addition of CNF. The reason for this trend may be that when 1 wt.% CNF or 2 wt.% CNF is added, the amount of CNF is too small not only to form a new conductive chain containing more CNF, but also the insertion of CNF may affect the van der Waals forces between graphite [49] and thus destroy the graphite–graphite conductive network, resulting in a higher resistivity at this time. With the addition of more CNF, CNF starts to participate in the composition of the conducting network, and graphite–CNF–graphite and CNF–CNF conducting channels appear. However, continuing to increase the CNF content after more than 3 wt.% will make it difficult to disperse the CNFs with high aspect ratios by entangling them with each other [40], and the CNF entanglement phenomenon can be observed in Figure 2e. The large amount of CNF agglomeration will reduce the utilization of CNF and make less CNF form the conductive network, and it will affect the composition of the full conductive network, so the continued addition of CNF will instead increase the resistivity.
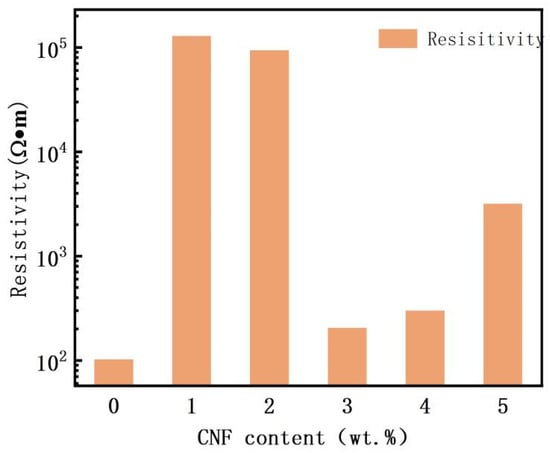
Figure 4.
Room temperature resistivity of PVAc0.4/EVA0.6/GP-CNF at different CNF contents.
The temperature resistance characteristic curves of the PVAc0.4/EVA0.6/GP-CNF composites are depicted in Figure 5. When the CNF content is low, the PTC strength is similar to that without CNF addition. The PTC curves at 1 wt.% and 2 wt.% CNF content are similar, suggesting that the conductive network within the material may be comparable at this point and inferior to the graphite conductive network without CNF, resulting in a higher room temperature resistivity. At 3 wt.% CNF content, the PTC strength and room temperature resistivity are closest to those without addition, and there is almost no NTC phenomenon, indicating potential good PTC repeatability. As the CNF content increases, the PTC strength decreases, with 4 wt.% and 5 wt.% CNF exhibiting weaker PTC effects. This is attributed to the rise in conductive particles within the matrix, enhancing the conductive particle percentage and conductive channel formation probability. During warming, conductive fillers may be displaced from their equilibrium positions, moving closer to other conductive particles, enabling the formation of new conductive channels. This second filler addition partially negates the PTC effect. The high CNF content facilitates easier reconfiguration of the conductive network during warming after deconstruction.
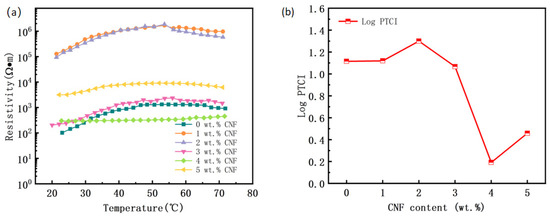
Figure 5.
PVAc0.4/EVA0.6/GP-CNF composites with different CNF contents. (a) Resistance temperature characteristic curve; (b) PTC intensity.
Collectively, it seems that the composite with 3 wt.% CNF has the best PTC performance. Therefore, the PTC cycling curve of PVAc0.4/EVA0.6/GP-3wt.%CNF was further tested to investigate its PTC reproducibility. From Figure 6a, it was found that the material exhibits a very weak NTC effect only during the first heating, and the NTC effect disappears during subsequent heating. It can even be observed that the trend at the end of the curve is gradually upward, with only the first curve ending slightly downward. The second curve shows a long “plateau” after 50 °C, and the third to fifth curves are very similar and no longer have a “plateau”. However, the end of the curve goes up, indicating that the PTC effect of the material continues from room temperature to the test cutoff temperature. The sixth and seventh cycles also maintain this pattern, with the difference being that the room temperature resistivity remains largely unchanged for the first five cycles but slightly increases for the last two. The gradual elimination of the NTC effect and even the transition to a PTC effect with increasing heating times is an interesting phenomenon, as it is contrary to the results and patterns of many studies [27,50]. This indicates that the PTC of this material is reproducible and does not deteriorate quickly with increasing use. The significant increase in resistivity in the sixth and seventh cycles compared to previous cycles may be attributed to irrecoverable changes in the structure, volume, aggregation state, and distribution of the conductive fillers in the material after the sixth cycle. This can also be supported by the changes in Curie temperature [51]. From Figure 6b, it can be observed that the Curie temperature is similar for the third, fourth, and fifth cycles, but significantly decreases for the sixth and seventh cycles. Since the Curie temperature is related to the phase transformation process of the composite [29], this change indicates that the material undergoes a different phase transformation in the latter two cycles compared to before.
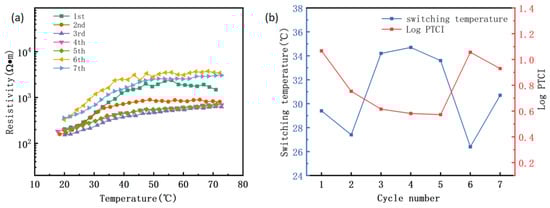
Figure 6.
PVAc0.4/EVA0.6/GP-3wt.%CNF composite heating cycle. (a) Resistance temperature characteristic curve; (b) Curie temperature and PTC intensity.
The Curie temperature during the initial heating of PVAc0.4/EVA0.6/GP-3wt.%CNF increased by approximately 1 °C compared to the material without CNF, reaching 29.4 °C, and remained at approximately 30 °C during cyclic heating. The PTC strength decreased with the number of cycles during the first few cycles, and increased to values close to the initial during the last two cycles. Taken together, it appears that this material has excellent PTC repeatability, which also indicates its potential for long-term use.
To investigate the effect of CNF addition on the melting point and glass transition temperature of the polymer matrix, PVAc0.4/EVA0.6/GP without CNF and three typical concentrations of the material with CNF added were selected for DSC testing. The results are shown in Figure 7. It can be seen that the addition of CNF has essentially no effect on the glass transition temperature and melting temperature of the copolymer matrix, which are around −28 °C for these samples, while the melting peaks at 51 °C and 105 °C also largely overlap. However, with an increase in CNF content, the peak height of the melt peak at 105 °C gradually decreased, indicating that a high content of CNF would affect the formation of crystal structures in EVA and reduce its crystallinity.
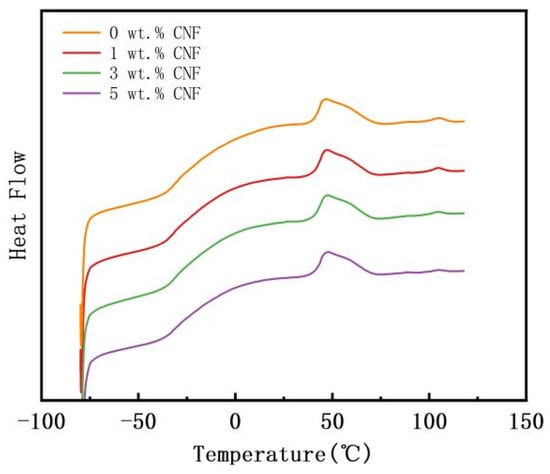
Figure 7.
DSC curves of PVAc0.4/EVA0.6/GP-CNF at different CNF contents.
Additional details regarding this Section 3.2 can be found in the Supporting Information (Figures S2–S5 and the related discussions in Supporting Information).
3.3. Impact of Mixed Fillers on Self-Limiting Performance
Based on the results of previous PTC performance tests of the composites, the PVAc0.4/EVA0.6/GP-3wt.%CNF composite was selected as the main object for the next Joule heating performance tests.
- (1)
- Room temperature ambient heating test
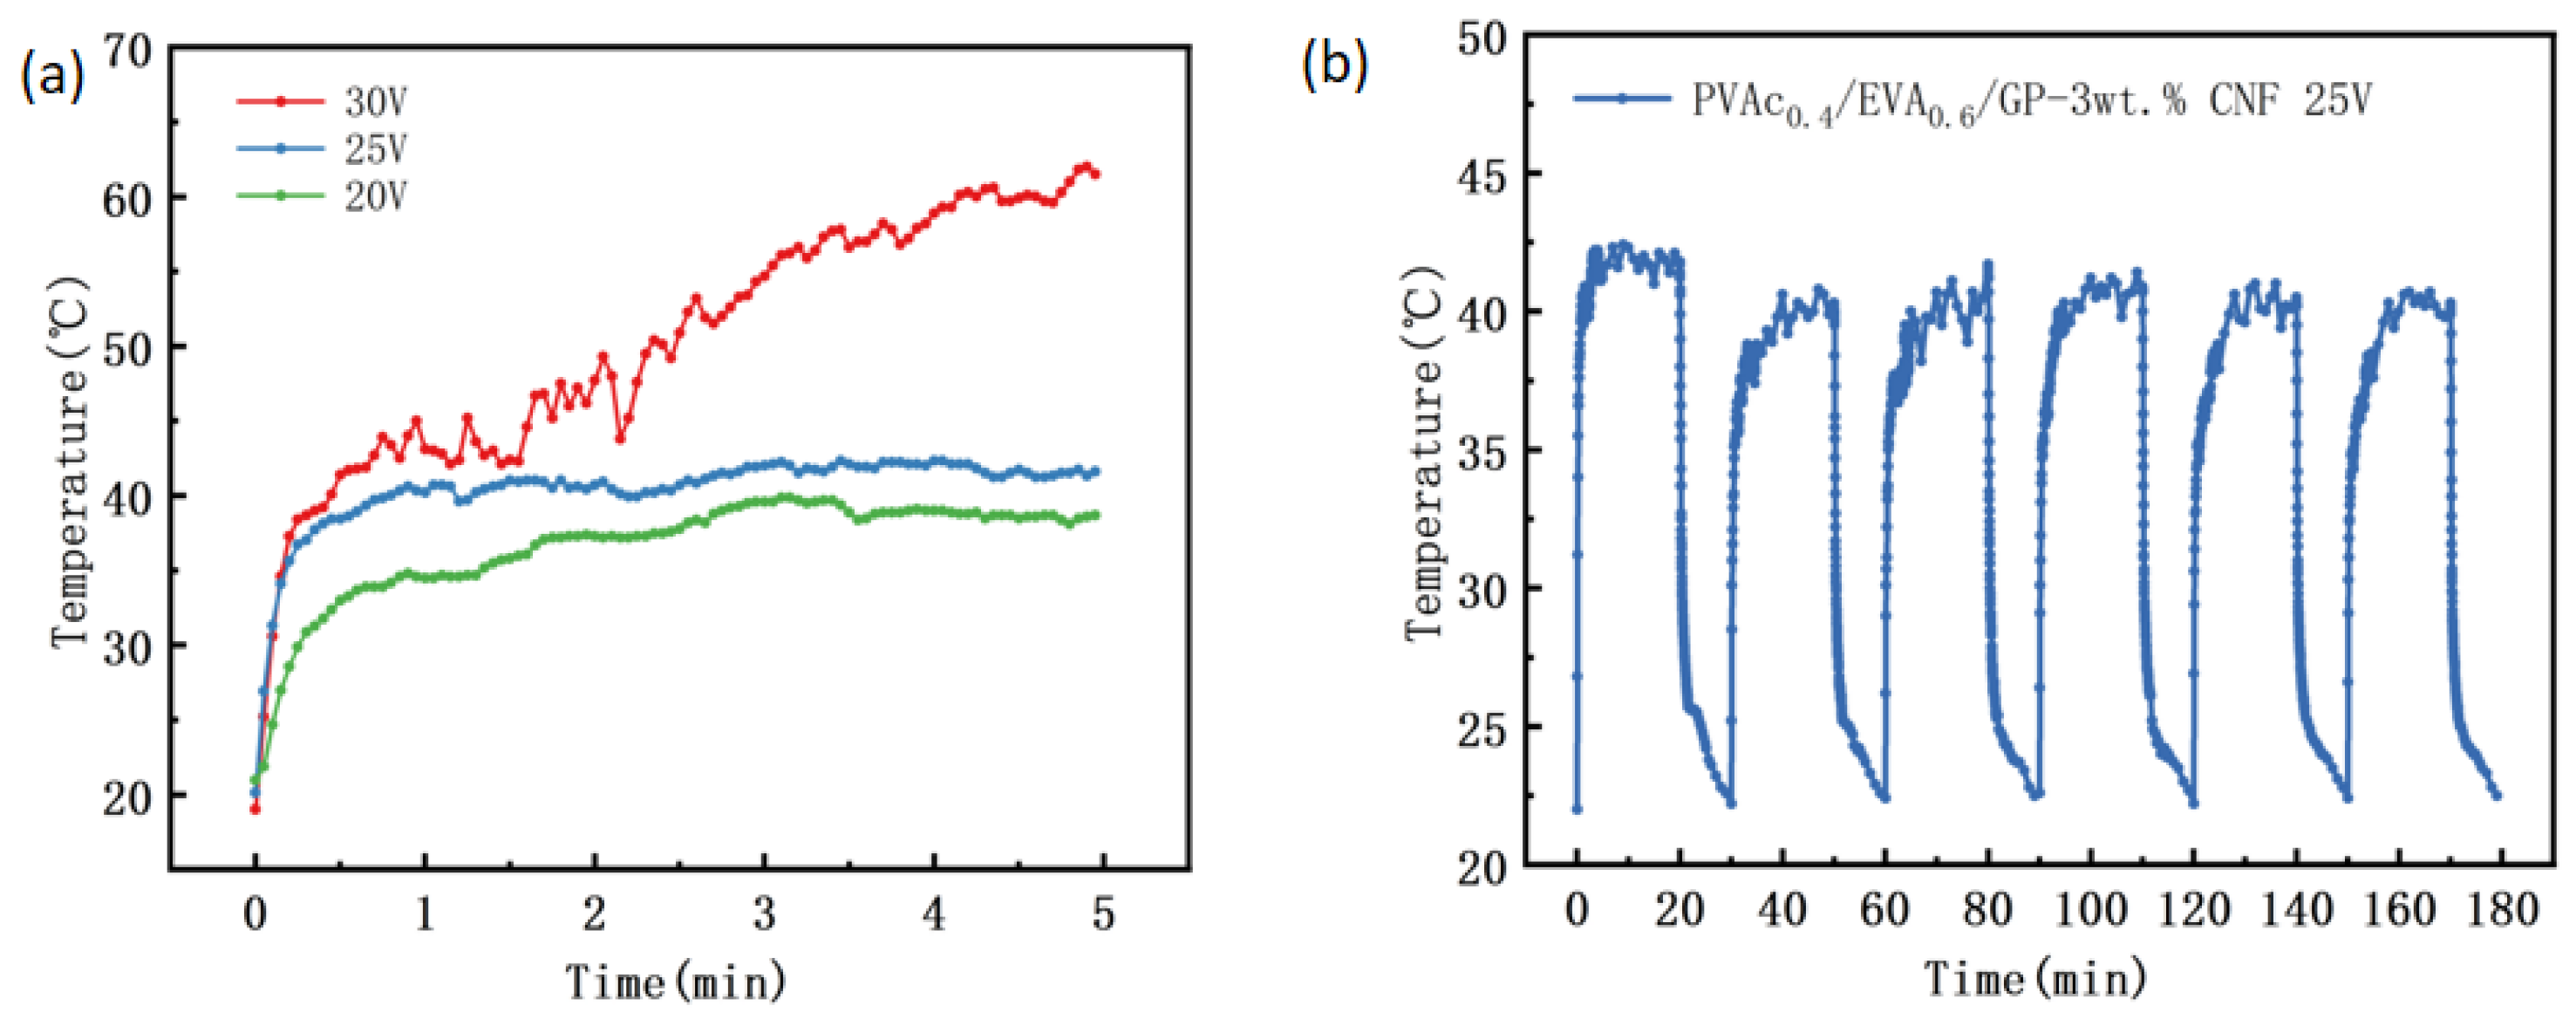
From Figure 8a, it can be seen that with an increase in voltage, the material gradually reaches the self-limiting temperature. At 20 V and 25 V, the material shows good self-limiting ability, reaching the self-limiting temperature in approximately 1 min. After this, the temperature increases slowly with time to reach equilibrium temperatures of 42 °C and 40 °C, respectively. However, when the voltage is 30 V, the temperature of the material rises rapidly to 40 °C and then increases to 61 °C due to the large heating power, indicating a lack of good self-limiting ability.
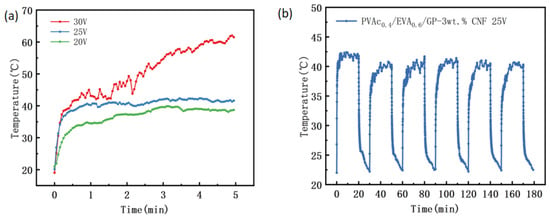
Figure 8.
Self-limiting heating of PVAc0.4/EVA0.6/GP-3wt.% CNF composites. (a) Temperature-time curves at 20 V, 25 V, and 30 V; (b) cyclic heating-cooling test at 25 V cyclic voltage.
To evaluate its electrical heating cycle stability and compare it with the previous material, it was chosen to apply 25 V for six electrical heating tests, and the results are presented in Figure 8b. The initial heating power was 3.04 W, and the power density was 3.04 W/cm2, approximately six times higher than that of the PS0.4/EVA0.6/GP material and half of the PVAc0.4/EVA0.6/GP material. It is observed that the equilibrium temperature during the first heating was approximately 42 °C. The subsequent five heating processes involved a period of temperature fluctuations within a specific range, not exceeding 2 °C overall, and stabilizing near 40 °C. Although the equilibrium temperature during the last five heating cycles was lower than the first one, the lowest equilibrium temperature was only reduced by approximately 2 °C compared to the first, demonstrating excellent electrical heating stability. This indicates that, although the initial heating power decreases after adding CNF, the electrical heating stability of the composite significantly improves, enhancing its overall self-limiting heating performance. This has a significant impact on the practical application of the material and provides a reference solution to the problem of short service life in low-temperature polymer-based PTC materials, suggesting that this material has great potential for use in low-temperature heating and temperature control applications.
- (2)
- Low-temperature environment heating test
In order to test the electrical heating performance of the material in a low-temperature environment where it can freeze, we cut a PVAc0.4/EVA0.6/GP-3wt.%CNF sample to a size of 20 mm × 20 mm, and coated both sides of the sample with silver paste. Then, the sample was covered with copper foil as the electrode, the DC voltage source used before was connected, and the sample was heated at different voltages, and its temperature variation with time was plotted. The graphs were plotted against time. In this experiment, the heating was started from an ambient temperature of about −10 °C.
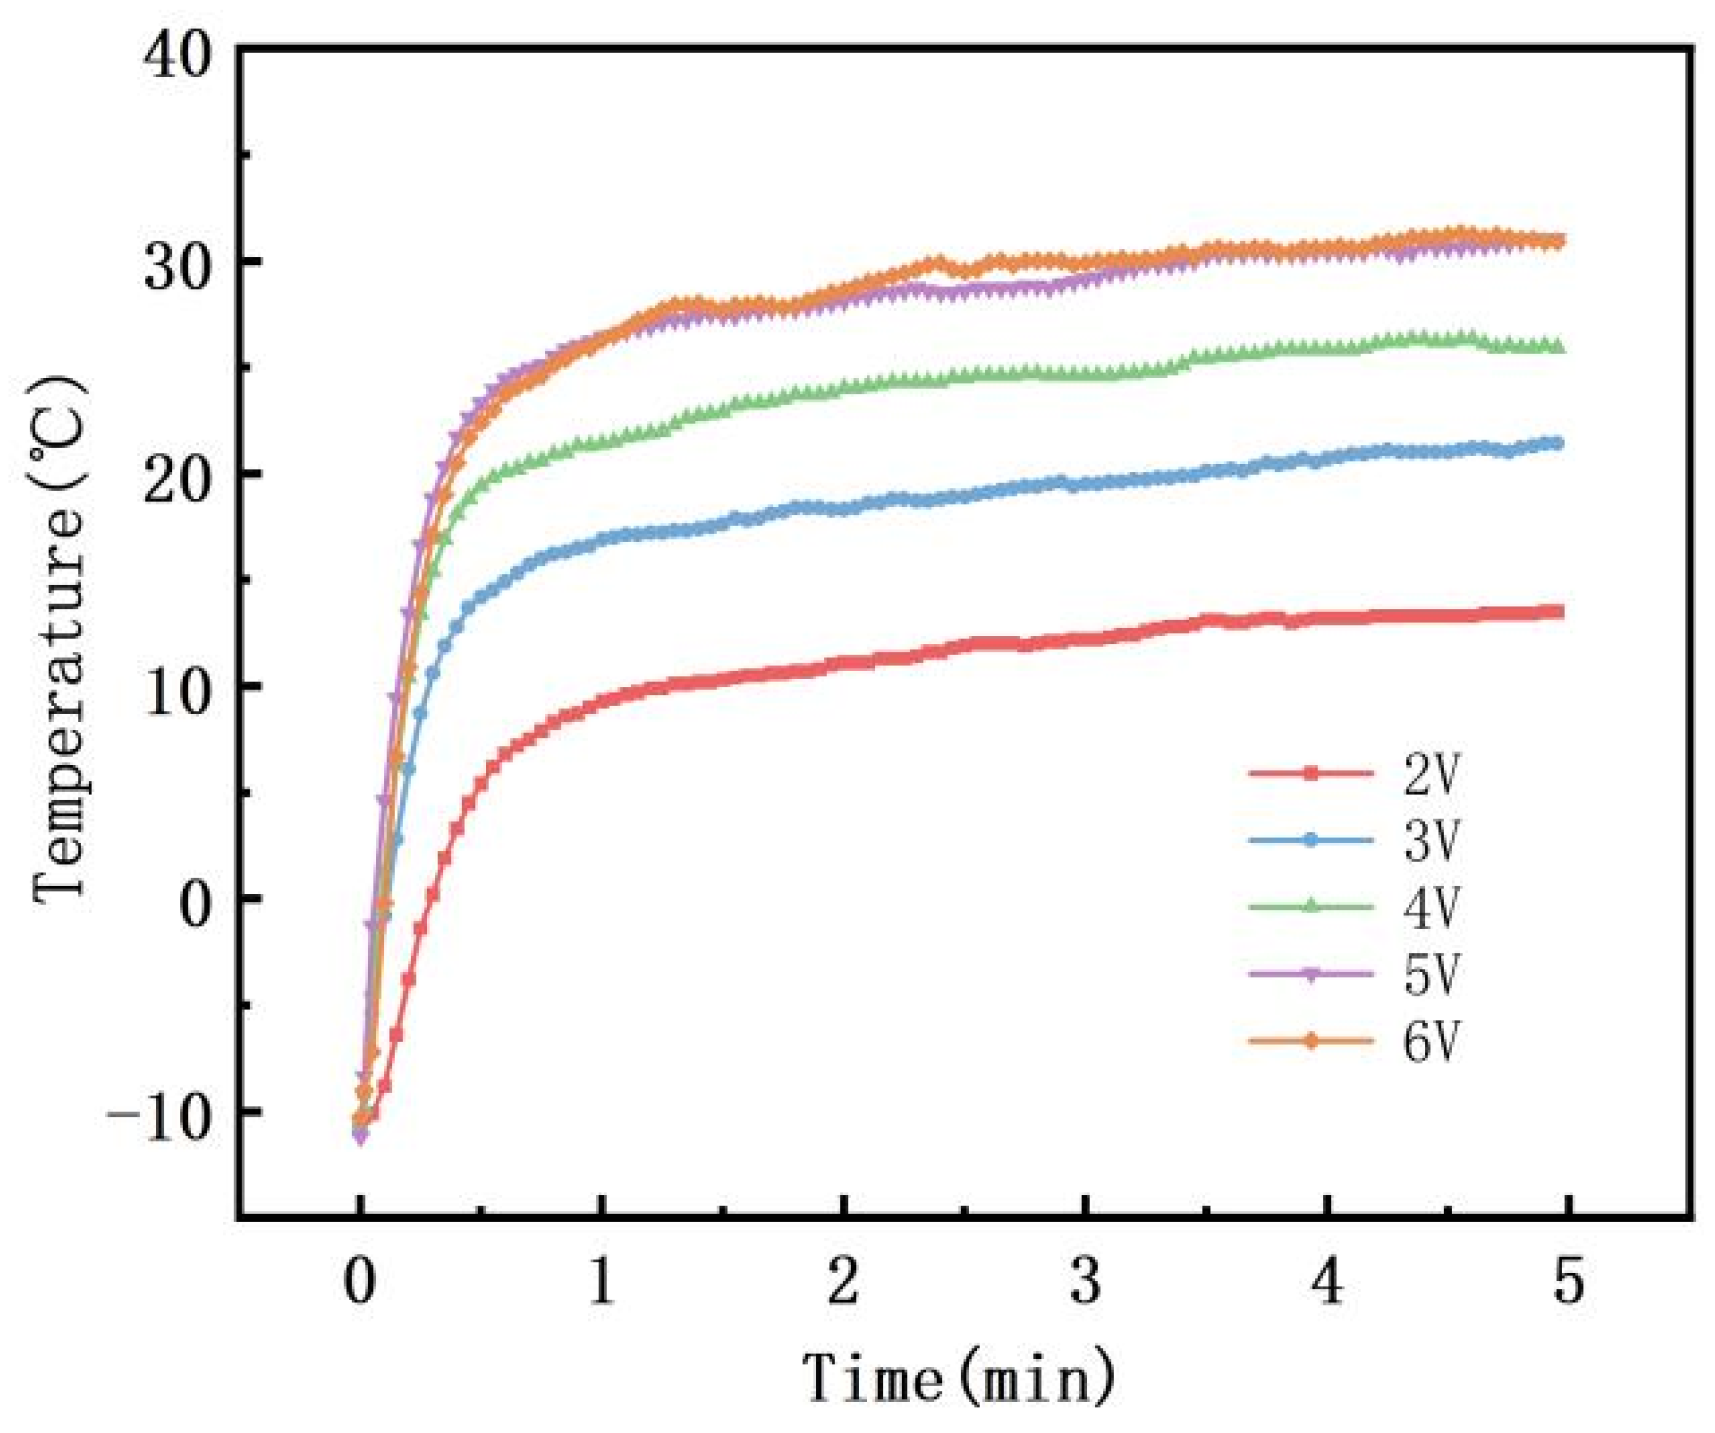
As the applied voltage increased and the heating power density increases, the heating rate and the equilibrium temperature of the sample gradually increase (Figure 9). When the applied voltage is less than 5 V, the sample temperature cannot reach the Curie temperature due to the low heating power. When the applied voltage reaches 5 V and above, it takes only about 1 min to reach the equilibrium temperature and keep it around 30 °C, i.e., it remains stable near the Curie temperature. This equilibrium temperature is lower than the equilibrium temperature achieved at room temperature, as the low-temperature environment accelerates the heat dissipation rate of the material, ultimately resulting in a lower equilibrium temperature. The 5 V and 6 V heating curves are closer and show similar heating patterns. In the initial stage, due to the low resistivity, the heating power is high, resulting in a fast heating rate and rapid temperature rise. However, as the Curie temperature is approached, the resistivity of the material rises significantly, leading to a decrease in heating power and a subsequent decrease in the heating rate, thus maintaining the equilibrium temperature near the Curie temperature. In the subsequent heating process, the resistance fluctuates with temperature, but the heating power is automatically adjusted. The material will automatically reduce the power when overheating and increase the power when cooling, ultimately achieving the self-limiting capability of the material. Given this, at these voltages, PVAc0.4/EVA0.6/GP-3wt.%CNF exhibits good automatic temperature control in low-temperature environments, indicating its potential application in the field of de-icing.
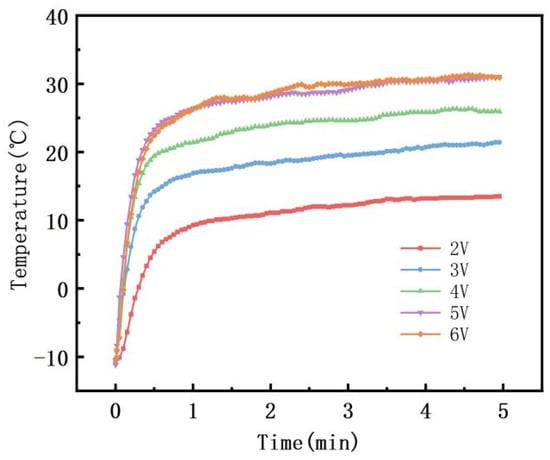
Figure 9.
Electrical heating performance test of PVAc0.4/EVA0.6/GP-3wt.%CNF at different voltages at −10 °C.
- (3)
- Breakage heating test
The heating performance of PVAc0.4/EVA0.6/GP-3wt.%CNF on complex surfaces is shown in Figure 10, with the same upper electrode as in the low temperature environment test. The infrared images of the material in the rectangular, “H”, and “back” heating states are shown in the figure.
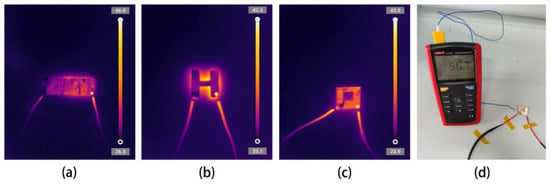
Figure 10.
Infrared imaging of PVAc0.4/EVA0.6/GP-3wt.%CNF composite heated in different states: (a) rectangle; (b) “H” shape; (c) “back” shape; (d) thermocouple test of the surface temperature of the “H” shaped sample.
It is found that the material can be heated successfully in intact, complex, and broken states, and the equilibrium temperature is over 40 °C. Since the surface of the material is covered with a silver paste layer and a copper foil layer, and the metal blocks infrared radiation, the infrared image cannot fully show the internal heat distribution of the material. However, based on the infrared image, the surface and edge of the material are warmer than the ambient temperature (25 °C), indicating that the damaged sample can still be heated normally. Figure 10d shows the surface temperature of the sample directly tested with a thermocouple, reaching 50 °C, which also confirms the heating function of the damaged sample. This is due to the use of a double-sided electrode, and the partial damage of the sample does not affect the heating performance in other areas, demonstrating the reliability of the material in some actual harsh environments. If the heating material is broken due to external factors, this is a fatal issue for conventional metallic heating materials used in aircraft de-icing. The results also demonstrate that this material can be used in applications requiring irregular or complex shapes, where many heating materials have previously been unable to achieve heating on complex surfaces [52,53].
Additional details regarding this Section 3.3 can be found in the Supporting Information (Figure S6 and the related discussions in Supporting Information).
3.4. Effect of Mixed Filler on Mechanical Properties
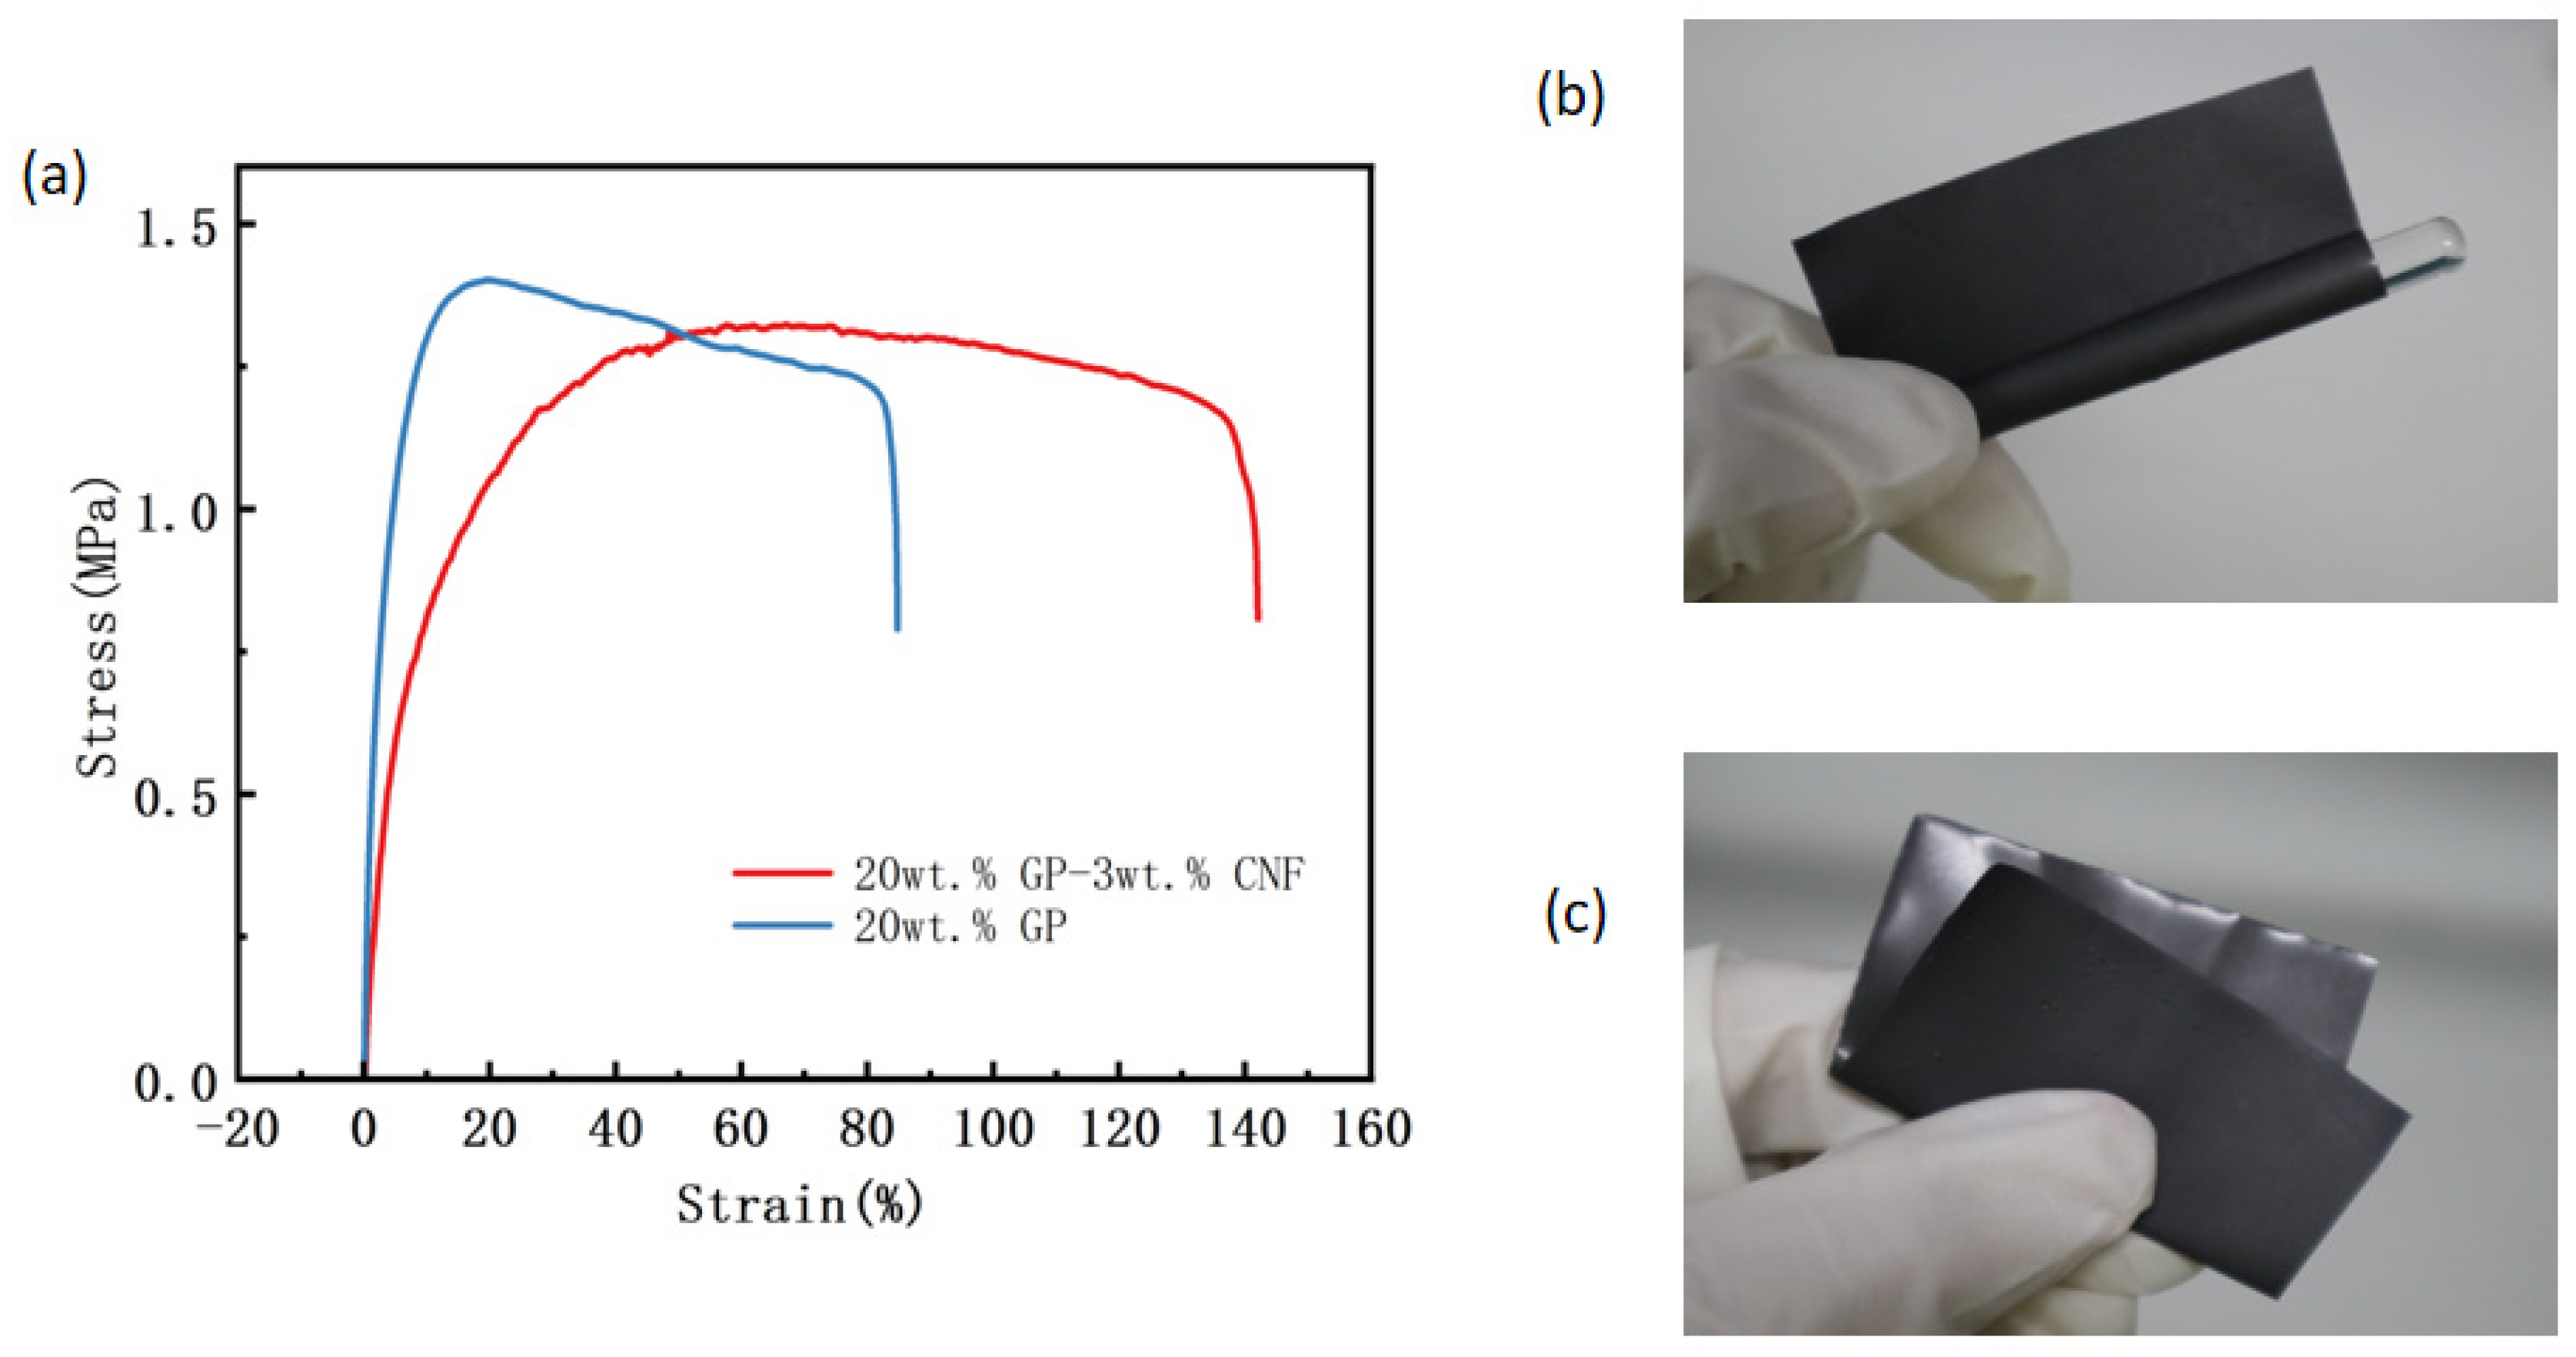
Figure 11a depicts the stress–strain curves of PVAc0.4/EVA0.6/GP and PVAc0.4/EVA0.6/GP-3wt.%CNF. Upon observing the two curves, it is evident that the strain at break of the material increased considerably from 85% to 142% after the addition of 3 wt.% CNF. This indicates a significant enhancement in the ductility of the material following the addition of the second-phase filler, CNF. However, the ultimate tensile strength of the material decreased slightly after the inclusion of CNF, suggesting a reduction in the stress at the onset of necking. The Young’s modulus of PVAc0.4/EVA0.6/GP-3wt.%CNF was calculated to be 9.24 MPa, and the toughness value was 1.68 MJ/m3 (while the Young’s modulus of PVAc0.4/EVA0.6/GP was calculated to be 7.92 MPa and the toughness value was 1.23 MJ/m3). This implies that the stresses required to induce elastic deformation in this material are relatively lower, and the composites with mixed fillers exhibit greater elasticity. Furthermore, the toughness value with the addition of CNF is higher than without it, demonstrating that the hybrid filler also enhances the toughness of the material. In summary, the blending of graphite and CNF fillers appears to have improved the overall mechanical properties of the composite.
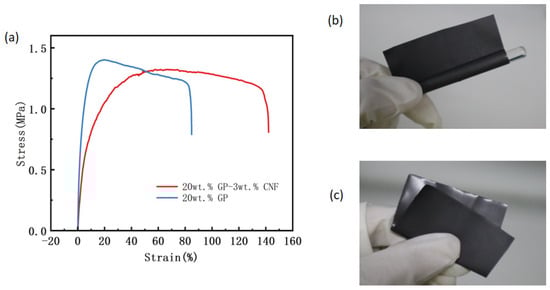
Figure 11.
(a) Stress–strain curves of PVAc0.4/EVA0.6/GP and PVAc0.4/EVA0.6/GP-3wt.%CNF. PVAc0.4/EVA0.6/GP-3wt.%CNF (b) winding around glass rod and (c) folded physical diagram.
Figure 11b,c show the physical images of PVAc0.4/EVA0.6/GP-3wt.%CNF wound and folded around a glass rod with a diameter of 5 mm, respectively, as can be seen from the figures. This film has very good flexibility and can be bent and folded at will, which can be applied to complex shapes or curved surfaces.
4. Conclusions
In this paper, PVAc0.4/EVA0.6/GP composites with varying CNF contents were prepared by incorporating CNF as a secondary conductive filler into the PVAc0.4/EVA0.6/GP composite with the best overall performance. This approach enhanced the stability of the conductive network and the thermal stability of the materials. The study also examined the impact of CNF content on the microscopic morphology, electrical conductivity, and PTC properties of the composites. Additionally, the Joule heating properties and mechanical properties of the optimal composition, PVAc0.4/EVA0.6/GP-3wt.%CNF, were tested at room and low temperatures. The PTC material exhibited a low switching temperature point (<30 °C), low room temperature resistivity (205.4 Ω·m), high PTC repeatability and flexibility, high heating stability and reliability, short heating response time, and excellent adaptive thermal control performance.
Supplementary Materials
The following supporting information can be downloaded at: https://www.mdpi.com/article/10.3390/polym16142028/s1, Figure S1. Cross section SEM images of PVAc0.4/EVA0.6/GP-CNF composites; Figure S2. Cross section SEM images of four different PVAc/EVA/GP composite; Figure S3. EDS diagrams of the two composite materials; Figure S4. Cross section SEM images of PVAc0.4/EVA0.6/GP-CNF composites after heating; Figure S5. FTIR result of PVAc0.4/EVA0.6/GP-CNF composites; Figure S6. (a) Influence of humidity on resistance of the composites, (b) application of the composites as temperature sensor on skin.
Author Contributions
Methodology, C.D.; Formal analysis, J.L.; Investigation, Y.Z.; Data curation, C.Z.; Writing—original draft, C.D.; Visualization, G.F.; Supervision, Y.Y. All authors have read and agreed to the published version of the manuscript.
Funding
This research received no external funding.
Institutional Review Board Statement
Not applicable.
Data Availability Statement
The original contributions presented in the study are included in the article/Supplementary Material, further inquiries can be directed to the corresponding author/s.
Conflicts of Interest
The authors declare no conflict of interest.
References
- Liu, Y.; Zhang, H.; Porwal, H.; Busfield, J.J.; Peijs, T.; Bilotti, E. Pyroresistivity in conductive polymer composites: A perspective on recent advances and new applications. Polym. Int. 2018, 68, 299–305. [Google Scholar] [CrossRef]
- Bautista-Quijano, J.R.; Pötschke, P.; Brunig, H.; Heinrich, G. Strain sensing, electrical and mechanical properties of polycarbonate/multiwall carbon nanotubemonofilament fibers fabricated by melt spinning. Polymer 2016, 82, 181–189. [Google Scholar] [CrossRef]
- Yu, F.; Deng, H.; Zhang, Q.; Wang, K.; Zhang, C.; Chen, F.; Fu, Q. Anisotropic multilayer conductive networks in carbon nanotubes filled polyethylene/polypropylene blends obtained through high speed thin wall injection molding. Polymer 2013, 54, 6425–6436. [Google Scholar] [CrossRef]
- Kim, D.C.; Shim, H.J.; Lee, W.; Koo, J.H.; Kim, D.-H. Material-Based Approaches for the Fabrication of Stretchable Electronics. Adv. Mater. 2020, 32, e1902743. [Google Scholar] [CrossRef] [PubMed]
- Beletskii, E.; Ershov, V.; Danilov, S.; Lukyanov, D.; Alekseeva, E.; Levin, O. Resistivity-Temperature Behavior of Intrinsically Conducting Bis(3-methoxysalicylideniminato)nickel Polymer. Polymers 2021, 12, 2925. [Google Scholar] [CrossRef]
- Liu, Y.; Zhang, H.; Porwal, H.; Tu, W.; Wan, K.; Evans, J.; Newton, M.; Busfield, J.J.C.; Peijs, T.; Bilotti, E. Tailored pyroresistive performance and flexibility by introducing a secondary thermoplastic elastomeric phase into graphene nanoplatelet (GNP) filled polymer composites for self-regulating heating devices. J. Mater. Chem. C 2018, 6, 2760–2768. [Google Scholar] [CrossRef]
- Zhang, L.; Du, W.; Nautiyal, A.; Liu, Z.; Zhang, X. Recent progress on nanostructured conducting polymers and composites: Synthesis, application and future aspects. Sci. China Mater. 2018, 61, 303–352. [Google Scholar] [CrossRef]
- Feng, J.; Chan, C.-M. Positive and negative temperature coefficient effects of an alternating copolymer of tetrafluoroethylene–ethylene containing carbon black-filled HDPE particles. Polymer 2000, 41, 7279–7282. [Google Scholar] [CrossRef]
- Zhang, X.; Zheng, S.; Zheng, X.; Liu, Z.; Yang, W.; Yang, M. Distinct positive temperature coefficient effect of polymer–carbon fiber composites evaluated in terms of polymer absorption on fiber surface. Phys. Chem. Chem. Phys. 2016, 18, 8081–8087. [Google Scholar] [CrossRef]
- Xiang, Z.; Chen, T.; Li, Z.; Bian, X. Negative Temperature Coefficient of Resistivity in Lightweight Conductive Carbon Nanotube/Polymer Composites. Macromol. Mater. Eng. 2009, 294, 91–95. [Google Scholar] [CrossRef]
- Zhang, X.; Zheng, S.; Zou, H.; Zheng, X.; Liu, Z.; Yang, W.; Yang, M. Two-step positive temperature coefficient effect with favorable reproducibility achieved by specific “island-bridge” electrical conductive networks in HDPE/PVDF/CNF composite. Compos. Part A Appl. Sci. Manuf. 2017, 94, 21–31. [Google Scholar] [CrossRef]
- Zhang, R.; Tang, P.; Li, J.; Xu, D.; Bin, Y. Study on filler content dependence of the onset of positive temperature coefficient (PTC) effect of electrical resistivity for UHMWPE/LDPE/CF composites based on their DC and AC electrical behaviors. Polymer 2014, 55, 2103–2112. [Google Scholar] [CrossRef]
- Zha, J.-W.; Li, W.-K.; Liao, R.-J.; Bai, J.; Dang, Z.-M. High performance hybrid carbon fillers/binary–polymer nanocomposites with remarkably enhanced positive temperature coefficient effect of resistance. J. Mater. Chem. A 2013, 1, 843–851. [Google Scholar] [CrossRef]
- Chen, L.; Wu, X.; Zhang, X.-F.; Zhang, J.-M. Enhanced Reproducibility of Positive Temperature Coefficient Effect of CB/HDPE/PVDF Composites with the Addition of Ionic Liquid. Chin. J. Polym. Sci. 2021, 39, 228–236. [Google Scholar] [CrossRef]
- Seo, M.-K.; Rhee, K.-Y.; Park, S.-J. Influence of electro-beam irradiation on PTC/NTC behaviors of carbon blacks/HDPE conducting polymer composites. Curr. Appl. Phys. 2011, 11, 428–433. [Google Scholar] [CrossRef]
- Wang, Y.-H.; Yang, Y.-T. Three-dimensional transient cooling simulations of a portable electronic device using PCM (phase change materials) in multi-fin heat sink. Energy 2011, 36, 5214–5224. [Google Scholar] [CrossRef]
- Etminan, E.; Alimohammadi, M.; Barani, E.; Taheri, A.; Passandideh-Fard, M.; Sardarabadi, M. On the performance of an innovative electronic chipset thermal management module based on energy storage unit concept utilizing nano-additive phase change material (NPCM). J. Energy Storage 2022, 50, 104244. [Google Scholar] [CrossRef]
- Wang, R.-J.; Cheng, W.-L. A novel flexible room temperature positive temperature coefficient material for thermal management. Adv. Compos. Hybrid Mater. 2019, 2, 83–92. [Google Scholar] [CrossRef]
- Jeon, J.; Lee, H.-B.-R.; Bao, Z. Flexible Wireless Temperature Sensors Based on Ni Microparticle-Filled Binary Polymer Composites. Adv. Mater. 2013, 25, 850–855. [Google Scholar] [CrossRef]
- Lai, F.; Wang, B.; Zhang, P. Enhanced positive temperature coefficient in amorphous PS/CSPE-MWCNT composites with low percolation threshold. J. Appl. Polym. Sci. 2019, 136, 47053. [Google Scholar] [CrossRef]
- Yu, A.; Li, Q. Studies on preparation and thermal control behavior of hybrid fillers/binary-polymer composites with positive temperature coefficient characteristic. Sci. China Technol. Sci. 2021, 64, 1447–1458. [Google Scholar] [CrossRef]
- Cheng, W.-L.; Yuan, S.; Song, J.-L. Studies on preparation and adaptive thermal control performance of novel PTC (positive temperature coefficient) materials with controllable Curie temperatures. Energy 2014, 74, 447–454. [Google Scholar] [CrossRef]
- Luo, X.L.; Schubert, D.W. Positive temperature coefficient (PTC) materials based on amorphous poly (methyl methacrylate) with ultrahigh PTC intensity, tunable switching temperature and good reproducibility. Mater. Today Commun. 2022, 30, 103078. [Google Scholar] [CrossRef]
- Chen, L.; Zhang, J. Designs of conductive polymer composites with exceptional reproducibility of positive temperature coefficient effect: A review. J. Appl. Polym. Sci. 2021, 138, 49677. [Google Scholar] [CrossRef]
- Liu, P.; Liu, J.; Zhu, X.; Wu, C.; Liu, Y.; Pan, W.; Zhao, J.; Guo, X.; Liu, C.; Huang, Y.; et al. A highly adhesive flexible strain sensor based on ultra-violet adhesive filled by graphene and carbon black for wearable monitoring. Compos. Sci. Technol. 2019, 192, 107771. [Google Scholar] [CrossRef]
- Duy, L.T.; Trung, T.Q.; Hanif, A.; Siddiqui, S.; Roh, E.; Lee, W.; Lee, N.-E. A stretchable and highly sensitive chemical sensor using multilayered network of polyurethane nanofibres with self-assembled reduced graphene oxide. 2D Mater. 2017, 4, 025062. [Google Scholar] [CrossRef]
- Yokota, T.; Inoue, Y.; Terakawa, Y.; Reeder, J.; Kaltenbrunner, M.; Ware, T.; Yang, K.; Mabuchi, K.; Murakawa, T.; Sekino, M.; et al. Ultraflexible, large-area, physiological temperature sensors for multipoint measurements. Proc. Natl. Acad. Sci. USA 2015, 112, 14533–14538. [Google Scholar] [CrossRef]
- Zhang, Q.-H.; Chen, D.-J. Percolation threshold and morphology of composites of conducting carbon black/polypropylene/EVA. J. Mater. Sci. 2004, 39, 1751–1757. [Google Scholar] [CrossRef]
- Li, J.; Chang, C.; Li, X.; Li, Y.; Guan, G. A New Thermal Controlling Material with Positive Temperature Coefficient for Body Warming: Preparation and Characterization. Materials 2019, 12, 1758. [Google Scholar] [CrossRef]
- Yu, Y.; Jiang, S.; Zhou, W.; Miao, X.; Zeng, Y.; Zhang, G.; Zhang, Y.; Zhang, Q.; Zhao, H. Ultrafast room temperature wiping-rubbing fabrication of graphene nanosheets as flexible transparent conductive films with high surface stability. Appl. Phys. Lett. 2009, 101, 023119. [Google Scholar] [CrossRef]
- Jara, A.D.; Betemariam, A.; Woldetinsae, G.; Kim, J.Y. Purification, application and current market trend of natural graphite: A review. Int. J. Min. Sci. Technol. 2019, 29, 671–689. [Google Scholar] [CrossRef]
- Chehreh Chelgani, S.; Rudolph, M.; Kratzsch, R.; Sandmann, D.; Gutzmer, J. A Review of Graphite Beneficiation Techniques. Miner. Process. Extr. Met. Rev. 2016, 37, 58–68. [Google Scholar] [CrossRef]
- Zhao, Z.; Chen, H.; Liu, X.; Wang, Z.; Zhu, Y.; Zhou, Y. The development of electric heating coating with temperature controlling capability for anti-icing/de-icing. Cold Reg. Sci. Technol. 2021, 184, 103234. [Google Scholar] [CrossRef]
- Liu, K.; Xu, Z.; Mei, J.; Han, J.; Zheng, F.; Wang, H.; Huang, Y.; Wu, Q.; Qin, G.; Jiang, J.; et al. Strategies for improving positive temperature effects in conductive polymer composites—A review. J. Mater. Chem. C 2023, 11, 4966–4992. [Google Scholar] [CrossRef]
- Zha, J.-W.; Wu, D.-H.; Yang, Y.; Wu, Y.-H.; Li, R.K.Y.; Dang, Z.-M. Enhanced positive temperature coefficient behavior of the high-density polyethylene composites with multi-dimensional carbon fillers and their use for temperature-sensing resistors. RSC Adv. 2017, 7, 11338–11344. [Google Scholar] [CrossRef]
- Chen, L.; Hou, J.; Chen, Y.; Wang, H.; Duan, Y.; Zhang, J. Synergistic effect of conductive carbon black and silica particles for improving the pyroresistive properties of high density polyethylene composites. Compos. Part B Eng. 2019, 178, 107465. [Google Scholar] [CrossRef]
- Mamunya, Y.; Maruzhenko, O.; Kolisnyk, R.; Iurzhenko, M.; Pylypenko, A.; Masiuchok, O.; Godzierz, M.; Krivtsun, I.; Trzebicka, B.; Pruvost, S. Pyroresistive Properties of Composites Based on HDPE and Carbon Fillers. Polymers 2023, 15, 2105. [Google Scholar] [CrossRef] [PubMed]
- Jiang, Y.; Liu, L.; Yan, J.; Wu, Z. Room-to-low temperature thermo-mechanical behavior and corresponding constitutive model of liquid oxygen compatible epoxy composites. Compos. Sci. Technol. 2024, 245, 110357. [Google Scholar] [CrossRef]
- Li, H.; Zhang, Y.; Tai, Y.; Zhu, X.; Qi, X.; Zhou, L.; Li, Z.; Lan, H. Flexible transparent electromagnetic interference shielding films with silver mesh fabricated using electric-field-driven microscale 3D printing. Opt. Laser Technol. 2022, 148, 107717. [Google Scholar] [CrossRef]
- Deng, H.; Skipa, T.; Zhang, R.; Lellinger, D.; Bilotti, E.; Alig, I.; Peijs, T. Effect of melting and crystallization on the conductive network in conductive polymer composites. Polymer 2009, 50, 3747–3754. [Google Scholar] [CrossRef]
- Ma, L.-F.; Bao, R.-Y.; Dou, R.; Liu, Z.-Y.; Yang, W.; Xie, B.-H.; Yang, M.-B.; Fu, Q. A high-performance temperature sensitive TPV/CB elastomeric composite with balanced electrical and mechanical properties via PF-induced dynamic vulcanization. J. Mater. Chem. A 2014, 2, 16989–16996. [Google Scholar] [CrossRef]
- Xu, H.-P.; Dang, Z.-M.; Jiang, M.-J.; Yao, S.-H.; Bai, J. Enhanced dielectric properties and positive temperature coefficient effect in the binary polymer composites with surface modified carbon black. J. Mater. Chem. 2008, 18, 229–234. [Google Scholar] [CrossRef]
- Liu, Y.; Zhang, H.; Porwal, H.; Tu, W.; Evans, J.; Newton, M.; Busfield, J.J.C.; Peijs, T.; Bilotti, E. Universal Control on Pyroresistive Behavior of Flexible Self-Regulating Heating Devices. Adv. Funct. Mater. 2017, 27, 1702253. [Google Scholar] [CrossRef]
- He, X.J.; Du, J.H.; Ying, Z.; Cheng, H.M. Positive temperature coefficient effect in multiwalled carbon nanotube/high-density polyethylene composites. Appl. Phys. Lett. 2005, 86, 062112. [Google Scholar] [CrossRef]
- Göldel, A.; Marmur, A.; Kasaliwal, G.R.; Pötschke, P.; Heinrich, G. Shape-Dependent Localization of Carbon Nanotubes and Carbon Black in an Immiscible Polymer Blend during Melt Mixing. Macromolecules 2011, 44, 6094–6102. [Google Scholar] [CrossRef]
- Wu, S. Polymer Interface and Adhesion, 1st ed.; M. Dekker: New York, NY, USA, 1982. [Google Scholar]
- Sumita, M.; Sakata, K.; Asai, S.; Miyasaka, K.; Nakagawa, H. Dispersion of fillers and the electrical conductivity of polymer blends filled with carbon black. Polym. Bull. 1991, 25, 265–271. [Google Scholar] [CrossRef]
- Wu, S. Polar and Nonpolar Interactions in Adhesion. J. Adhes. 1973, 5, 39–55. [Google Scholar] [CrossRef]
- Wu, S.; Li, T.; Tong, Z.; Chao, J.; Zhai, T.; Xu, J.; Yan, T.; Wu, M.; Xu, Z.; Bao, H.; et al. High-Performance Thermally Conductive Phase Change Composites by Large-Size Oriented Graphite Sheets for Scalable Thermal Energy Harvesting. Adv. Mater. 2019, 31, e1905099. [Google Scholar] [CrossRef]
- Zhao, S.G.; Li, G.J.; Liu, H.; Dai, K.; Zheng, G.Q.; Yan, X.R.; Liu, C.; Chen, J.; Shen, C.; Guo, Z. Positive temperature coefficient (ptc) evolution of segregated structural conductive polypropylene nanocomposites with visually traceable carbon black conductive network. Adv. Mater. Interfaces 2017, 4, 10. [Google Scholar] [CrossRef]
- Dai, K.; Zhang, Y.C.; Tang, J.H.; Ji, X.; Li, Z.M. Anomalous attenuation and structural origin of positive temperature coefficient (PTC) effect in a carbon black (CB)/poly(ethylene terephthalate) (PET)/polyethylene (PE) electrically conductive microfibrillar polymer composite with a preferential CB distribution. J. Appl. Polym. Sci. 2012, 125, E561–E570. [Google Scholar]
- Yao, X.; Falzon, B.; Hawkins, S.; Tsantzalis, S. Aligned carbon nanotube webs embedded in a composite laminate: A route towards a highly tunable electro-thermal system. Carbon 2018, 129, 486–494. [Google Scholar] [CrossRef]
- Liu, X.; Chen, H.; Zhao, Z.; Yan, Y.; Zhang, D. Slippery liquid-infused porous electric heating coating for anti-icing and de-icing applications. Surf. Coatings Technol. 2019, 374, 889–896. [Google Scholar] [CrossRef]


Disclaimer/Publisher’s Note: The statements, opinions and data contained in all publications are solely those of the individual author(s) and contributor(s) and not of MDPI and/or the editor(s). MDPI and/or the editor(s) disclaim responsibility for any injury to people or property resulting from any ideas, methods, instructions or products referred to in the content. |
© 2024 by the authors. Licensee MDPI, Basel, Switzerland. This article is an open access article distributed under the terms and conditions of the Creative Commons Attribution (CC BY) license (https://creativecommons.org/licenses/by/4.0/).