Study on Preparation and Performance of Acid pH-Responsive Intelligent Self-Healing Coating


Abstract
:1. Introduction
2. Experimental
2.1. Materials
2.2. Preparation of Microcapsules
- (1)
- Preparation of microcapsules: We added 300 mL deionized water, 5 g polyvinyl alcohol solution with a concentration of 5 wt%, 5 g urea, 0.5 g resorcinol, and 0.5 g ammonium chloride into a 500 mL beaker. We used a glass stirring rod to stir the mixture. After all substances were dissolved, the pH of the solution was adjusted to 3.0 using hydrochloric acid at a concentration of 1 wt%. We mixed 20 mL of linseed oil and ground benzotriazole together in an ultrasonic water bath for 10 min to mix the two evenly. The mixture was then poured into a beaker and the solution was mechanically stirred for 10 min at room temperature. When the solution was in a stable state, we slowly heated the solution to 55 °C in a water bath. We slowly added 12.67 g of formaldehyde aqueous solution with a concentration of 37 wt% into the solution and continued stirring at a speed of 500 r/min for 240 min. The suspension obtained by the reaction was cooled to room temperature and washed with deionized water, absolute ethanol, and acetone in sequence, and the prepared microcapsules were collected.
- (2)
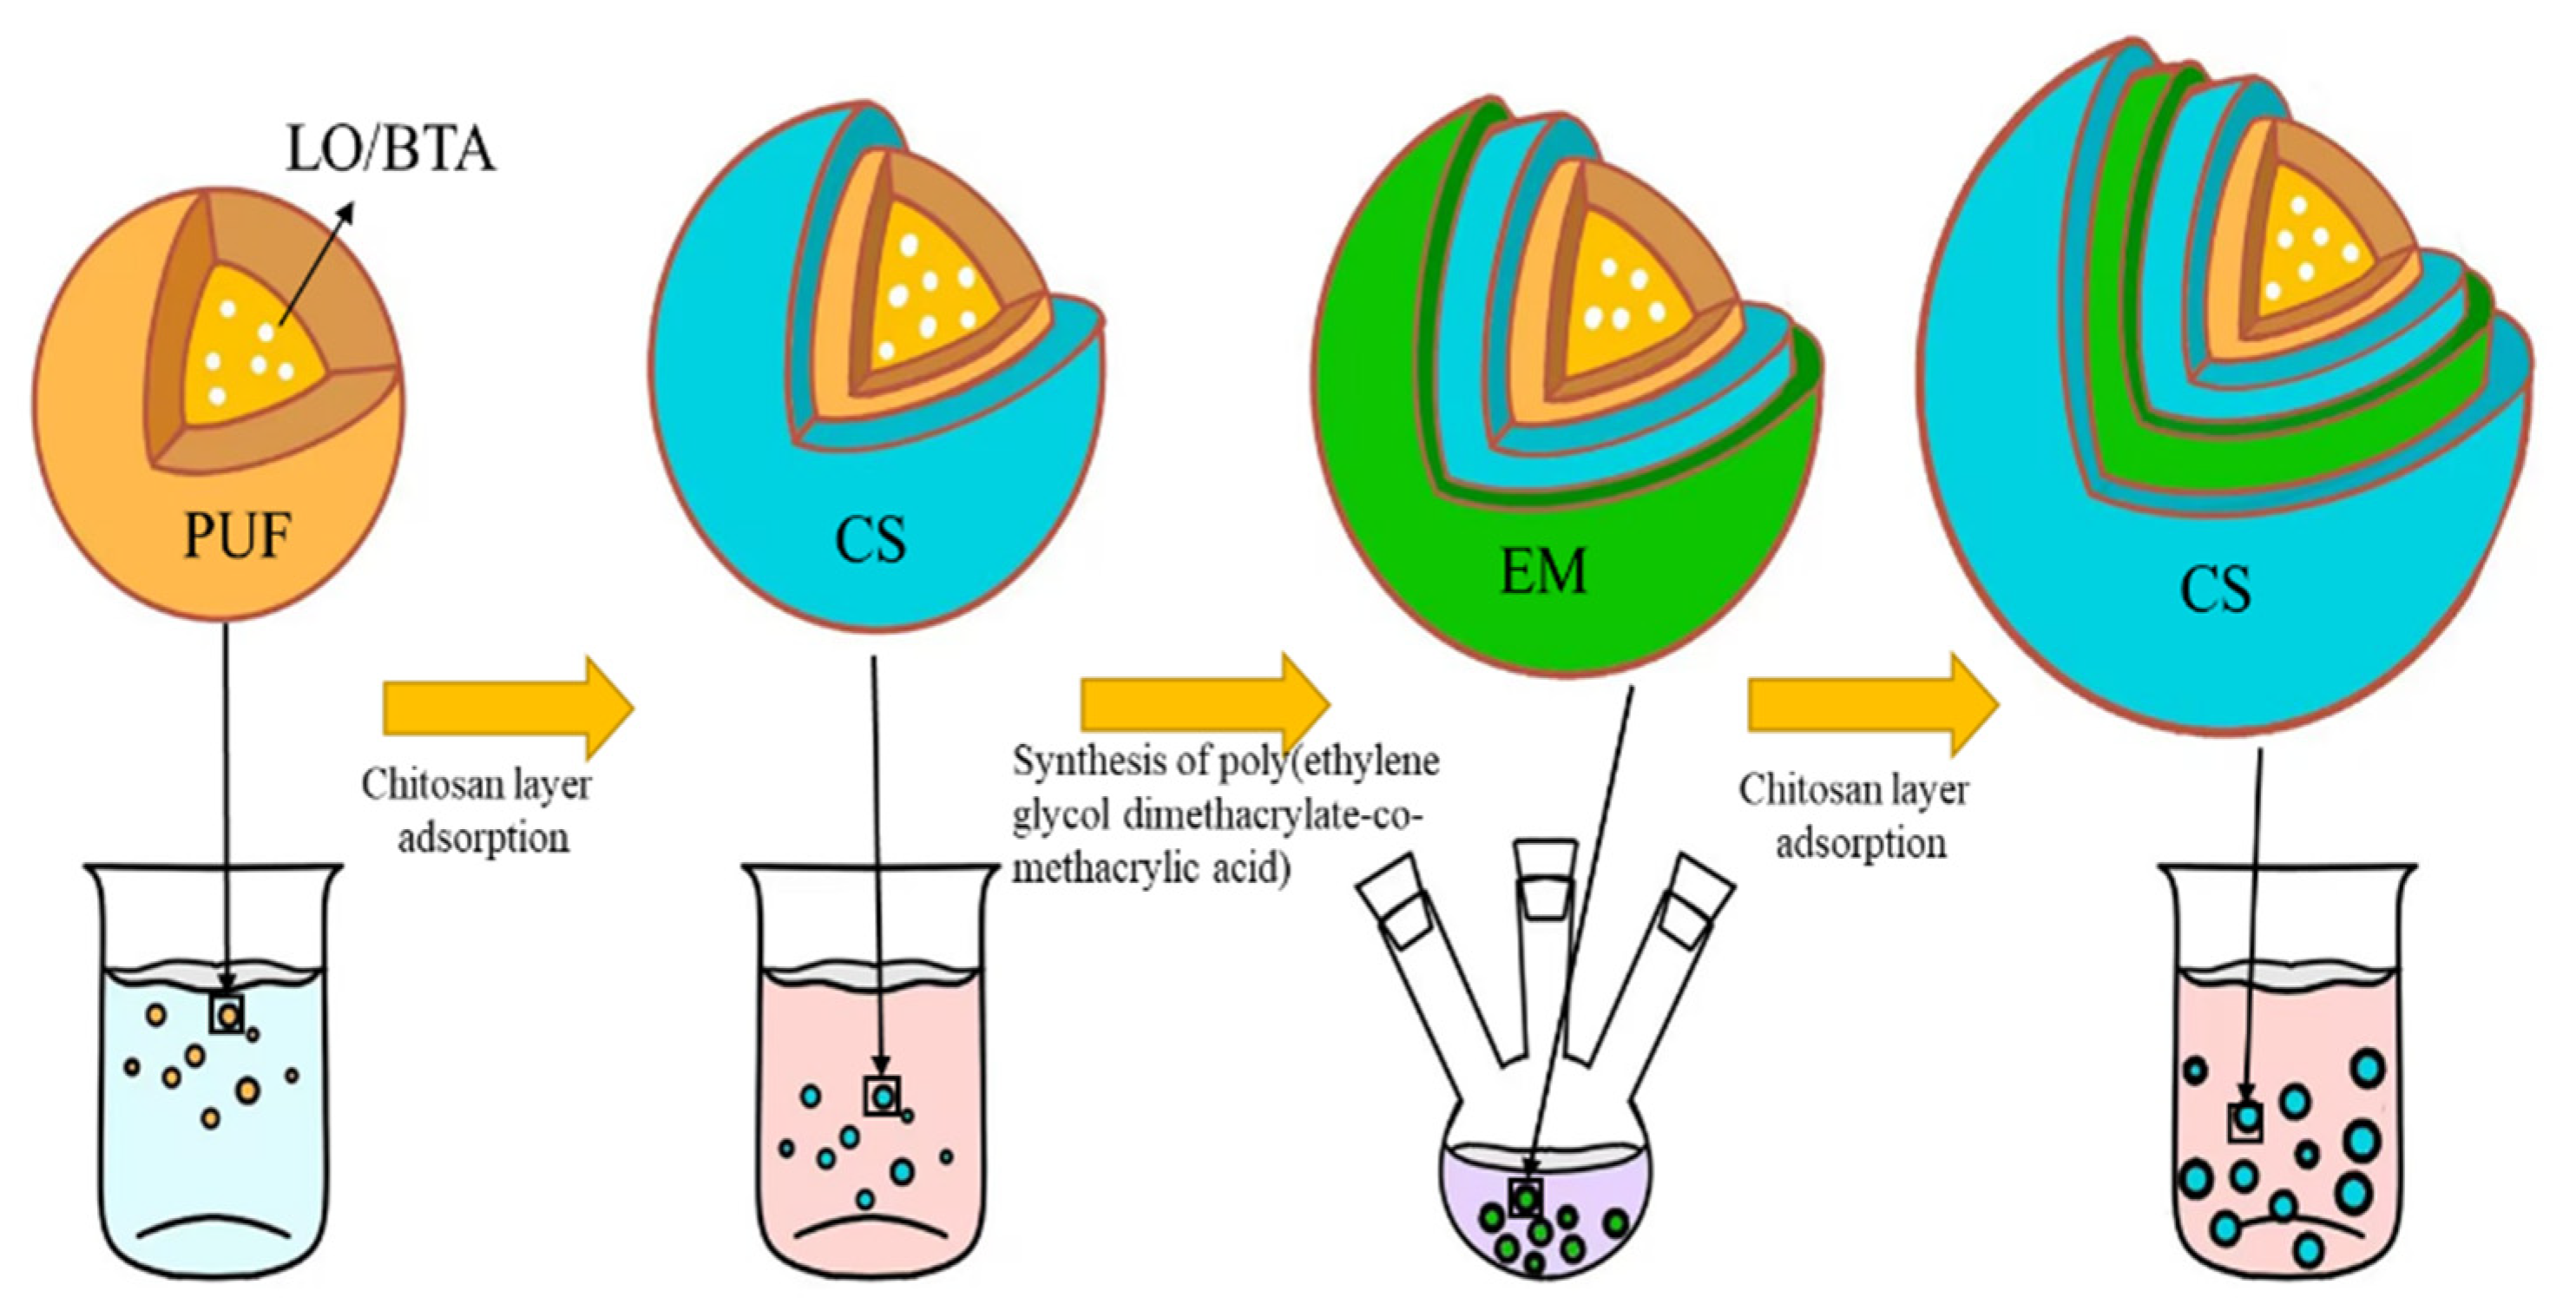
- Construct the polyelectrolyte layer: The chitosan clarification solution with a concentration of 1.5 mg/mL was prepared first. We dispersed the microcapsules in 25 mL of chitosan solution with a concentration of 1.5 mg/mL and soaked them at 30 °C for 20 min. We added the microcapsules to a three-neck round-bottomed flask and added 5 mL of acetonitrile and 0.0068 g of α-methacrylic acid. We sealed the three ports of the flask and stirred magnetically at room temperature for 30 min. Afterwards, 5 mg of free radical initiator 2,2′-azobisisobutyronitrile and 0.0495 g of cross-linking agent ethylene glycol dimethacrylate were added to the solution, and stirring was continued for 30 min. The mixture was heated in a water bath at 60 °C for 8 h under a nitrogen atmosphere to form poly(ethylene glycol dimethacrylate-co-methacrylic acid) (EM). After cleaning the microcapsules with deionized water and ethanol, we added 25 mL of chitosan solution and soaked them at 30 °C for 20 min to obtain acidic pH-responsive microcapsules. Figure 1 is a schematic diagram of the process and structure of the microcapsules prepared in this experiment.
2.3. Preparation of Acidic pH-Responsive Self-Healing Coatings
2.4. Characterization
2.4.1. Characterization of Microcapsules
- (1)
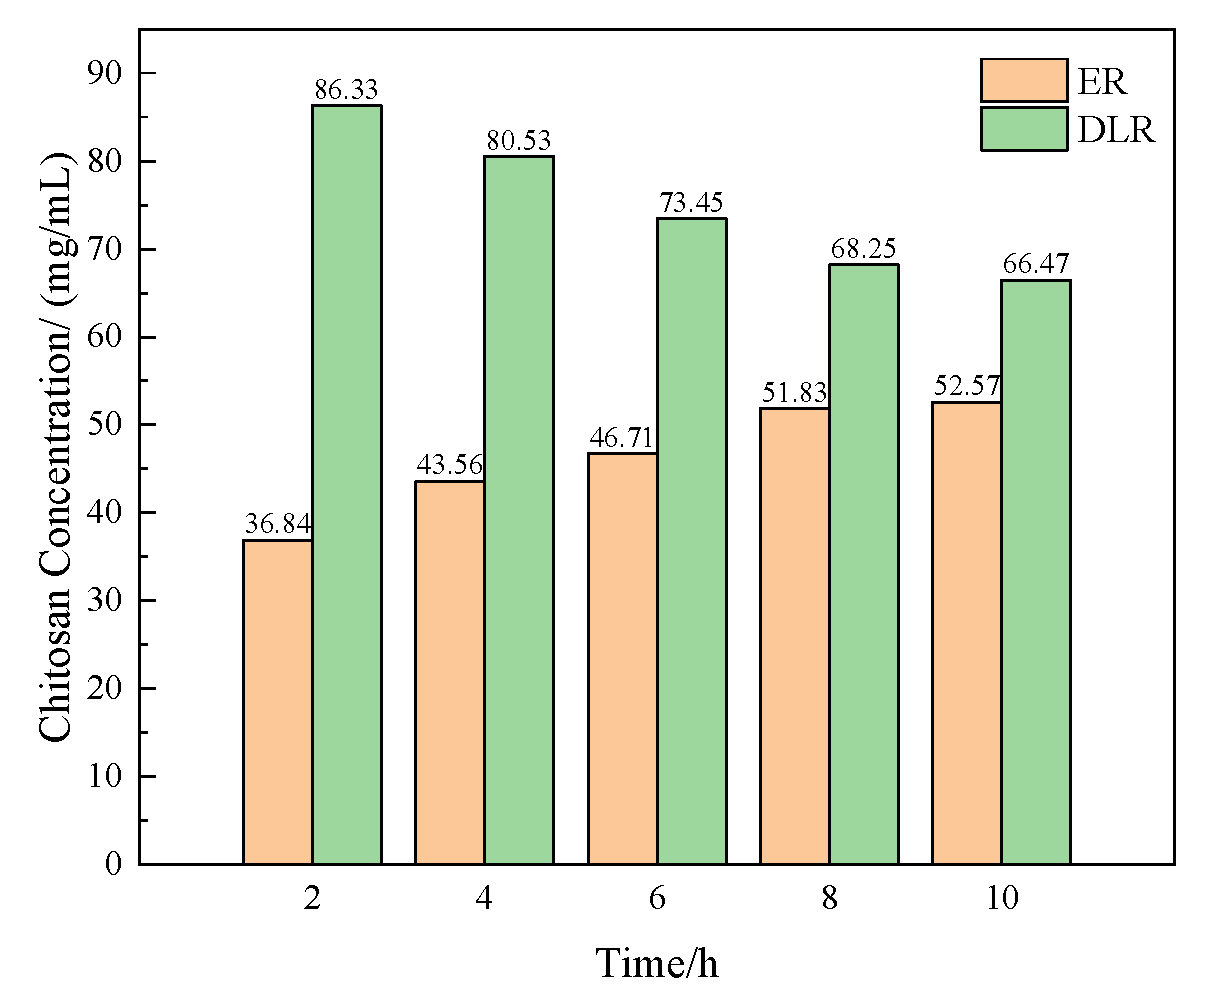
- Calculation of encapsulation efficiency and drug loading efficiency
- (2)
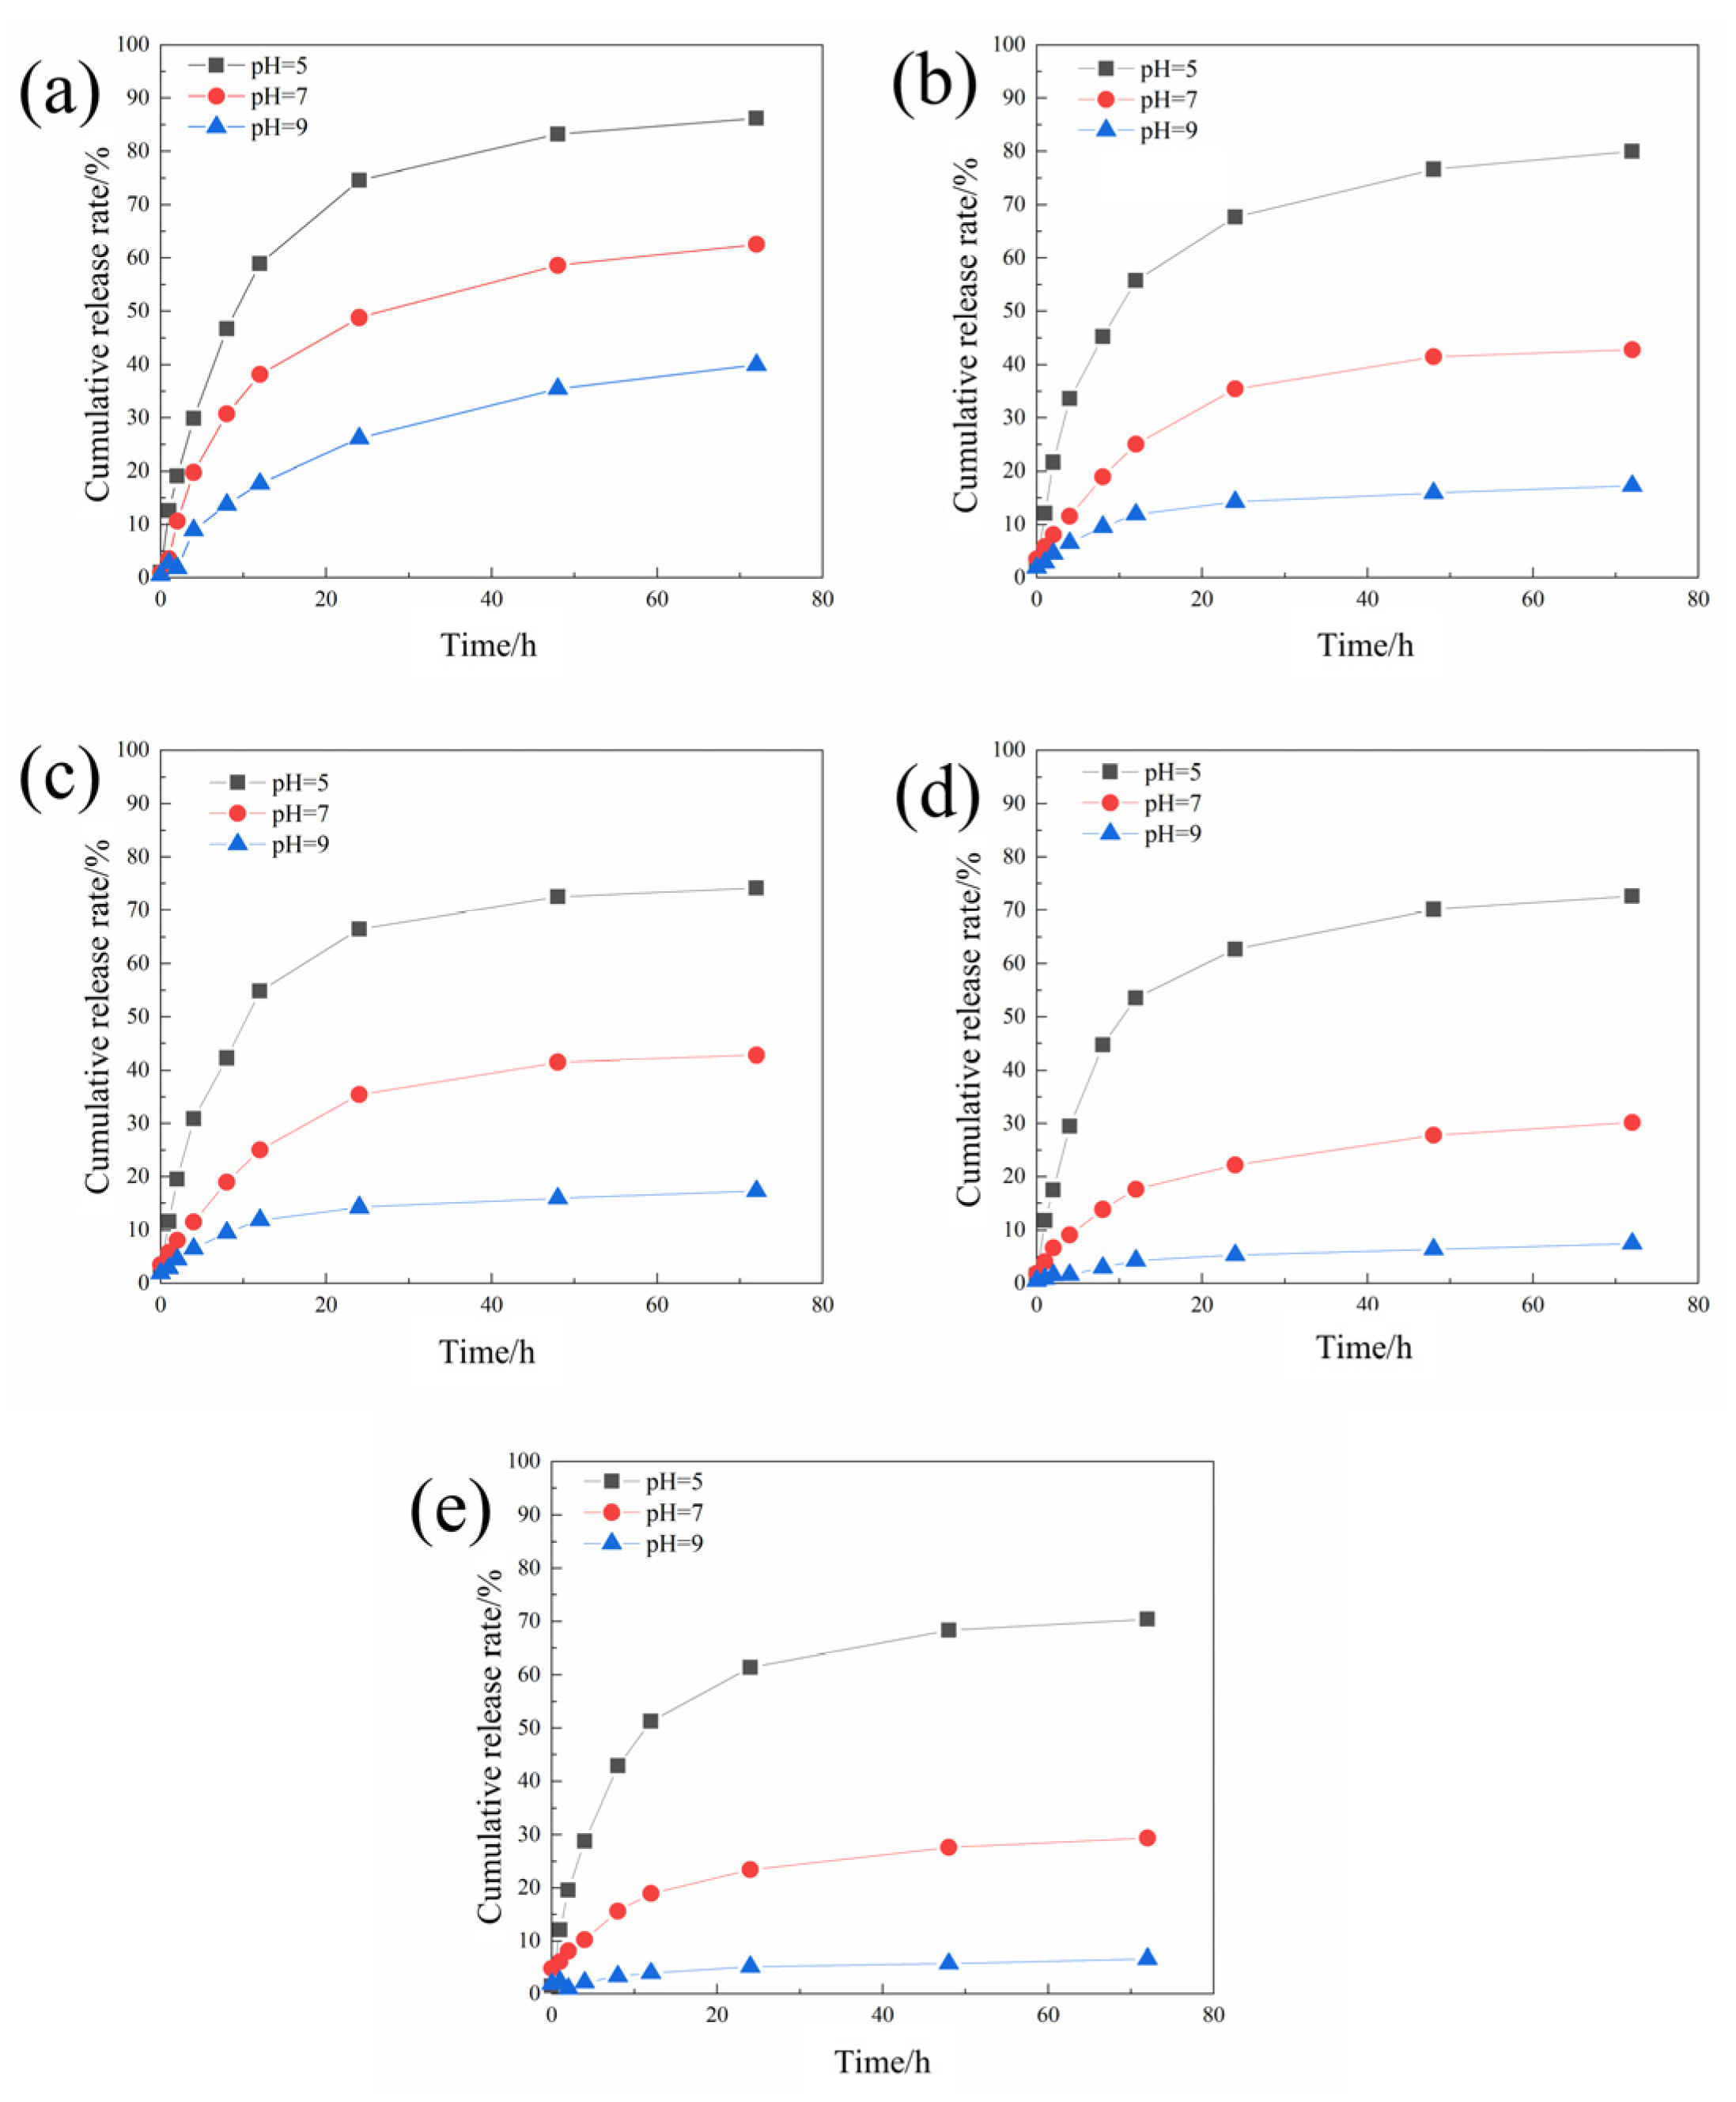
- Test method for sustained release curve
- (3)
- Morphological observation
- (4)
- Fourier transform infrared spectroscopy test (FTIR)
- (5)
- Thermogravimetric analysis (TGA)
- (6)
- Zeta potential test
2.4.2. Characterization of Self-Healing Properties of Coatings
2.4.3. Characterization of Anti-Corrosion Properties of Coatings
- (1)
- Salt spray test
- (2)
- Electrochemical testing
3. Results and Discussion
3.1. Optimization of Microcapsule Preparation Process
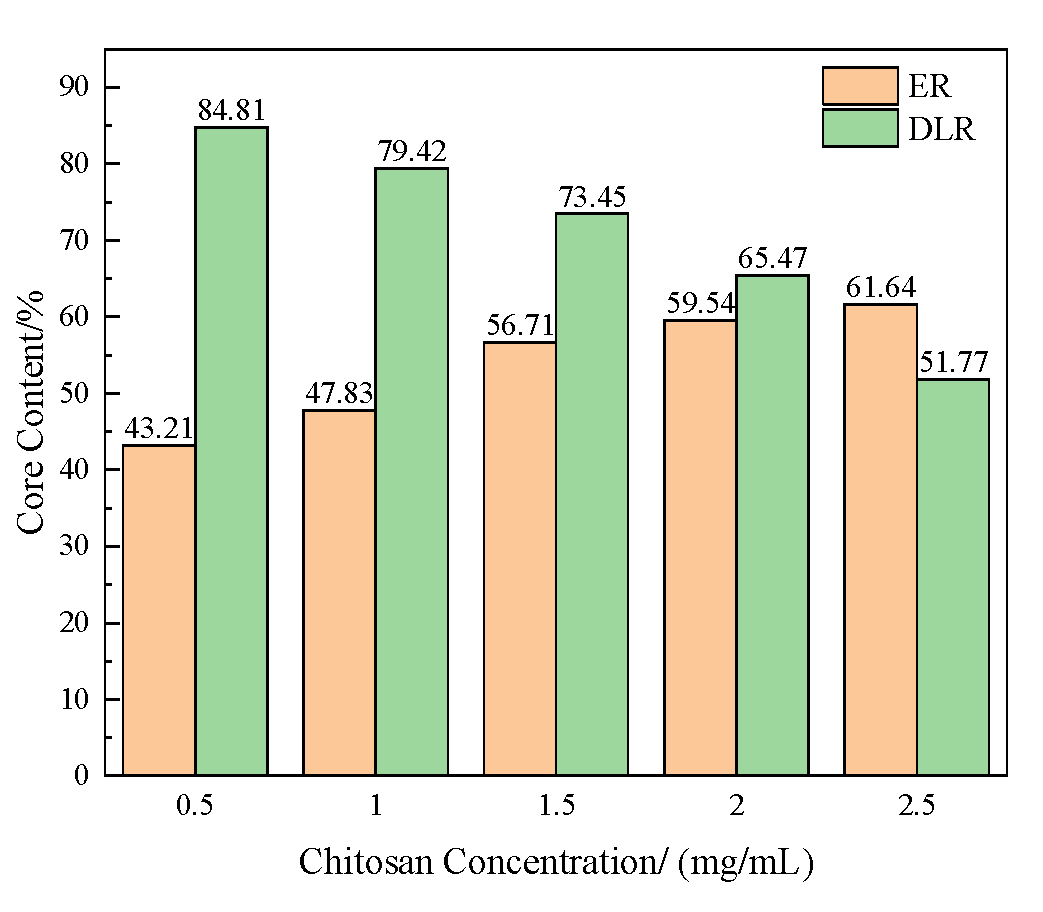
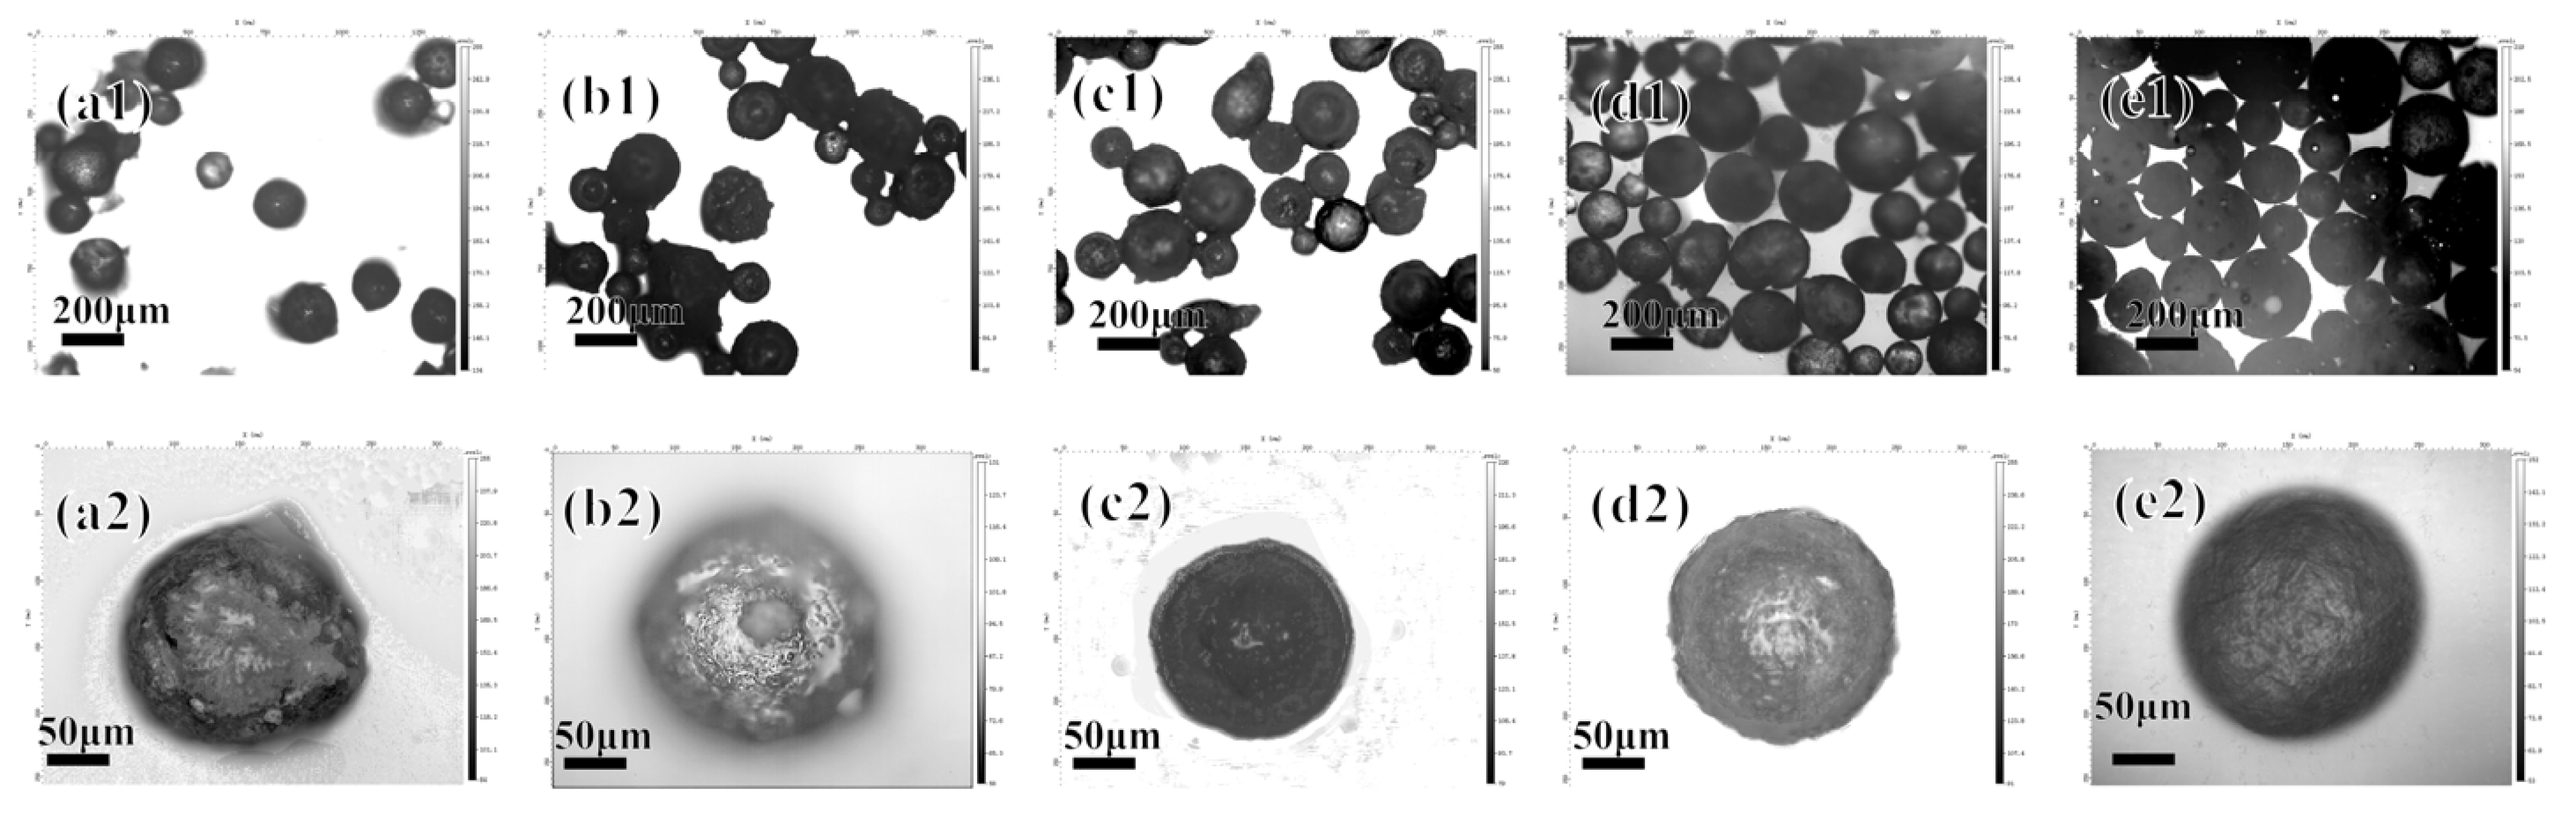
3.1.1. Effect of Chitosan Concentration on Microcapsules
3.1.2. Effect of Polymerization Time on Microcapsules
3.1.3. Effect of Heating Temperature during Polymerization on Microcapsules
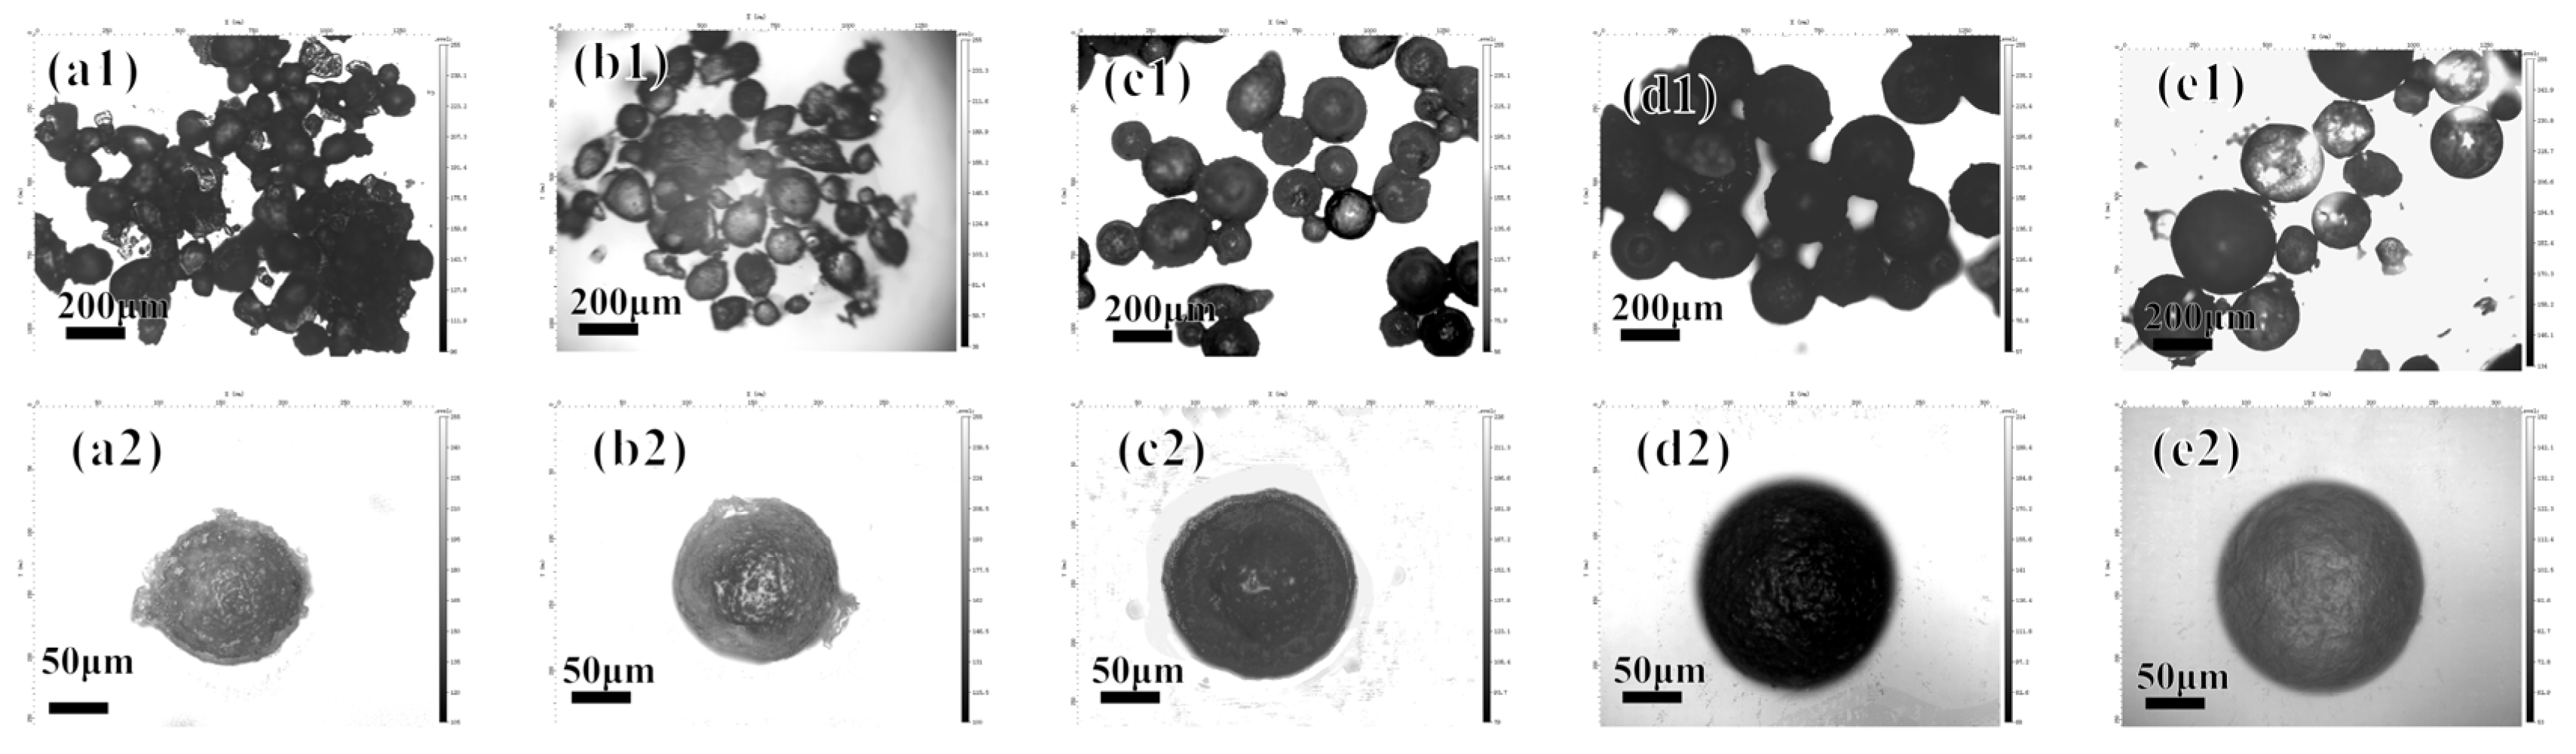
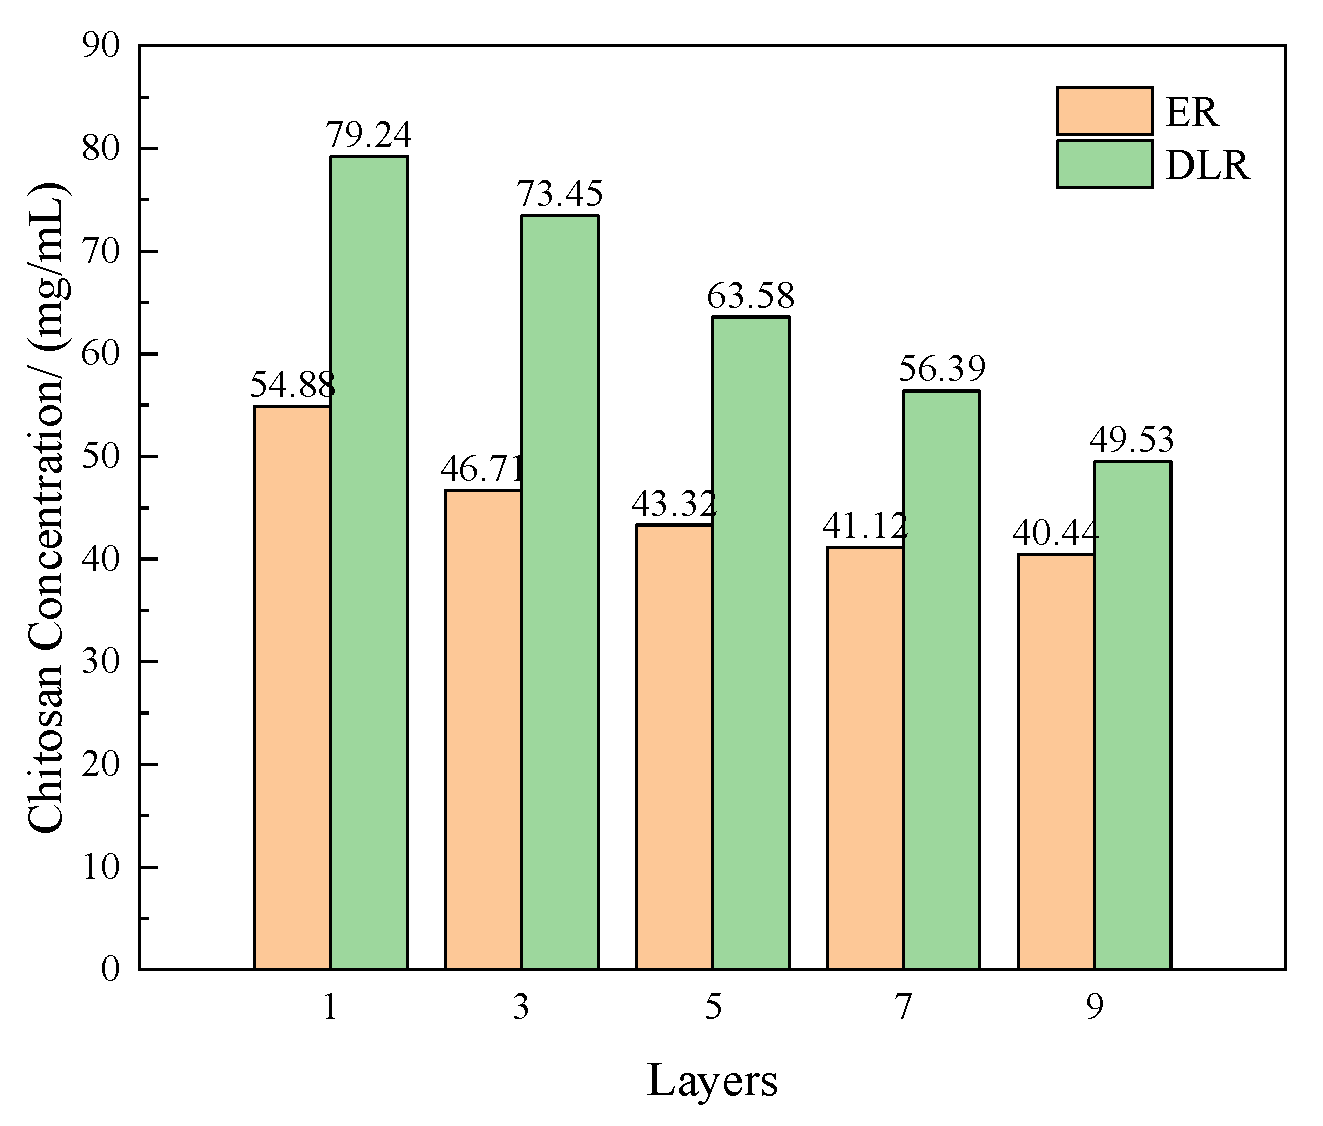
3.1.4. Effect of Number of Polyelectrolyte Layers on Microcapsules
3.2. Properties of Microcapsules
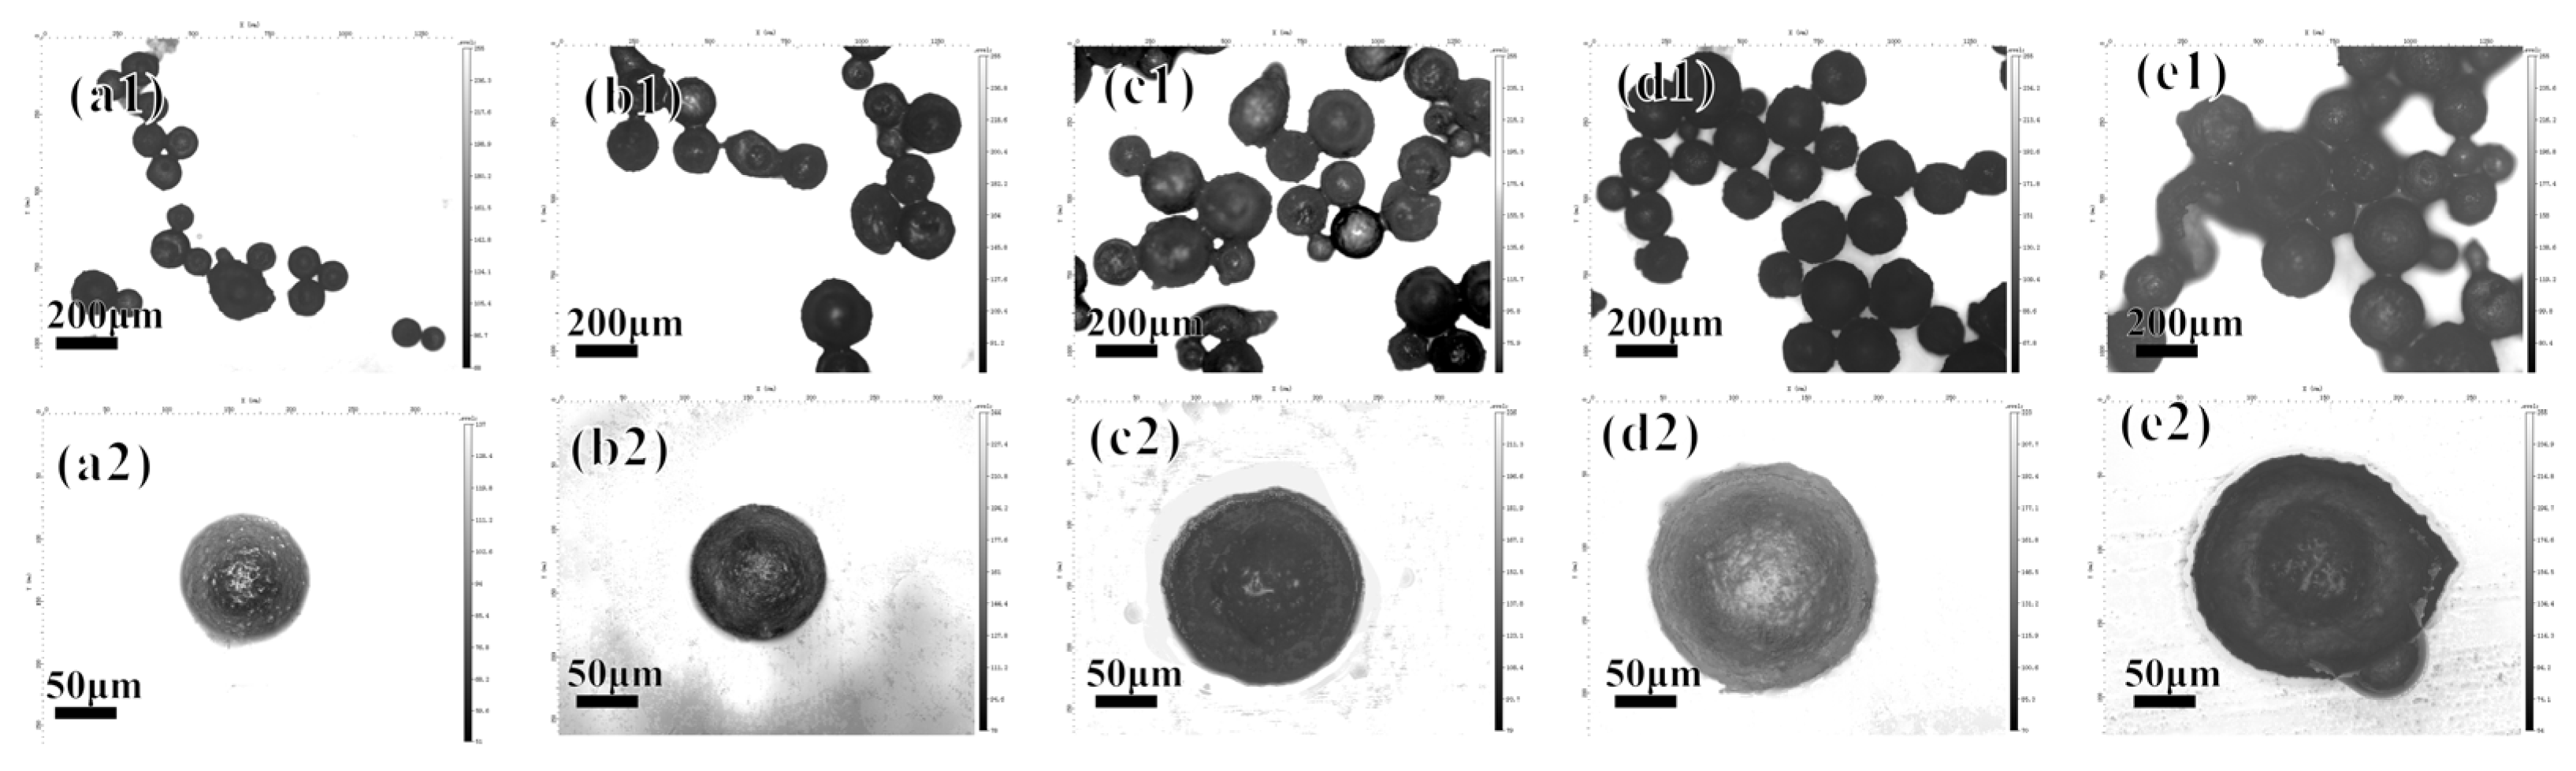
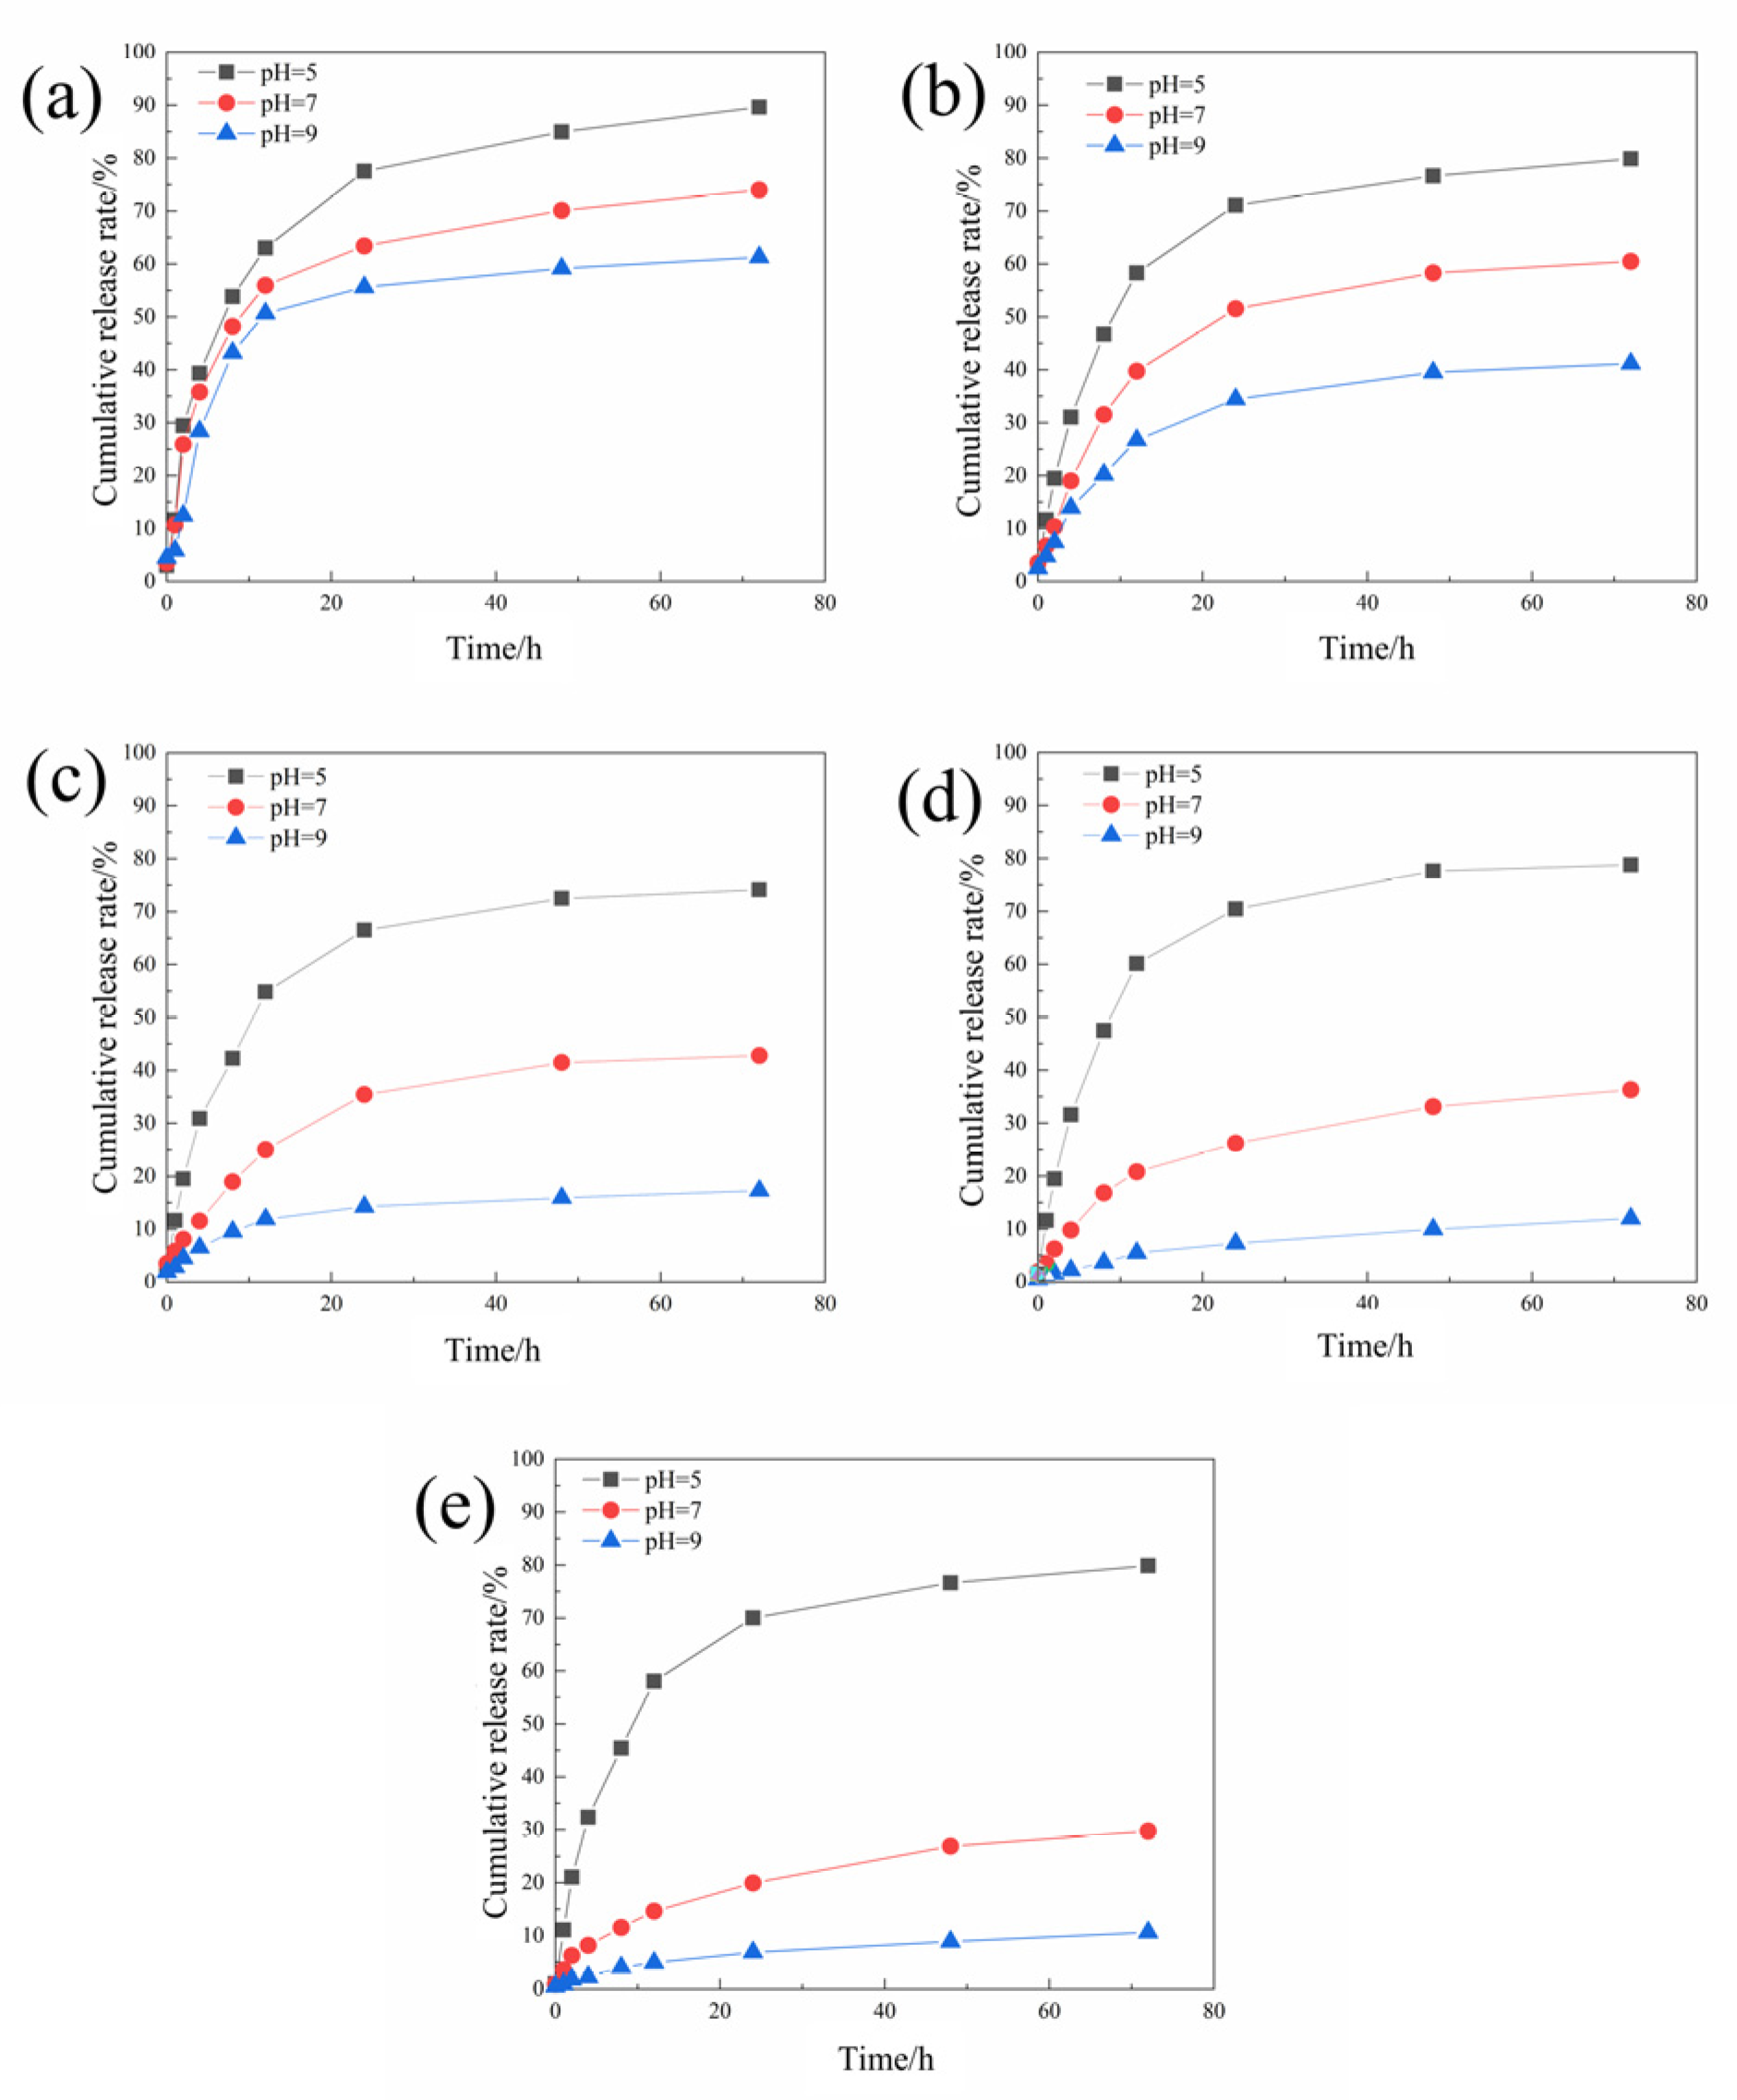
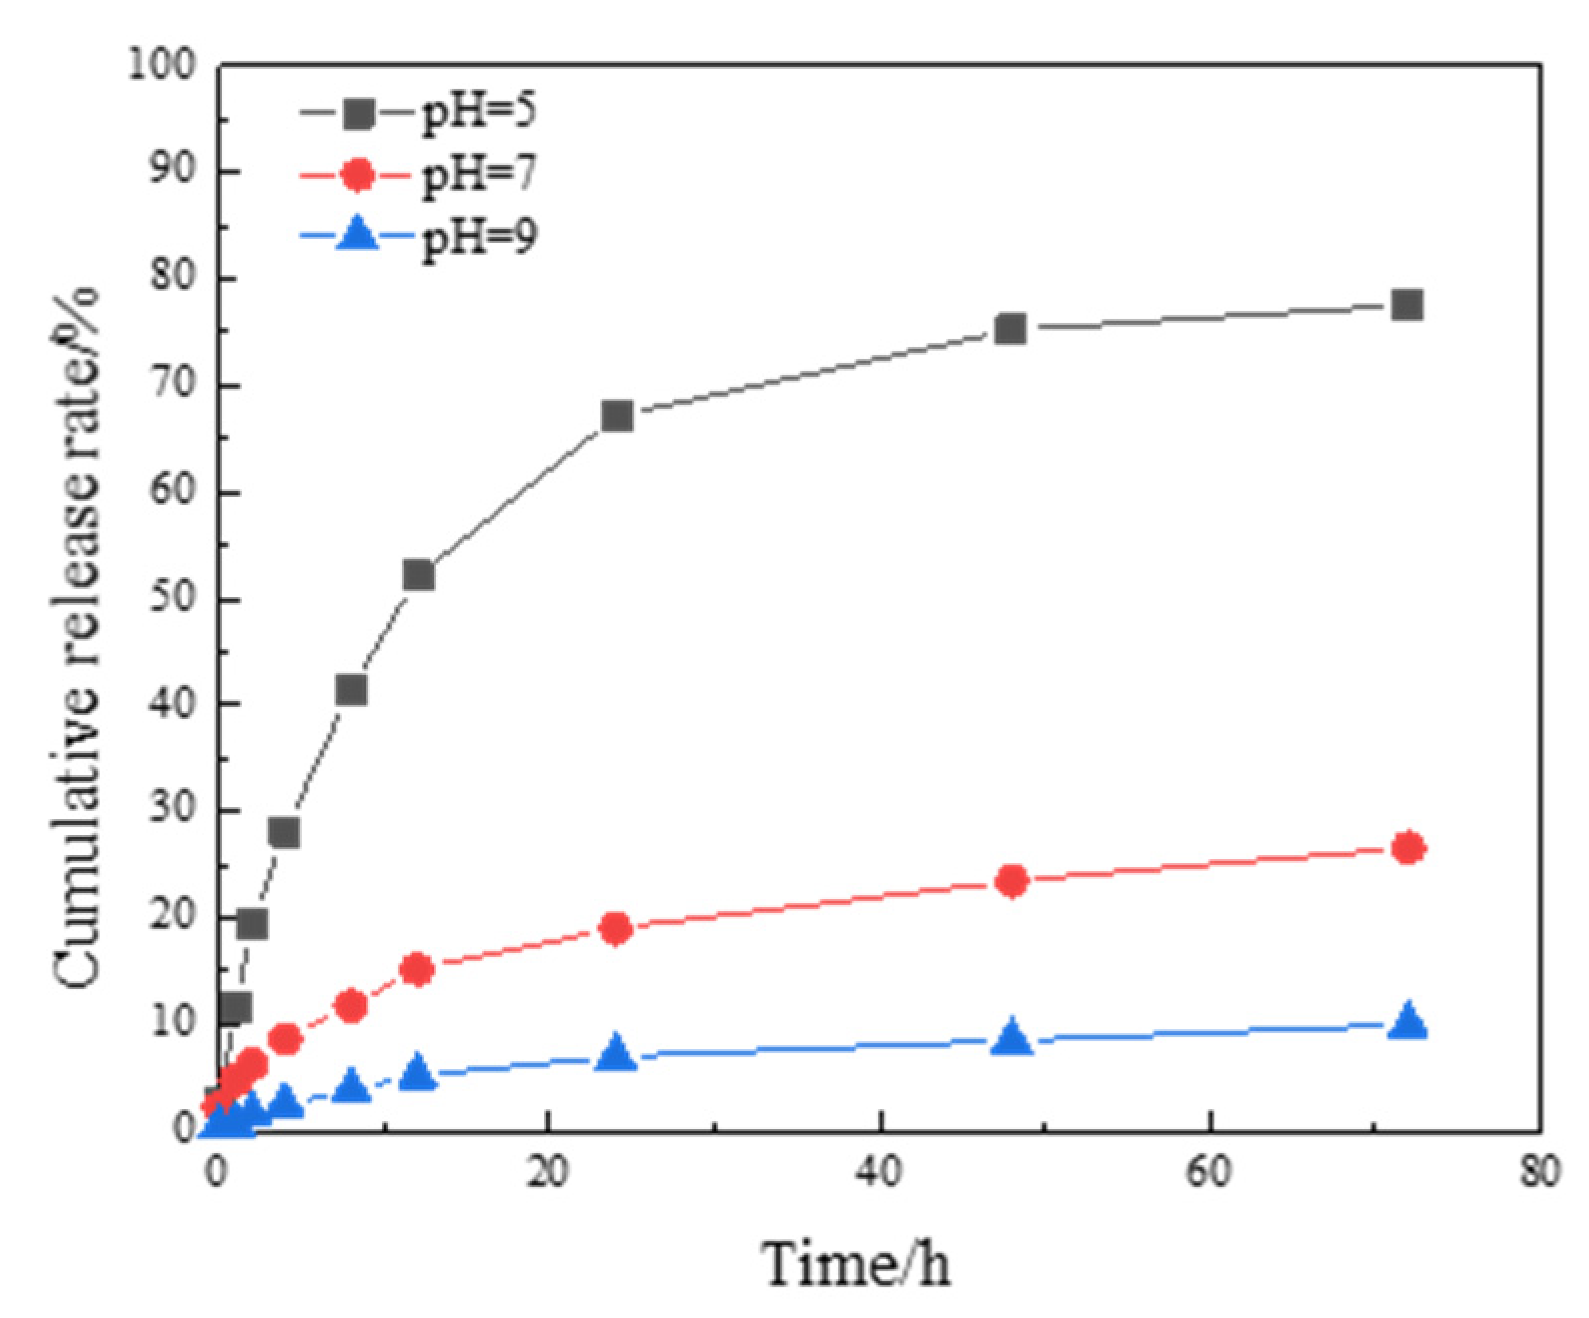
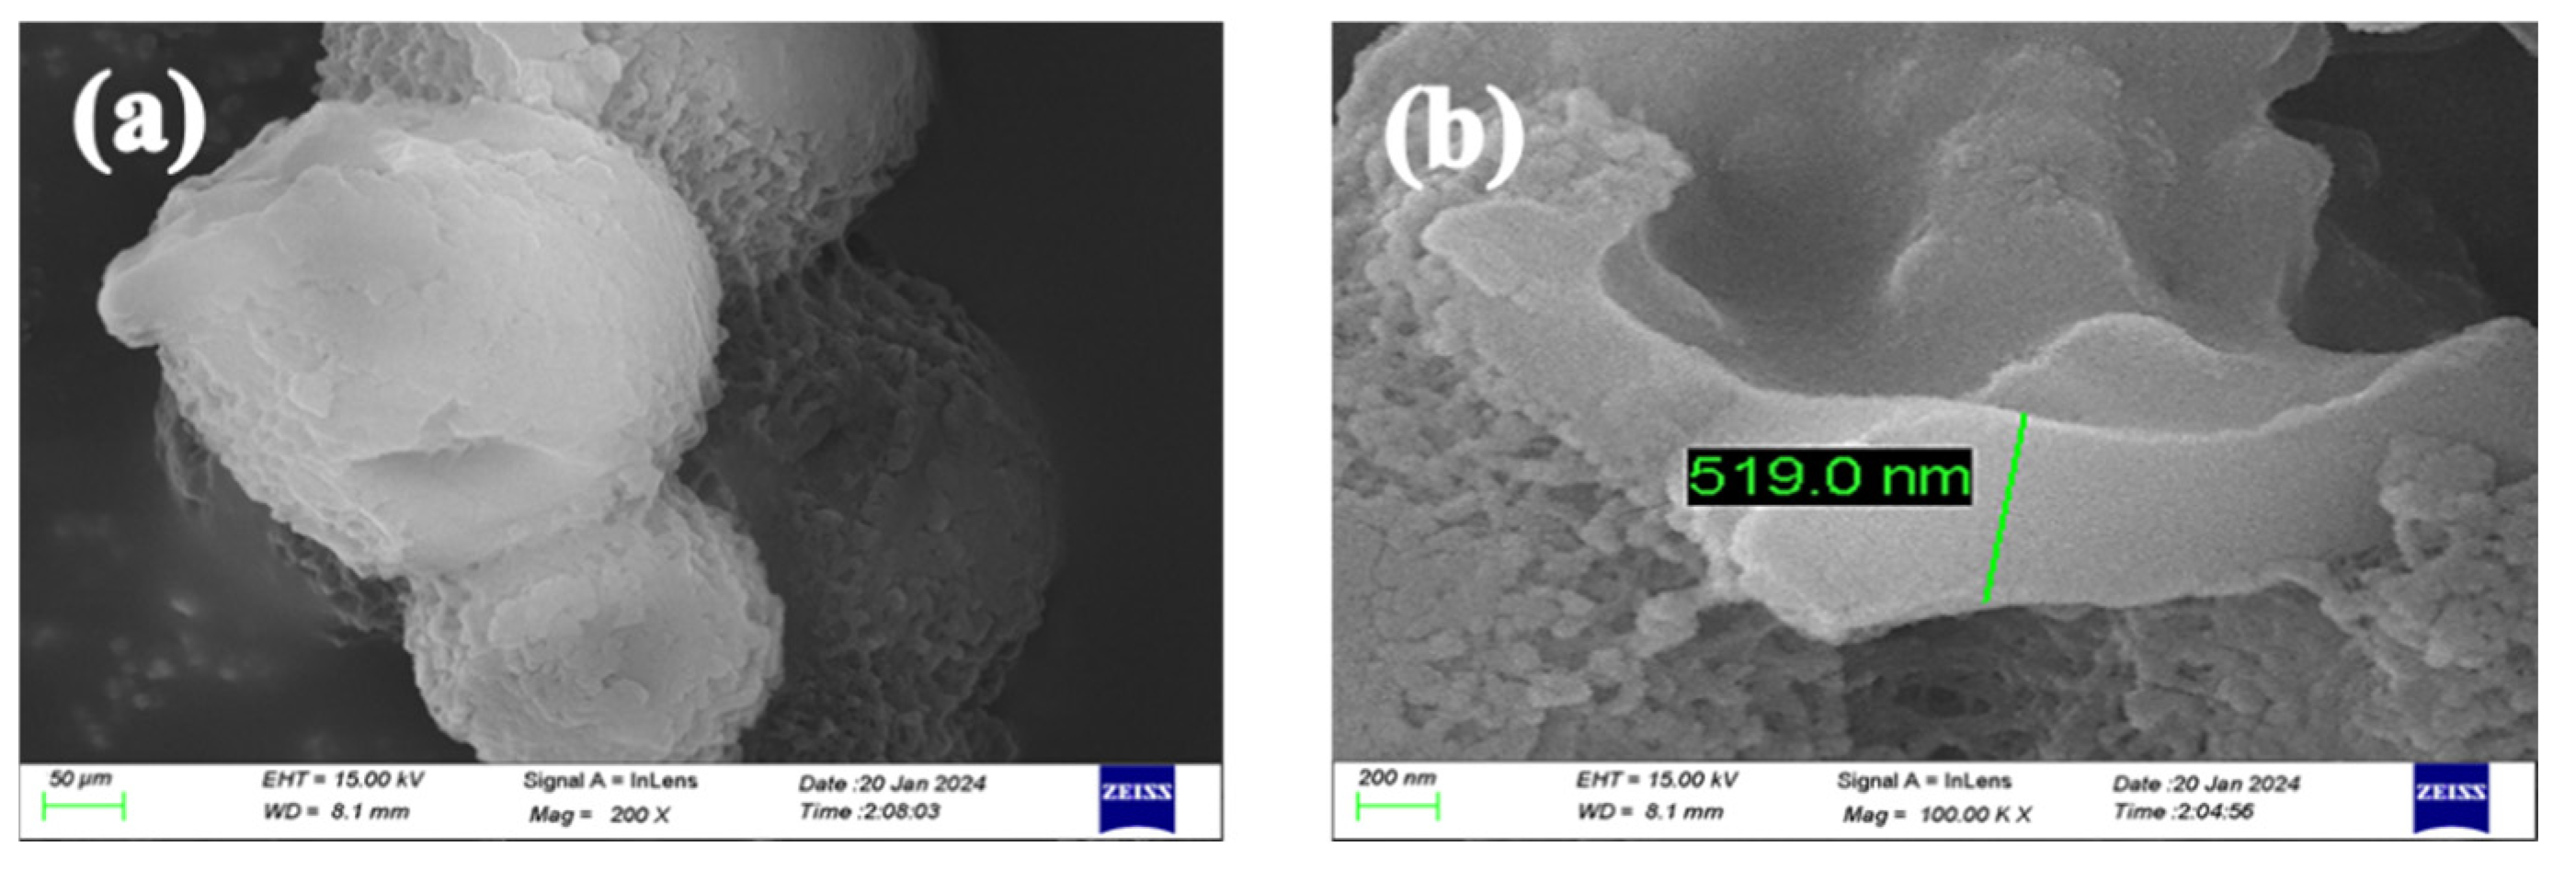
3.2.1. Microcapsule Morphology and Sustained Release Curve
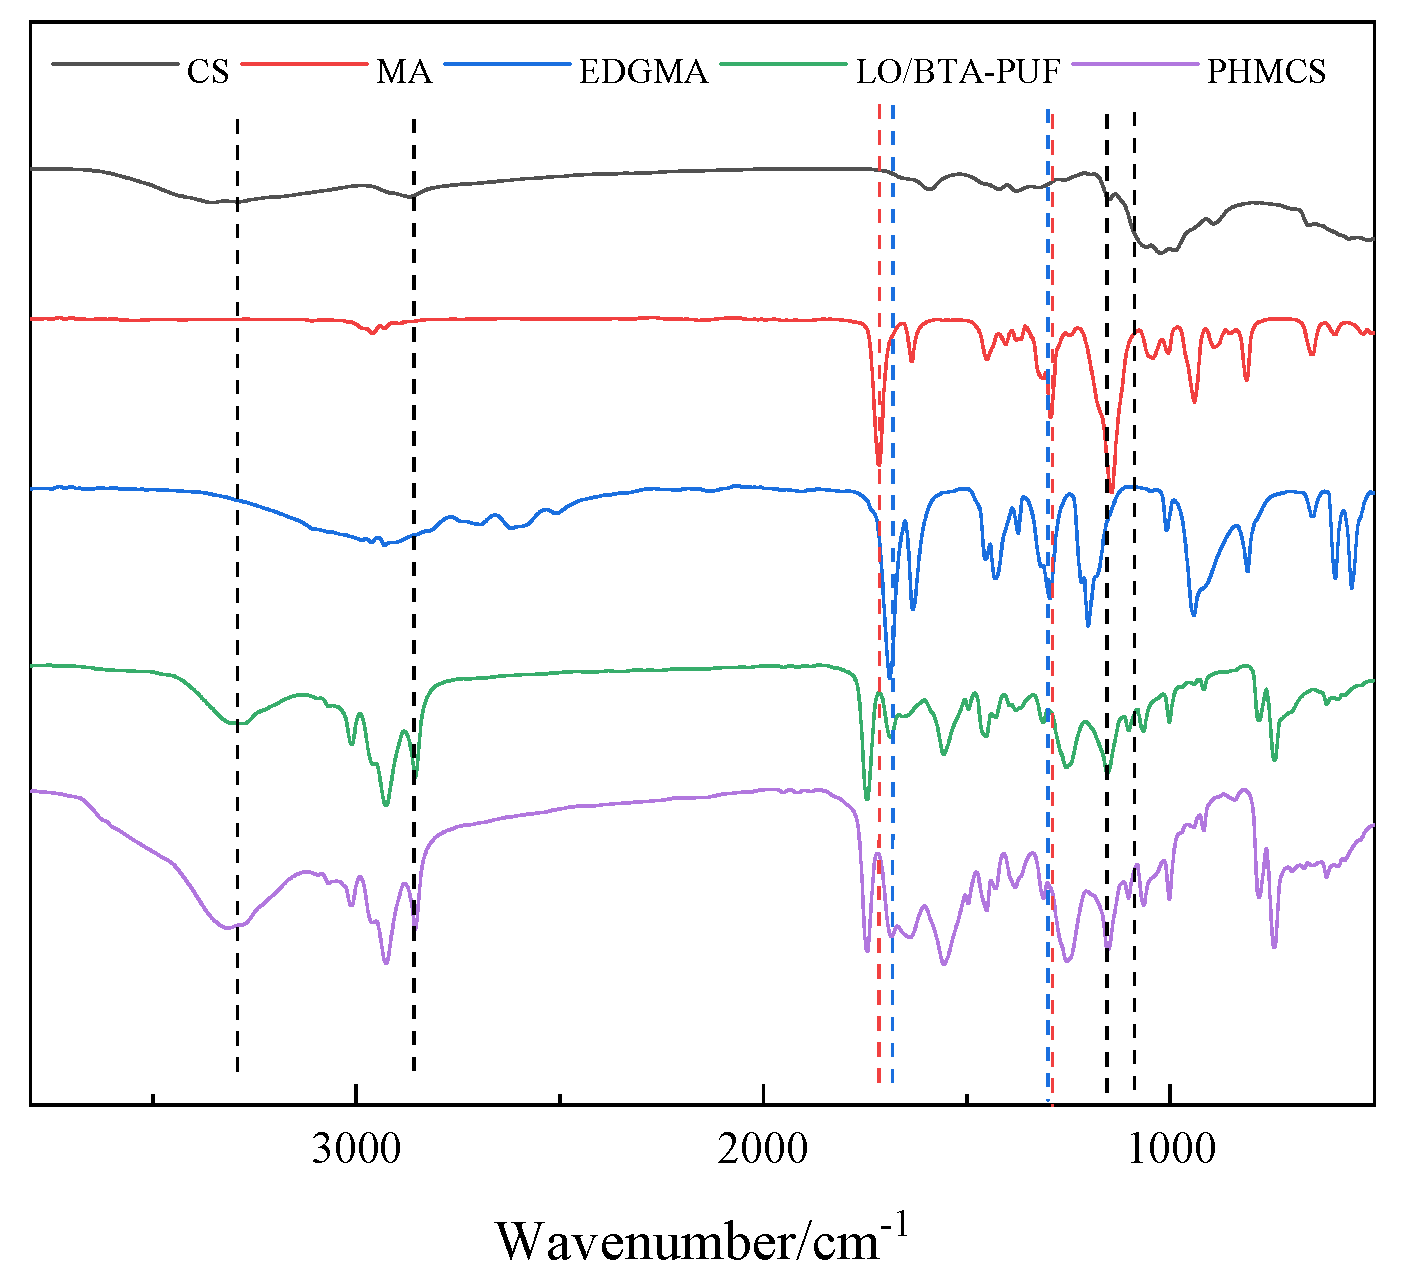
3.2.2. FTIR
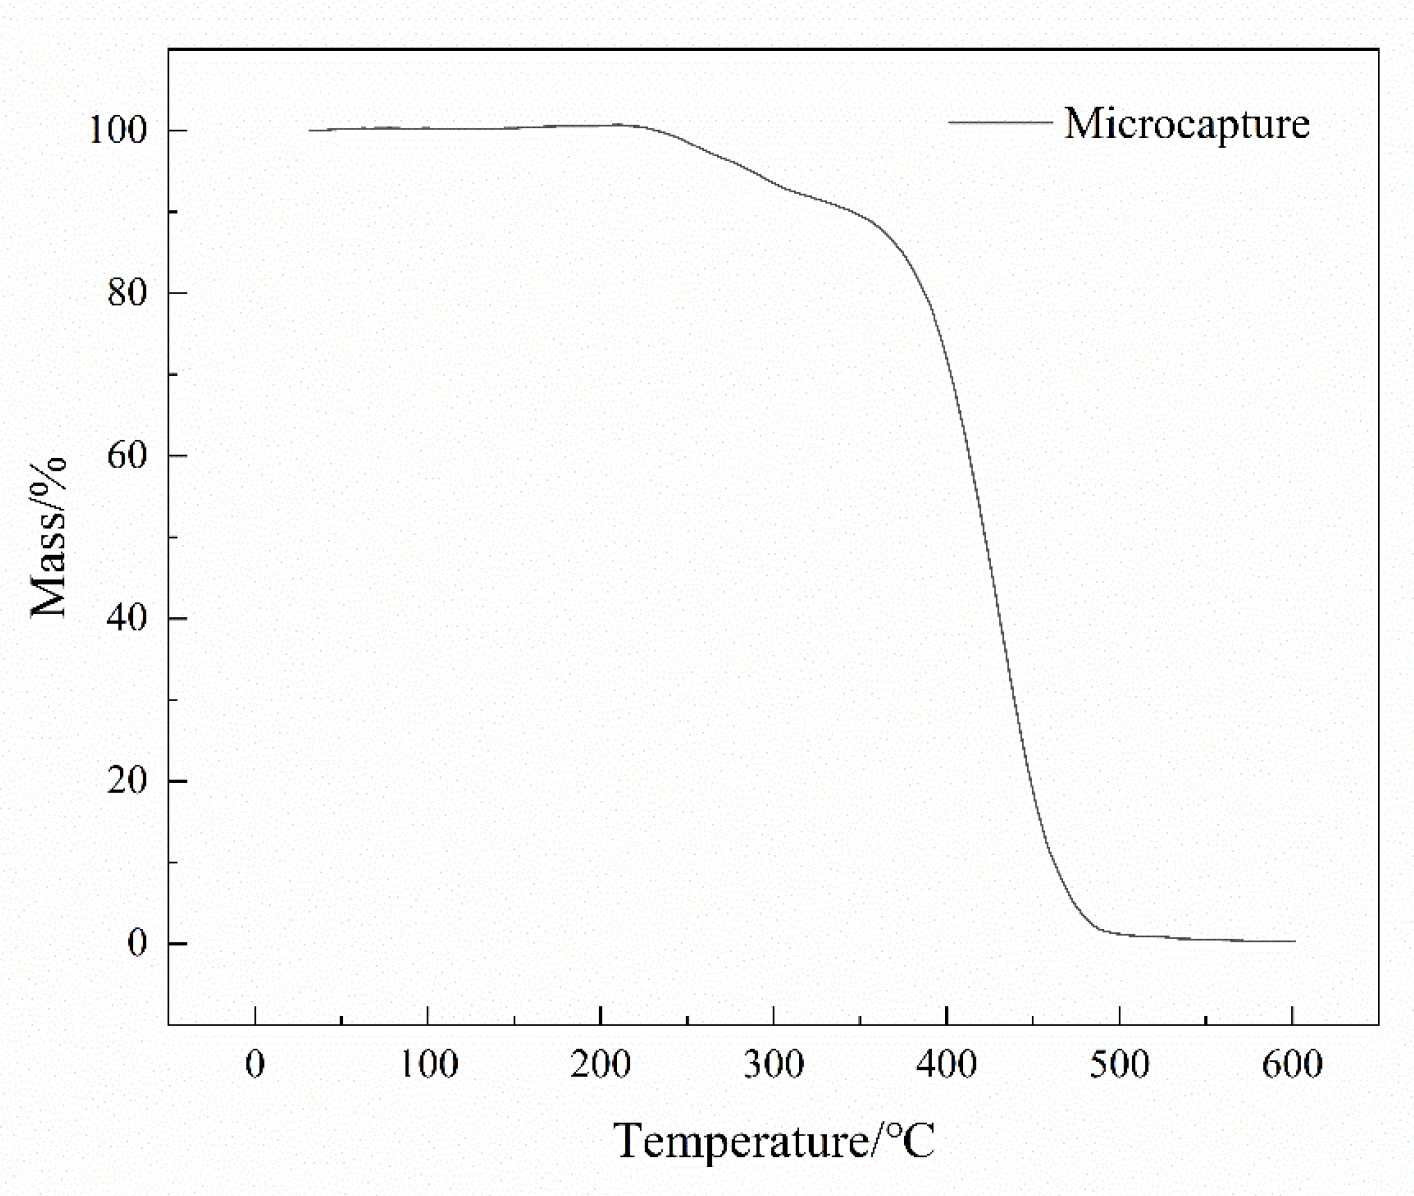
3.2.3. TGA
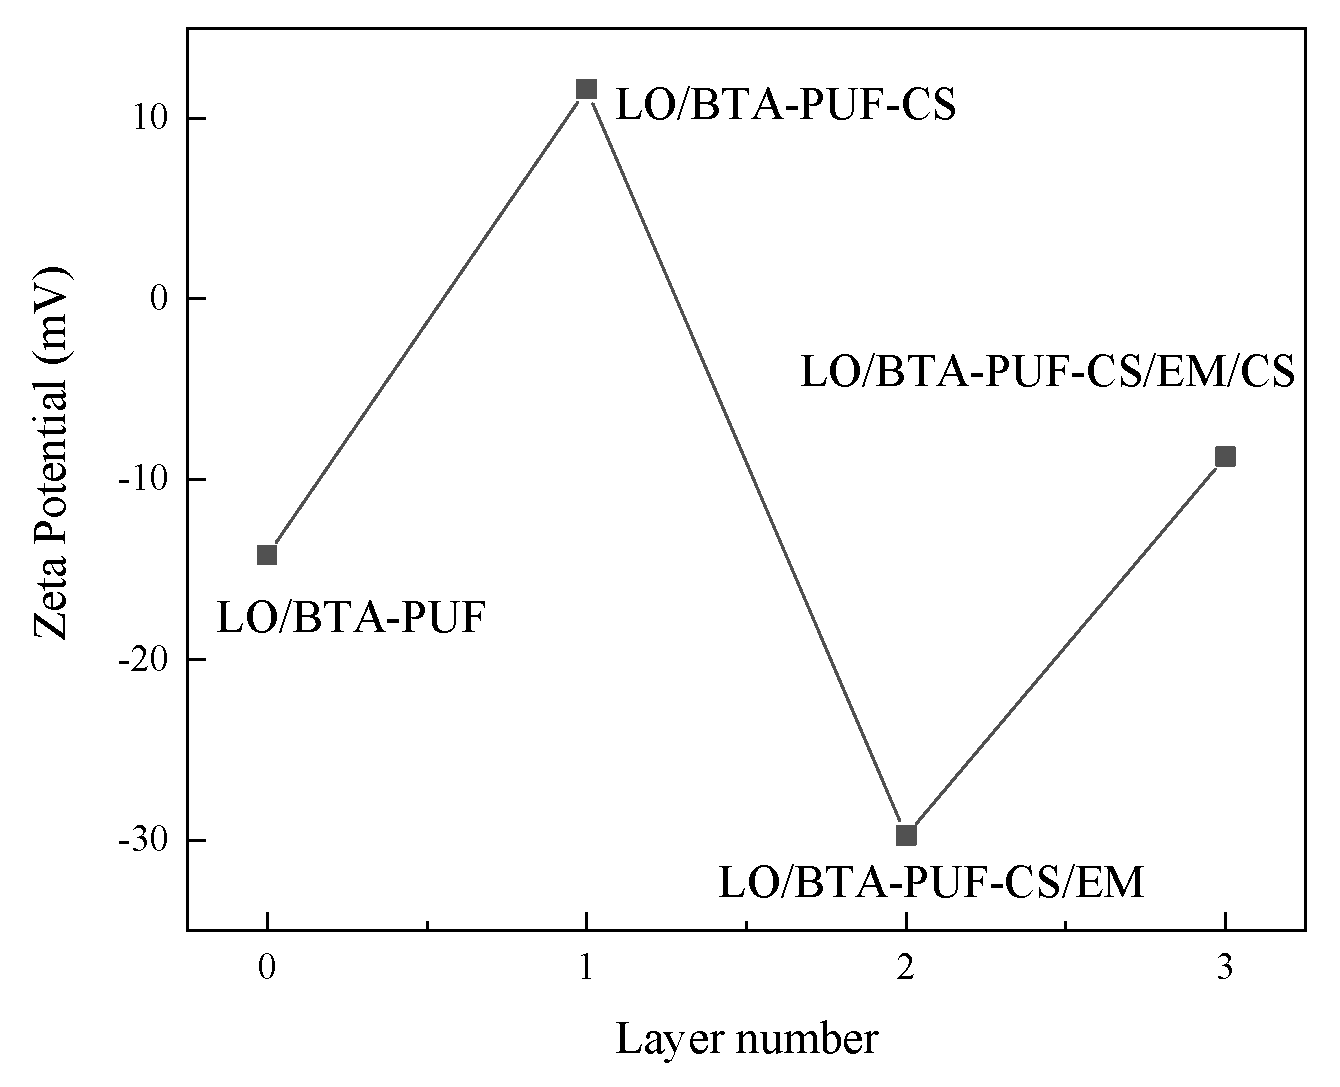
3.2.4. Zeta Potential Test
3.3. Self-Healing Properties of Coatings
3.4. Anti-Corrosion Properties of Coating
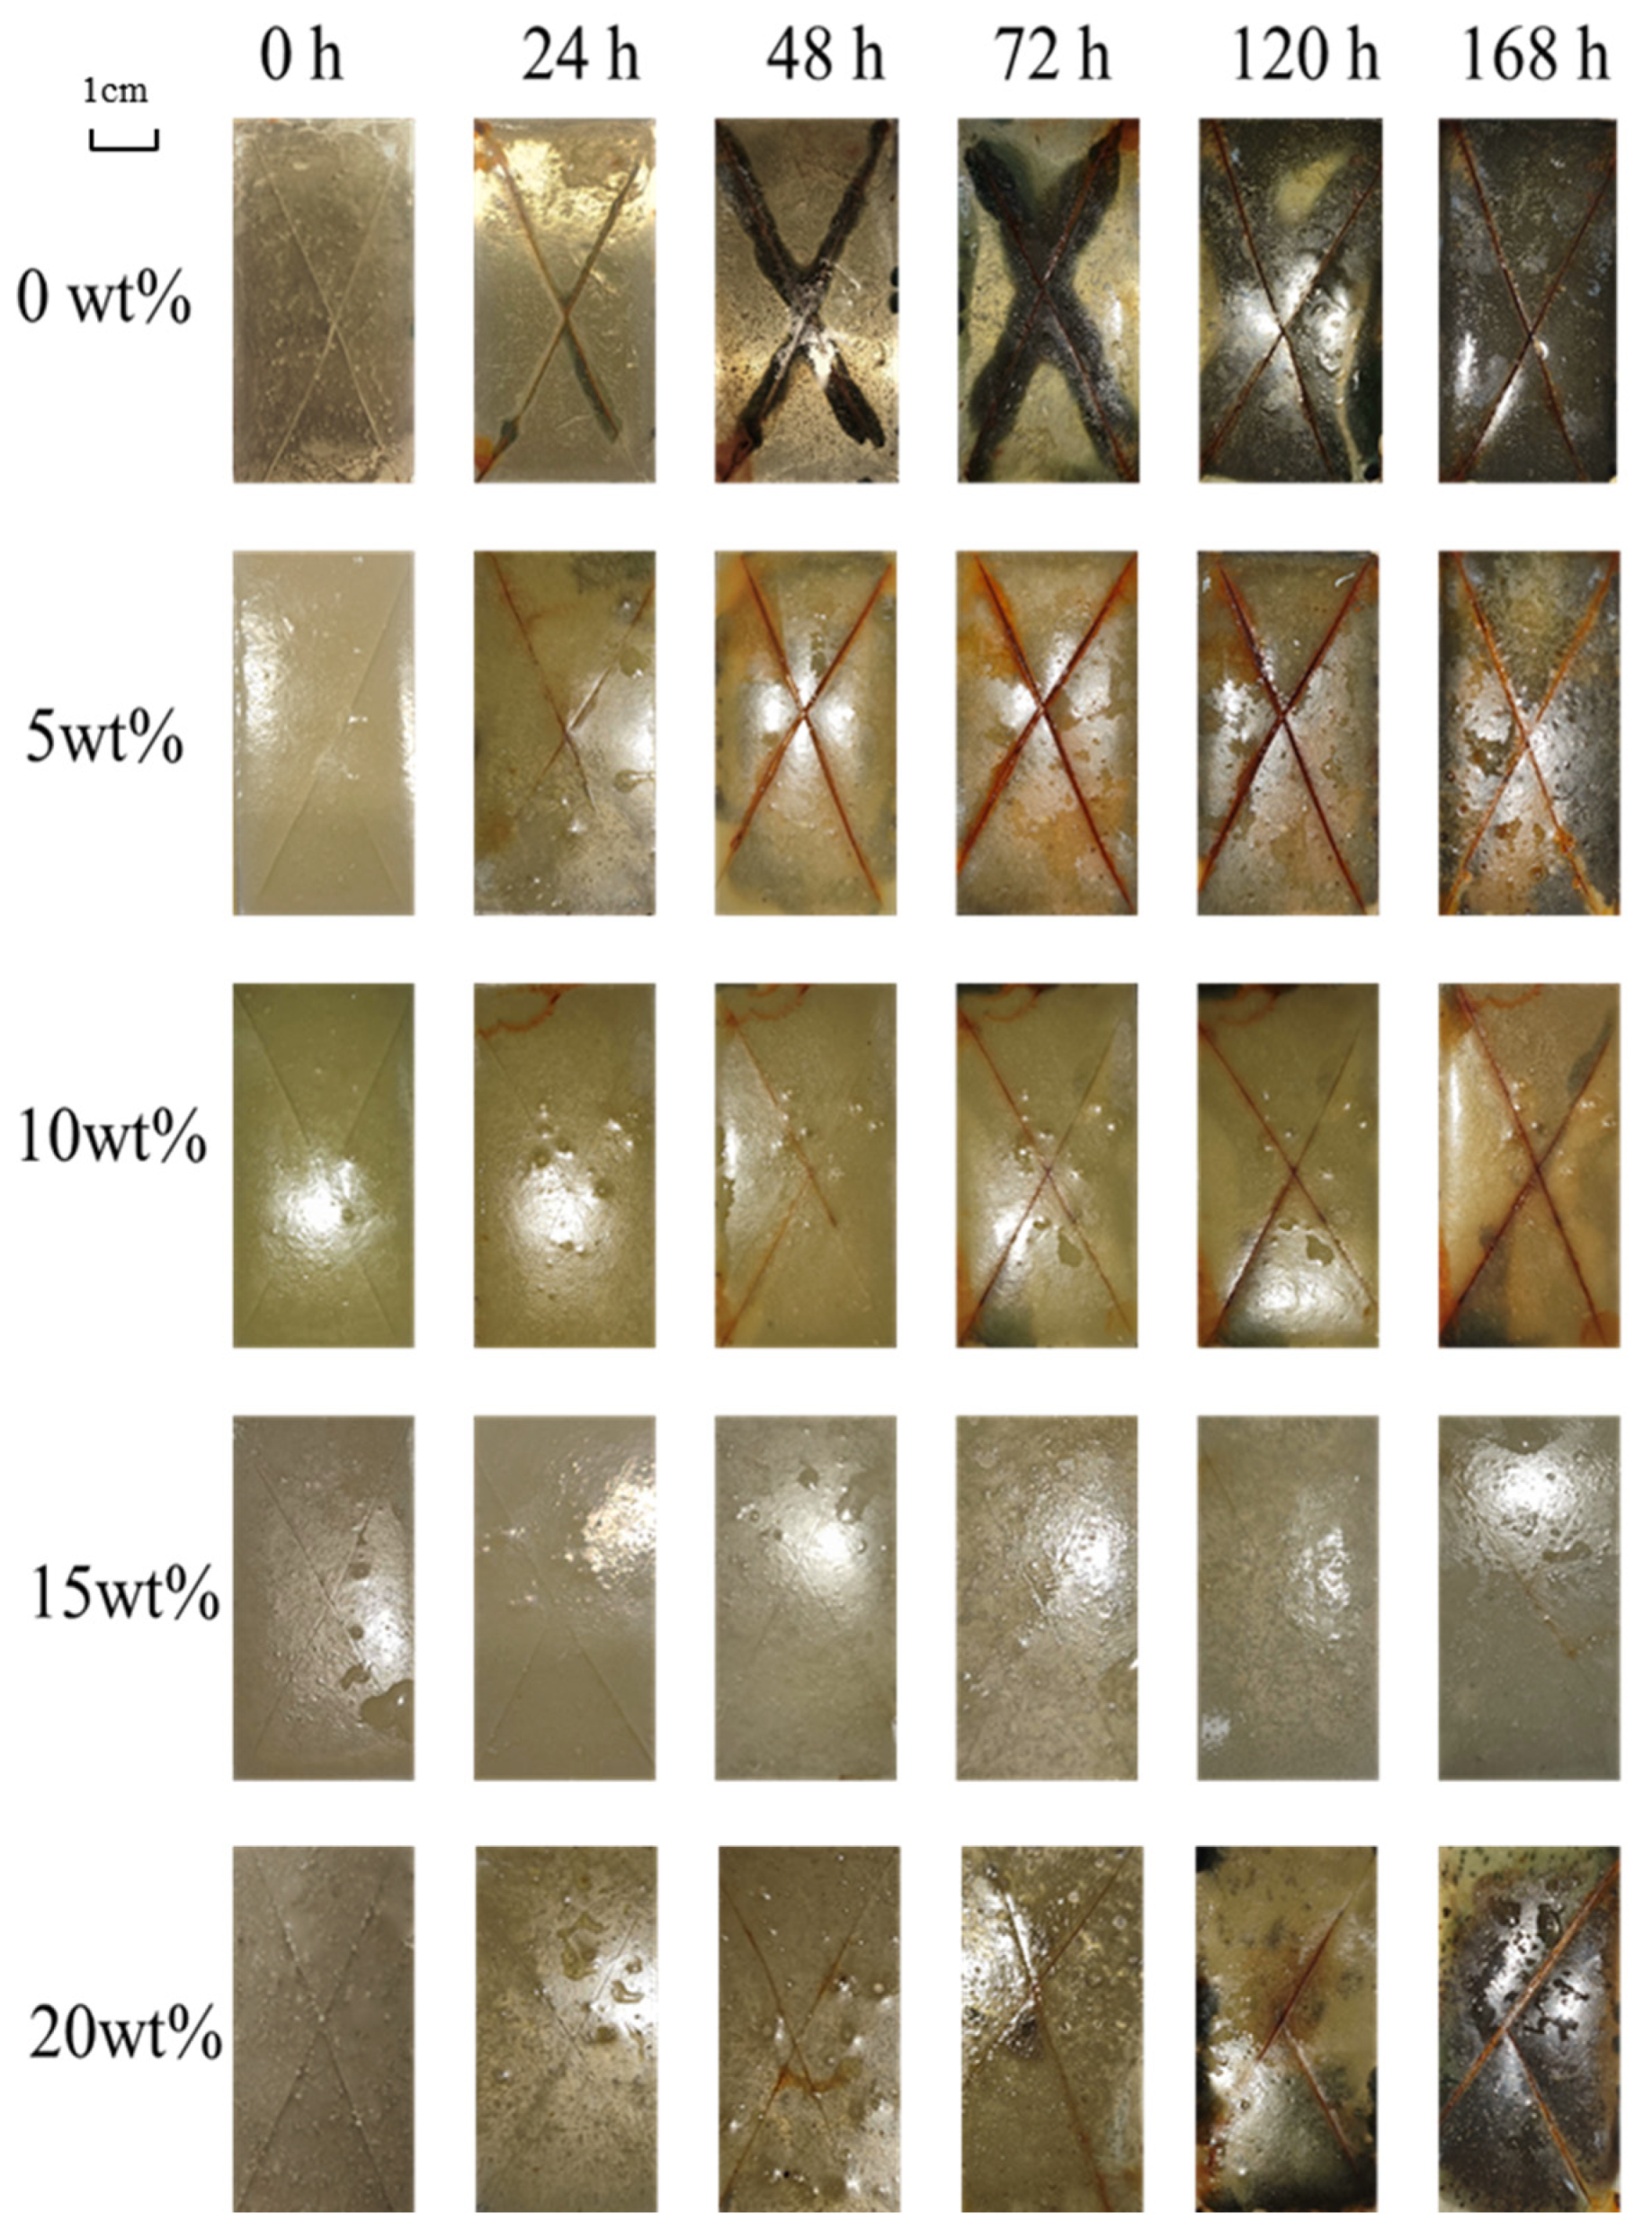
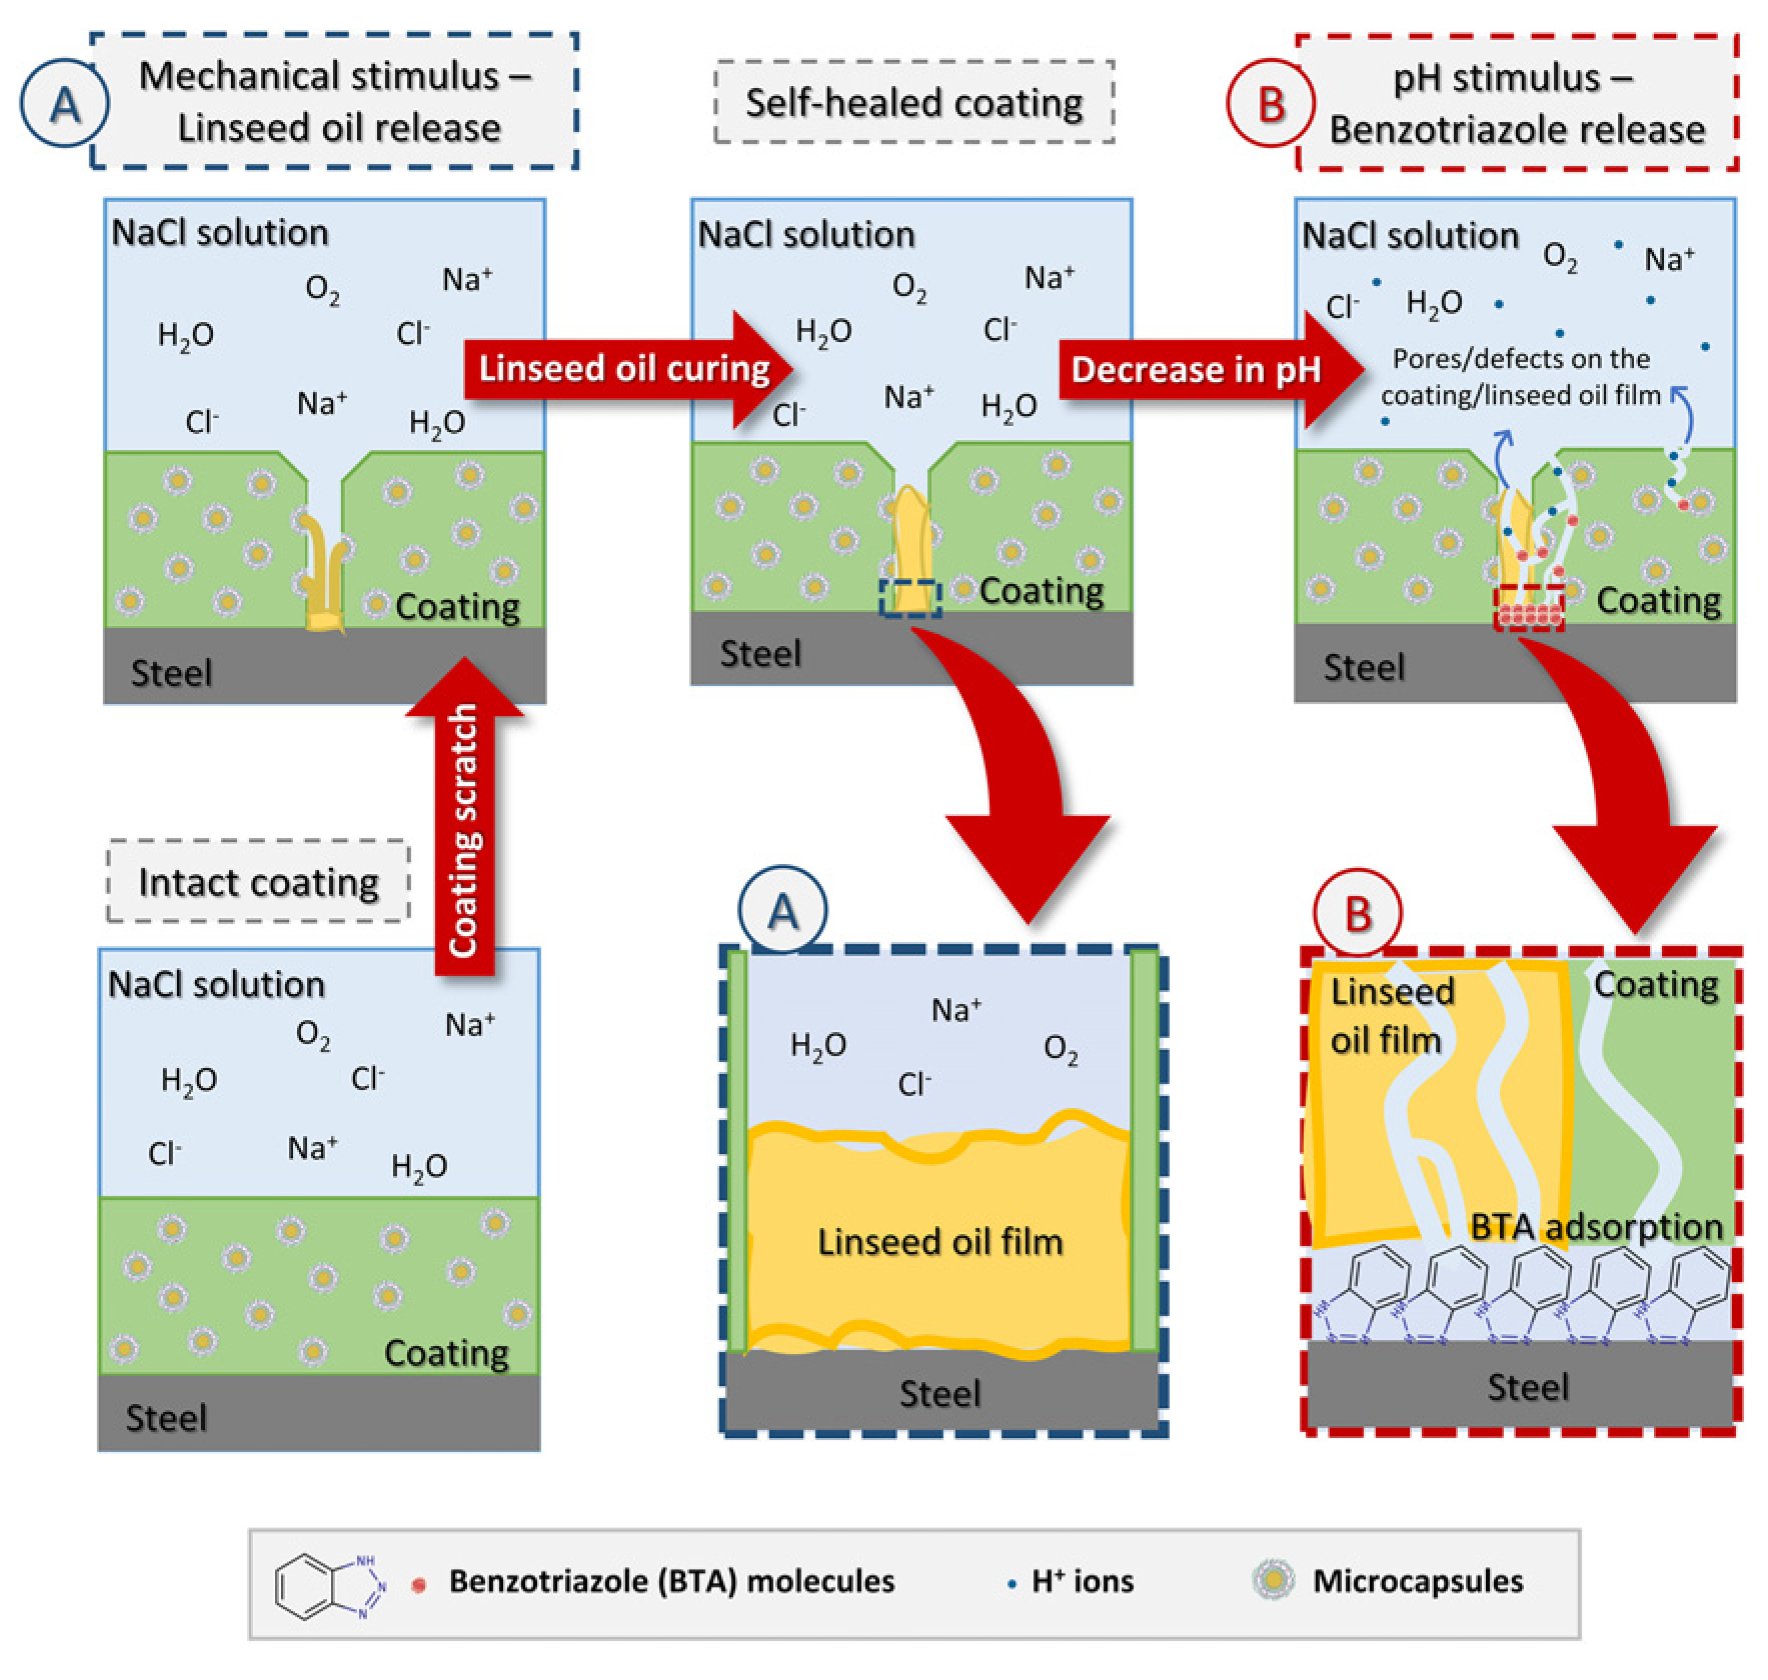
3.4.1. Research on the Anti-Corrosion Performance of the Self-Healing Coating Based on the Salt Spray Test
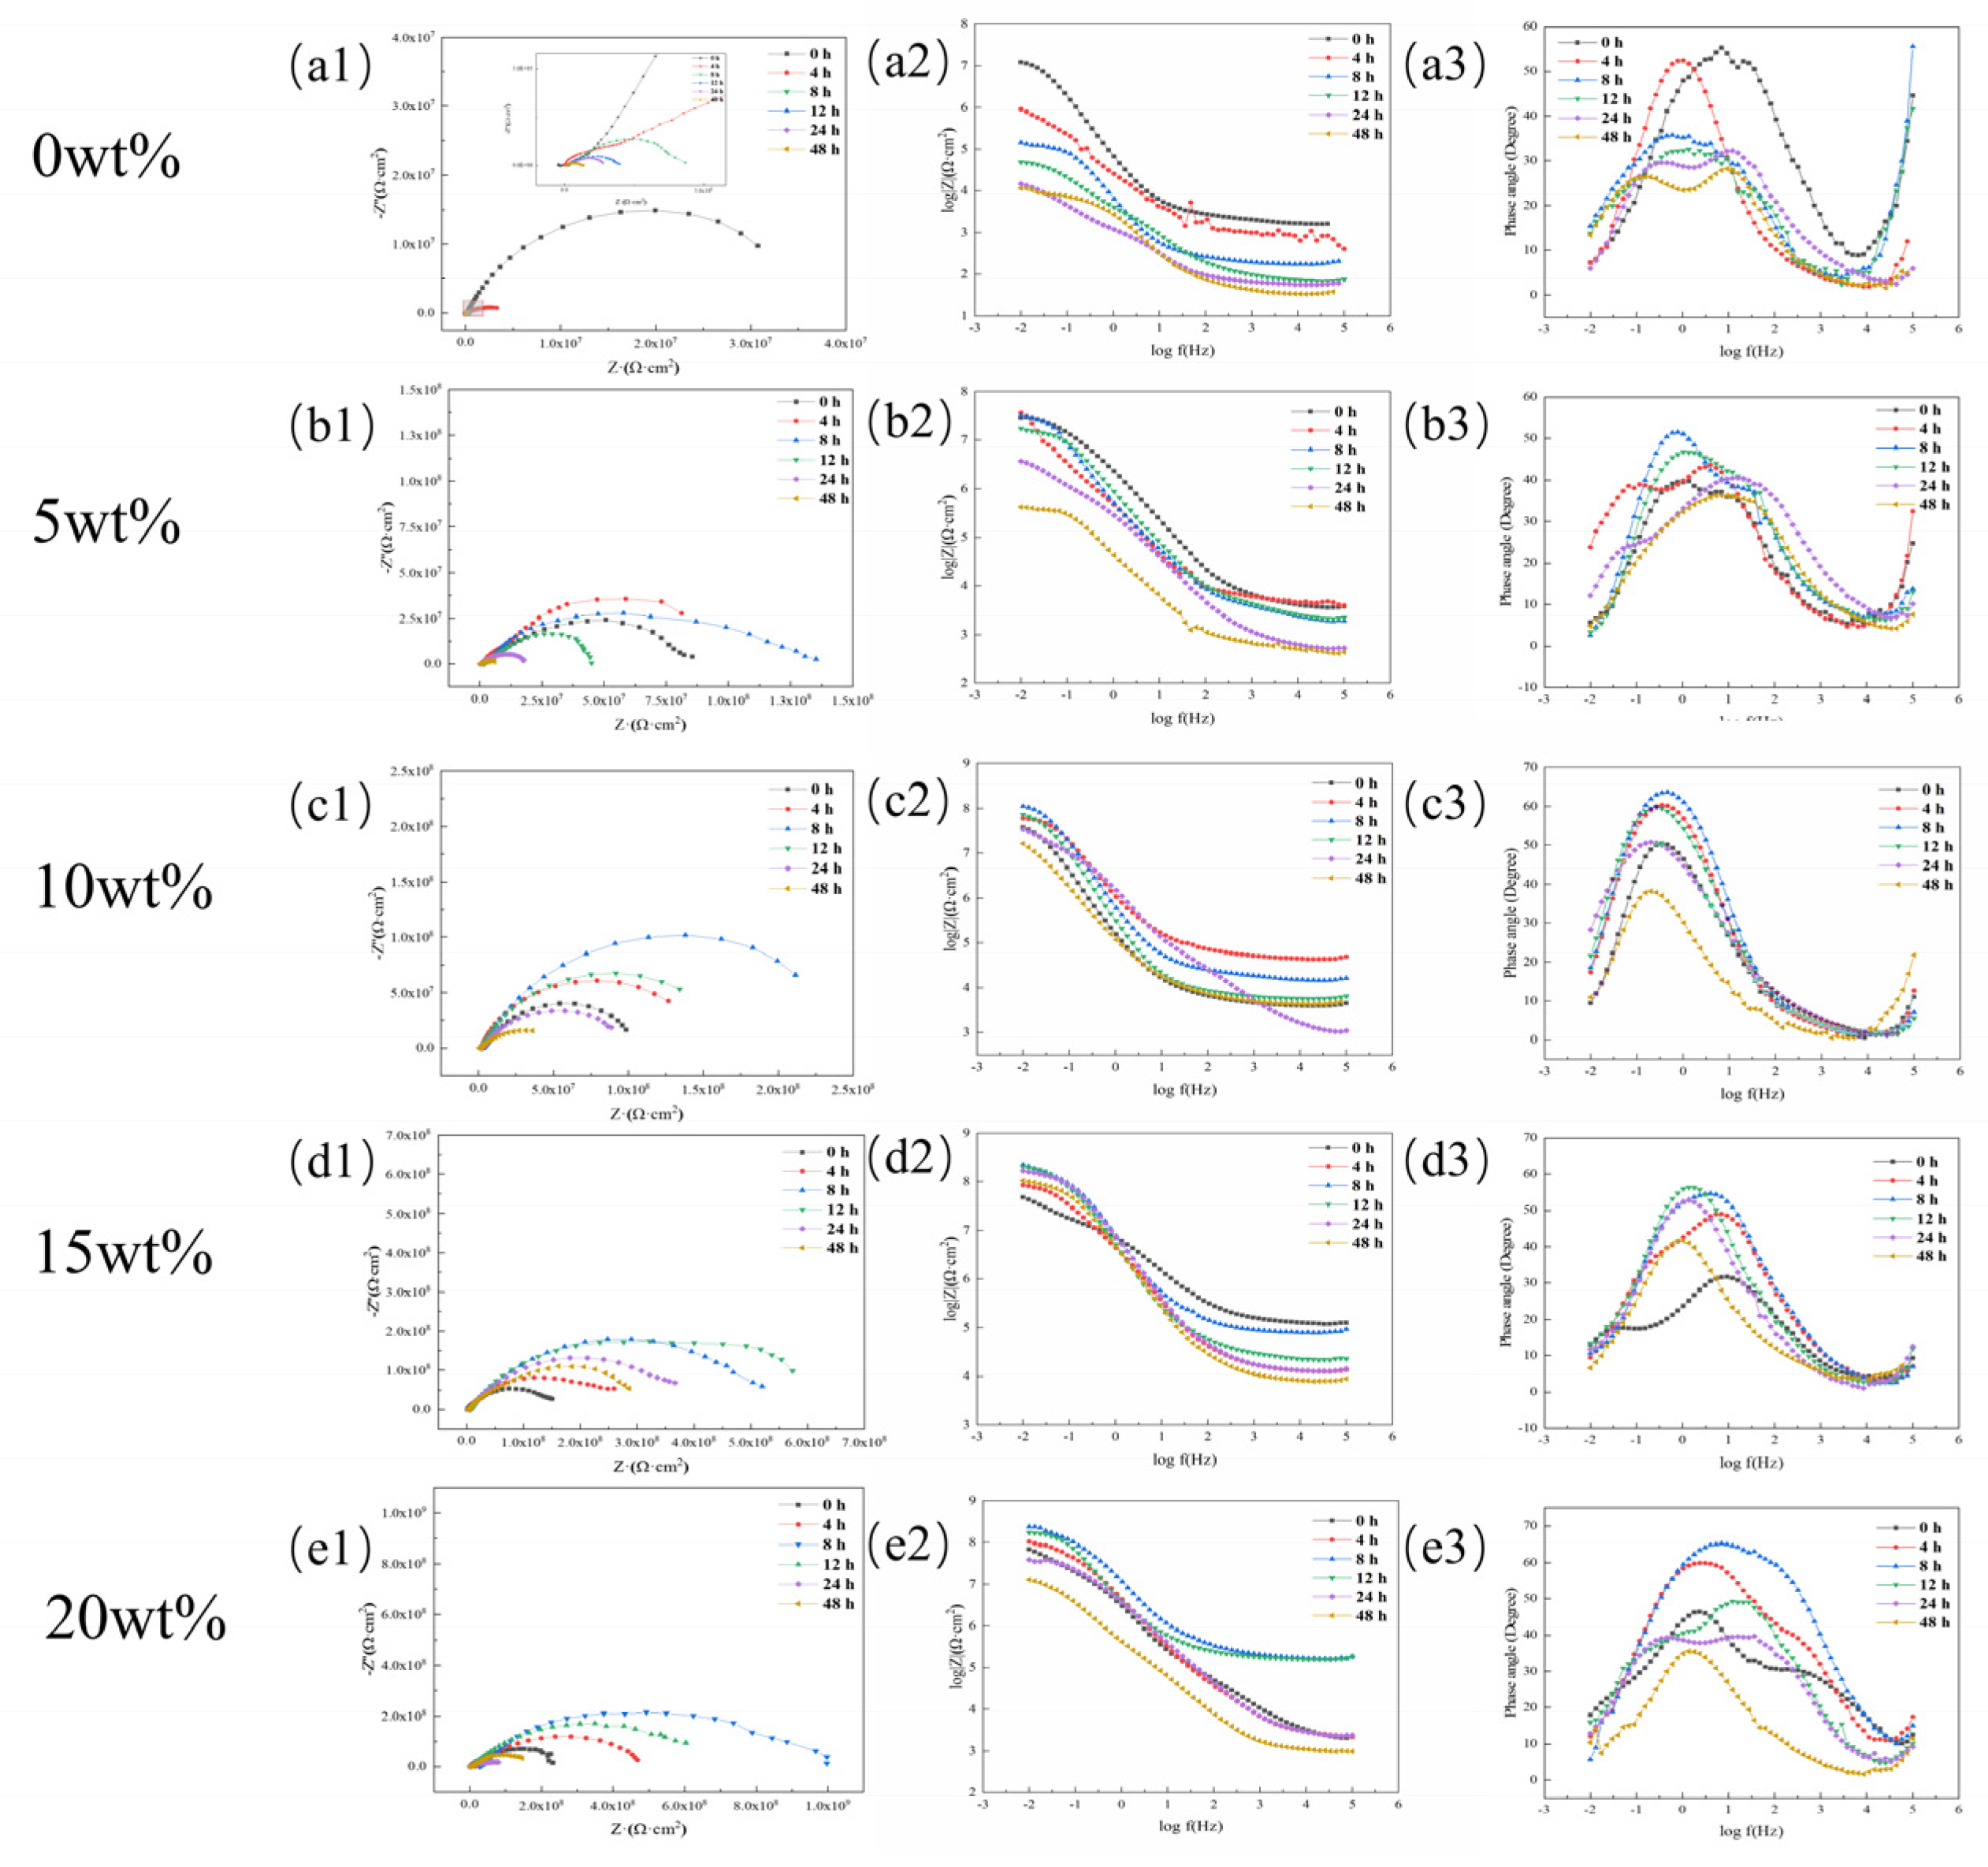
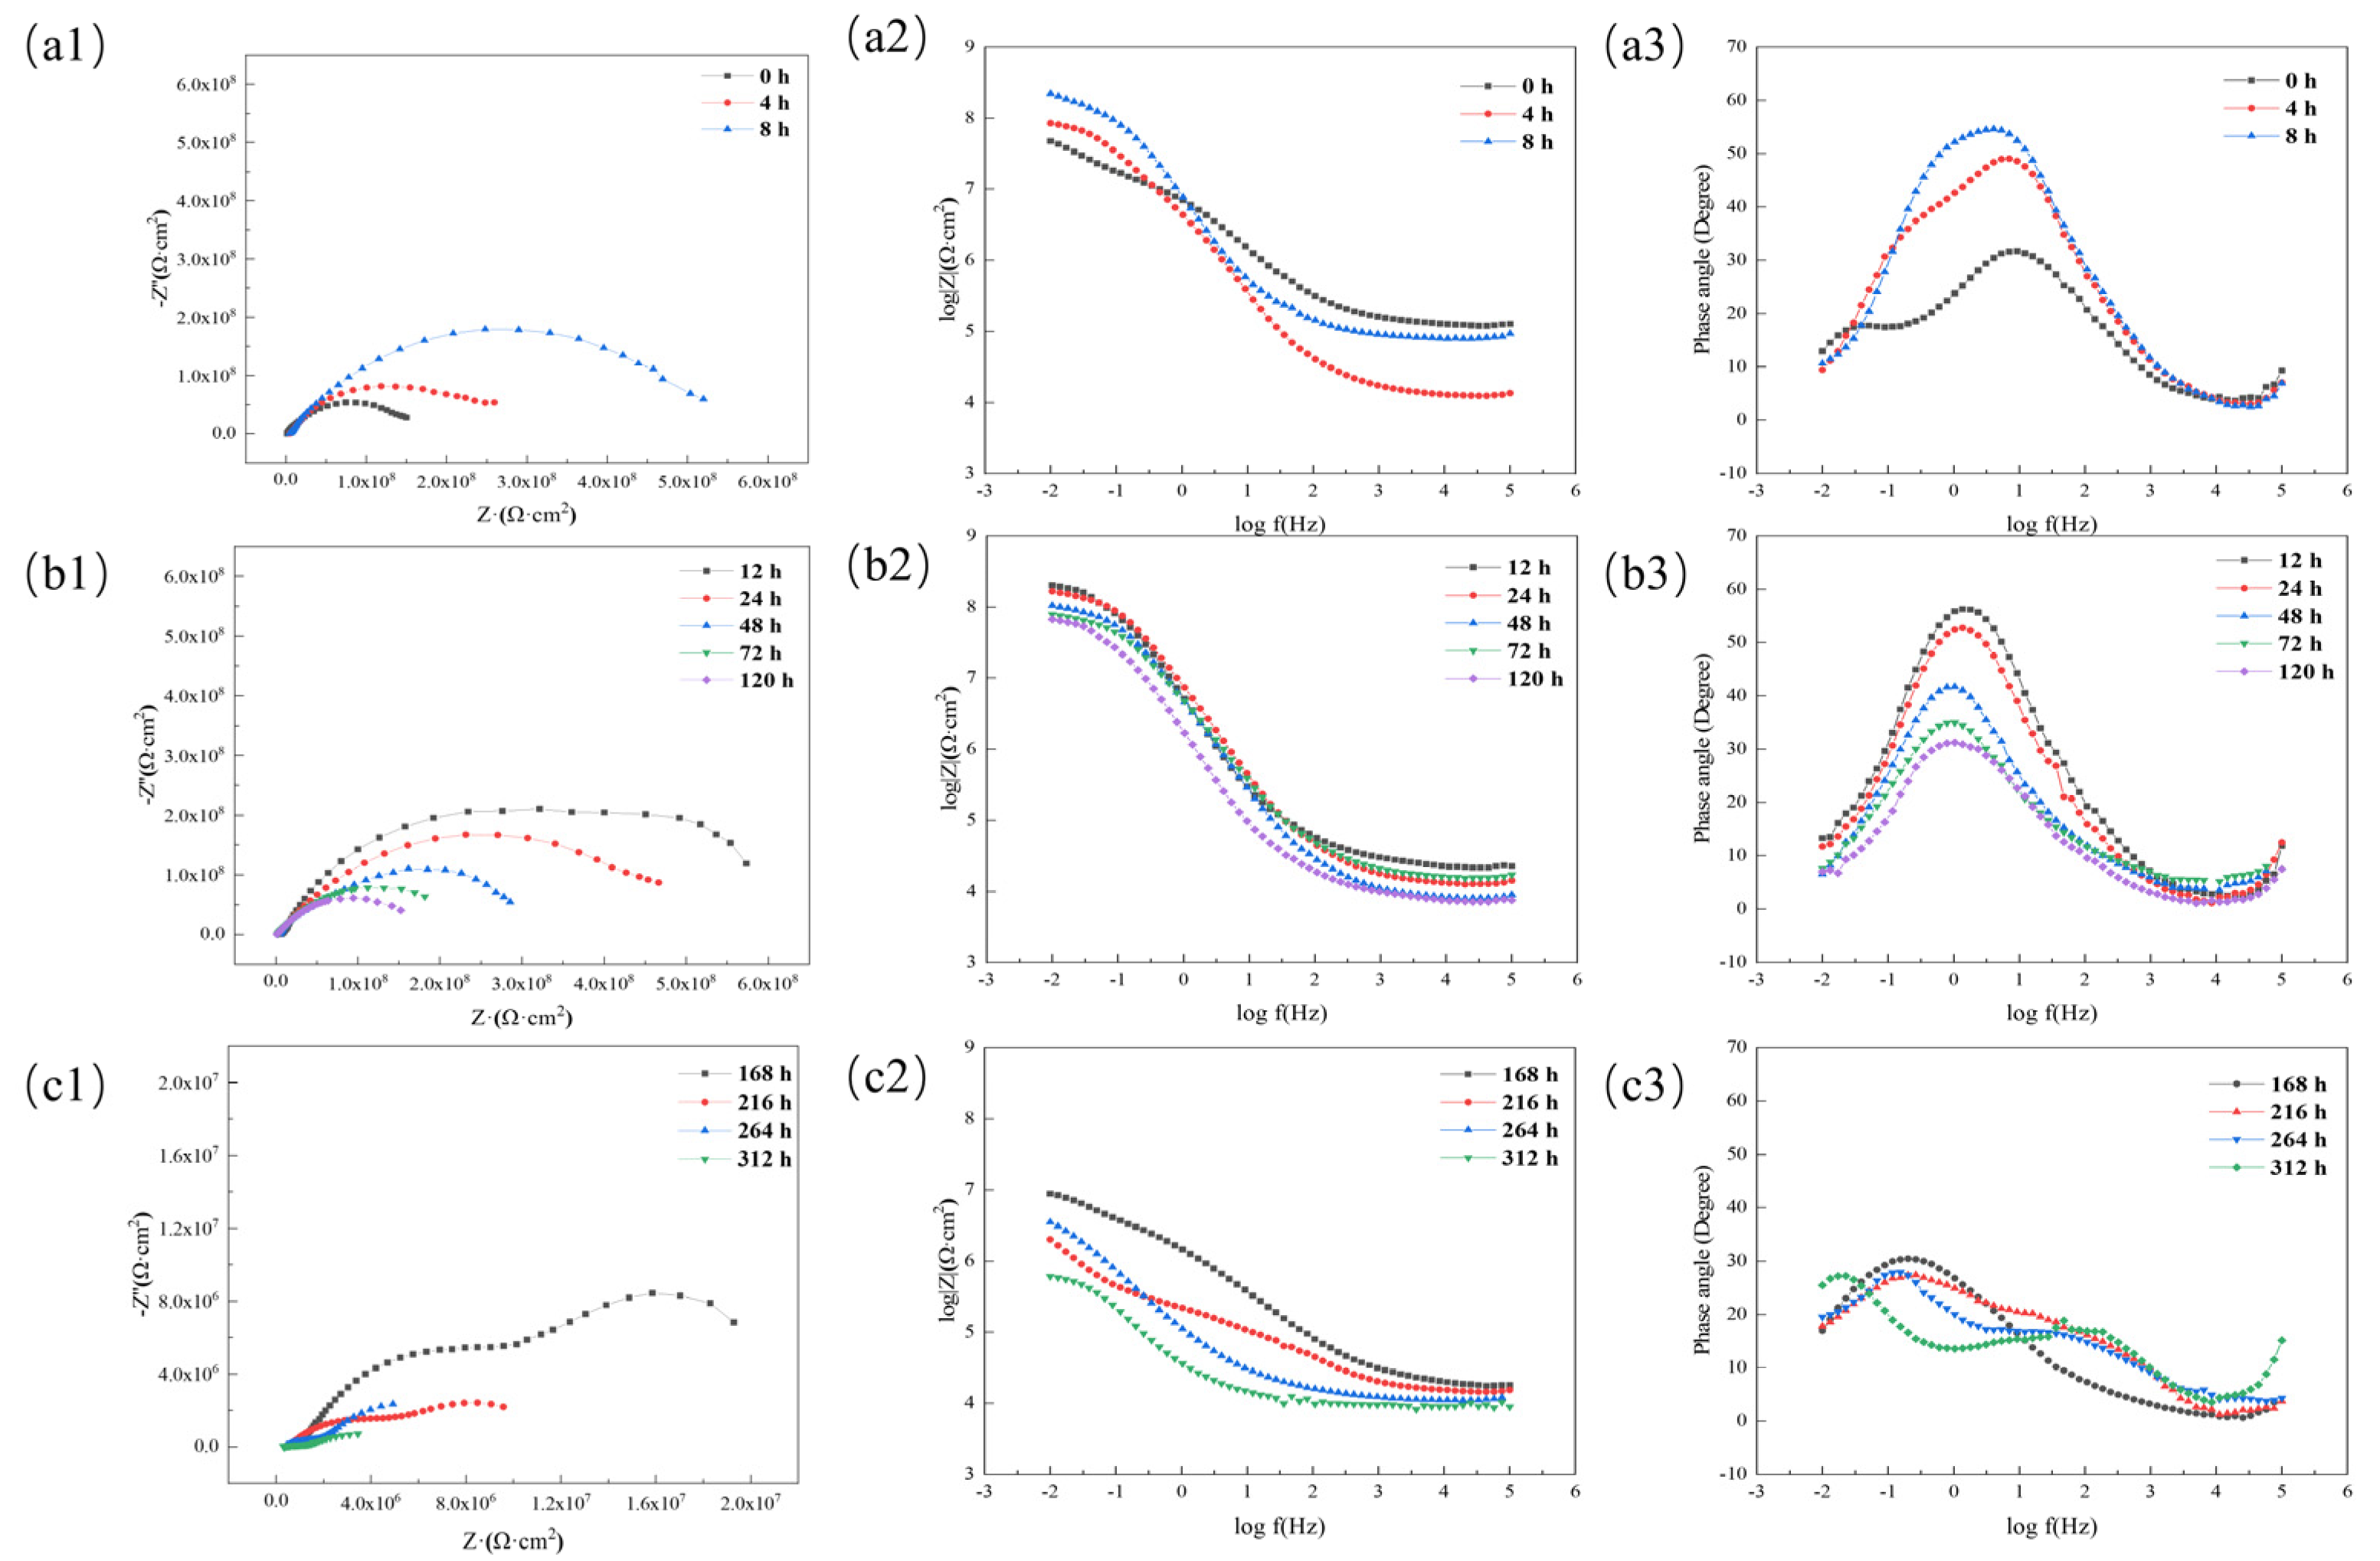
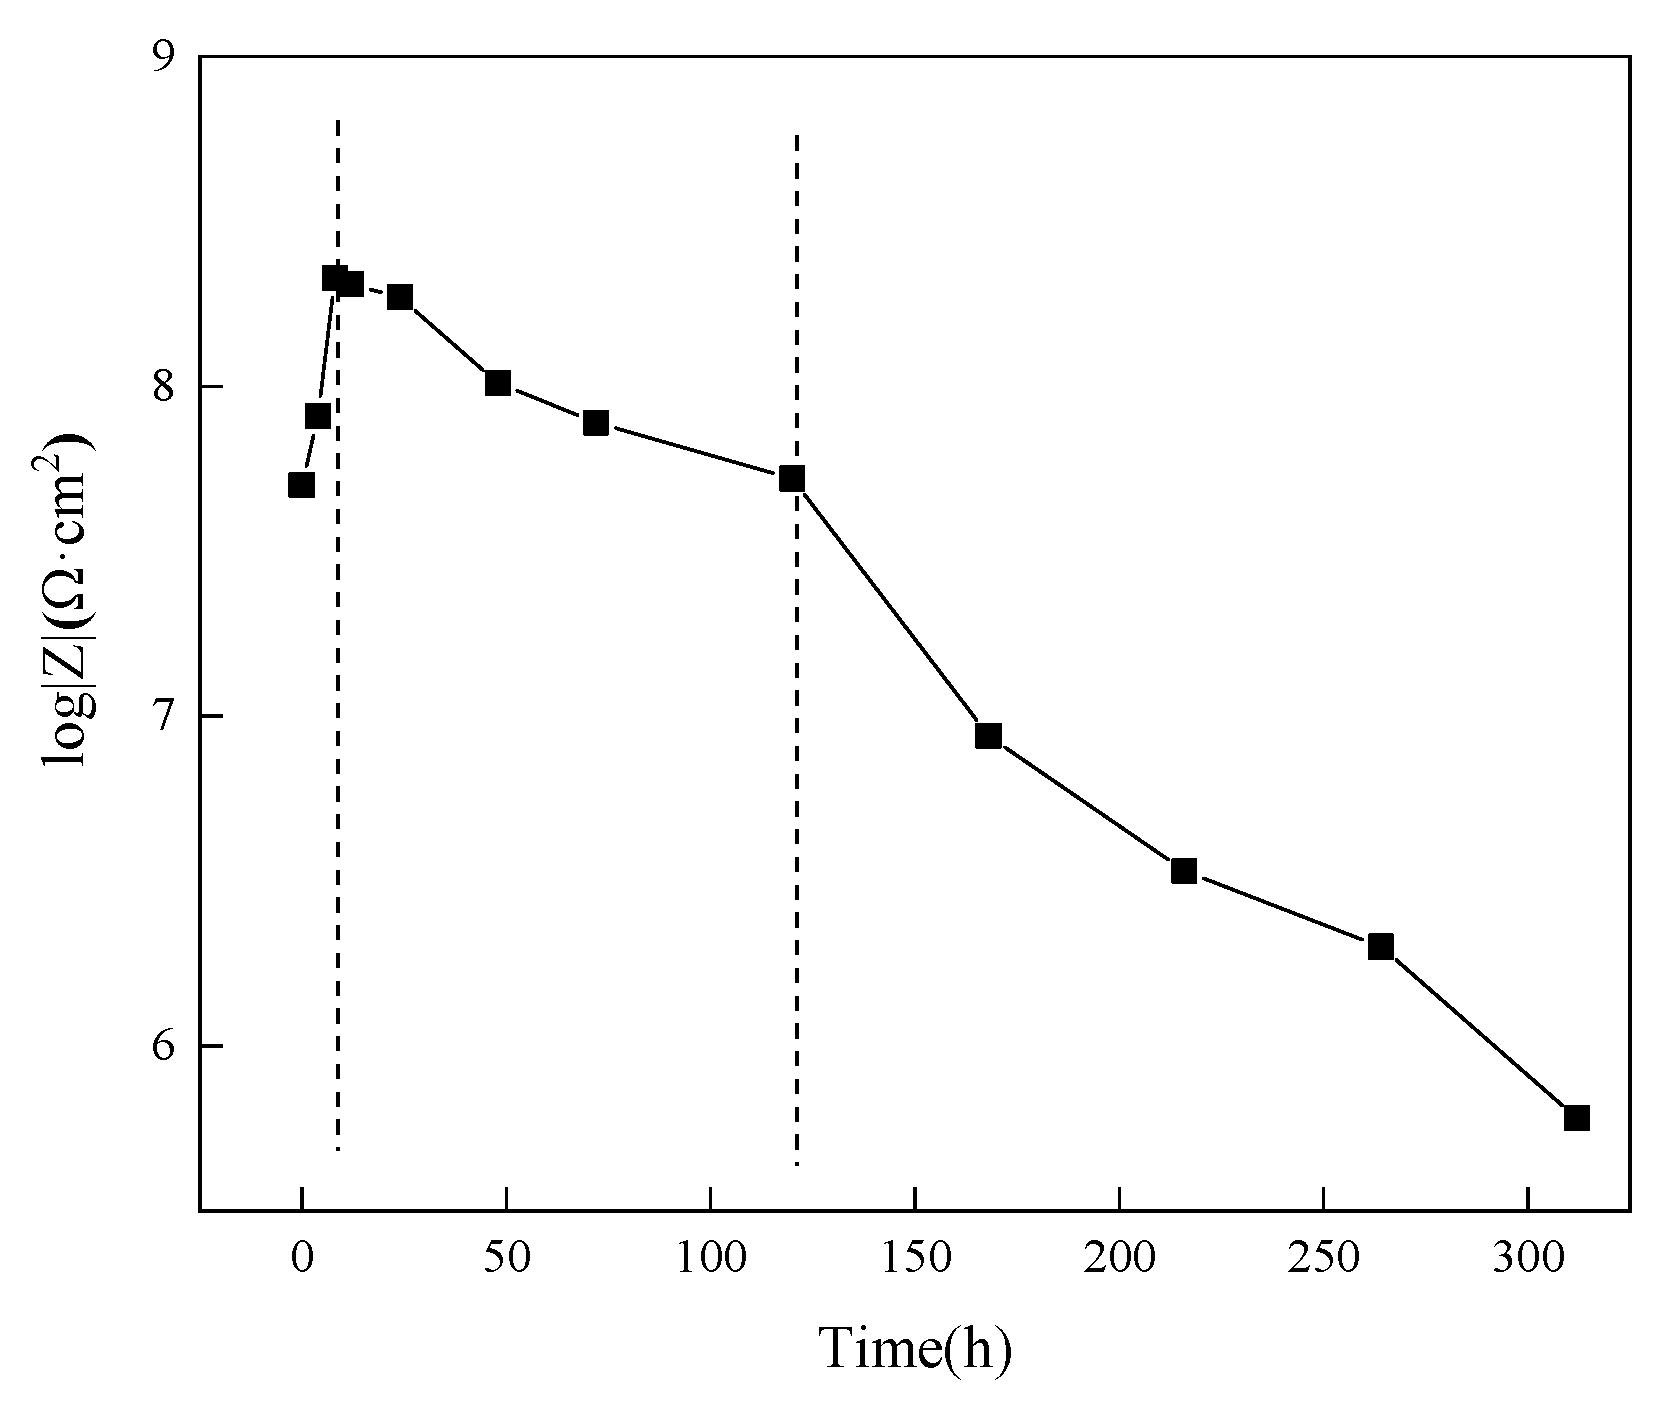
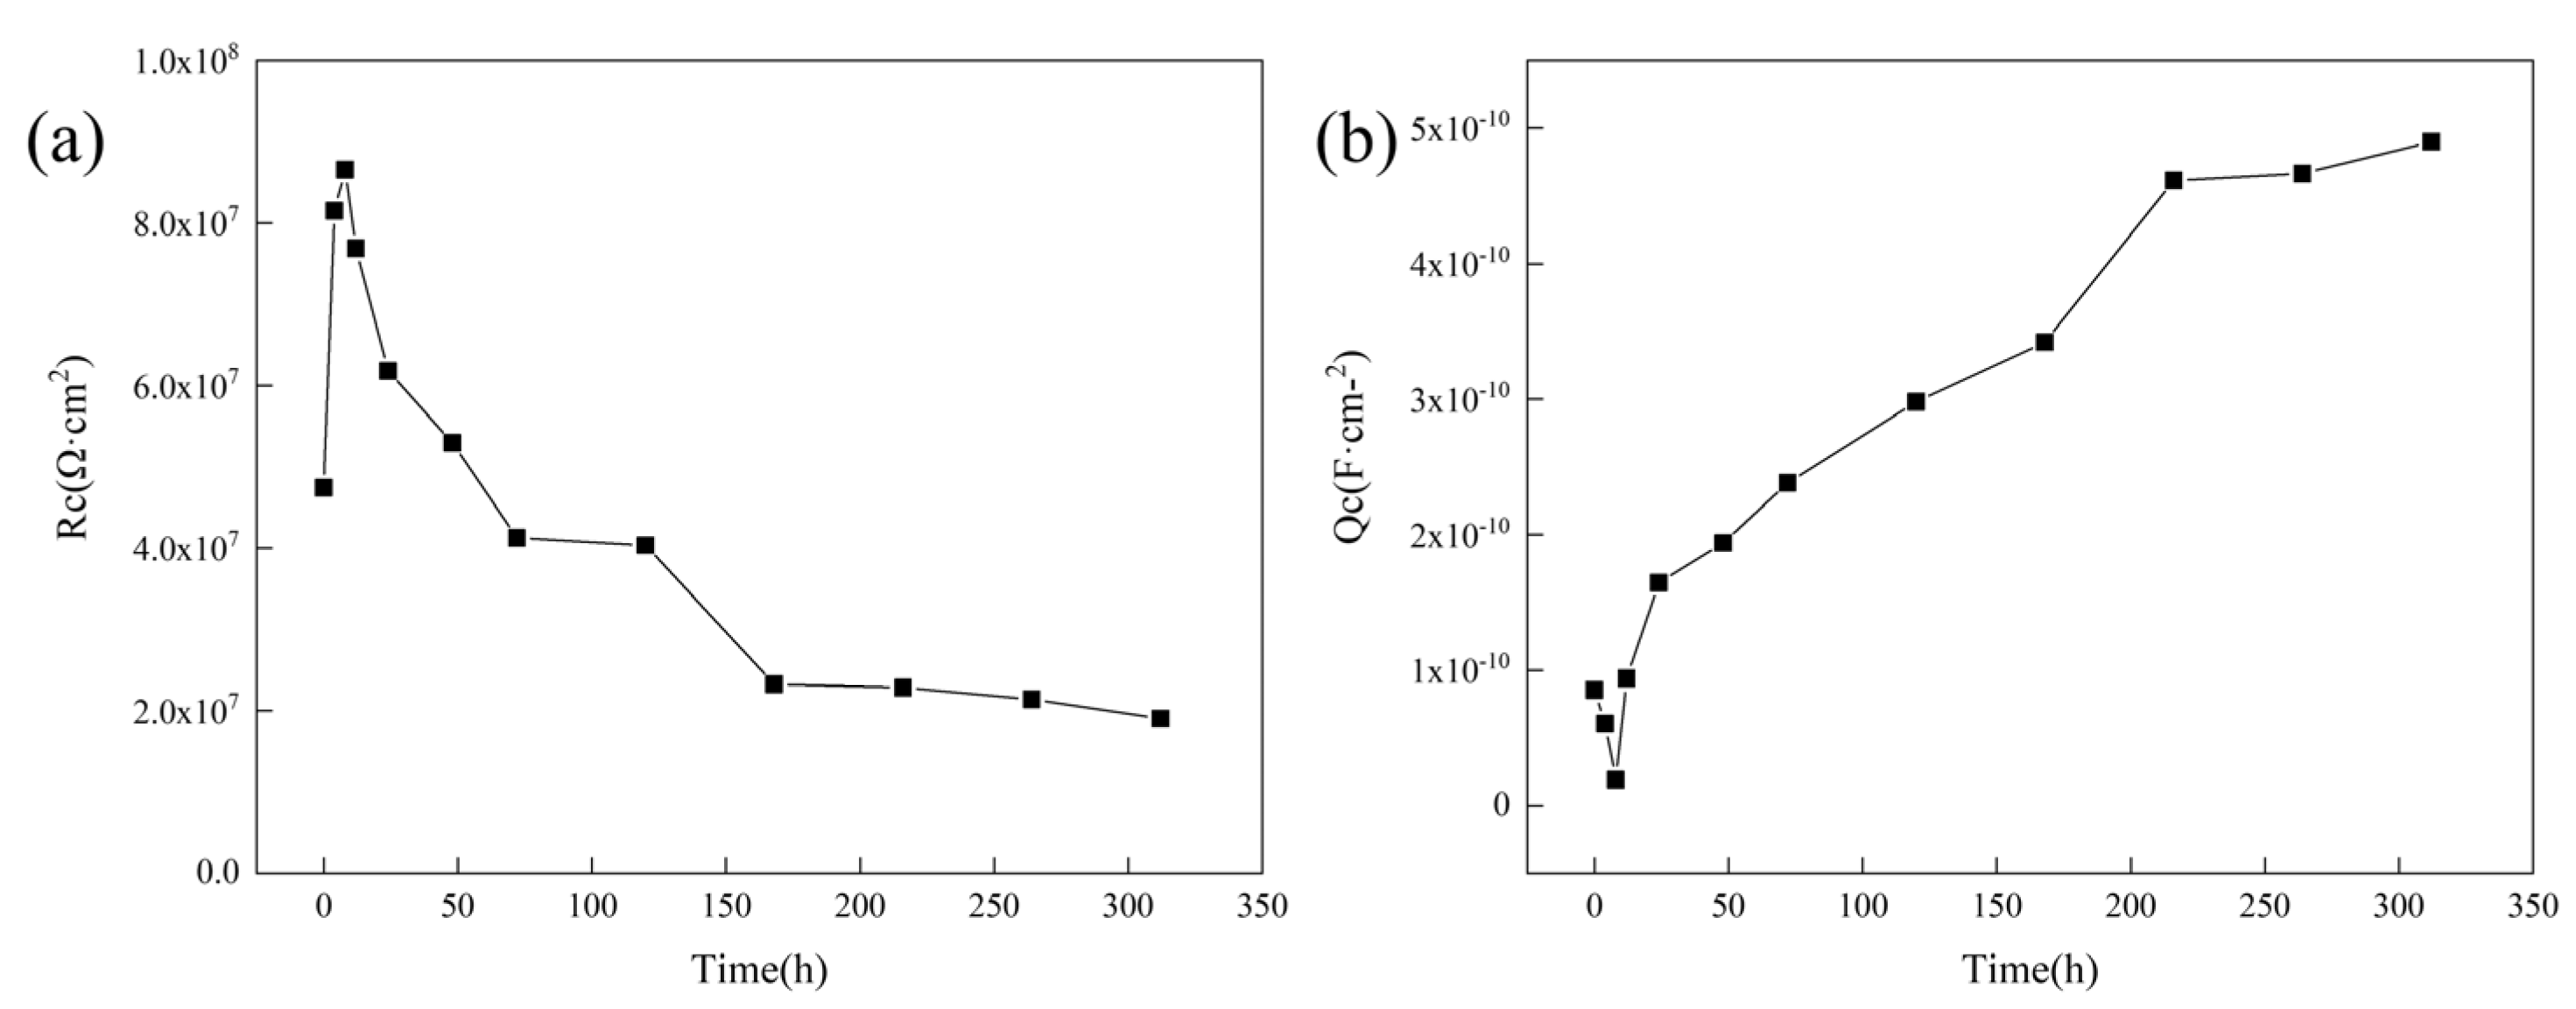
3.4.2. Research on Anti-Corrosion Properties of Coatings Based on Electrochemical Experiments
3.4.3. Study of the Difference in Anti-Corrosion Performance of Self-Healing Coatings in Acid and Alkali Environments
4. Conclusions
Author Contributions
Funding
Data Availability Statement
Conflicts of Interest
References
- Upadhyay, V.; Battocchi, D. Localized electrochemical characterization of organic coatings: A brief review. Prog. Org. Coat. 2016, 99, 365–377. [Google Scholar] [CrossRef]
- Vimalanandan, A.; Lv, L.P.; Tran, T.H.; Landfester, K.; Crespy, D.; Rohwerder, M. Redox-Responsive Self-Healing for Corrosion Protection. Adv. Mater. 2013, 25, 6980–6984. [Google Scholar] [CrossRef] [PubMed]
- Song, Y.; Chung, C. Repeatable self-healing of a microcapsule-type protective coating. Polym. Chem. 2013, 4, 4940–4947. [Google Scholar] [CrossRef]
- Gao, L.; He, J.; Hu, J.; Wang, C. Photoresponsive Self-Healing Polymer Composite with Photoabsorbing Hybrid Microcapsules. Acs Appl. Mater. Interfaces 2015, 7, 25546–25552. [Google Scholar] [CrossRef]
- Skorb, E.V.; Skirtach, A.G.; Sviridov, D.V.; Shchukin, D.G.; Möhwald, H. Laser-Controllable Coatings for Corrosion Protection. ACS Nano 2009, 3, 1753–1760. [Google Scholar] [CrossRef] [PubMed]
- Song, Y.; Jo, Y.; Lim, Y.; Cho, S.; Yu, H.; Ryu, B.; Lee, S.; Chung, C. Sunlight-Induced Self-Healing of a Microcapsule-Type Protective Coating. ACS Appl. Mater. Interfaces 2013, 5, 1378–1384. [Google Scholar] [CrossRef]
- Chen, T.; Chen, R.; Jin, Z.; Liu, J. Engineering hollow mesoporous silica nanocontainers with molecular switches for continuous self-healing anticorrosion coating. J. Mater. Chem. A Mater. Energy Sustain. 2015, 3, 9510–9516. [Google Scholar] [CrossRef]
- Fu, J.; Chen, T.; Wang, M.; Yang, N.; Li, S.; Wang, Y.; Liu, X. Acid and Alkaline Dual Stimuli-Responsive Mechanized Hollow Mesoporous Silica Nanoparticles as Smart Nanocontainers for Intelligent Anticorrosion Coatings. ACS Nano 2013, 7, 11397–11408. [Google Scholar] [CrossRef]
- Qian, B.; Zheng, Z.; Michailids, M.; Fleck, N.; Bilton, M.; Song, Y.; Li, G.; Shchukin, D. Mussel-Inspired Self-Healing Coatings Based on Polydopamine-Coated Nanocontainers for Corrosion Protection. ACS Appl. Mater. Interfaces 2019, 11, 10283–10291. [Google Scholar] [CrossRef]
- Kötteritzsch, J.; Stumpf, S.; Hoeppener, S.; Vitz, J.; Hager, M.D.; Schubert, U.S. One-Component Intrinsic Self-Healing Coatings Based on Reversible Crosslinking by Diels-Alder Cycloadditions. Macromol. Chem. Phys. 2013, 214, 1636–1649. [Google Scholar] [CrossRef]
- Fang, Y.; Li, J.; Du, X.; Du, Z.; Cheng, X.; Wang, H. Thermal- and mechanical-responsive polyurethane elastomers with self-healing, mechanical-reinforced, and thermal-stable capabilities. Polymer 2018, 158, 166–175. [Google Scholar] [CrossRef]
- Fan, W.; Zhang, Y.; Li, W.; Wang, W.; Zhao, X.; Song, L. Multi-level self-healing ability of shape memory polyurethane coating with microcapsules by induction heating. Chem. Eng. J. 2019, 368, 1033–1044. [Google Scholar] [CrossRef]
- Li, G.L.; Zheng, Z.; Möhwald, H.; Shchukin, D.G. Silica/polymer double-walled hybrid nanotubes: Synthesis and application as stimuli-responsive nanocontainers in self-healing coatings. ACS Nano 2013, 7, 2470–2478. [Google Scholar] [CrossRef] [PubMed]
- Poznyak, S.K.; Tedim, J.; Rodrigues, L.M.; Salak, A.N.; Zheludkevich, M.L.; Dick, L.F.P.; Ferreira, M.G.S. Novel Inorganic Host Layered Double Hydroxides Intercalated with Guest Organic Inhibitors for Anticorrosion Applications. ACS Appl. Mater. Interfaces 2009, 1, 2353–2362. [Google Scholar] [CrossRef] [PubMed]
- Ghazi, A.; Ghasemi, E.; Mahdavian, M.; Ramezanzadeh, B.; Rostami, M. The application of benzimidazole and zinc cations intercalated sodium montmorillonite as smart ion exchange inhibiting pigments in the epoxy ester coating. Corros. Sci. 2015, 94, 207–217. [Google Scholar] [CrossRef]
- Shchukin, D.G.; Zheludkevich, M.; Yasakau, K.; Lamaka, S.; Ferreira, M.G.S.; Möhwald, H. Layer-by-Layer Assembled Nanocontainers for Self-Healing Corrosion Protection. Adv. Mater. 2006, 18, 1672–1678. [Google Scholar] [CrossRef]
- Shchukin, D.G.; Lamaka, S.V.; Yasakau, K.A.; Zheludkevich, M.L.; Ferreira, M.G.S.; Möhwald, H. Active Anticorrosion Coatings with Halloysite Nanocontainers. J. Phys. Chem. C 2008, 112, 958–964. [Google Scholar] [CrossRef]
- Jafari, A.H.; Hosseini, S.M.A.; Jamalizadeh, E. Investigation of Smart Nanocapsules Containing Inhibitors for Corrosion Protection of Copper. Electrochim. Acta 2010, 55, 9004–9009. [Google Scholar] [CrossRef]
- Wang, M.; Chen, T.; Ding, C.; Fu, J. Mechanized silica nanoparticles based on reversible bistable [2]pseudorotaxanes as supramolecular nanovalves for multistage pH-controlled release. Chem. Commun. 2014, 50, 5068–5071. [Google Scholar] [CrossRef]
- Zheng, Z.; Huang, X.; Schenderlein, M.; Moehwald, H.; Xu, G.K.; Shchukin, D.G. Bioinspired nanovalves with selective permeability and pH sensitivity. Nanoscale 2015, 7, 2409–2416. [Google Scholar] [CrossRef]
- Xing, X.; Wang, J.; Li, Q.; Hu, W.; Yuan, J. A novel acid-responsive HNTs-based corrosion inhibitor for protection of carbon steel. Colloids Surf. A Physicochem. Eng. Asp. 2018, 553, 295–304. [Google Scholar] [CrossRef]
- Qian, B.; Michailidis, M.; Bilton, M.; Hobson, T.; Zheng, Z.; Shchukin, D. Tannic complexes coated nanocontainers for controlled release of corrosion inhibitors in self-healing coatings. Electrochim. Acta 2019, 297, 1035–1041. [Google Scholar] [CrossRef]
- Richardson, J.J.; Björnmalm, M.; Caruso, F. Technology-driven layer-by-layer assembly of nanofilms. Science 2015, 348, aaa2491. [Google Scholar] [CrossRef]
- Zan, X.; Su, Z. Polyelectrolyte multilayer films containing silver as antibacterial coatings. Thin Solid Films 2010, 518, 5478–5482. [Google Scholar] [CrossRef]
- Sato, K.; Yoshida, K.; Takahashi, S.; Anzai, J. pH- and sugar-sensitive layer-by-layer films and microcapsules for drug delivery. Adv. Drug Deliv. Rev. 2011, 63, 809–821. [Google Scholar] [CrossRef]
- Deberry, D.W. Modification of the electrochemical and corrosion behavior of stainless steels with an electroactive coating. J. Electrochem. Soc. 1985, 132, 1022–1026. [Google Scholar] [CrossRef]
- Kazemi-Andalib, F.; Mohammadikish, M.; Divsalar, A.; Sahebi, U. Hollow microcapsule with pH-sensitive chitosan/polymer shell for in vitro delivery of curcumin and gemcitabine. Eur. Polym. J. 2022, 162, 110887. [Google Scholar] [CrossRef]
- Leal, D.A.; Riegel-Vidotti, I.C.; Ferreira, M.G.S.; Marino, C.E.B. Smart coating based on double stimuli-responsive microcapsules containing linseed oil and benzotriazole for active corrosion protection. Corros. Sci. 2018, 130, 56–63. [Google Scholar] [CrossRef]
- Yun, H.-R.; Lu, L.; Hao, X.-L.; Zhang, X.-X. Fabrication of corrosion inhibiting microcapsules functional coating and their high-efficiency corrosion resistance. Rare Met. 2023, 43, 842–848. [Google Scholar] [CrossRef]
- Tang, D.-Z.; Du, Y.-X.; Lu, M.-X.; Liang, Y.; Jiang, Z.-T. Effect of pH value on corrosion of carbon steel under an applied alternating current. Mater. Corros. 2015, 66, 1467–1479. [Google Scholar] [CrossRef]
- Tan, H.L.; McMurdo, M.J.; Pan, G.; Van Patten, P.G. Temperature Dependence of Polyelectrolyte Multilayer Assembly. Langmuir 2003, 19, 9311–9314. [Google Scholar] [CrossRef]
- ASTM_B117-2011; Standard Practice for Operating Salt Spray (Fog) Apparatus. American Society for Testing and Materials: West Conshohocken, PA, USA, 2011.
- Xu, Y.; Zhao, A.; Wang, X.; Xue, H.; Liu, L. Influence of curing accelerators on the imidization of pol-yamic acids and properties of polyimide films. J. Wuhan Univ. Technol.-Mater. Sci. Ed. 2016, 31, 1137–1143. [Google Scholar] [CrossRef]
- Nunes, C.; Viani, A.; Ševčík, R. Microstructural analysis of lime paste with the addition of linseed oil, stand oil, and rapeseed oil. Constr. Build. Mater. 2020, 238, 117780. [Google Scholar] [CrossRef]
- Jorcin, J.-B.; Scheltjens, G.; Van Ingelgem, Y.; Tourwé, E.; Van Assche, G.; De Graeve, I.; Van Mele, B.; Terryn, H.; Hubin, A. Investigation of the self-healing properties of shape memory polyurethane coatings with the ‘odd random phase multisine’ electrochemical impedance spectroscopy. Electrochim. Acta 2010, 55, 6195–6203. [Google Scholar] [CrossRef]
- Zhang, K.; Wang, L.; Liu, G. Copper(II) 8-hydroxyquinolinate 3D network film with corrosion inhibitor embedded for self-healing corrosion protection. Corros. Sci. 2013, 75, 38–46. [Google Scholar] [CrossRef]
- Fu, T.; Tang, X.; Cai, Z.; Zuo, Y.; Tang, Y.; Zhao, X. Correlation research of phase angle variation and coating performance by means of Pearson’s correlation coefficient. Prog. Org. Coat. 2020, 139, 105459. [Google Scholar] [CrossRef]
- Zuo, Y.; Pang, R.; Li, W.; Xiong, J.P.; Tang, Y.M. The evaluation of coating performance by the variations of phase angles in middle and high frequency domains of EIS. Corros. Sci. 2008, 50, 3322–3328. [Google Scholar] [CrossRef]
- da Cunha, A.B.M.; Leal, D.A.; Santos, L.R.L.; Riegel-Vidotti, I.C.; Marino, C.E.B. pH-sensitive microcapsules based on biopolymers for active corrosion protection of carbon steel at different pH. Surf. Coat. Technol. 2020, 402, 126338. [Google Scholar] [CrossRef]


| Stage | Time (h) | Rs (Ω·cm2) | Qc (F·cm−2) | Rc (Ω·cm2) | Qdl (F·cm−2) | Rt (Ω·cm2) |
|---|---|---|---|---|---|---|
| Self-healing | 0 | 4493 | 8.5381 × 10⁻¹¹ | 4.74 × 10⁷ | - | - |
| 4 | 4672 | 6.0461 × 10⁻¹¹ | 8.15 × 10⁷ | - | - | |
| 8 | 6157 | 1.9 × 10⁻¹¹ | 8.66 × 10⁷ | - | - | |
| Infiltration | 12 | 6559 | 9.3759 × 10⁻¹⁰ | 7.69 × 10⁷ | - | - |
| 24 | 5793 | 1.6446 × 10⁻¹⁰ | 6.18 × 10⁷ | - | - | |
| 48 | 6534 | 1.9379 × 10⁻¹⁰ | 5.30 × 10⁷ | - | - | |
| 72 | 3074 | 2.3812 × 10⁻¹⁰ | 4.12 × 10⁷ | - | - | |
| 120 | 3127 | 2.9789 × 10⁻¹⁰ | 4.04 × 10⁷ | - | - | |
| Failure | 168 | 2667 | 3.420 × 10⁻¹⁰ | 2.32 × 10⁷ | 1.26 × 10⁻¹⁰ | 4.07 × 10⁷ |
| 216 | 5206 | 4.6131 × 10⁻¹⁰ | 2.28 × 10⁷ | 1.36 × 10⁻¹⁰ | 5.28 × 10⁶ | |
| 264 | 2771 | 4.6644 × 10⁻¹⁰ | 2.14 × 10⁷ | 3.64 × 10⁻¹⁰ | 7.87 × 10⁶ | |
| 312 | 6636 | 4.899 × 10⁻¹⁰ | 7.04 × 10⁶ | 1.32 × 10⁻¹⁰ | 2.05 × 10⁶ |
Disclaimer/Publisher’s Note: The statements, opinions and data contained in all publications are solely those of the individual author(s) and contributor(s) and not of MDPI and/or the editor(s). MDPI and/or the editor(s) disclaim responsibility for any injury to people or property resulting from any ideas, methods, instructions or products referred to in the content. |
© 2024 by the authors. Licensee MDPI, Basel, Switzerland. This article is an open access article distributed under the terms and conditions of the Creative Commons Attribution (CC BY) license (https://creativecommons.org/licenses/by/4.0/).
Share and Cite
Liu, J.; Chen, F.; Zhang, Q.; Xing, X.; Cui, G. Study on Preparation and Performance of Acid pH-Responsive Intelligent Self-Healing Coating. Polymers 2024, 16, 2473. https://doi.org/10.3390/polym16172473
Liu J, Chen F, Zhang Q, Xing X, Cui G. Study on Preparation and Performance of Acid pH-Responsive Intelligent Self-Healing Coating. Polymers. 2024; 16(17):2473. https://doi.org/10.3390/polym16172473
Chicago/Turabian StyleLiu, Jianguo, Feiyu Chen, Qiaosheng Zhang, Xiao Xing, and Gan Cui. 2024. "Study on Preparation and Performance of Acid pH-Responsive Intelligent Self-Healing Coating" Polymers 16, no. 17: 2473. https://doi.org/10.3390/polym16172473