Abstract
The conventional production technique employed for low-permeability tight reservoirs exhibits limited productivity. To solve the problem, an acetate-type supercritical carbon dioxide (scCO2) thickener, PVE, which contains a large number of microporous structures, was prepared using the atom transfer radical polymerization (ATRP) method. The product exhibited an ability to decrease the minimum miscibility pressure of scCO2 during a solubility test and demonstrated a favorable extraction efficiency in a low-permeability tight core displacement test. At 15 MPa and 70 °C, PVE-scCO2 at a concentration of 0.2% exhibits effective oil recovery rates of 5.61% for the 0.25 mD core and 2.65% for the 5 mD core. The result demonstrates that the incorporation of the thickener PVE can effectively mitigate gas channeling, further improve oil displacement efficiency, and inflict minimal damage to crude oil. The mechanism of thickening was analyzed through molecular simulation. The calculated trend of thickening exhibited excellent agreement with the experimental measurement rule. The simulation results demonstrate that the contact area between the polymer and CO2 increases in direct proportion to both the number of thickener molecules and the viscosity of the system. The study presents an effective strategy for mitigating gas channeling during scCO2 flooding and has a wide application prospect.
1. Introduction
The development of unconventional oil and gas fields is increasingly reliant on tight oil reservoirs, which had a global technically recoverable reserve of approximately 480.28 × 10⁸ t in 2021, accounting for merely 4.96% of the total global reserves [1]. It is important to note that there still exists significant untapped potential in the field of tight oil development. A low-permeability tight reservoir exhibits characteristics of tight lithology, low porosity and permeability, prominent non-Darcy flow behavior, low pressure coefficient, amplitude traps, and low natural productivity. The tight reservoirs in China, predominantly lacustrine in nature, exhibit a lower reservoir pressure coefficient, significant heterogeneity [2], and relatively low maturity when compared to the marine tight oil formations found in North America [3]. The initial development phase in China included natural depletion mining and water flooding mining, resulting in a significant deficiency in formation energy and waterflooding causing heavy-scale precipitation [4]. The current approach to enhanced oil recovery primarily involves the combination of horizontal well fracturing, water flooding enhancement, and various auxiliary techniques [5,6]. The utilization of gas flooding has gradually gained global recognition among scientists due to its abundant sources, diverse composition, and effective maintenance of formation pressure. The adaptation range varies among gases, with specific advantages and disadvantages outlined in Table 1.

Table 1.
The pros and cons of various gas flooding applications.
Carbon dioxide (CO2) flooding technology has garnered significant attention in the realm of low-permeability tight reservoirs due to its dual benefits of recovery and emission reduction [12]. Experimental findings from the Bakken and Eagle Ford formations, which exhibit notable recovery effects, demonstrate that the injection of carbon dioxide effectively penetrates heterogeneous rock, facilitating the enhanced recovery of residual oil within the matrix [13,14]. A physical simulation test of oil displacement in a Daqing block has also confirmed that carbon dioxide flooding can enhance the recovery of crude oil with large and medium pores in low-permeability cores [15]. The continuous increase in temperature and pressure beneath the reservoir results in the transformation of CO2 into a supercritical state, which enhances its solubility in crude oil. Additionally, the higher compression ratio contributes to an expansion in the volume of crude oil. The significant disparity in viscosity between crude oil and CO2, however, gives rise to challenges such as flow disturbances and environmental acidification [16]. Scientists have put forward two types of solutions for this purpose: The first approach is to decrease the viscosity of crude oil by introducing light hydrocarbons or microorganisms. The alternative is to enhance the viscosity of the displacement phase by incorporating suitable additives into carbon dioxide to form a carbon dioxide foam or a uniform thickening system [17,18,19]. Taking into account the current state of technological development, as well as considerations for production safety and economic factors, introducing a thickening agent into supercritical carbon dioxide (scCO2) to mitigate the viscosity difference between the two phases will overcome the aforementioned technical bottleneck [20], enhance displacement phase performance, and facilitate residual oil recovery.
Reputable scholars, both domestic and international, have conducted extensive research on the development and application of carbon dioxide thickeners. The current understanding is that the most effective thickeners contain fluorine and silicon [21,22]. However, the cost of silicon-based thickeners is high, and the presence of toxic or harmful components such as fluorine and ether in some thickeners causes significant damage to water and soil and cannot meet the current requirements of green development [23,24,25]. Acrylamide thickeners exhibit sensitivity to injection pressure, and the incorporation of fibers/microspheres yields favorable results, albeit at a higher cost [26,27,28]. The development of cost-effective and environmentally friendly thickeners is therefore imperative. The ideal thickener for oil displacement should solely rely on the functional groups composed of C, H, and O in the molecule to achieve its purpose without introducing any hydrocarbons or other elements that are not present in CO2. The ideal thickener should minimize the addition of cosolvent while demonstrating excellent adaptability to the reservoir environment. The thickening mechanism of an acetate thickener is analogous to that of a hydrocarbon-based thickener [29], and its structure also fulfills the requirement for an ideal thickener by not introducing any additional elements. Polyvinyl acetate ester exhibits excellent lipophilicity, eliminating the need for any additional additives during its application process and facilitating cost control. However, the utilization of polyvinyl acetate ester (PVAC) in its pure form often leads to a molecular volume that is too large to permeate through the porous medium effectively, resulting in limited thickening efficacy that fails to meet the requirements of practical applications.
The present study involves the synthesis of a type of environmentally friendly thickener (Polymer-Viscosity-Enhance, PVE) that can adapt to the requirements of CO2 flooding in tight sandstone reservoirs. In this paper, the solubility, thickening performance, and thickener displacement effect are evaluated for PVE, and the influence of the displacement agent on the core and crude oil composition is investigated. In addition, the team analyzed the thickening mechanism from the perspective of the microscopic mechanism, providing theoretical support for the field application of thickener/scCO2 flooding.
2. Materials and Methods
2.1. SEM Measurement of the Rock Samples
A low-permeability tight sandstone core (Φ38 mm * 200 mm) from a block in Daqing Oilfield was selected, with gas permeability measurements recorded as 0.25 mD and 5 mD. The fresh sandstone surface was subjected to gold spraying scanning using a scanning electron microscope, enabling the observation of microstructure distribution in the core section.
2.2. Method for Producing Thickening Agent—PVE
An MA-ST aqueous solution was prepared in a deoxygenated environment by combining maleic anhydride (MA, Shanghai Aladdin Biochemical Technology Co., Ltd., Shanghai, China) and styrene (St, Shanghai Aladdin Biochemical Technology Co., Ltd.) in a molar ratio of 4:1. Subsequently, the solution was transferred into a 500 mL four-port flask. The solution was heated in a water bath with continuous stirring. When the temperature exceeded 70 °C, the initiator benzoyl peroxide (BPO, Shanghai Aladdin Biochemical Technology Co., Ltd.) was introduced, followed by the addition of vinyl acetate (VAC, Shanghai Aladdin Biochemical Technology Co., Ltd.) through a separation funnel. The control VAC was dripped at a flow rate for one hour, followed by a constant-temperature reaction for two hours before the reaction was stopped and the temperature was turned off. After being cooled to 50 °C, the light-yellow viscous liquid in the bottle was directly mixed with anhydrous ethanol absolute (99.5%, Sinopharm Group Chemical Reagent Co., Ltd., Beijing, China) for solvent water and incomplete monomer removal. After the solid was extracted and filtered, the crude product was transferred to a freeze-dryer (FD-1D-110, BIOCOOL (Beijing) Instrument Co., Ltd., Beijing, China) for a duration of 2 h. Subsequently, the final product, PVE, was obtained in loose white powder form, and it underwent grinding into 100~200 mesh particles for further utilization. The synthesis flow chart is shown in Figure 1.
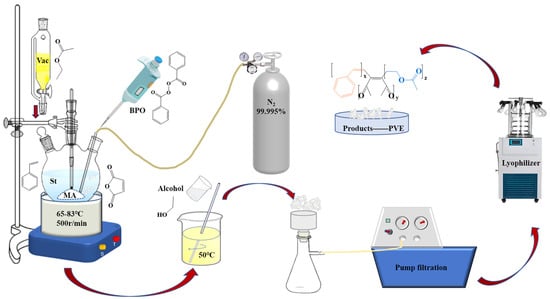
Figure 1.
The diagram of the PVE synthesis device.
2.3. FT-IR Measurement of PVE
The appropriate quantity of product powder was purified and subsequently compressed using potassium bromide. Following confirmation of the completion of compression, the synthesized product was characterized utilizing the Spectrum Two L1600401 infrared spectrometer (PerkinElmer, Waltham, MA, USA), and the infrared absorption spectrum of the product was obtained.
2.4. NMR Measurement of PVE
The structure of the synthesized polymer was characterized using a Bruker-400 MHz NMR instrument (Brucker, Beijing, China) with 13C NMR spectroscopy capability; tetramethylsilane (TMS) served as the internal standard, and D2O was employed as the solvent.
2.5. SEM Measurement of PVE
Conductive adhesive was reapplied onto the sample table, and gold (platinum) spraying was set to a constant speed for 10 min.
2.6. TG and DSC Measurement of PVE
The temperature–mass correlation of the sample was determined utilizing a differential thermogravimetric synchronous analyzer, which regulated the temperature within an oxygen atmosphere from 0 to 800 °C at a heating rate of 5 °C/min. Ultimately, the heat loss spectrum was acquired. The thermal stability of the product was assessed using the heat loss curve and its corresponding differential curve (the testing protocol followed ISO 11358-1:222 as a reference standard) [30].
2.7. Solubility Test of PVE in scCO2
The thickening agent was added to a 350 mL high-temperature and high-pressure variable-speed visual reactor (temperature measuring range, 20~180 °C; pressure, 40 MPa; homemade) at a mass fraction of 0.1%, and enough CO2 was injected into the reactor at room temperature. The system temperature was set to 70 °C, and the pressure of the system was raised to 7.84 MPa or higher using a pressurizing device. To ensure complete dissolution of the polymer, the PVE-scCO2 mixture was stirred at a low speed (300 r/min) for 5 min and then allowed to stand under constant pressure for an additional 5 min. The system state in the reactor was continuously monitored during the pressurization process, and the feedback number of the pressure probe was recorded in the window when the system underwent phase change (minimum miscible pressure). To ensure experimental accuracy, the autoclave system pressure was adjusted by manipulating the hand pump near the critical point of phase transformation to obtain an average value. A control group without any treatment was established, and pure CO2 was injected into the system to maintain consistent environmental conditions with those of the thickener-treated system.
2.8. Evaluation of Viscosification Effect of PVE
The fully dissolved PVE-scCO2 mixture was introduced into a closed Harker Mars 60 rheometer (Thermo Fischel, Dreieich, Germany), which was designed to withstand high pressure, acid corrosion, and temperature fluctuations at 70 °C. The Job Manager module in the Haake RheoWin software 4 was selected for automatic process control of measurement and analysis procedures. The system was pre-sheared for 10 min to ensure the thorough mixing of PVE and scCO2, with the shear rate set at 1000 s−1. After pre-shear, the shear rate was adjusted to 170 s−1, and the system was incrementally heated at 10, 15, and 20 MPa to investigate the variation in the shear viscosity of the system. The control group was composed solely of pure scCO2.
2.9. Assessment of Oil Displacement Effect
The core holder (Φ38 mm × 30 mm) was placed in a 70 °C incubator. The mixture, which was fully mixed with 0.2% PVE and scCO2, was achieved by stirring with a piston, followed by displacement until the completion of the experiment. The natural core was subjected to scCO2 flooding at an injection pressure of 15 MPa to simulate the formation environment. The displacement rate was measured at 0.02 mL/min. The investigation focused on the displacement efficiency of cores with varying permeability and the impact of introducing PVE.
2.10. Gas–Oil Relative Permeability Measurement
The experiment reference was ASTM D4525-13-Standard [31] Test Method for Permeability of Rocks by Flowing Air. A natural outcrop core was measured using dry air as the tested medium, and the gas phase permeability curve trend of different cores was compared before and after 0.2% PVE displacement. The oil phase permeability Kro was determined with reference to MNL7320140019 “Reservoir Types and Characterization” [32].
2.11. Analysis of the Fluid Produced
The oil samples before and after displacement were collected, dehydrated, and subjected to analysis using an Agilent 7890 A (Santa Clara, CA, USA) gas chromatograph. The test was conducted using column chromatography. Normal hexane was employed for the precipitation and filtration of an asphaltene solution in rock soluble organic matter or crude oil. Subsequently, the filtrate was subjected to washing with organic solvents of varying polarity, resulting in the sequential acquisition of saturated hydrocarbon, aromatic hydrocarbon, and colloid solutions. Finally, the volatile solvent from the component solution was weighed until a constant weight was achieved to determine the mass fraction of components present in the sample.
2.12. Molecular Dynamics (MD) Simulation of Thickening Mechanism
The thickening mechanism of the system was analyzed through a classical molecular simulation, based on the observed phenomenon that carbon dioxide effectively enhances production when it undergoes thickening [33]. GROMACS-2020.6 software and the charmm36 force field were employed for conducting molecular dynamics simulations [34,35]. The molecular dynamics (MD) simulation was conducted with constant pressure, temperature, and three-dimensional periodic boundary conditions (PBCs). The Berendsen, V-rescale, and Nose–Hoover thermostats were employed for temperature control in the NVT ensemble equilibration, NPT ensemble equilibration, and final product simulation [36,37]. The changes in viscosity and contact area of the system were determined based on the final equilibrium structure under different concentrations and environmental conditions [38]. To optimize energy reduction, an initial uniform distribution was set for the structure, and a blank control for viscosity was implemented in the pure CO2 system with a specific number of molecules.
3. Results and Discussion
3.1. Rock Micromorphology Analysis
The SEM scanning results of the core are shown in Figure 2.
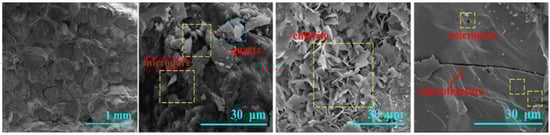
Figure 2.
SEM of sandstone sample.
The results of scanning electron microscopy indicate that the selected cores exhibit a relatively high density and are characterized by a significant presence of particle structures. The structures are mainly filled with flake chlorite and local quartz particles, along with micron-scale pores and microcracks. The aforementioned characteristics are indicative of sandstones with high density and low permeability.
3.2. Structure and Performance Analysis of PVE
3.2.1. Enhanced Techniques for Spectral Analysis
The infrared absorption spectrum of the synthetic product is depicted in Figure 3a. The nuclear magnetic spectrum of the product is shown in Figure 3b.
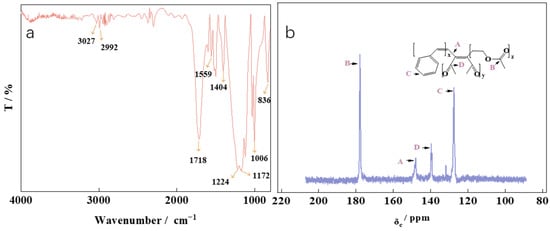
Figure 3.
The FT-IR spectra (a) and NMR spectra (b) of PVE.
The data in Figure 3a show that the -COOH stretching vibration in VAC exhibits an absorption peak at 1559 cm−1, while the ester group C=O stretching vibration in VAC displays an absorption peak at 1718 cm−1. The benzene ring carbon skeleton of St demonstrates stretching vibration absorption peaks at 1404 and 836 cm−1. Additionally, C-H bonds are observed at 2992 and 3027 cm−1, whereas antisymmetric and stretching vibration peaks of C=O in MA are detected at 1224 cm−1, 1172 cm−1, and 1006.77 cm−1. According to the principle of nuclear magnetic carbon spectrum analysis [39,40], the peaks at δ = 127.49 and 131.8 in Figure 3b correspond to benzene ring formations, while the peak at 147.97 represents C=C bonds on VAC. Additionally, the peaks at 139.66 and 139.26 indicate multiple -COO groups in VAC, whereas the peak at 177.95 corresponds to -C-CH3 in MA. The combination of FT IR and 13C NMR for the product allows it to be identified as a ternary polymer of St-MA-VAc, which is named PVE.
3.2.2. Microstructure Analysis of PVE Using SEM
The SEM characterization results of PVE powder are shown in Figure 4.
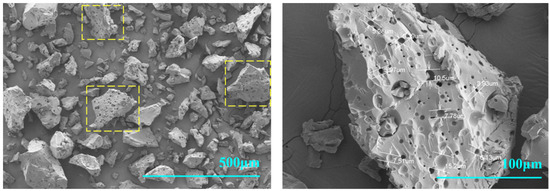
Figure 4.
The SEM of the PVE sample powder.
As shown in Figure 4, the PVE samples are irregularly shaped, massive particles measuring 130 to 190 μm in diameter. The surface of these particles is covered with numerous uniformly distributed pores clearly in the yellow squares, each with a diameter ranging from approximately 5 to 10 μm.
3.2.3. Analysis of Heat Resistance of PVE
The TG and DSC curves of PVE were investigated experimentally, as shown in Figure 5.
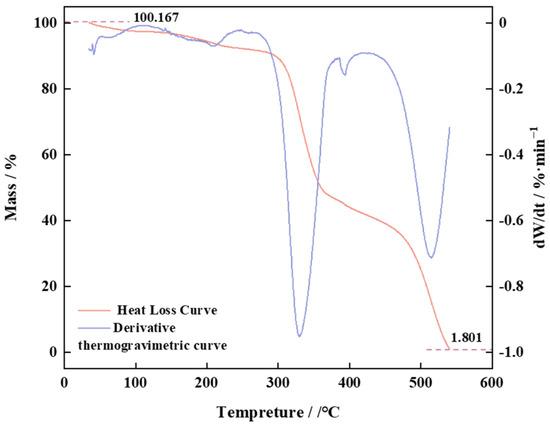
Figure 5.
TG and DSC of PVE.
Based on the thermogravimetric and differential curve data of the product, the heat loss process can be classified into four distinct stages. In the first stage, the weight loss at 50–150 °C is measured to be 3.131%, indicating the evaporation of bound water in the sample. During the second stage, the thermal decomposition of the side-chain carboxylic acid in the sample results in a weight loss of 5.525% within the temperature range of 150–280 °C. The third stage occurs at a temperature range of 280–369 °C, during which there is a significant weight reduction caused by the fracture of the main chain (C-C), accounting for 69.4927%. In the fourth stage, at a temperature range of 470–530 °C, the benzene ring undergoes fracture resulting in heat dissipation, leading to a final residue content of 1.801% in the sample that can sustain a stable structure within the temperature range of 80–150 °C. The aforementioned analysis has confirmed the sample. The initial portion of the curve exhibits an excess of 100%, attributed to the preheating and volatilization process of the solvent.
3.2.4. Solubility of PVE in scCO2
The observation through the window in Figure 6 revealed that as pressure increased, CO2 underwent a gradual liquefaction process, resulting in a progressive rise of the liquid level from the bottom to the top of the window. The light transmittance of the window system decreased as the pressure increased [41], indicating that the system entered the critical phase transition range towards a liquid–supercritical state. After the continuous increase in pressure, the system rapidly reached a state of clarity, indicating that the CO2 within the reactor had already transitioned into a supercritical phase. Consequently, further pressure escalation was halted. The recorded reading on the pressure probe at this point corresponded to the minimum miscible pressure (7.80 MPa). The system in the observation window remained uniformly transparent during the stage of low-speed stirring and constant-pressure standing, with no observed presence of insoluble solid substances in the scCO2 system. This indicates that PVE, with a mass fraction of 0.1%, can be completely dissolved in scCO2 under these environmental conditions. The blank control group reached a supercritical state only when the pressure increased to 7.84 MPa, with a pressure difference of 0.04 MPa between the two, indicating that PVE could decrease the minimum miscible pressure of the system. The decrease in miscible pressure can be attributed to the -COOH group present in the molecular structure of PVE, which enhances the affinity between the thickener molecule and CO2, reduces interfacial tension, and ultimately leads to a macro-level reduction in miscible pressure.
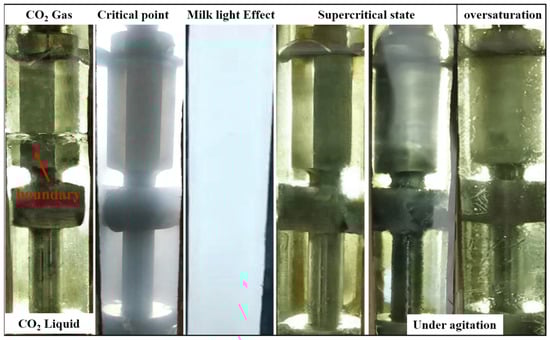
Figure 6.
The process of miscibility and dissolution of PVE in scCO2.
The experiment was conducted under constant pressure, and the dosage of thickener was incrementally increased until a small amount of undissolved granular matter was observed in the system; it was concluded that the maximum solubility of the system for PVE at 7.80 MPa was 2.04%. Under a constant temperature of 70 °C, the system pressure was increased to 15 MPa and 20 MPa. It was observed that the saturation solubility of PVE in scCO2 exhibited an increase corresponding to the rise in pressure [42], measuring 3.03% and 6.28%, respectively. The solubility of the thickener was also examined at 50 °C, revealing that temperature variations had minimal impact on the supercritical phase transition point of pure carbon dioxide. However, it did lead to a reduction in MMP to 7.77 MPa in a maximum system solubility of 2.20% at this condition. These findings indicate that the saturation solubility of PVE in scCO2 decreases with increasing temperature. The reactor speed was adjusted to 3000 revolutions per minute (r/min), and the agitated saturated system was tested under various pressures. The stirring process was influenced by the shear action, leading to the instantaneous gasification of some CO2. However, no solute precipitation occurred in any of the groups, and the system could be restored to a uniform and stable state after ceasing the stirring. The influence of shear on the solubility of the system was negligible. When the system pressure exceeded 7.80 MPa, the system exhibited clarity and transparency. However, upon a reduction in pressure below the critical point, a phase transformation turbidity stage occurred, resulting in cloudiness within the system. Nevertheless, the system was still homogeneous, with no solid material precipitation, proving that the sample can be soluble in supercritical carbon dioxide. The current test results demonstrate that the solubility of PVE in scCO2 remains significantly high, which can be attributed to the robust internal thermal stability of the product below 150 °C and the enhanced molecular thermal motion facilitating dissolution in a high-temperature environment. Rapid dissolution is facilitated by the porous structure, which effectively reduces surface tension.
3.3. The Impact Assessment of PVE
3.3.1. Viscosification Effect Evaluation
The thickening property of the system was evaluated using the rotational volume method [42]. The measurement of torque resistance was conducted under preset conditions of ambient pressure, temperature, and shear velocity. It should be noted that a higher level of resistance indicates an increased viscosity. By considering the rationality of oil displacement cost and the pressure range of the instrument, a mass concentration of 0.2% was selected as the test amount, and the corresponding test results are depicted in Figure 7 [43,44].
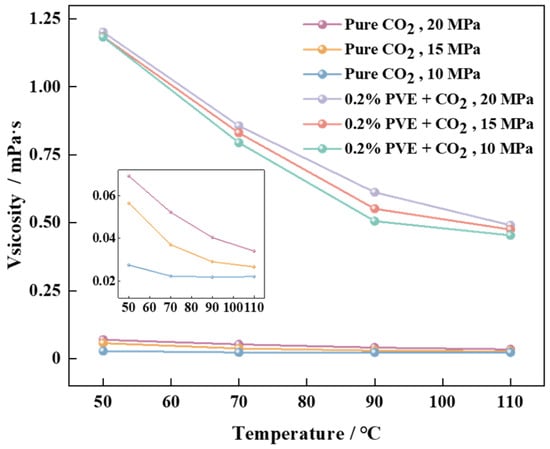
Figure 7.
The temperature-dependent shear viscosity curve of the system under various pressures.
The viscosity of the scCO2 system and pure scCO2 system containing PVE decreases with increasing temperature, as illustrated in Figure 7. Conversely, the viscosity of the system increases with increasing pressure. The addition of 0.2% thickener PVE effectively reduces the viscosity of scCO2, as observed when compared to the viscosity of pure scCO2 under identical environmental conditions. The shear viscosity of the scCO2 system with 0.2% PVE at 10 MPa and 50 °C is measured to be 1.1831 mPa·s, which exhibits a significant increase of 43.04 times compared to pure scCO2 under identical conditions. The system is capable of sustaining a viscosity increase of 19.53 times at 10 MPa and 110 °C. The shear viscosity of the scCO2 system with 0.2% PVE is measured to be 1.2018 mPa·s (which is equivalent to 16.3876 times 0.0691) at 20 MPa and 50 °C. The viscosity of the system increases by a factor of 13.43 at 20 MPa and 110 °C. The viscosity retention rate of the PVE-scCO2 system is 40.06% when the temperature increases from 50 to 110 °C under a constant pressure of 15 MPa. At 70 °C, the viscosity of the PVE-scCO2 system reaches 0.8305 mPa·s and undergoes a thickening effect by a factor of 21.43. The van der Waals force between the CO2-philic groups C=O and -COOH on the molecules of thickener PVE and CO2 in the system is significantly stronger compared to that between CO2 molecules, resulting in a deceleration of molecular movement rate and an enhancement of system viscosity [45,46]. The increase in temperature leads to elevated molecular collision and intramolecular energy, resulting in a decrease in van der Waals force and intermolecular spacing. This promotes enhanced intermolecular movement, ultimately reducing viscosity and enhancing system fluidity. The viscosity of the system is minimally affected by low pressure, but as pressure increases, the reduction in free volume between molecules leads to an increase in intermolecular friction and, subsequently, an increase in viscosity [47].
3.3.2. Effect of PVE on Enhancing scCO2 Flooding and Recovery
The test environment was set to 15 MPa and 70 °C, according to the actual conditions of the target oilfield, for investigating the impact of thickener PVE on the scCO2 flooding effect, as depicted in Figure 8.
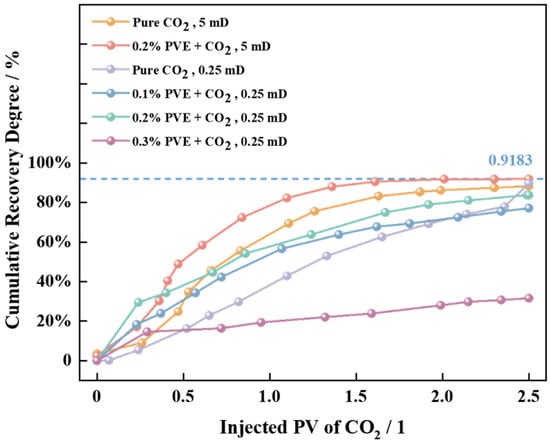
Figure 8.
The curve of experimental results for scCO2 injection displacement.
The results obtained from the permeability cores with 0.25 mD and 5 mD demonstrate that the addition of a 0.2% thickener to the 5 mD core enables an effective extraction of 2.65%. The results indicate that the incorporation of PVE thickener with a mass concentration ranging from 0.1 to 0.2% can further enhance the degree of recovery, and there exists a direct promotion between the degree of recovery and the concentration of introduced thickener. The recovery rate of PVE-scCO2 flooding, which is 0.2%, exhibits a significant increase of 5.61% compared to that achieved by pure scCO2 flooding. The oil displacement effect deteriorates when the thickener concentration reaches 0.3% due to excessively high system viscosity and reduced migration velocity in the pore throat, thereby impeding the sweep effect. This indicates that the thickener has a specific application range (0.1~0.2%) for low-permeability core displacement.
3.3.3. Analysis of Alterations in Core Permeability and Crude Oil Composition
To gain a deeper understanding of the alterations in pore structure and crude oil composition before and after displacement, the phase permeability curves of pure scCO2 as well as 0.2% PVE-scCO2 core- and system-produced liquid were determined and subjected to quantitative analysis using gas chromatography. The resulting phase permeability change curves are depicted in Figure 9, and the component data are shown in Table 2.
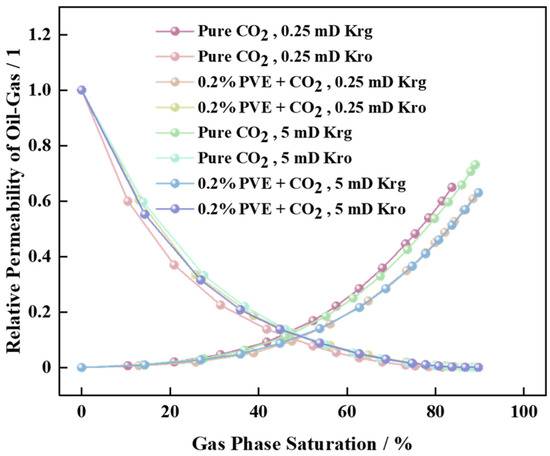
Figure 9.
Variation trend of Kro and Krg curves before and after the introduction of PVE.
Table 2.
The percentage composition of crude oil components 1 (%).
The change law of the phase permeability curve indicates that the introduction of a thickening agent reduces gas phase permeability (Krg) and increases oil phase permeability (Kro). Consequently, thickened supercritical carbon dioxide flooding effectively inhibits gas channeling and promotes improved oil displacement efficiency.
According to the component analysis in Table 2, both scCO2 flooding and PVE-scCO2 contribute to the extraction of light components in crude oil, while the polymer itself has minimal impact on component extraction. As the permeation channel of a 5 mD core is more pronounced than that of a 0.25 mD core, the gas flow rate increases and contact time between carbon dioxide and crude oil decreases, resulting in a gradual reduction in the displacement effect on asphaltene and non-hydrocarbon components with increasing permeability. The total amount in the table is less than 100% due to the presence of other substances, such as mineral particles and heteroatoms, in certain extracted portions. However, these substances do not impact the overall composition assessment.
3.4. Analysis of Molecular Dynamics (MD) Calculation Results
The symmetric structure is considered to possess the highest thermal stability among the various isomers that can occur in polymers, based on empirical evidence. To facilitate the discussion, this paper adopts a symmetrical polymer structure where St is directly connected to MA at both ends of the molecule, and VAC is positioned in the center of the linear polymer, as illustrated in Figure 10. The molecule consists of a total of 190 atoms, with 68 being carbon (C) atoms, 80 being hydrogen (H) atoms, and 42 being oxygen (O) atoms. The dimensions of the molecule are measured as 35.766 A × 19.86 A × 9.736 A.
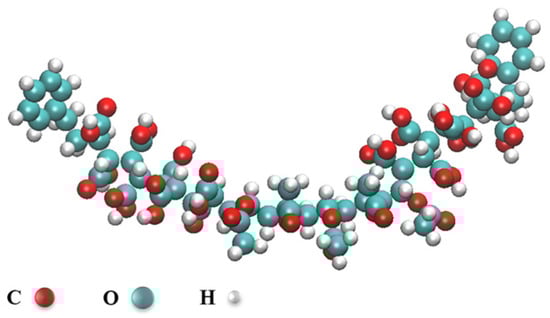
Figure 10.
PVE molecule.
To simulate real field application conditions, in this study, a 10 × 10 × 20 nm3 box containing varying quantities (50/100) of polymer PVE and 4000 CO2 was designed. The relationship between area and viscosity was examined at different temperatures and pressures. The systems with 50 PVE-4000 CO2 and 100 PVE-4000 CO2 were investigated at 70 °C and 10 MPa (343.25 K and 100 bar), 80 °C and −10 MPa (353.25 K and 100 bar), and 70 °C and −15 MPa (343.25 K and 150 bar). The MD simulation process initially underwent energy minimization, followed by a 5 ns NVT ensemble simulation and subsequently a 30 ns NPT ensemble simulation to investigate the attainment of the total energy balance within the system [49] (Figure 11).
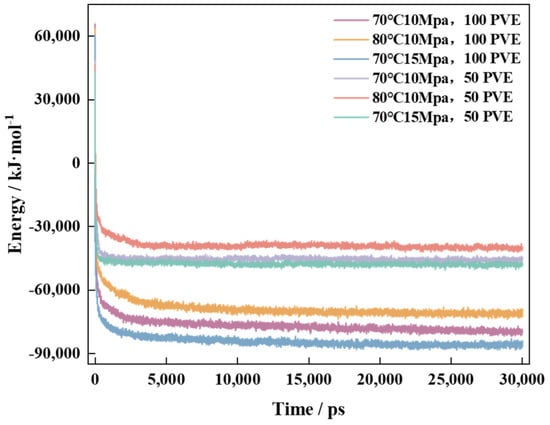
Figure 11.
Change in energy balance in PVE-scCO2 system.
According to the analysis of the energy curve’s movement law, during the NPT simulation process, there is a rapid decrease in system energy within the first 5 ns of the simulation. As it reaches 5 ns, each system’s energy tends to reach equilibrium. The energy convergence rate of the system is faster at 70 °C and −15 MPa compared to 70 °C and −10 MPa, while it is slower at 80 °C and −10 MPa. Furthermore, as the temperature decreases and pressure increases, the system exhibits a higher tendency to converge toward its equilibrium state. The increase in temperature enhances the thermal motion of molecules, which hinders the system’s equilibrium, whereas pressure has the opposite effect [50]. The systems converge to different energy values under the same conditions due to variations in the amount of polymer introduced, with a greater number of polymer molecules resulting in higher energy loss during final convergence to equilibrium (Figure 12). After the system’s equilibrium was confirmed, the distribution of polymers in the system was examined using the visualization software VMD _win64-1.9.3. The “.gro” file of the system was color-coded in the interface to facilitate differentiation, with PVE molecules labeled as PINK and CO2 molecules labeled as ICEBLUE due to their abundance of C and O elements.
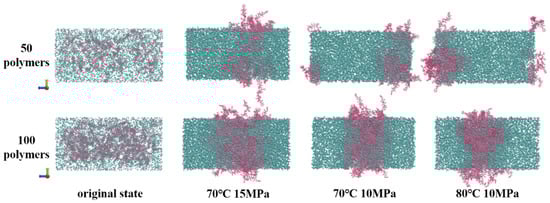
Figure 12.
The molecular distribution in each system before and after reaching equilibrium.
The idealized design of the initial state in Figure 12 only considers a uniform distance distribution, neglecting the full consideration of intermolecular forces. Consequently, the polymer and carbon dioxide exhibit an unrealistic state within the box. After equilibrium is reached, the molecular distribution of polymer molecules undergoes changes due to the influence of van der Waals forces, leading to a gradual transition towards an aggregated state. To gain a deeper understanding of the interaction between aggregates and carbon dioxide, the total contact area of the system was computed, and the resulting changes in area are summarized in Figure 13.
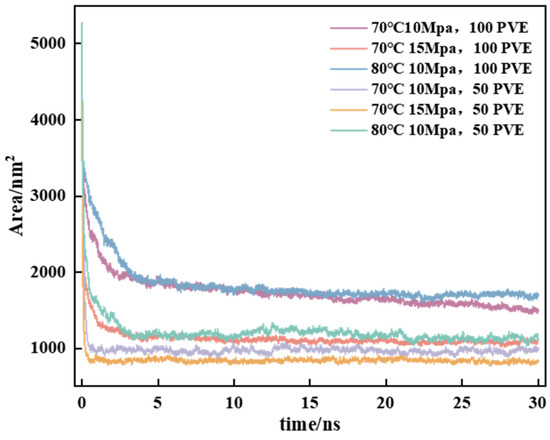
Figure 13.
The total contact area of the CO2-PVE system in each individual system under various conditions.
According to the law of curve change, it can be observed that the transition from an imbalanced uniform state to an equilibrium state results in a decrease in the total contact area of the medium system. The results demonstrate that PVE enhances the overall contact area of PVE-CO2 under high-temperature and low-pressure conditions. The total contact area of the system exhibited a positive correlation with the number of polymer molecules. The 2 ps finished product simulation was continued using the periodic disturbance method, in order to investigate the viscosity changes of the system depicted in Figure 14, while maintaining its dynamic equilibrium.
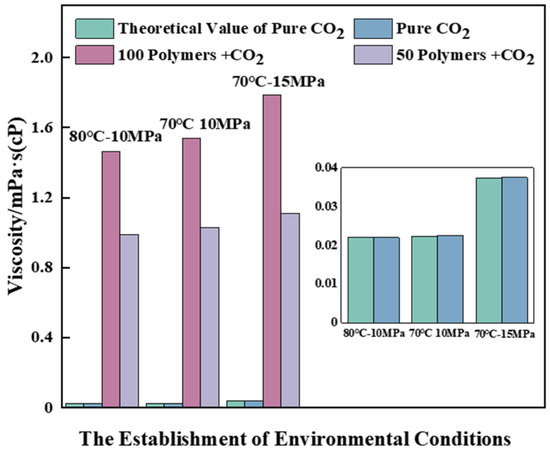
Figure 14.
The viscosity changes of each system compared under various conditions.
The calculated data of pure carbon dioxide MD under basic conditions (70 °C, 10 MPa) were compared with the theoretical standard value [51]. The resulting calculated viscosity was found to be 0.02250 mPa·s. This value was then compared to the theoretical standard viscosity of 0.0235 mPa·s, revealing an error rate of only 0.043%. These findings demonstrate the high reliability of our calculations. The Green–Kubo viscosity formula was employed for the calculation of viscosity [52]:
where variables kB, V, and T represent the Boltzmann constant, temperature, and volume of the simulated box, respectively.
After an analysis of the viscosity data in Figure 14, it can be inferred that the polymer exhibits a significant increase in viscosity, indicating its effectiveness. The impact of pressure on viscosity is significantly more pronounced than that of temperature under identical component conditions. The viscosity of each system exhibits the most significant increase at 10 MPa and 50 °C, with 100 PVE-4000 CO2 showing a remarkable enhancement of 68.44 times and 50 PVE-4000 CO2 demonstrating an impressive amplification of 45.81 times. Notably, these changes align precisely with the experimental observations. The increase in the number of introduced polymers can be deemed to have a positive impact on the viscosity alteration of the system, aligning with the aforementioned rule regarding changes in contact area. Therefore, expanding the effective contact area is a viable approach to enhance the viscosity of scCO2.
4. Conclusions
The polymer PVE was synthesized in this study, and the solubility test demonstrated its favorable affinity towards CO2. At a temperature of 70 °C, PVE with a mass fraction of 0.1% can be dissolved in scCO2, resulting in a significant reduction in the minimum miscible pressure to 7.84 MPa for the system. At this stage, the saturation solubility of the polymer in scCO2 is predominantly influenced by variations in pressure rather than shear. The viscosity of the scCO2 system can be effectively increased by 15 MPa within the concentration range of 0.1–0.3%. Additionally, at a temperature of 70 °C, the addition of 0.2% P results in a remarkable increase in shear viscosity, reaching a value that is 21.43 times higher than that without PVE. The thickener concentration range for a 0.25 mD core is 0.1–0.2%. In this scenario, the recovery efficiency of the displacement system increases with higher thickener concentrations. The recovery efficiency of 0.2% P-scCO2 flooding is 5.61% greater than that of pure scCO2 flooding. The introduction of a thickener is believed to effectively suppress gas channeling and enhance the extraction of light components during scCO2 flooding, as evidenced by the permeability curve of the core phase and changes in crude oil composition before and after thickening. Moreover, it exerts minimal influence on asphaltene deposition. Molecular simulation analysis reveals that the viscosity error rate with the theoretical standard is merely 0.043%, indicating high calculation reliability. The analysis of the simulation rule indicates a positive correlation between polymer viscosity and both the contact area of carbon dioxide and the number of polymers. Moreover, the observed change in viscosity is consistent with experimental determinations.
This study not only presents a novel and effective approach for designing high-performance CO2 thickeners in high-temperature and high-pressure environments, but also elucidates the molecular-level viscosification mechanism of polymer-SCCO2 systems. It identifies crucial areas for future research on scCO2 viscosification technology and provides a fresh perspective for developing efficient oil displacement systems.
Author Contributions
Conceptualization, K.S.; methodology, H.F., M.L. and Y.P.; software, H.F., Y.P. and X.F.; validation, H.F., H.S. and H.H.; formal analysis, H.F.; investigation, H.F. and L.W.; resources, K.S.; data curation, H.F.; writing—original draft preparation, H.F. and Y.P.; writing—review and editing, H.F. and K.S.; visualization, H.F., S.M., R.B. and X.F.; supervision, K.S.; project administration, K.S.; funding acquisition, K.S. All authors have read and agreed to the published version of the manuscript.
Funding
This research was funded by the China Natural Science Foundation, grant number 51834005.
Institutional Review Board Statement
Not applicable.
Data Availability Statement
Data are contained within the article.
Acknowledgments
The authors wish to thank Feng Yang for her help with the molecular simulation platform construction.
Conflicts of Interest
Author Xindong Fu was employed by the company Daqing Drilling Engineering Company Underground Operation Company Technology Research Institute. The remaining authors declare that the research was conducted in the absence of any commercial or financial relationships that could be construed as a potential conflict of interest.
References
- Babadagli, T. Philosophy of EOR. J. Pet. Sci. Eng. 2020, 188, 106930. [Google Scholar] [CrossRef]
- Liu, C.; Sun, L.; Lu, J.; Sun, Y.; Xu, Y.; Lu, M.; Li, J. Characteristics of the Newly Found Oil-Bearing Sandstone in the Denglouku Formation of the Northern Songliao Basin, China. J. Pet. Sci. Eng. 2020, 188, 106947. [Google Scholar] [CrossRef]
- Milner, M.; McLin, R.; Petriello, J. Imaging Texture and Porosity in Mudstones and Shales: Comparison of Secondary and Ion-Milled Backscatter SEM Methods. In Proceedings of the Canadian Unconventional Resources and International Petroleum Conference, Calgary, AB, Canada, 19 October 2010; p. SPE-138975-MS. [Google Scholar]
- Khormali, A.; Ahmadi, S. Prediction of Barium Sulfate Precipitation in Dynamic Tube Blocking Tests and Its Inhibition for Waterflooding Application Using Response Surface Methodology. J. Pet. Explor. Prod. Technol. 2023, 13, 2267–2281. [Google Scholar] [CrossRef]
- Du, X.; Liu, T.; Xi, C.; Wang, B.; Qi, Z.; Zhou, Y.; Xu, J.; Lin, L.; Istratescu, G.; Babadagli, T.; et al. Can Hot Water Injection with Chemical Additives Be an Alternative to Steam Injection: Static and Dynamic Experimental Evidence. Fuel 2023, 331, 125751. [Google Scholar] [CrossRef]
- Jew, A.D.; Druhan, J.L.; Ihme, M.; Kovscek, A.R.; Battiato, I.; Kaszuba, J.P.; Bargar, J.R.; Brown, G.E. Chemical and Reactive Transport Processes Associated with Hydraulic Fracturing of Unconventional Oil/Gas Shales. Chem. Rev. 2022, 122, 9198–9263. [Google Scholar] [CrossRef] [PubMed]
- Song, Z.; Li, Y.; Song, Y. A Critical Review of CO2 Enhanced Oil Recovery in Tight Oil Reservoirs of North America and China. Fuel 2020, 5, 118006. [Google Scholar] [CrossRef]
- Chang, W.; District, D.; Zhang, Y.; Zhang, L.; Lu, M. 2455: Study on the Growth of Corrosion Scales on X65 Steel in CO2 Top-of-Line Corrosion Environment. In Proceedings of the Corrosion 2013, Orlando, FL, USA, 17–21 March 2013. [Google Scholar]
- Czubinski, F.F.; Sanchez, C.J.N.; Da Silva, A.K.; Neto, M.A.M.; Barbosa, J.R. Phase Equilibrium and Liquid Viscosity Data for R-290/POE ISO 22 Mixtures between 283 and 353 K. Int. J. Refrig. 2020, 114, 79–87. [Google Scholar] [CrossRef]
- Jia, H.; Yin, S.-P.; Ma, X.-P. Enhanced Oil Recovery Mechanism of Low Oxygen Air Injection in High Water Cut Reservoir. J. Pet. Explor. Prod. Technol. 2018, 8, 917–923. [Google Scholar] [CrossRef]
- Zhang, Y.; Zhao, G.; Cheng, Y.F. Downhole O2 Corrosion during Air-Assisted Steam Injection for Secondary or Tertiary Oil Recovery. Corros. Eng. Sci. Technol. 2020, 55, 189–195. [Google Scholar] [CrossRef]
- Alam, M.M.M.; Hassan, A.; Mahmoud, M.; Sibaweihi, N.; Patil, S. Dual Benefits of Enhanced Oil Recovery and CO2 Sequestration: The Impact of CO2 Injection Approach on Oil Recovery. Front. Energy Res. 2022, 10, 877212. [Google Scholar] [CrossRef]
- Kurtoglu, B.; Sorensen, J.A.; Braunberger, J.; Smith, S.; Kazemi, H. Geologic Characterization of a Bakken Reservoir for Potential CO2 EOR. In Proceedings of the Unconventional Resources Technology Conference, Denver, CO, USA, 12–14 August 2013; Society of Exploration Geophysicists, American Association of Petroleum Geologists, Society of Petroleum Engineers: Denver, CO, USA, 2013; pp. 1834–1844. [Google Scholar]
- Pranesh, V. Subsurface CO2 Storage Estimation in Bakken Tight Oil and Eagle Ford Shale Gas Condensate Reservoirs by Retention Mechanism. Fuel 2018, 215, 580–591. [Google Scholar] [CrossRef]
- Xiao, P.; Yang, Z.; Wang, X.; Xiao, H.; Wang, X. Experimental Investigation on CO2 Injection in the Daqing Extra/Ultra-Low Permeability Reservoir. J. Pet. Sci. Eng. 2017, 149, 765–771. [Google Scholar] [CrossRef]
- Tan, Y.; Nookuea, W.; Li, H.; Thorin, E.; Yan, J. Property Impacts on Carbon Capture and Storage (CCS) Processes: A Review. Energy Convers. Manag. 2016, 118, 204–222. [Google Scholar] [CrossRef]
- Enick, R.M.; Olsen, D.; Ammer, J.; Schuller, W. Mobility and Conformance Control for CO2 EOR via Thickeners, Foams, and Gels—A Literature Review of 40 Years of Research and Pilot Tests. In Proceedings of the SPE Improved Oil Recovery Symposium, Tulsa, OK, USA, 14 April 2012; p. SPE-154122-MS. [Google Scholar]
- Wang, X.; Zeng, F.; Gao, R.; Zhao, X.; Hao, S.; Liang, Q.; Jiang, S. Cleaner Coal and Greener Oil Production: An Integrated CCUS Approach in Yanchang Petroleum Group. Int. J. Greenh. Gas Control 2017, 62, 13–22. [Google Scholar] [CrossRef]
- Fu, C.; Liu, N. Rheology and Stability of Nanoparticle-Stabilized CO2 Foam under Reservoir Conditions. J. Pet. Sci. Eng. 2021, 196, 107671. [Google Scholar] [CrossRef]
- Li, Q.; Wang, Y.; Li, Q.; Wang, F.; Bernardo, J.; Zhang, Y.; Bai, B.; Liu, F. Performance Improvement of Thickened Liquid CO2 by Introducing a Philic-CO2 Silicone Polymer. In Proceedings of the SPE/IATMI Asia Pacific Oil & Gas Conference and Exhibition, Bali, Indonesia, 30 October 2019; p. D022S007R012. [Google Scholar]
- Zheng, W.-T.; Zhang, J.-B.; Liu, Y.; Huang, K. Reversible Chemical Absorption of CO2 in Polyethylenimine Supported by Low-Viscous Tetrabutylphosphonium 2-Fluorophenolate. Energy Fuels 2020, 34, 3493–3500. [Google Scholar] [CrossRef]
- Azmi, N.S.M.; Abu Bakar, N.F.; Tengku Mohd, T.A.; Azizi, A. Molecular Dynamics Simulation on CO2 Foam System with Addition of SiO2 Nanoparticles at Various Sodium Dodecyl Sulfate (SDS) Concentrations and Elevated Temperatures for Enhanced Oil Recovery (EOR) Application. Comput. Mater. Sci. 2020, 184, 109937. [Google Scholar] [CrossRef]
- O’Brien, M.J.; Perry, R.J.; Doherty, M.D.; Lee, J.J.; Dhuwe, A.; Beckman, E.J.; Enick, R.M. Anthraquinone Siloxanes as Thickening Agents for Supercritical CO2. Energy Fuels 2016, 30, 5990–5998. [Google Scholar] [CrossRef]
- Zhang, Y.; Zhu, Z.; Tang, J. Research on Polyether-Based Hydrocarbon Thickener for CO2. Fluid Phase Equilibr. 2021, 532, 112932. [Google Scholar] [CrossRef]
- Little, M.G.; Jackson, R.B. Potential Impacts of Leakage from Deep CO2 Geosequestration on Overlying Freshwater Aquifers. Environ. Sci. Technol. 2010, 44, 9225–9232. [Google Scholar] [CrossRef]
- Lemaire, P.C.; Alenzi, A.; Lee, J.J.; Beckman, E.J.; Enick, R.M. Thickening CO2 with Direct Thickeners, CO2-in-Oil Emulsions, or Nanoparticle Dispersions: Literature Review and Experimental Validation. Energy Fuels 2021, 35, 8510–8540. [Google Scholar] [CrossRef]
- Al-Anssari, S.; Wang, S.; Barifcani, A.; Lebedev, M.; Iglauer, S. Effect of Temperature and SiO2 Nanoparticle Size on Wettability Alteration of Oil-Wet Calcite. Fuel 2017, 206, 34–42. [Google Scholar] [CrossRef]
- Li, H.; Zheng, S.; Yang, D. Enhanced Swelling Effect and Viscosity Reduction of Solvent(s)/CO2/Heavy-Oil Systems. SPE J. 2013, 18, 695–707. [Google Scholar] [CrossRef]
- Zhang, S.; She, Y.; Gu, Y. Evaluation of Polymers as Direct Thickeners for CO2 Enhanced Oil Recovery. J. Chem. Eng. Data 2011, 56, 1069–1079. [Google Scholar] [CrossRef]
- ISO/FDIS 11358-1; Plastics–Thermogravimetry (TG) of Polymers—Part 1: General Principles. ISO: Geneva, Switzerland, 2014.
- ASTM D4525-13; Standard Test Method for Permeability of Rocks by Flowing Air. ASTM: West Conshohocken, PA, USA, 2014.
- Aminian, K. Reservoir Types and Characterization; ASTM: West Conshohocken, PA, USA, 2016. [Google Scholar]
- Li, M.; Zhang, J.; Zou, Y.; Wang, F.; Chen, B.; Guan, L.; Wu, Y. Models for the Solubility Calculation of a CO2/Polymer System: A Review. Mater. Today Commun. 2020, 25, 101277. [Google Scholar] [CrossRef]
- Hess, B.; Kutzner, C.; Van Der Spoel, D.; Lindahl, E. GROMACS 4: Algorithms for Highly Efficient, Load-Balanced, and Scalable Molecular Simulation. J. Chem. Theory Comput. 2008, 4, 435–447. [Google Scholar] [CrossRef] [PubMed]
- Huang, J.; Rauscher, S.; Nawrocki, G.; Ran, T.; Feig, M.; De Groot, B.L.; Grubmüller, H.; MacKerell, A.D. CHARMM36: An Improved Force Field for Folded and Intrinsically Disordered Proteins. Biophys. J. 2017, 112, 175a–176a. [Google Scholar] [CrossRef]
- Lu, N.; Dong, X.; Chen, Z.; Liu, H.; Zheng, W.; Zhang, B. Effect of Solvent on the Adsorption Behavior of Asphaltene on Silica Surface: A Molecular Dynamic Simulation Study. J. Pet. Sci. Eng. 2022, 212, 110212. [Google Scholar] [CrossRef]
- Wang, C.; Gao, L.; Liu, M.; Xia, S.; Han, Y. Viscosity Reduction Mechanism of Functionalized Silica Nanoparticles in Heavy Oil-Water System. Fuel Process. Technol. 2022, 237, 107454. [Google Scholar] [CrossRef]
- Sun, B.; Sun, W.; Wang, H.; Li, Y.; Fan, H.; Li, H.; Chen, X. Molecular Simulation Aided Design of Copolymer Thickeners for Supercritical CO2 as Non-Aqueous Fracturing Fluid. J. CO2 Util. 2018, 28, 107–116. [Google Scholar] [CrossRef]
- Douglas, A.; Skoog, F.; James, H.; Crouch, S.R. Principles of Instrumental Analysis; Cengage Learning: Boston, MA, USA, 2017. [Google Scholar]
- Timothy, D.W. Claridge High-Resolution NMR Techniques in Organic Chemistry; Elsevier: Amsterdam, The Netherlands, 2010. [Google Scholar]
- Zhang, Y.; Zhang, L.; Wang, Y.; Wang, M.; Wang, Y.; Ren, S. Dissolution of Surfactants in Supercritical CO2 with Co-Solvents. Chem. Eng. Res. Des. 2015, 94, 624–631. [Google Scholar] [CrossRef]
- Yunoki, S.; Sugimoto, K.; Ohyabu, Y.; Ida, H.; Hiraoka, Y. Accurate and Precise Viscosity Measurements of Gelatin Solutions Using a Rotational Rheometer. FSTR 2019, 25, 217–226. [Google Scholar] [CrossRef]
- McCoy, S.T. The Economics of CO2 Transport by Pipeline and Storage in Saline. Doctoral Dissertation, Carnegie Mellon University, Pittsburgh, PA, USA, 2008. [Google Scholar]
- Dean, E.; French, J.; Pitts, M.; Wyatt, K. Practical EOR Agents—There Is More to EOR than CO2. In Proceedings of the SPE EOR Conference at Oil and Gas West Asia, Muscat, Oman, 26 March 2018; p. D011S005R004. [Google Scholar]
- Nelson, M.R.; Borkman, R.F. Ab Initio Calculations on CO2 Binding to Carbonyl Groups. J. Phys. Chem. A 1998, 102, 7860–7863. [Google Scholar] [CrossRef]
- Bao, L.; Fang, S.; Hu, D.; Zhao, L.; Yuan, W.; Liu, T. Enhancement of the CO2-Philicity of Poly(Vinyl Ester)s by End-Group Modification with Branched Chains. J. Supercrit. Fluids 2017, 127, 129–136. [Google Scholar] [CrossRef]
- Liu, K.; Schuch, F.; Kiran, E. High-Pressure Viscosity and Density of Poly(Methyl Methacrylate) + acetone and Poly(Methyl Methacrylate) + acetone + CO2 Systems. J. Supercrit. Fluids 2006, 39, 89–101. [Google Scholar] [CrossRef]
- Martin, R.L.; Winters, J.C. Composition of Crude Oil through Seven Carbons as Determined by Gas Chromatography. Anal. Chem. 1959, 31, 1954–1960. [Google Scholar] [CrossRef]
- Wedberg, R.; O’Connell, J.P.; Peters, G.H.; Abildskov, J. Total and Direct Correlation Function Integrals from Molecular Simulation of Binary Systems. Fluid Phase Equilibr. 2011, 302, 32–42. [Google Scholar] [CrossRef]
- Schettino, V.; Bini, R. Constraining Molecules at the Closest Approach Chemistry at High Pressure. Chem. Soc. Rev. 2007, 36, 869–880. [Google Scholar] [CrossRef]
- Lemmon, E.W.; Jacobsen, R.T. A Generalized Model for the Thermodynamic Properties of Mixtures. Int. J. Thermophys. 1999, 20, 825–835. [Google Scholar] [CrossRef]
- Hess, B. Determining the Shear Viscosity of Model Liquids from Molecular Dynamics Simulations. J. Chem. Phys. 2002, 116, 209–217. [Google Scholar] [CrossRef]
Disclaimer/Publisher’s Note: The statements, opinions and data contained in all publications are solely those of the individual author(s) and contributor(s) and not of MDPI and/or the editor(s). MDPI and/or the editor(s) disclaim responsibility for any injury to people or property resulting from any ideas, methods, instructions or products referred to in the content. |
© 2024 by the authors. Licensee MDPI, Basel, Switzerland. This article is an open access article distributed under the terms and conditions of the Creative Commons Attribution (CC BY) license (https://creativecommons.org/licenses/by/4.0/).