
Molecularly Mixed Composite Membranes for Gas Separation Based on Macrocycles Embedded in a Polyimide


 , , , and
Abstract
1. Introduction
2. Experimental
2.1. Materials
2.2. Methods
2.2.1. Membrane Preparation
2.2.2. Thermogravimetric Analysis (TGA)
2.2.3. Calorimetric Measurements (DSC)
2.2.4. Fourier Transform Infrared Spectroscopy–Attenuated Total Reflection (FTIR-ATR) Analyses
2.2.5. Nuclear Magnetic Resonance Spectra (NMR)
2.2.6. Scanning Electron Microscopy (SEM)
2.2.7. Gas Permeation Tests on the Membranes
3. Results
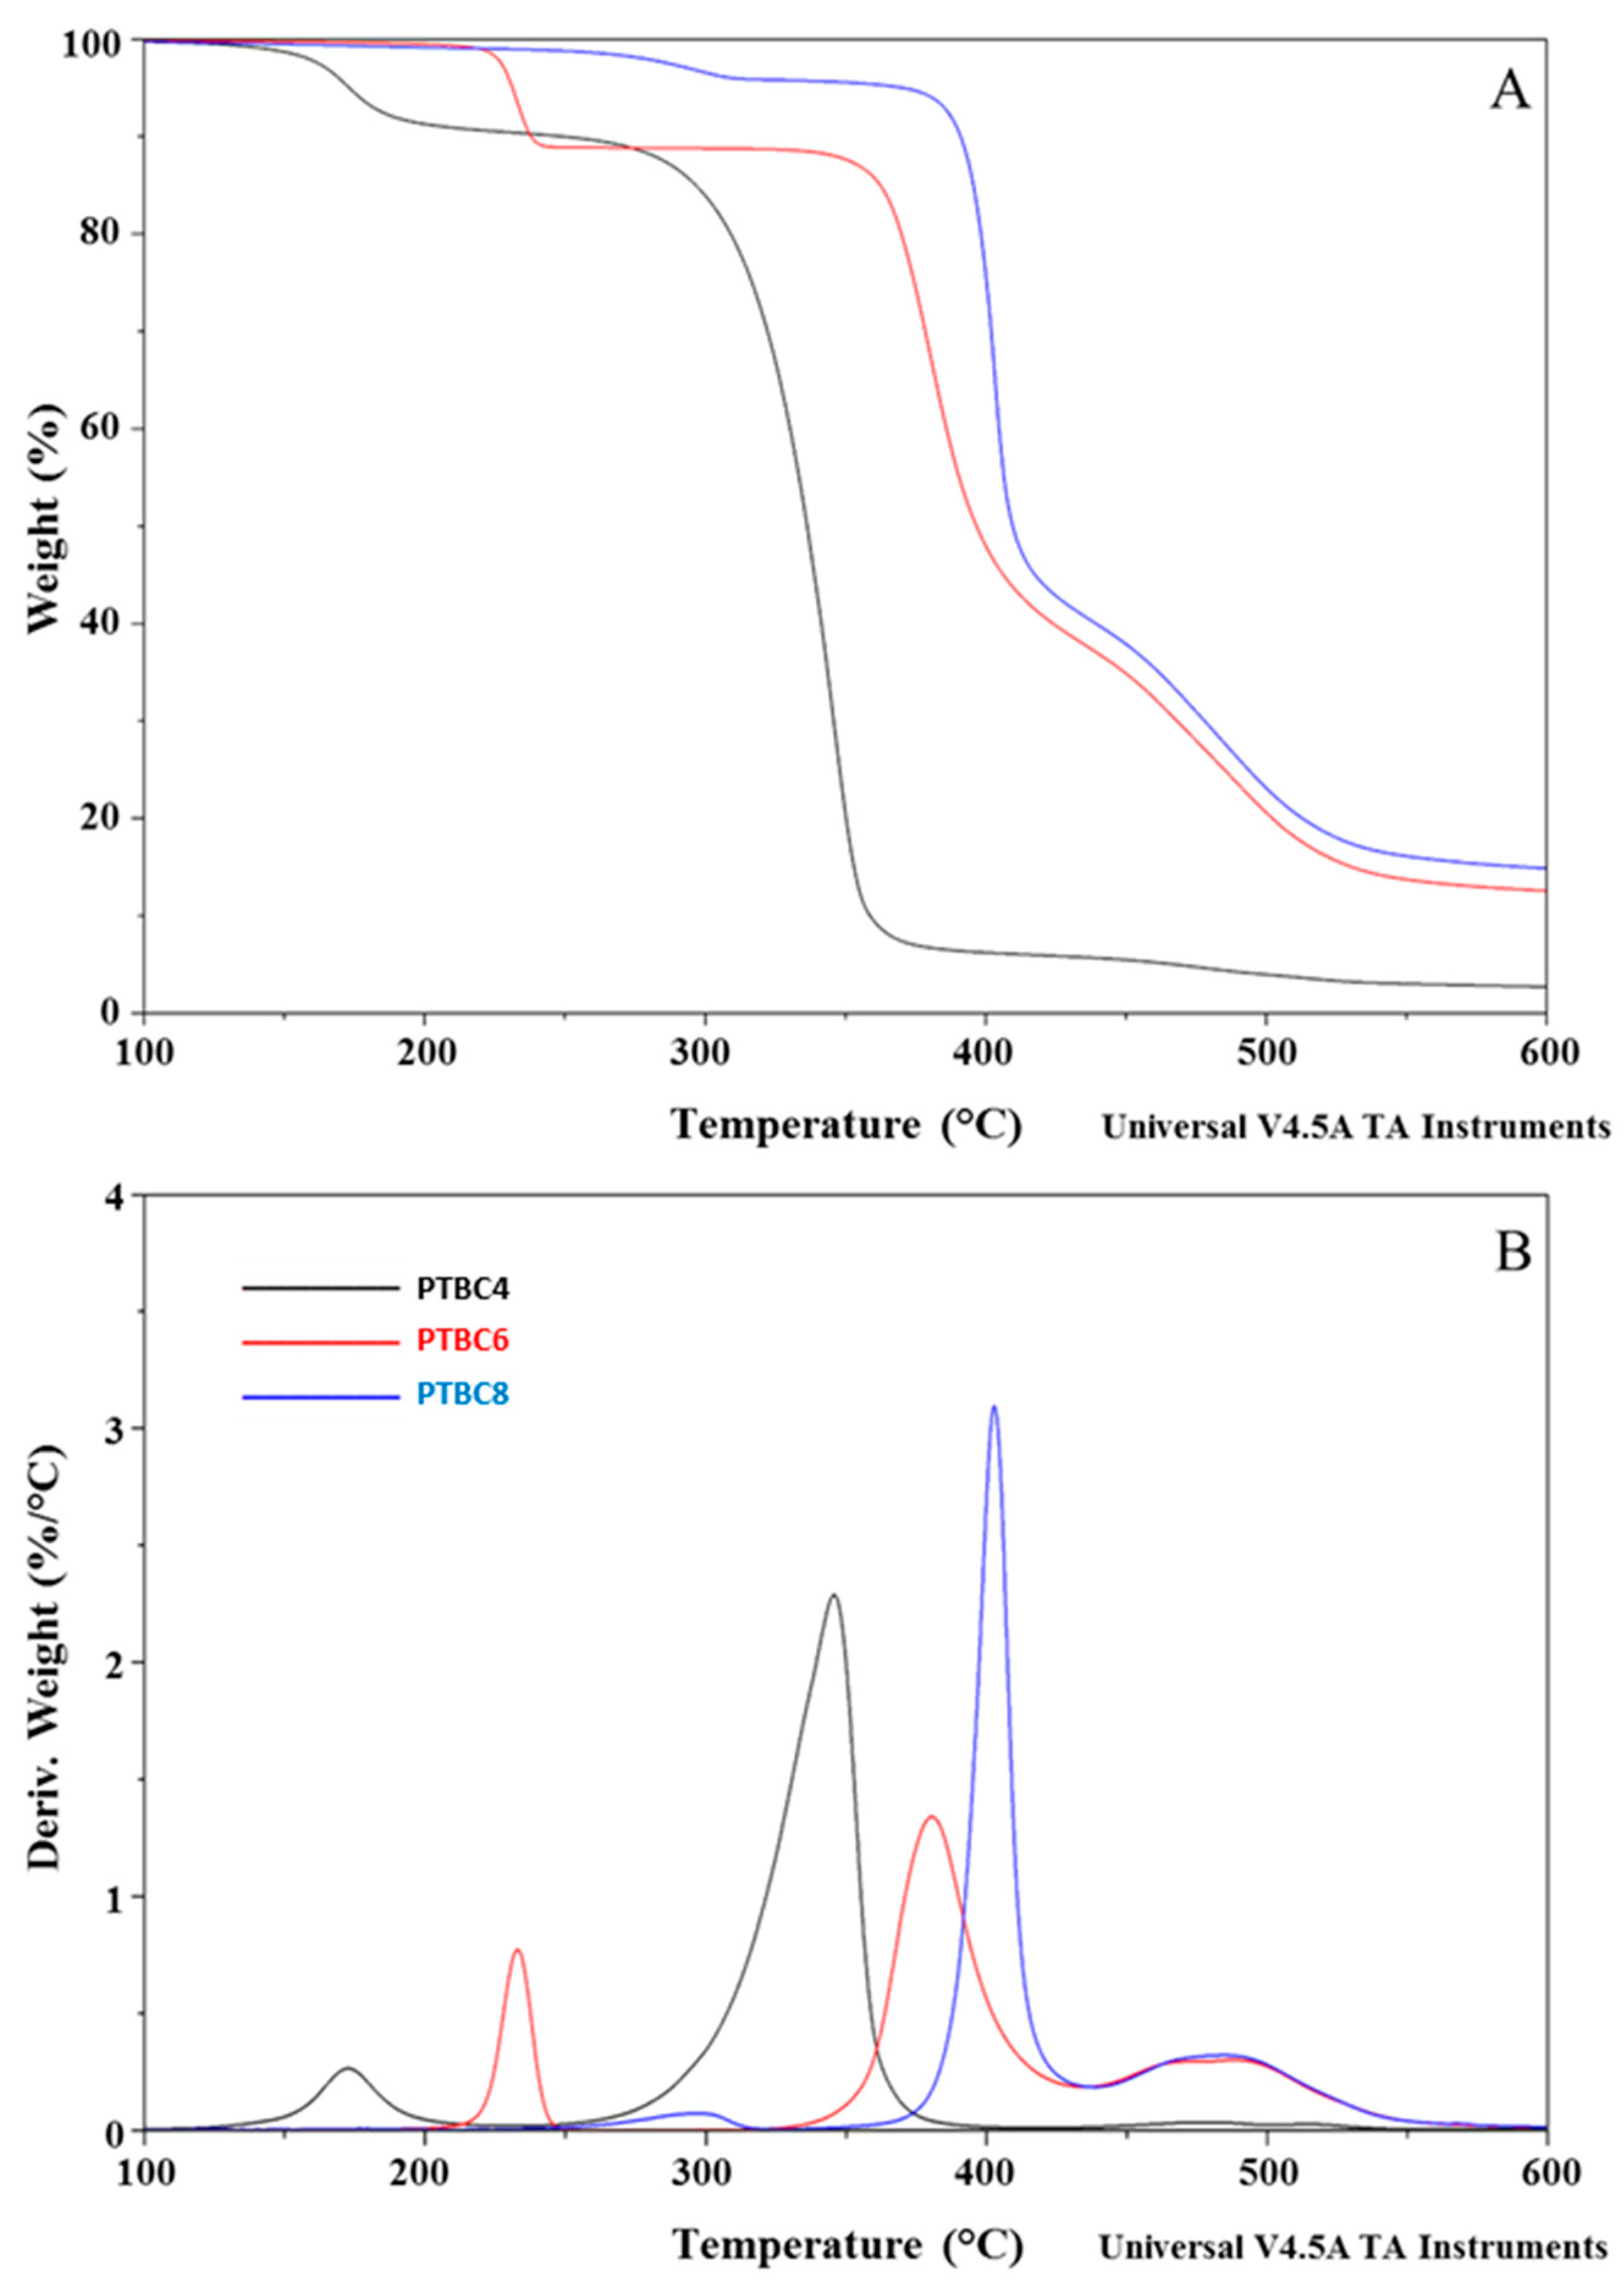
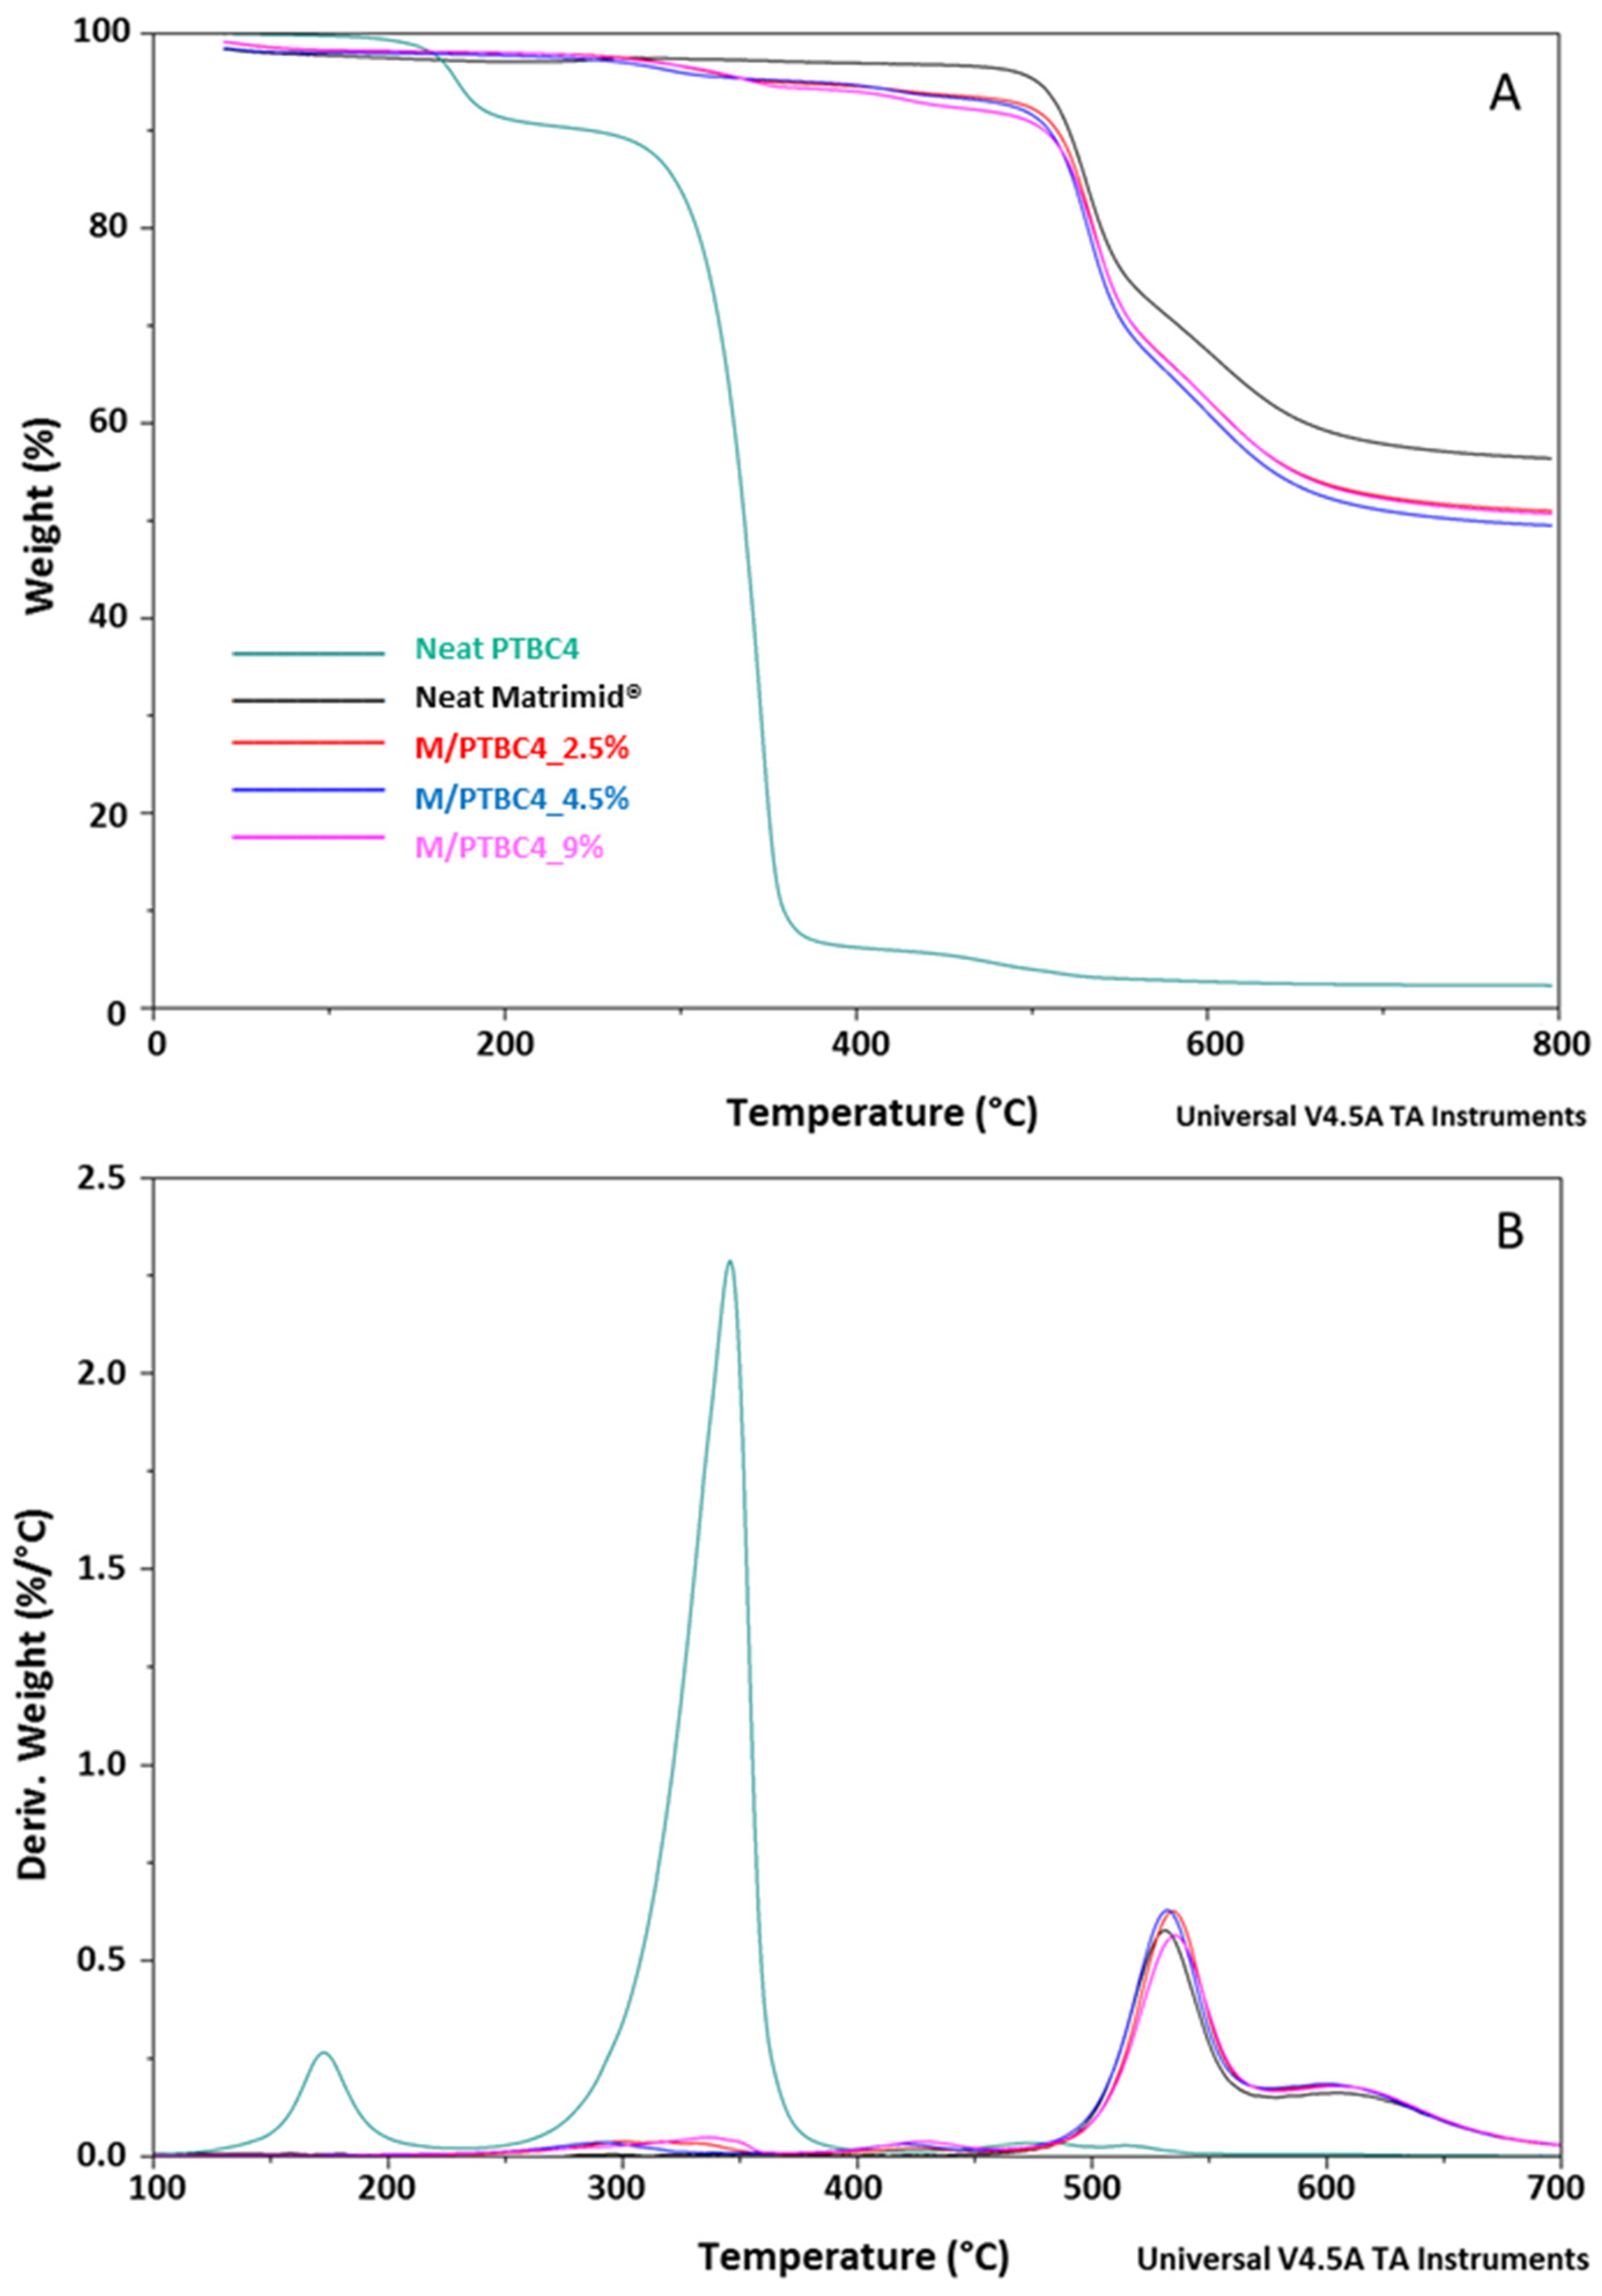
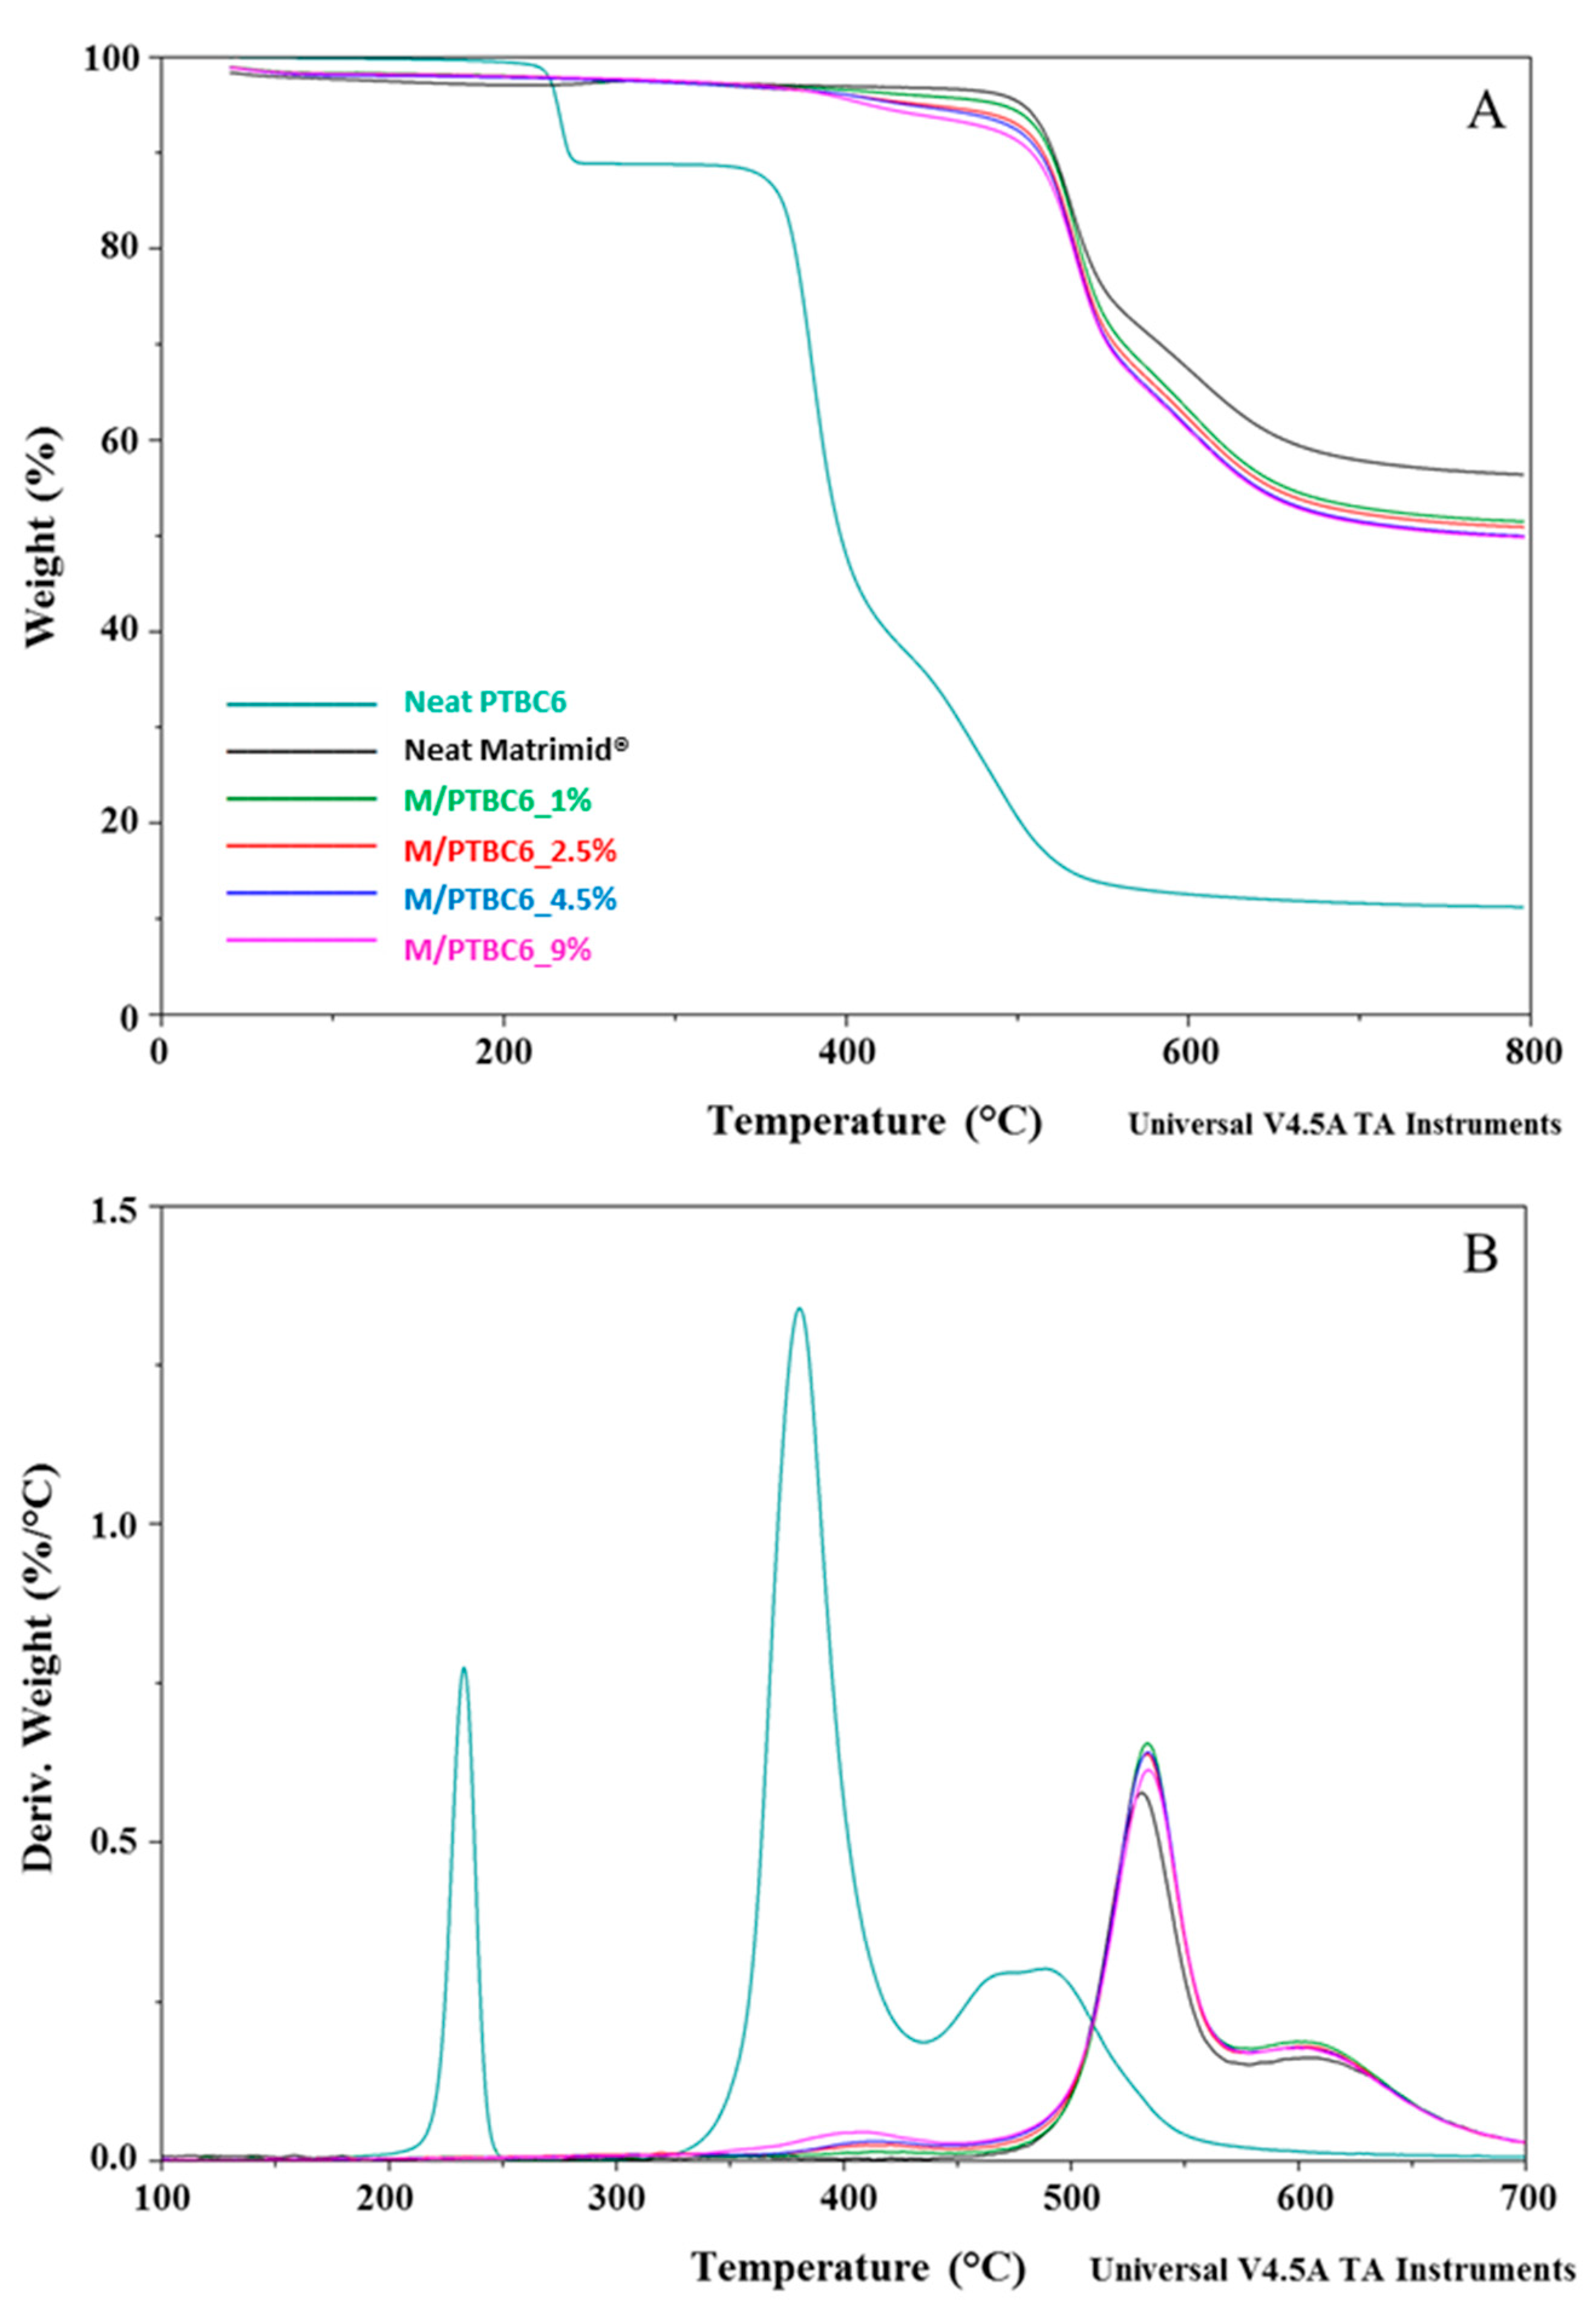
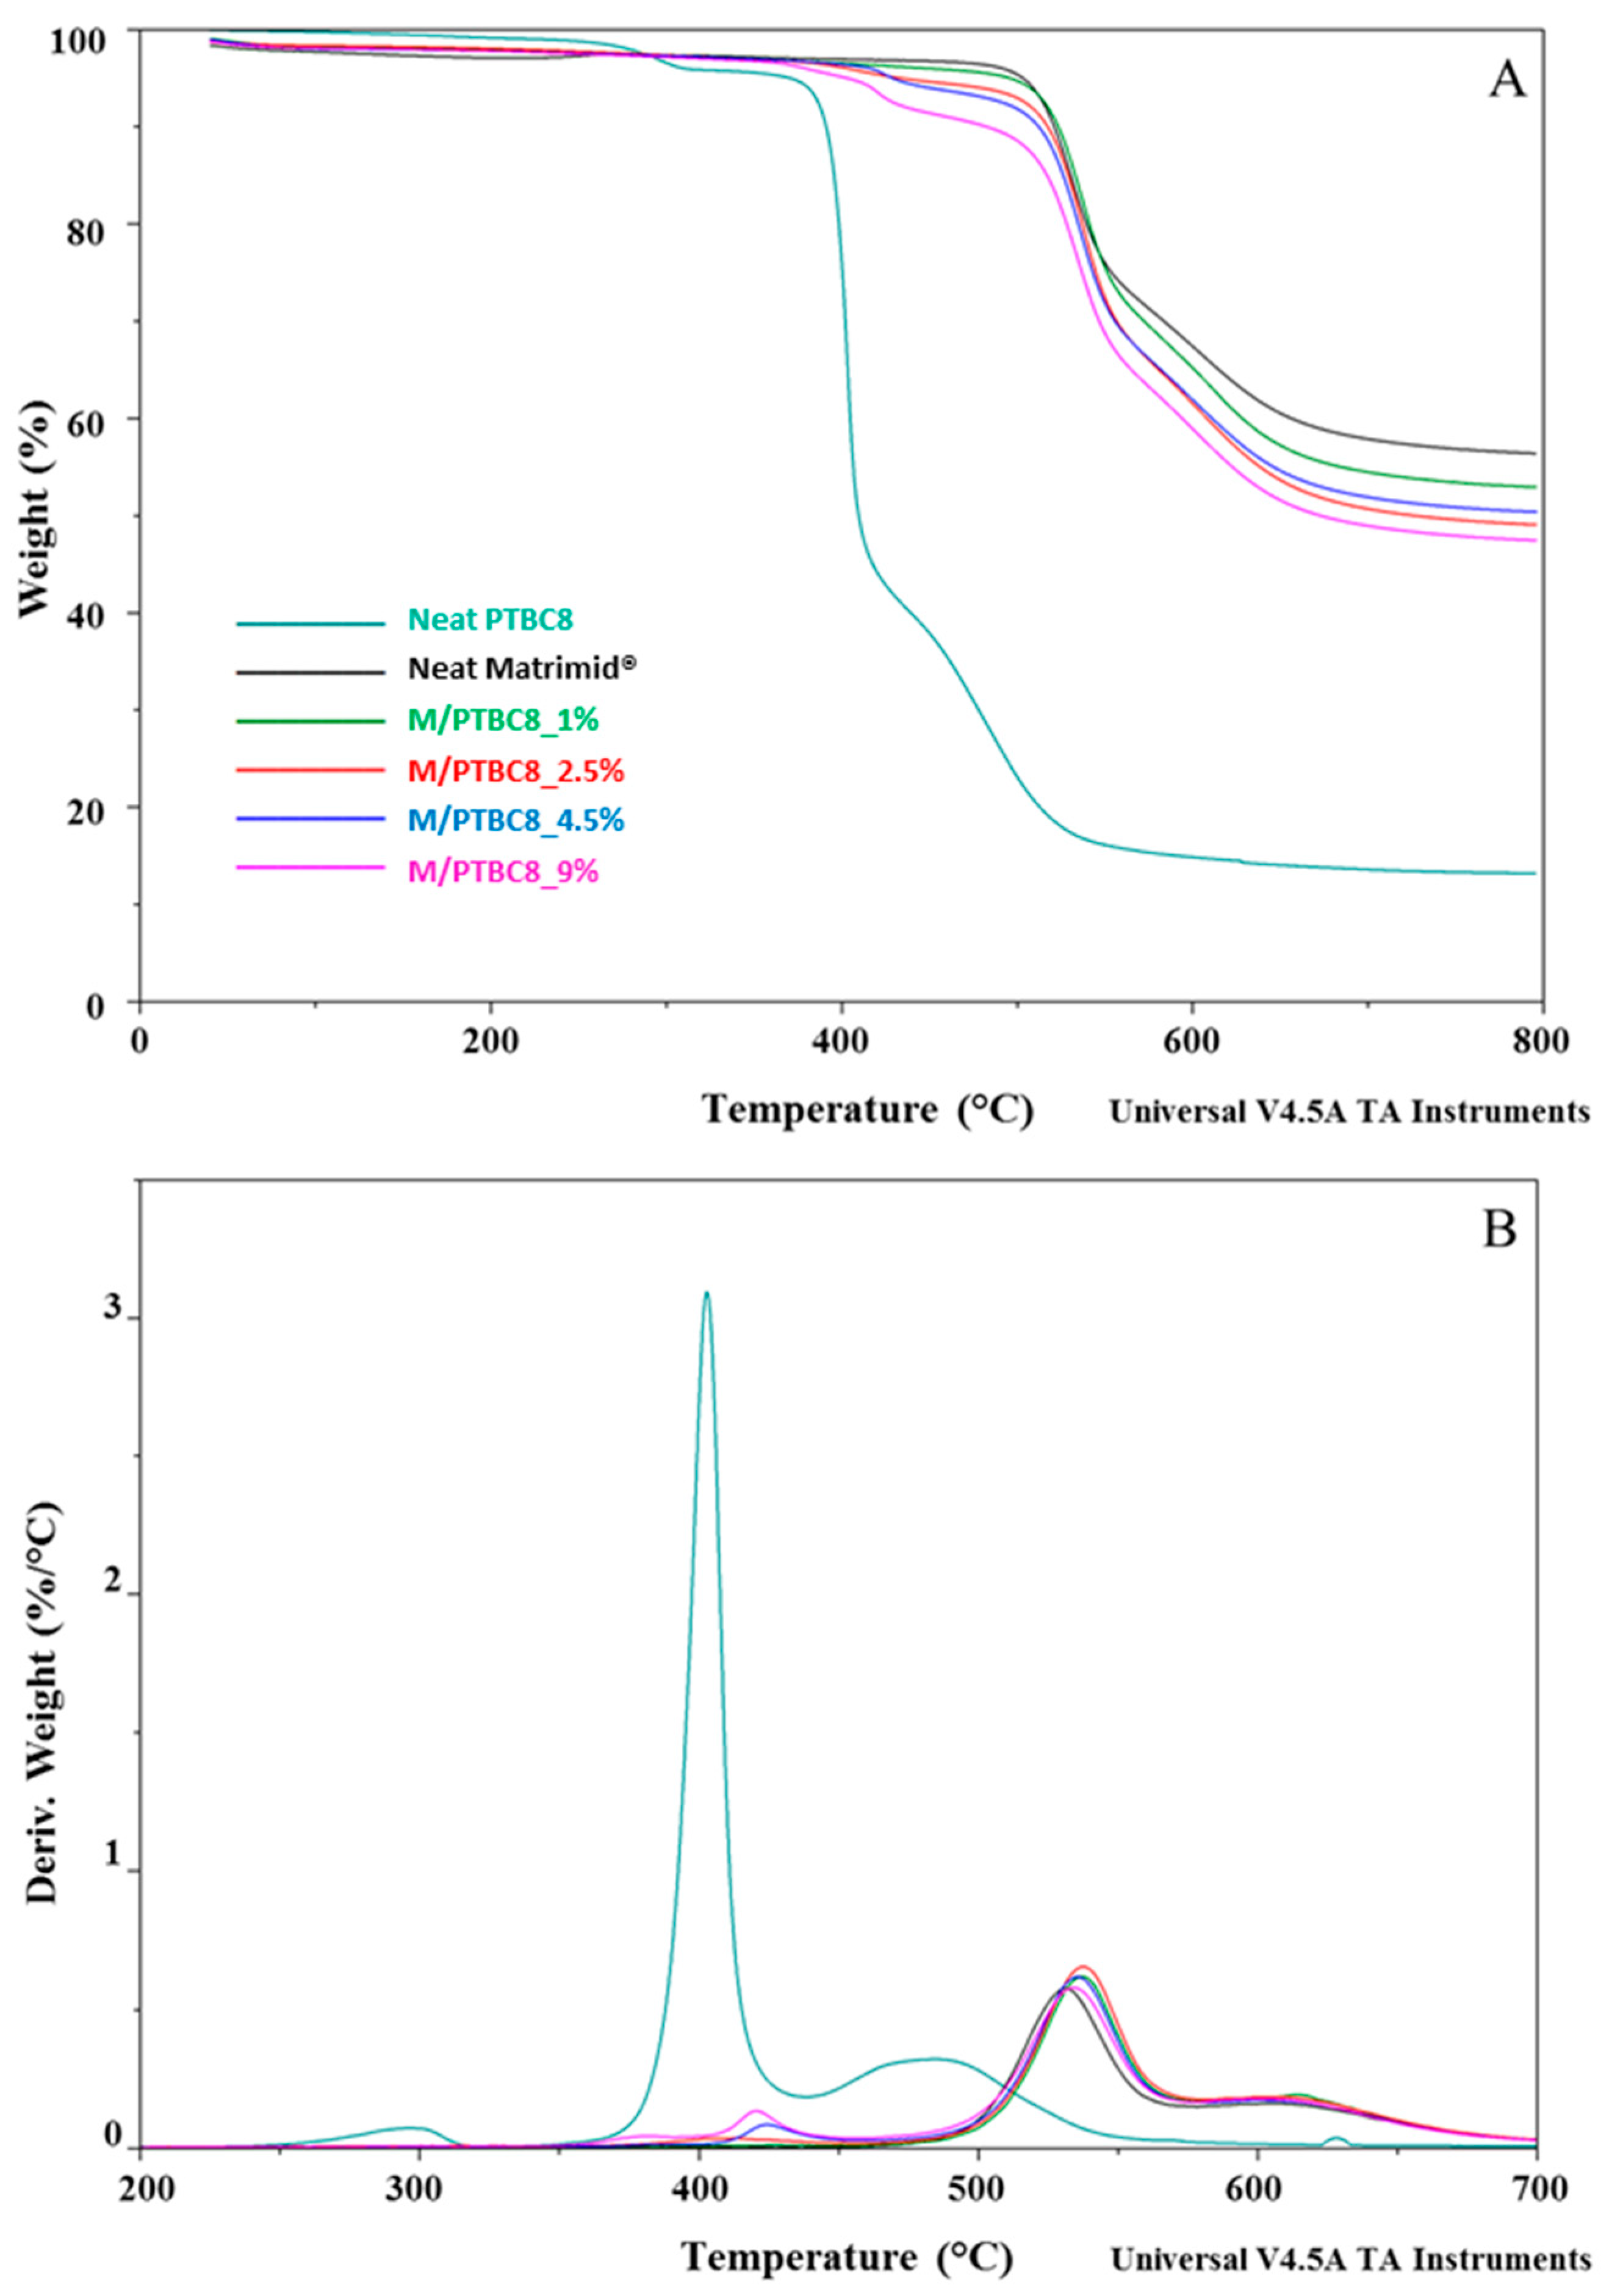
3.1. TGA
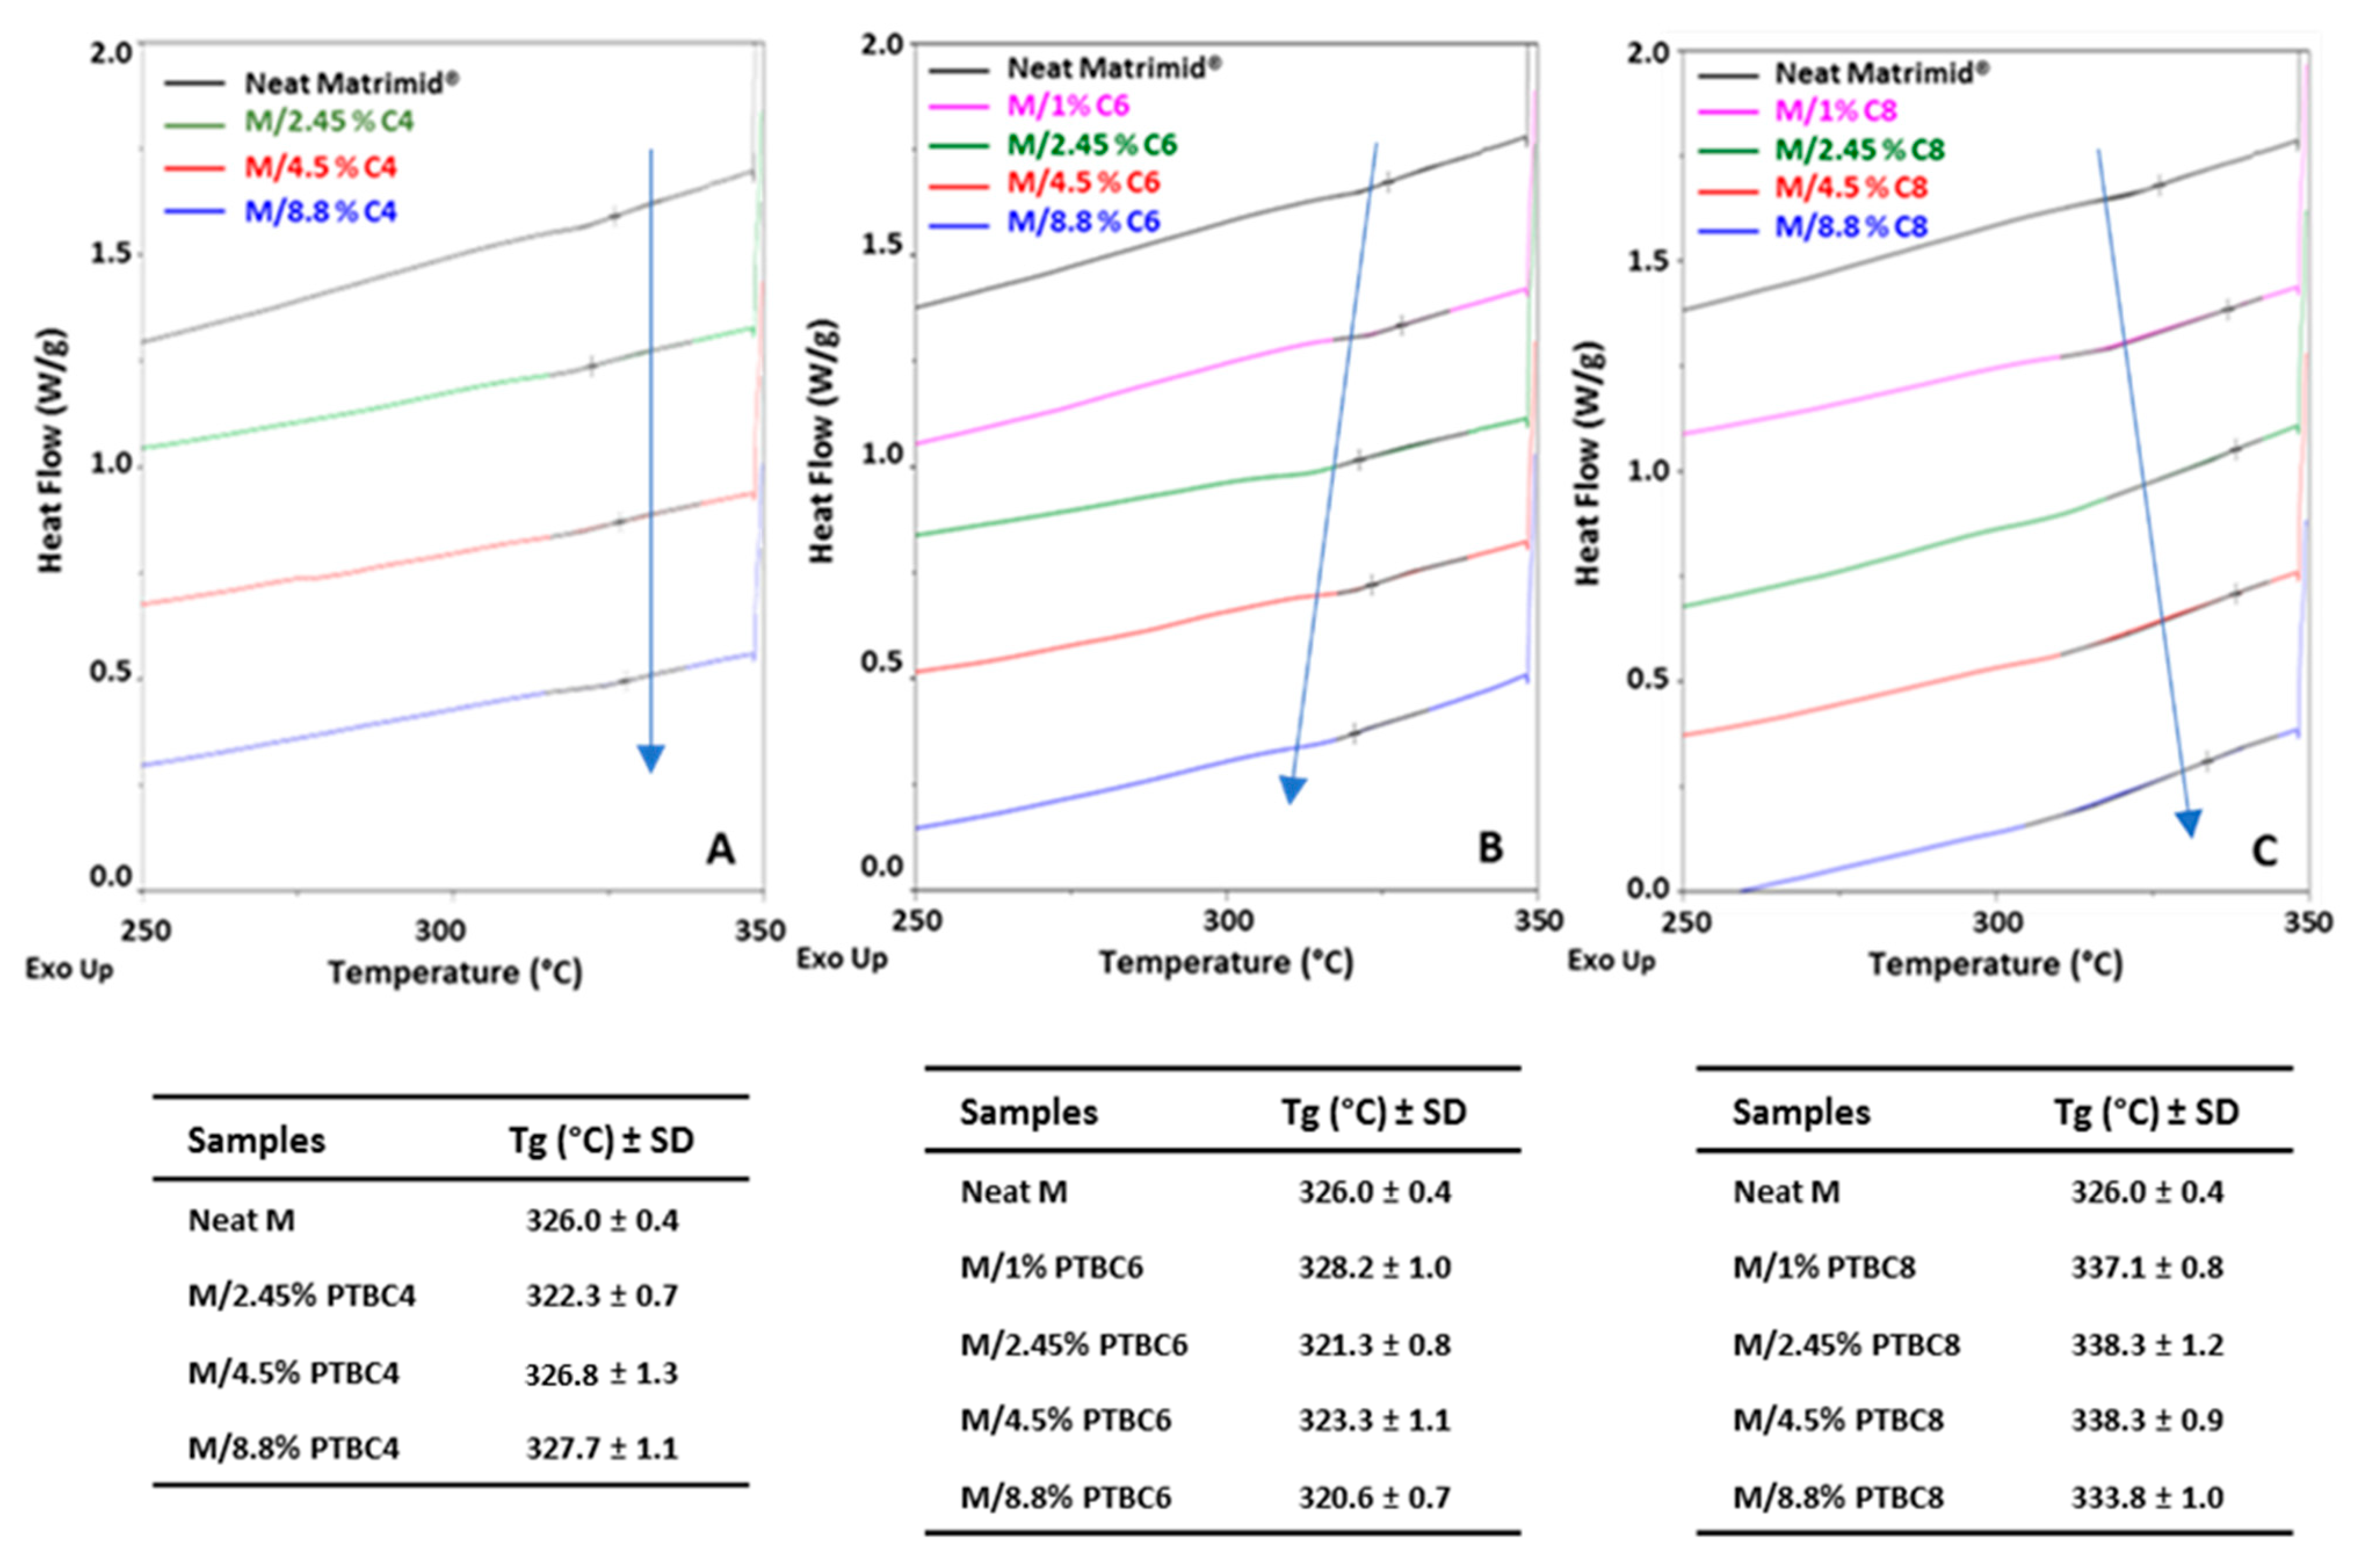
3.2. DSC
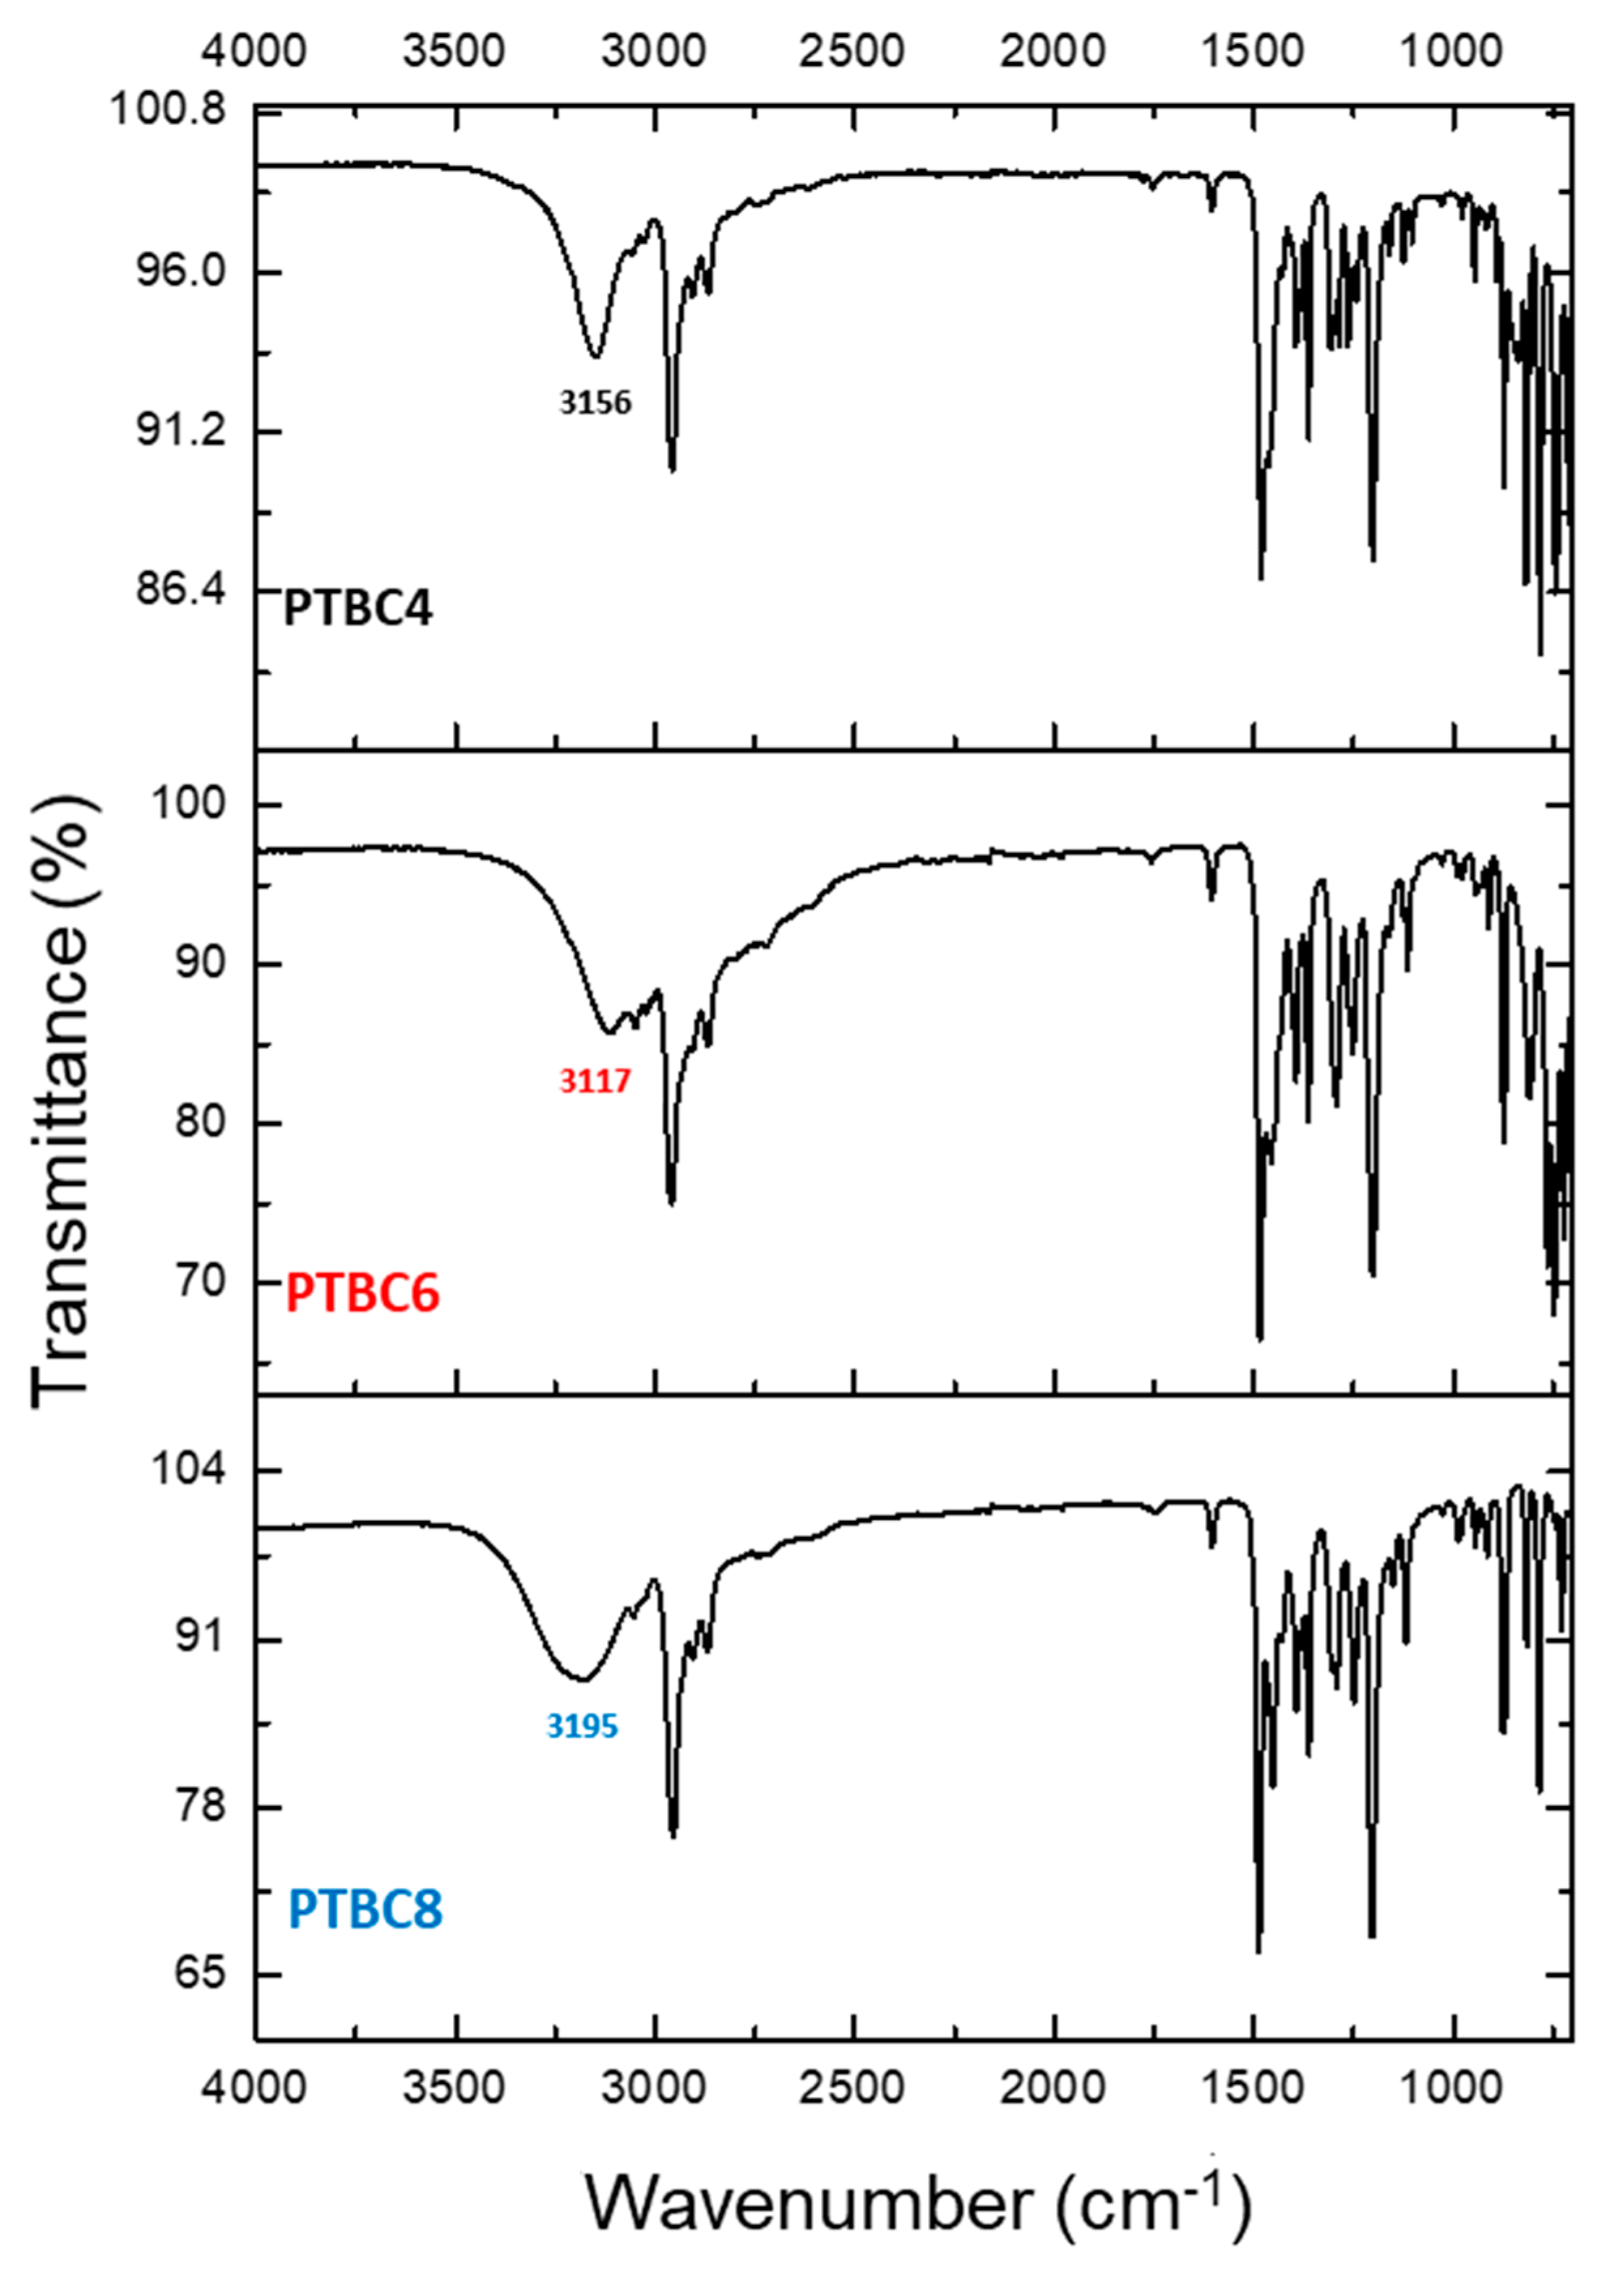
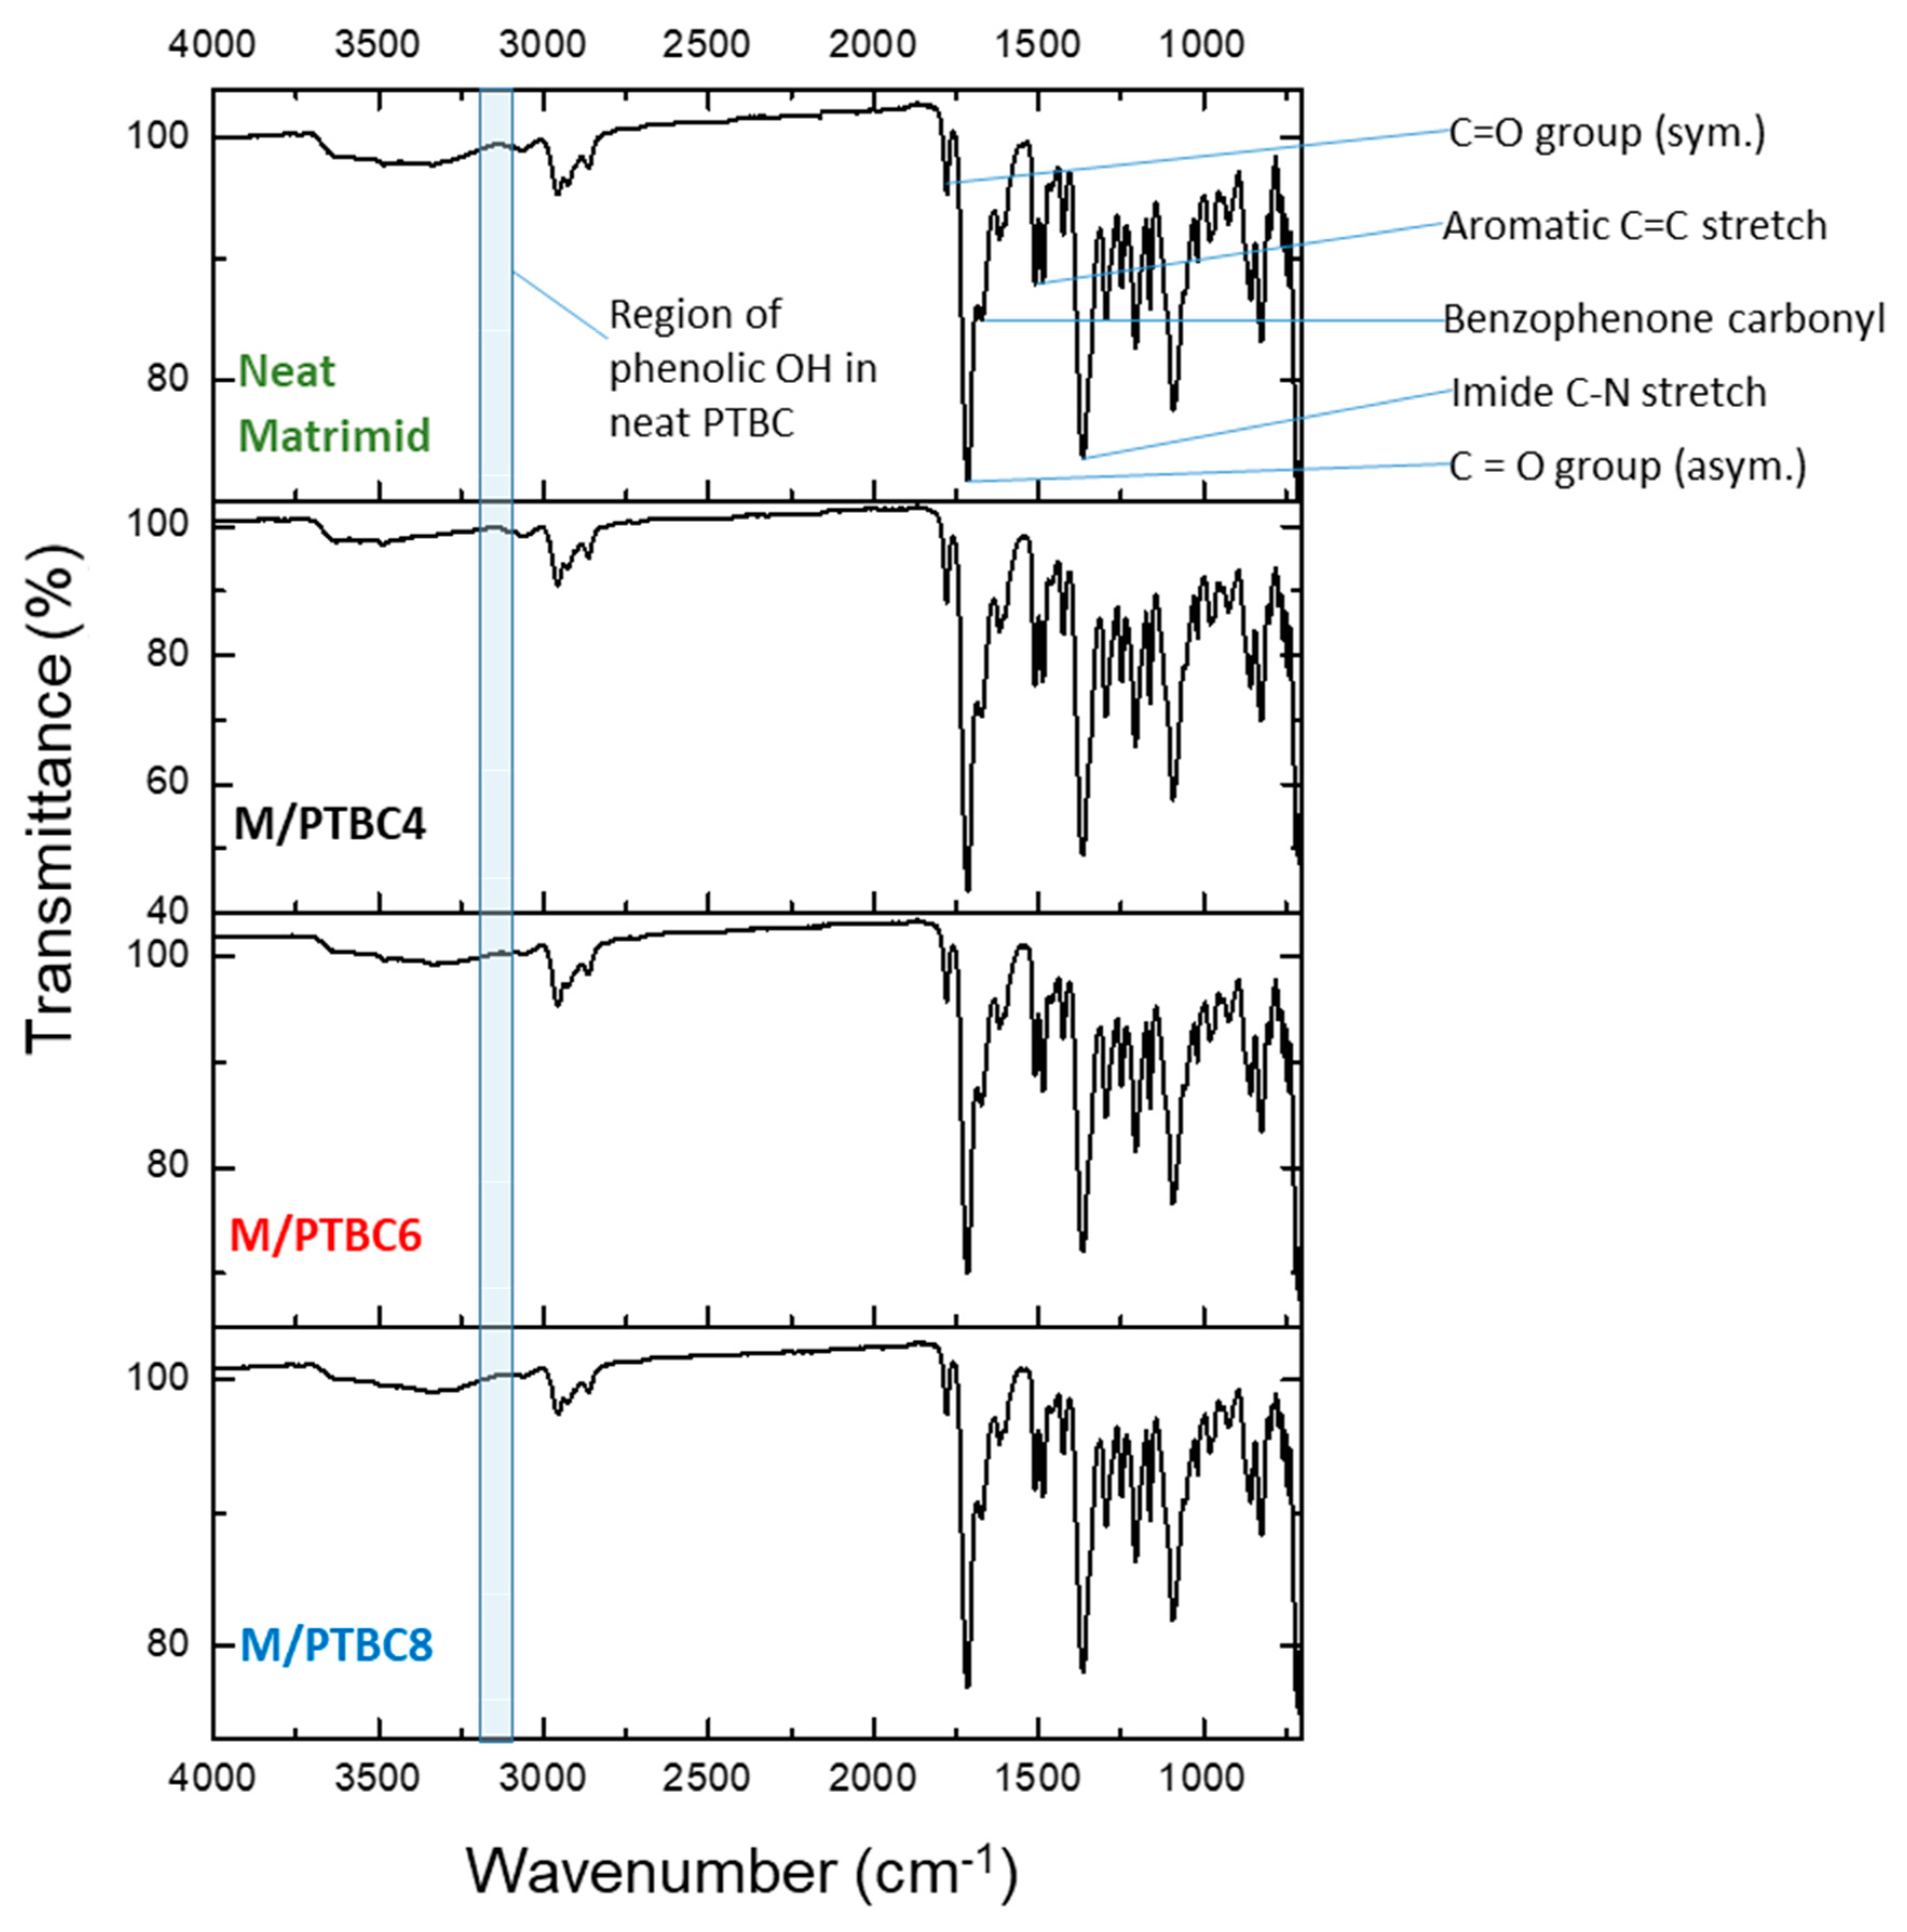
3.3. FT-IR
3.4. NMR Analysis
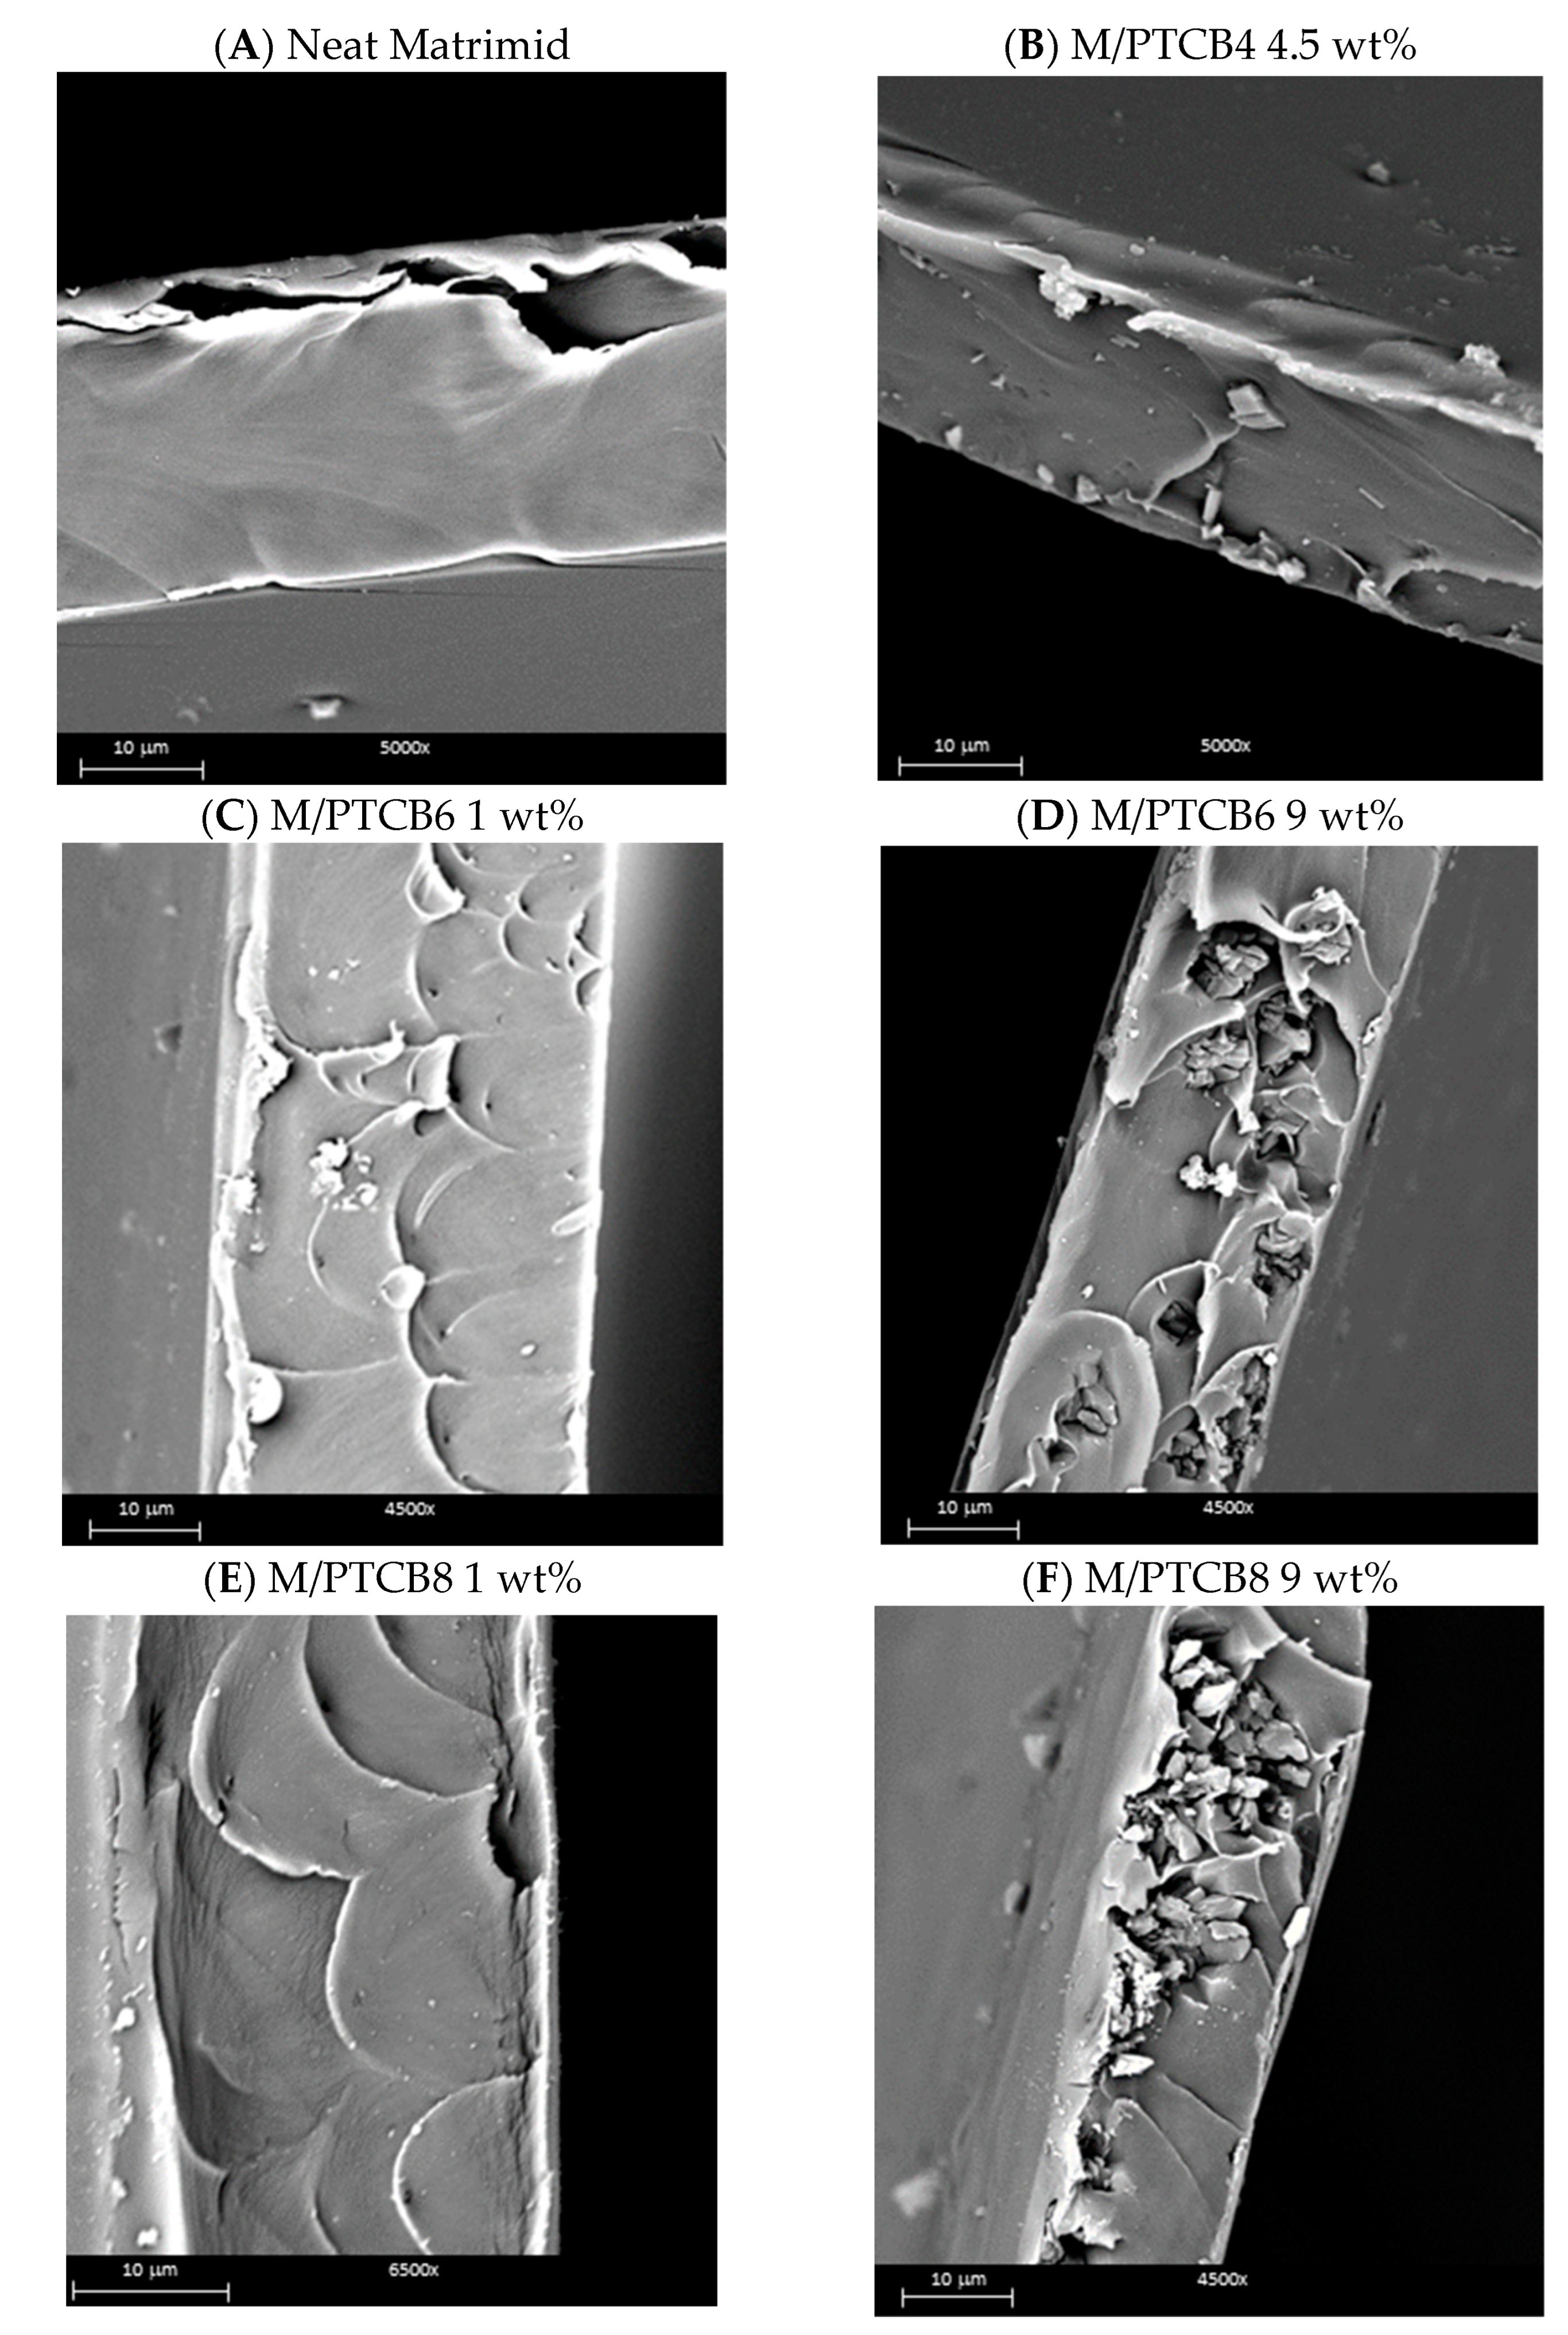
3.5. Membrane Morphology
3.6. Gas Permeation
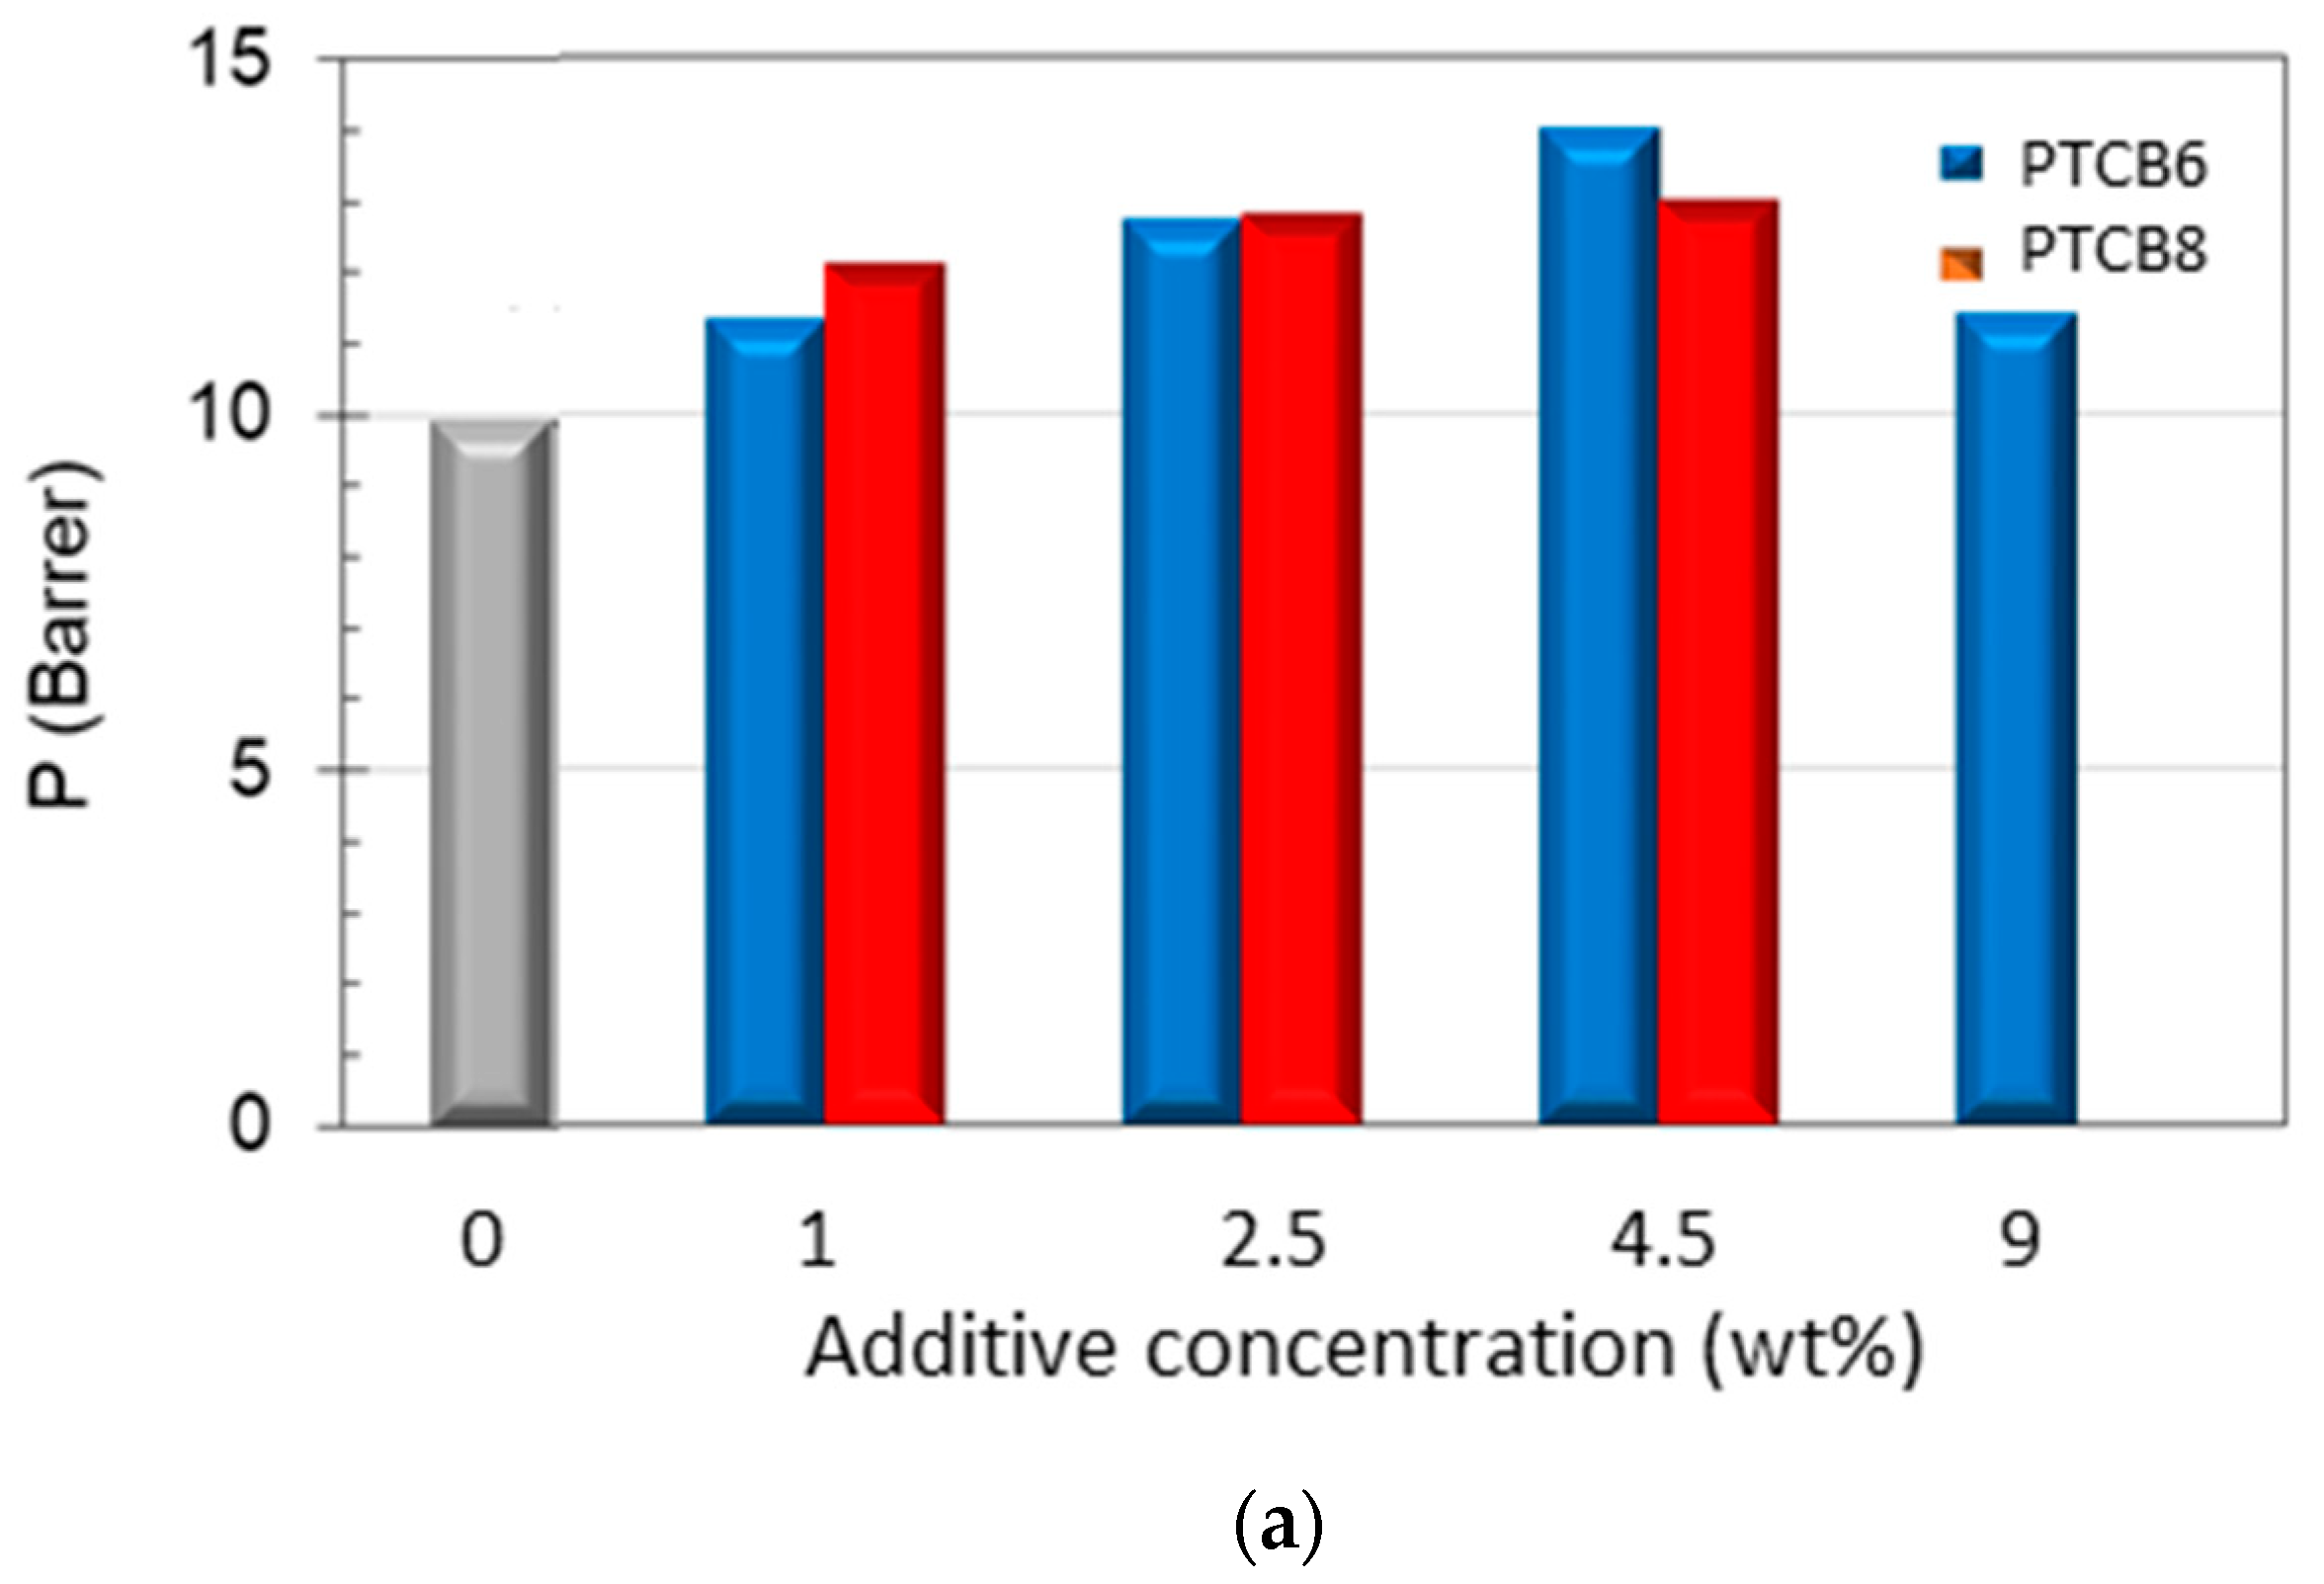
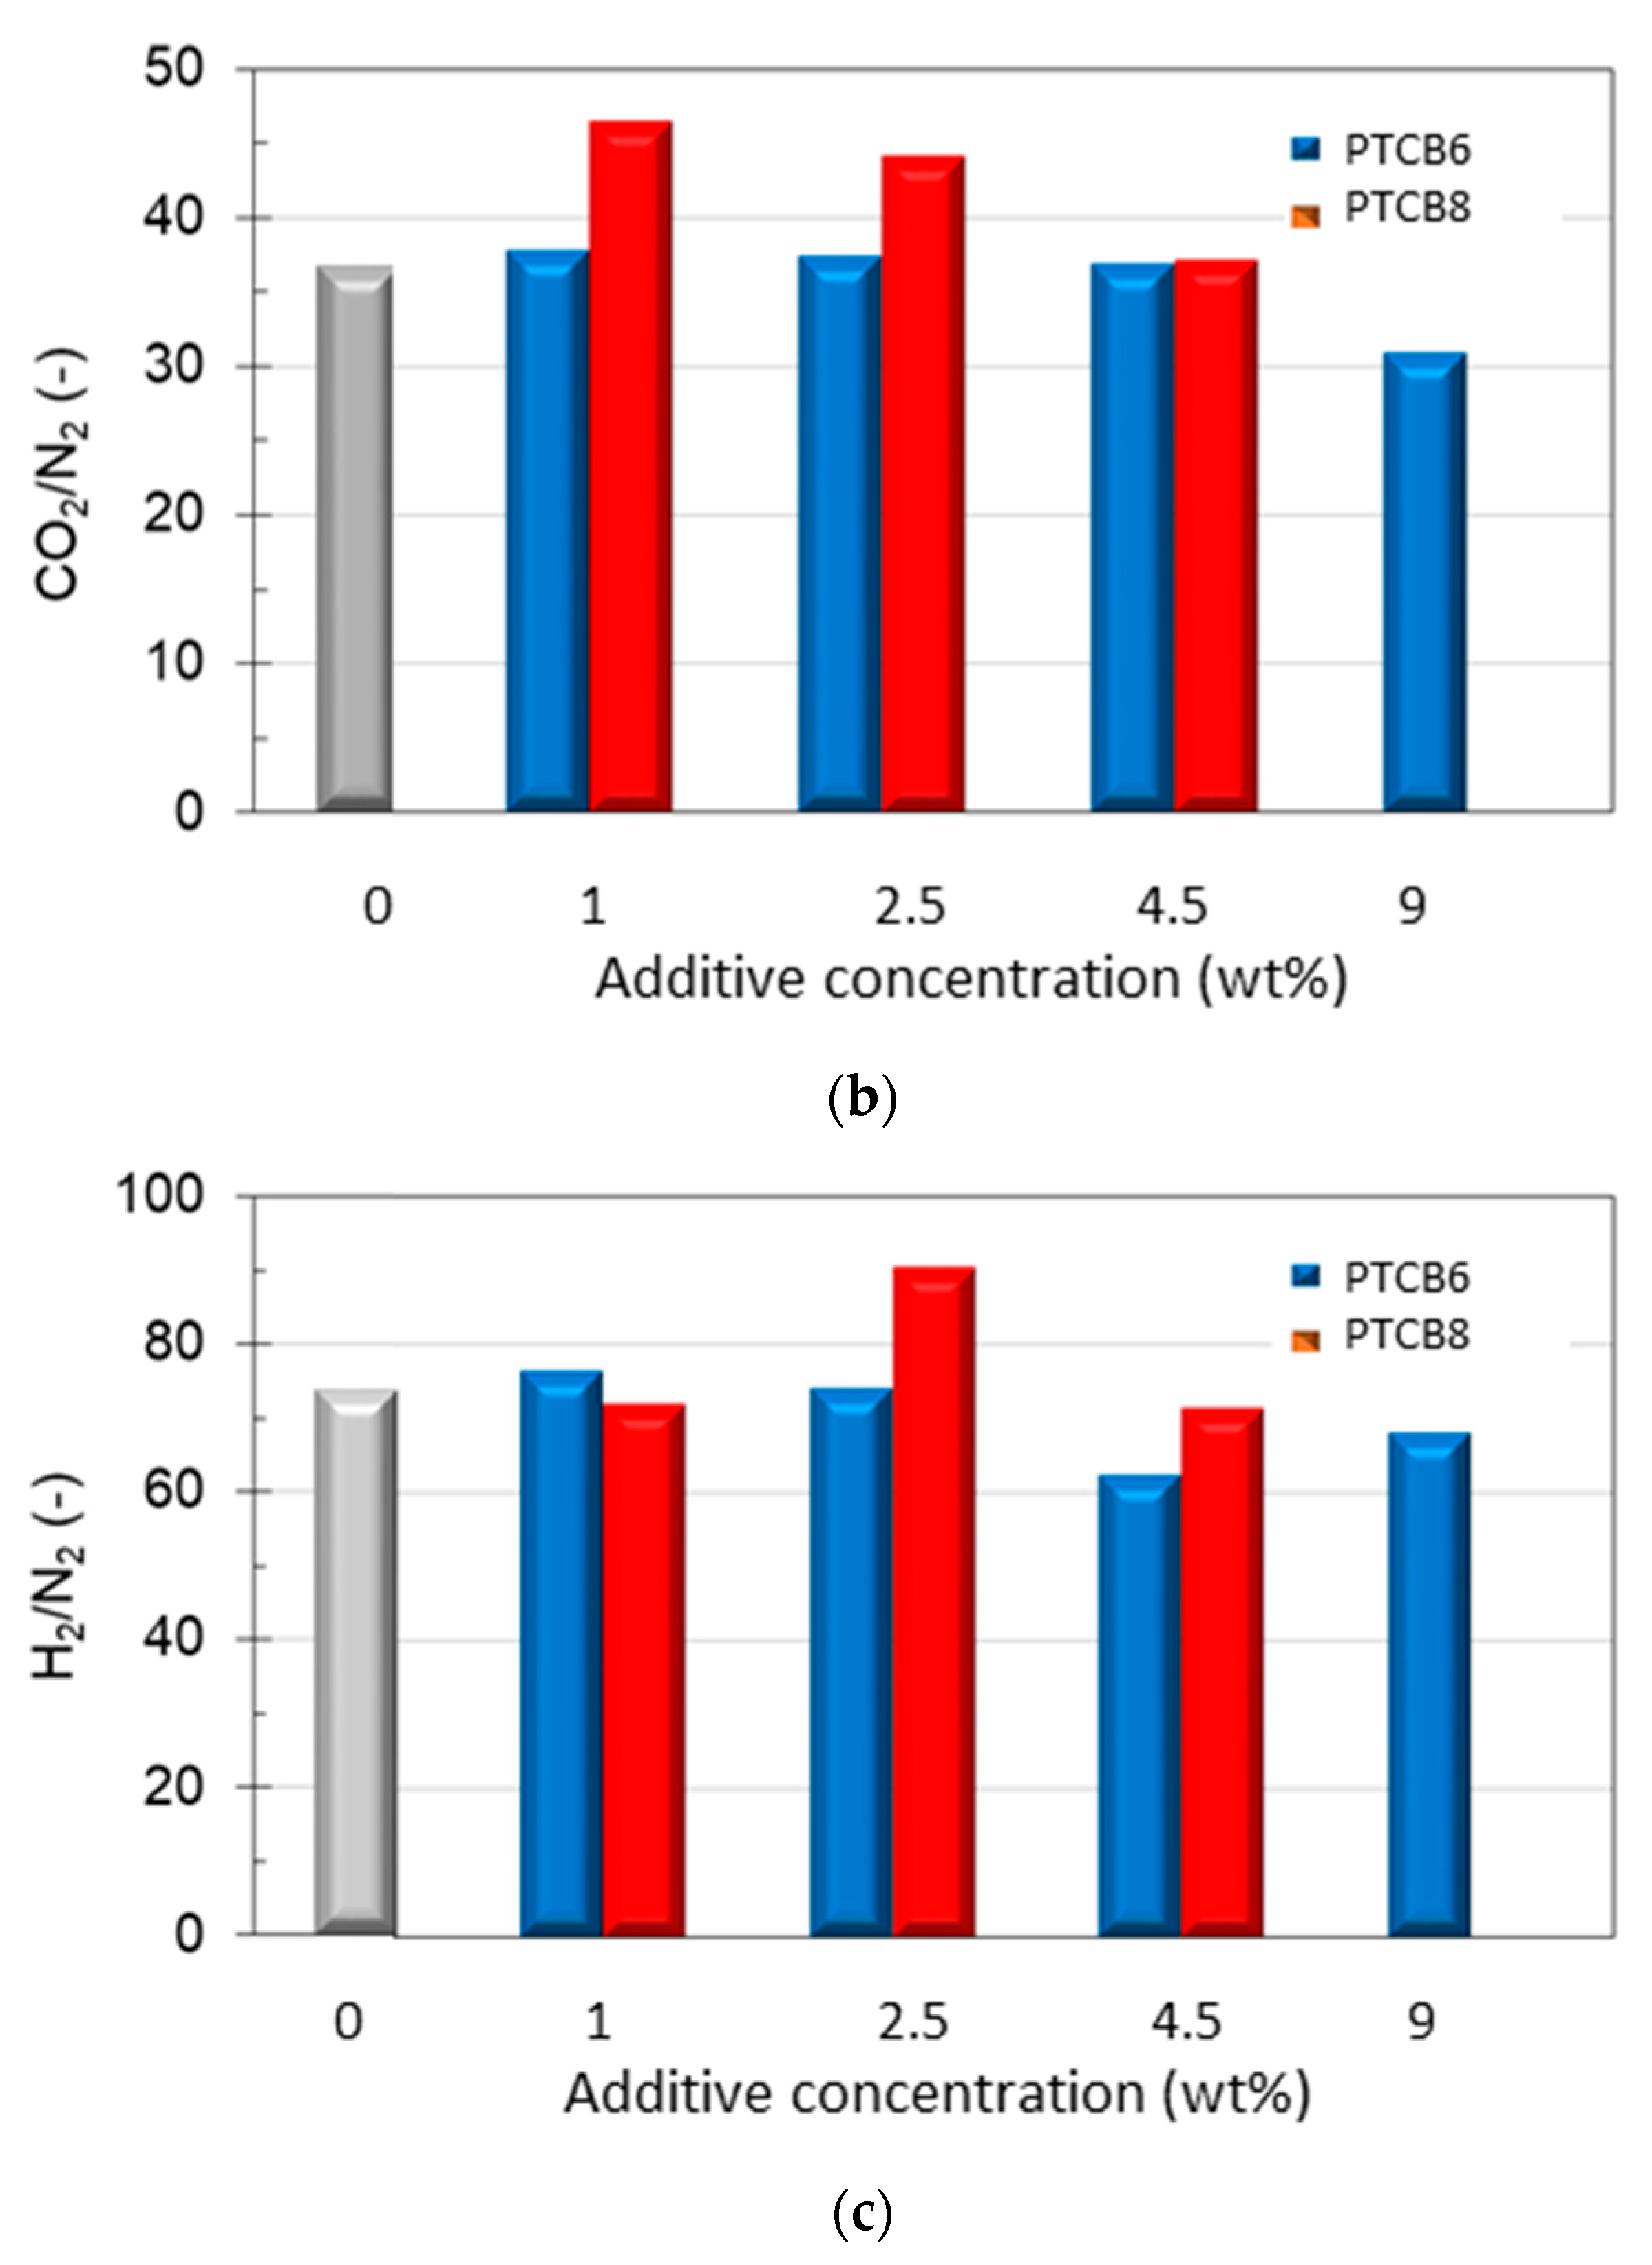
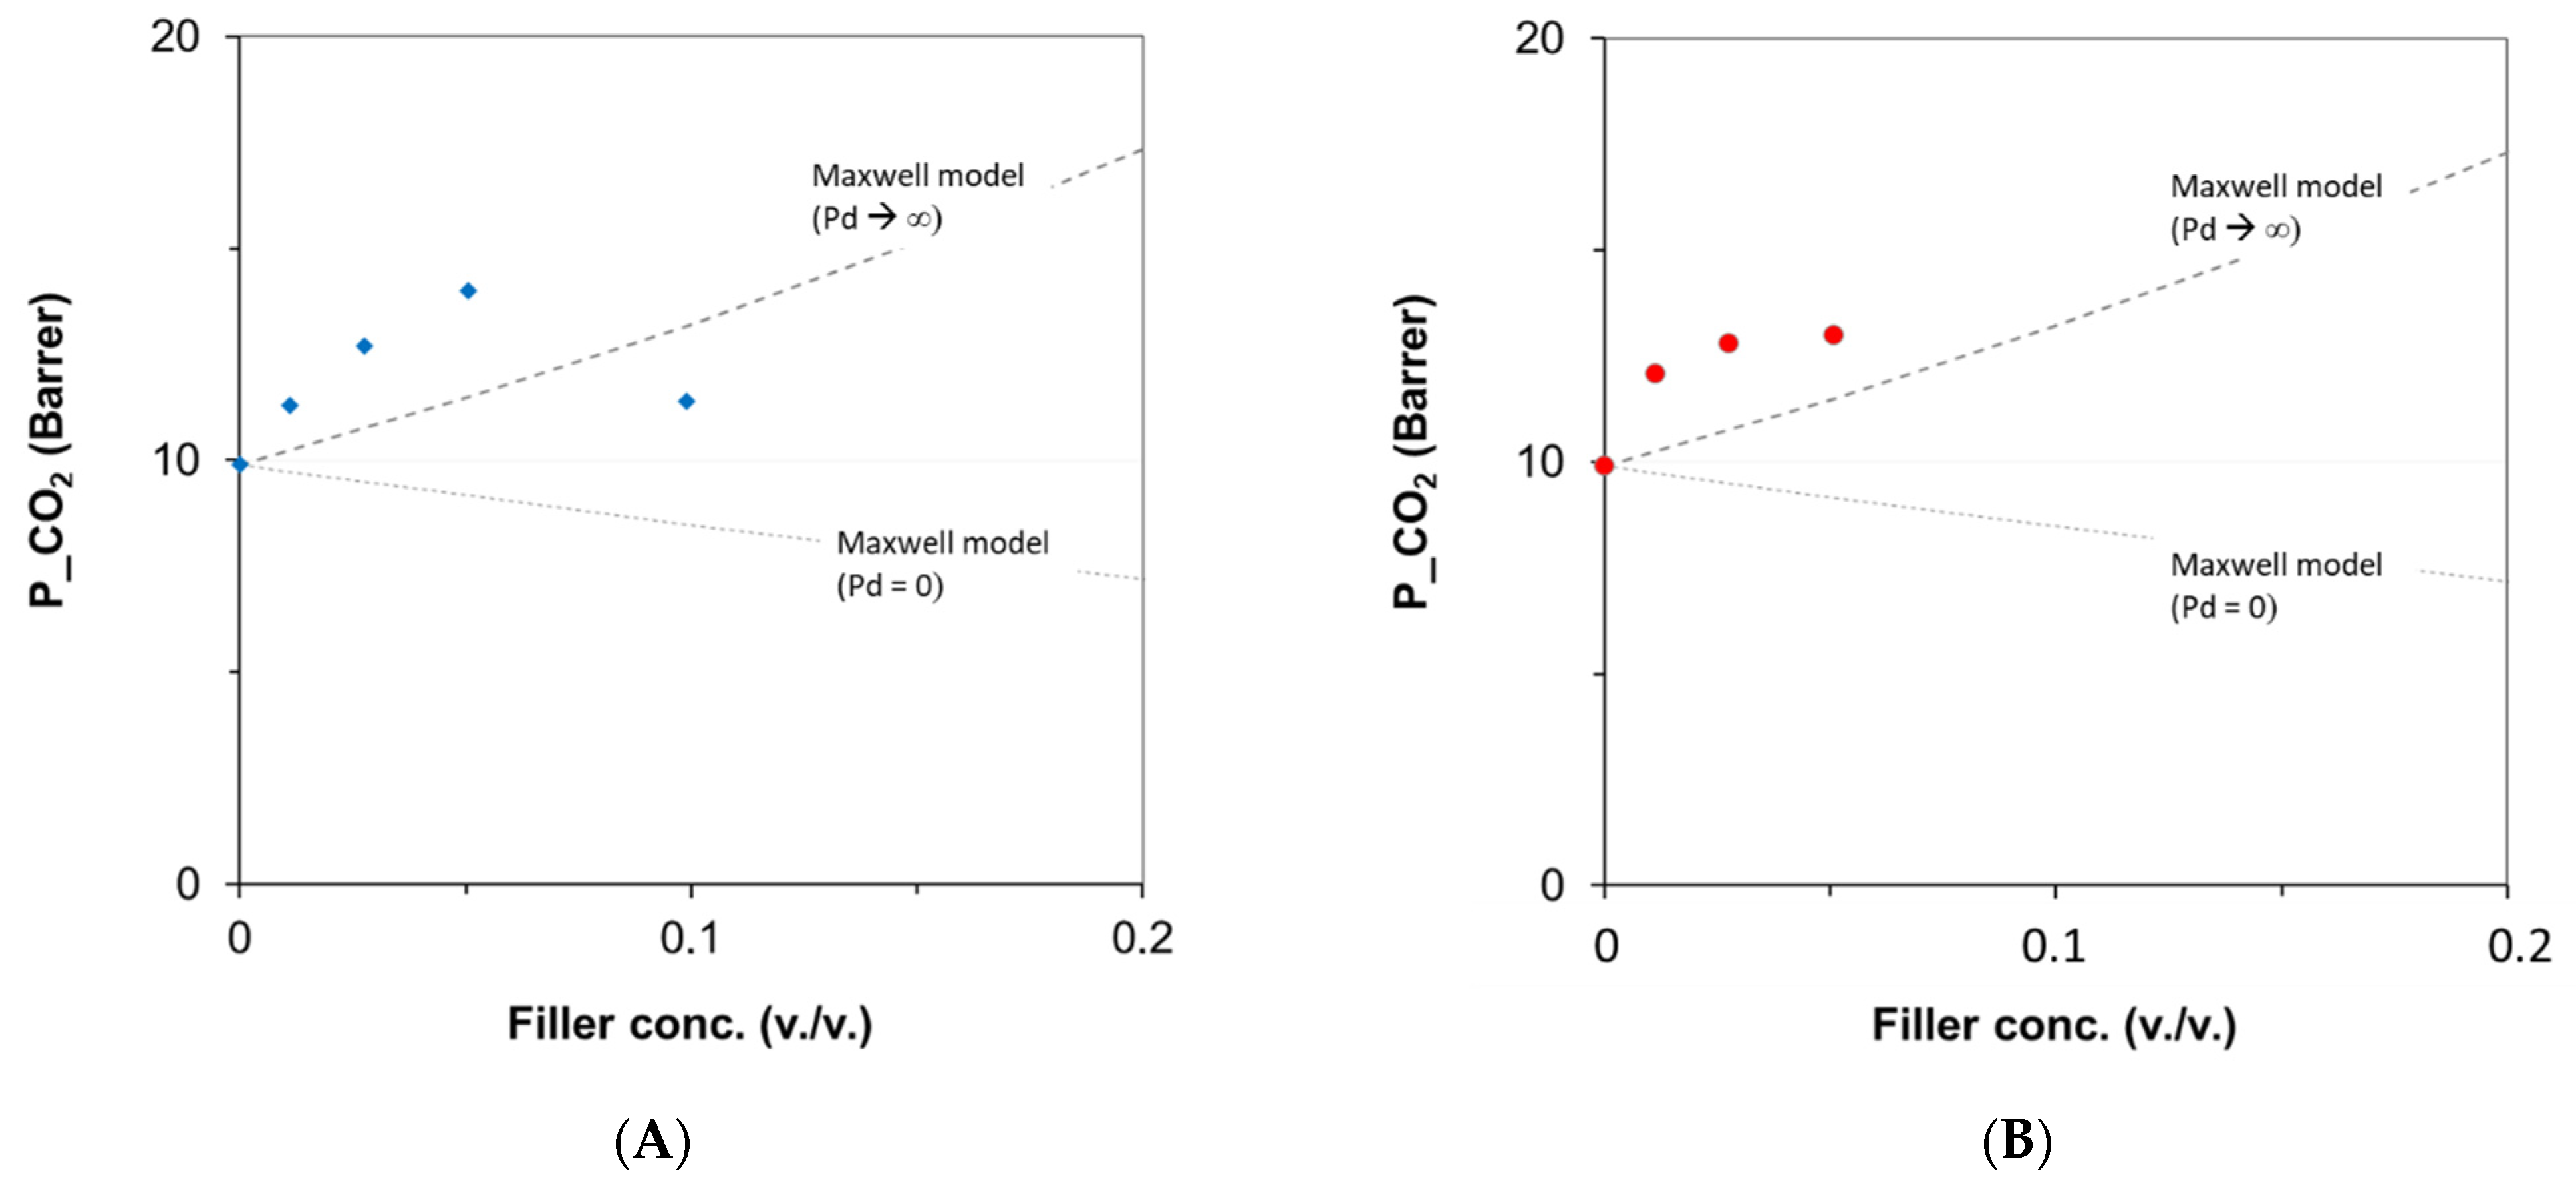
3.6.1. Effect of the Additive Type and Loading
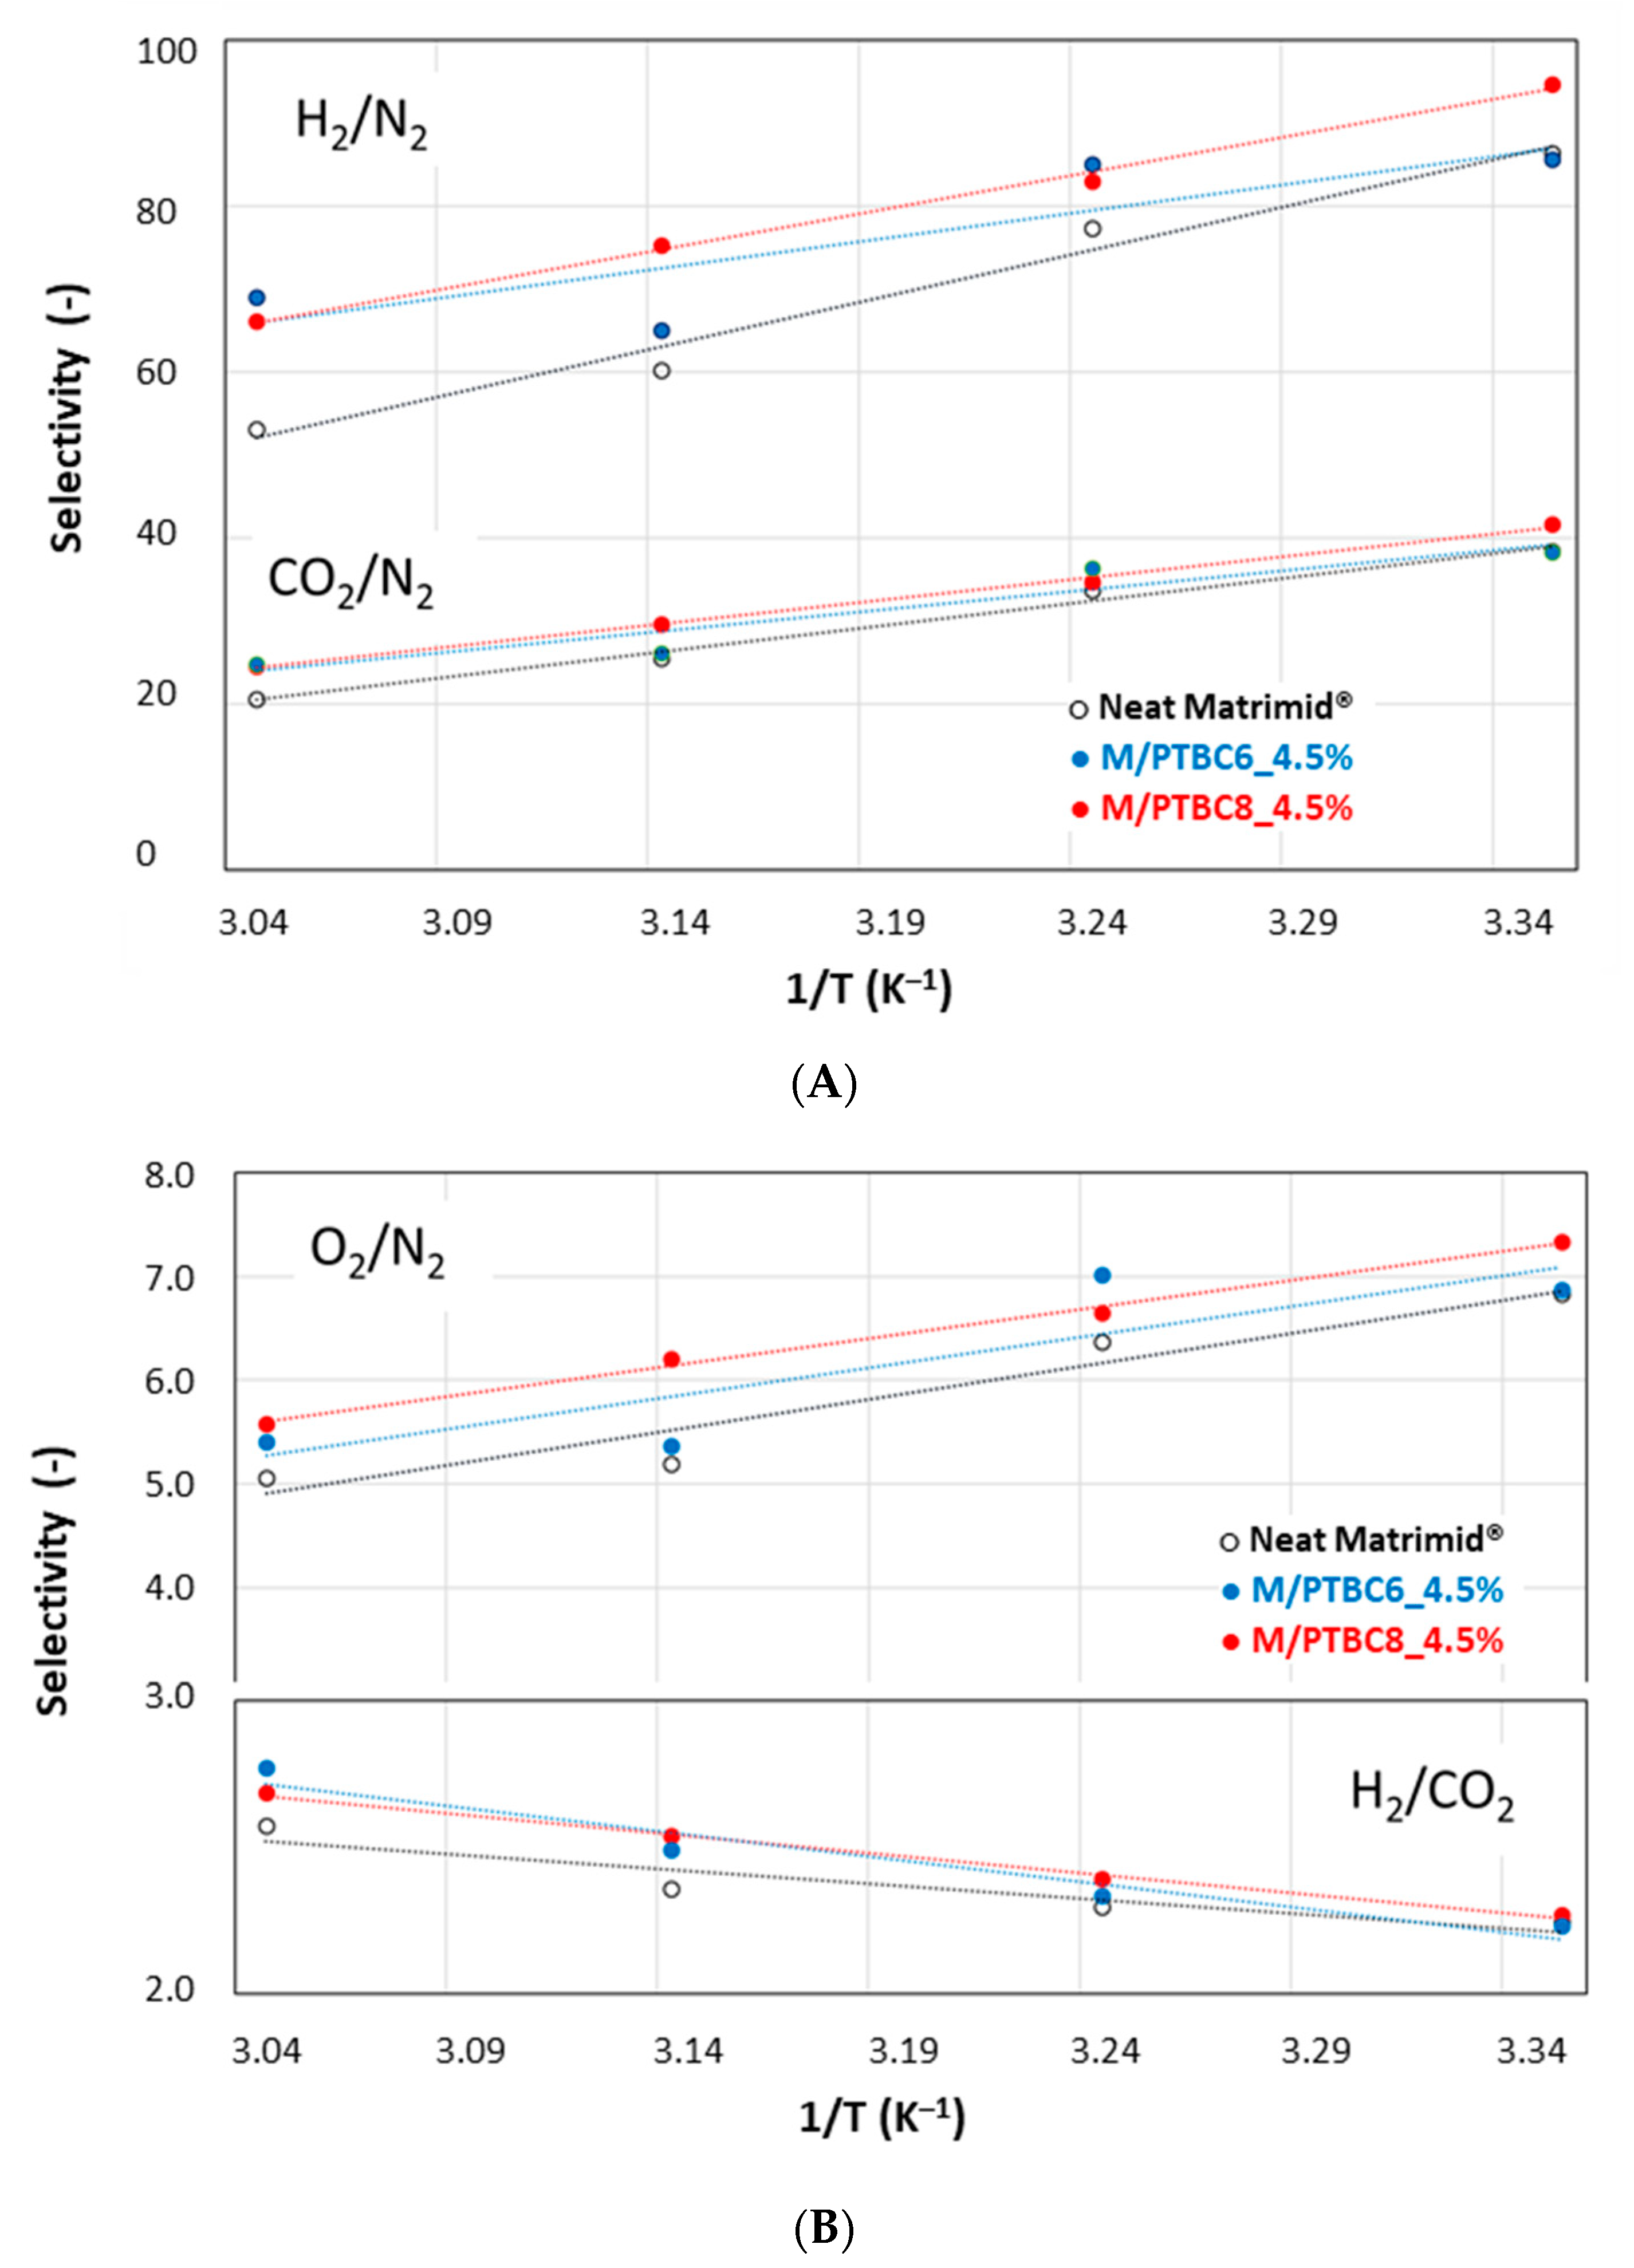
3.6.2. Effect of the Temperature on the Gas Permeation

| Membrane Code | Activation Energy for Permeability, EP (kJ/mol) | Ref. | ||||
|---|---|---|---|---|---|---|
| H2 | He | CO2 | O2 | N2 | ||
| Neat Matrimid® | 13.0 | [50] | ||||
| Neat Matrimid® | 11.34 | 9.03 | 19.7 | [51] | ||
| Neat Matrimid® | 13.6 | 9.8 | 20.7 | [52] | ||
| Neat Matrimid® | 11.7 | 12.5 | 8.2 | 16.6 | 25.6 | This work |
| M/PTBC6, 4.5 wt% | 13.7 | 12.5 | 7.9 | 13.1 | 21.1 | This work |
| M/PTBC6, 4.5 wt% | 12.8 | 12.9 | 8.3 | 15.2 | 22.4 | This work |
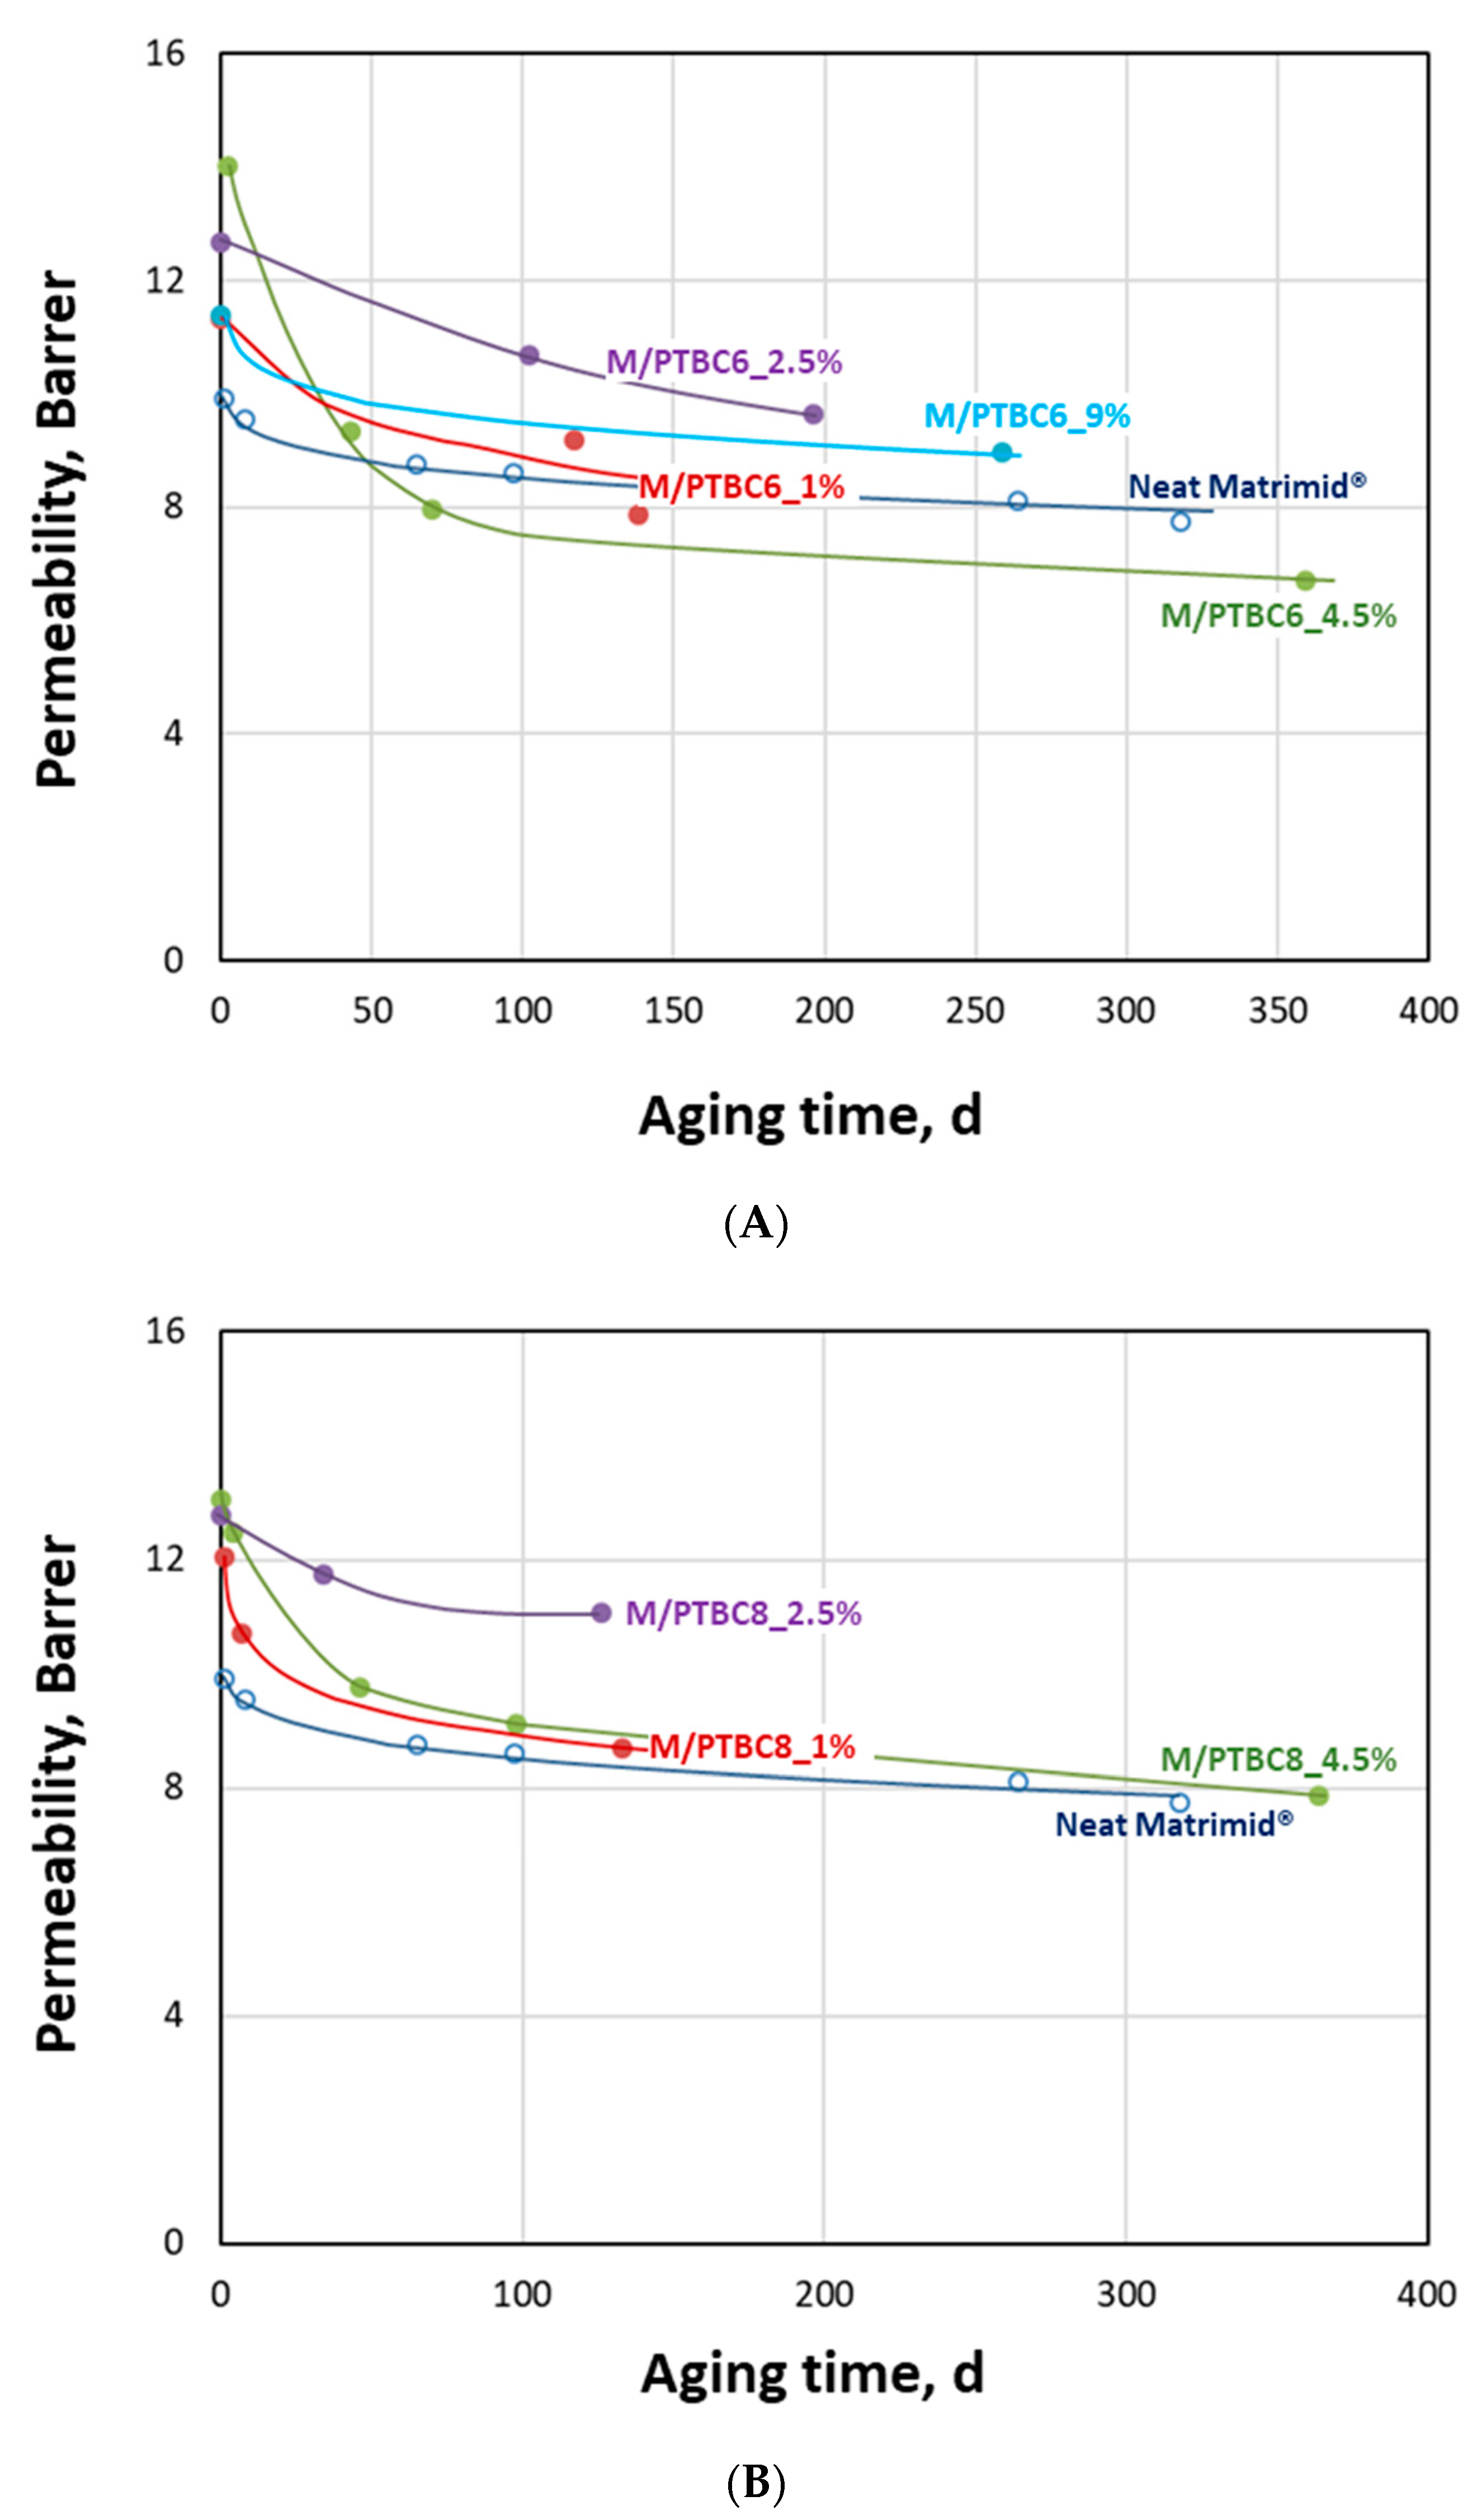
3.6.3. Aging Behavior
4. Conclusions
Supplementary Materials
Author Contributions
Funding
Institutional Review Board Statement
Data Availability Statement
Acknowledgments
Conflicts of Interest
References
- Bernardo, P.; Drioli, E.; Golemme, G. Membrane gas separation: A review/state of the art. Ind. Eng. Chem. Res. 2009, 48, 4638–4663. [Google Scholar] [CrossRef]
- Bernardo, P.; Clarizia, G. 30 years of membrane technology for gas separation. Chem. Eng. Trans. 2013, 32, 1999–2004. [Google Scholar]
- Bakhtiari, O.; Mosleh, S.; Khosravi, T.; Mohammadi, T. Synthesis and Characterization of Polyimide Mixed Matrix Membranes. Sep. Sci. Technol. 2011, 46, 2138–2147. [Google Scholar] [CrossRef]
- Chaidou, C.I.; Pantoleontos, G.; Koutsonikolas, D.E.; Kaldis, S.P.; Sakellaropoulos, G.P. Gas Separation Properties of Polyimide-Zeolite Mixed Matrix Membranes. Sep. Sci. Technol. 2012, 47, 950–962. [Google Scholar] [CrossRef]
- Akbari, A.; Karimi-Sabet, J.; Ghoreishi, S.M. Matrimid® 5218 based mixed matrix membranes containing metal organic frameworks (MOFs) for helium separation. Chem. Eng. Proc. Process Intensif. 2020, 148, 107804. [Google Scholar] [CrossRef]
- Huang, T.; Alyami, M.; Kashab, N.M.; Nunez, S.P. Engineering membranes with macrocycles for precise molecular separations. J. Mater. Chem. A 2021, 9, 18102–18128. [Google Scholar] [CrossRef]
- Sanabria Español, E.; Maldonado Villamil, M. Calixarenes: Generalities and Their Role in Improving the Solubility, Biocompatibility, Stability, Bioavailability, Detection, and Transport of Biomolecules. Biomolecules 2019, 9, 90. [Google Scholar]
- Crowley, P.B. Protein–Calixarene Complexation: From Recognition to Assembly. Acc. Chem. Res. 2022, 55, 2019–2032. [Google Scholar] [CrossRef] [PubMed]
- Zhou, Y.; Li, H.; Yang, Y.-W. Controlled drug delivery systems based on calixarenes. Chin. Chem. Lett. 2015, 26, 825–828. [Google Scholar] [CrossRef]
- Consoli, G.M.L.; Granata, G.; Geraci, C. Design, synthesis, and drug solubilizing property of the first folate-calix[4]arene conjugate. Org. Biomol. Chem. 2011, 9, 6491–6495. [Google Scholar] [CrossRef]
- Asfar, Z.; Bohmer, V. Calixarenes 2001; Kluwer Academic Publications: Dordrecht, The Netherlands, 2001. [Google Scholar]
- Viola, S.; Consoli, G.M.L.; Merlo, S.; Sortino, M.A.; Geraci, C. Inhibition of rat glioma cell migration and proliferation by a calix[8]arene scaffold exposing multiple GlcNAc and ureido functionalities. J. Neurochem. 2008, 107, 1047–1055. [Google Scholar] [CrossRef]
- Consoli, G.M.L.; Granata, G.; Galante, E.; Cunsolo, F.; Geraci, C. Hydroxycinnamic acids clustered by a calixarene platform: Antioxidative and radical scavenging activity. Tetrahedron Lett. 2006, 47, 6611–6614. [Google Scholar] [CrossRef]
- Shinkai, S.; Araki, K.; Manabe, O. Does the Calixarene Cavity recognise the Size of Guest Molecules? On the ‘Hole-size Selectivity’ in Water-soluble Calixarenes. J. Chem. Soc. Chem. Commun. 1988, 187–189. [Google Scholar] [CrossRef]
- Malinska, M. Insights into molecular recognition from the crystal structures of p-tert-butyl calix[6]arene complexed with different solvents. IUCrJ 2022, 9 Pt 1, 55–64. [Google Scholar] [CrossRef] [PubMed]
- Chung, T.S.; Lai, J.-Y. The potential of calixarenes for membrane separation. Chem. Eng. Res. Des. 2022, 183, 538–545. [Google Scholar] [CrossRef]
- Chapala, P.P.; Bermeshev, M.V.; Starannikova, L.E.; Shantarovich, V.P.; Gavrilova, N.N.; Avakyan, V.G.; Filatova, M.P.; Yampolskii, Y.P.; Finkelshtein, E.S. Gas-transport properties of new mixed matrix membranes based on addition poly(3-trimethylsilyltricyclononene-7) and substituted calixarenes. J. Membr. Sci. 2015, 474, 83–91. [Google Scholar] [CrossRef]
- Nadeali, A.; Pedram, M.Z.; Omidkhah, M.; Yarmohammadi, M. Promising Performance for Efficient CO2 Separation with the p-tert-Butylcalix[4]arene/Pebax-1657 Mixed Matrix Membrane. ACS Sustain. Chem. Eng. 2019, 7, 19015–19026. [Google Scholar] [CrossRef]
- Hymel, J.H.; Townsend, J.; Vogiatzis, K.D. CO2 Capture on Functionalized Calixarenes: A Computational Study. J. Phys. Chem. A 2019, 123, 10116–10122. [Google Scholar] [CrossRef] [PubMed]
- Surov, O.V.; Barannikov, V.P.; Voronova, M.I. Drastic and subtle thermally and gas-induced transformations of pure 4-tert-butylcalix[4]arene. Cryst. Eng. Comm. 2014, 16, 8700–8705. [Google Scholar] [CrossRef]
- Rashidian, S.; Nasrin, M.O.; Pedram, M.Z.; Hoseinzadeh, S. Study of the physicochemical and transport performance of neat Matrimid 5218 membrane with nanoparticles: A molecular dynamics simulation. Eng. Anal. Bound. Elem. 2023, 150, 642–661. [Google Scholar] [CrossRef]
- Clarizia, G.; Bernardo, P.; Gorrasi, G.; Zampino, D.; Carroccio, S.C. Influence of the preparation method and photo-oxidation treatment on the thermal and gas transport properties of dense films based on a poly(ether-block-amide) copolymer. Materials 2018, 11, 1326. [Google Scholar] [CrossRef] [PubMed]
- Crank, J. The Mathematics of Diffusion, 2nd ed.; Clarendon Press: Oxford, UK, 1975. [Google Scholar]
- Zampino, D.; Mancuso, M.; Zaccone, R.; Ferreri, T.; Borzacchiello, A.; Zeppetelli, S.; Dattilo, S.; Ussia, M.; Ferreri, L.; Carbone, D.C.; et al. Thermo-mechanical, antimicrobial and biocompatible properties of PVC blends based on imidazolium ionic liquids. Mater. Sci. Eng. C 2021, 122, 111920. [Google Scholar] [CrossRef] [PubMed]
- Zhang, D.; Lu, L. Study on Thermal Decomposition Kinetics of Calixarene. China Plastics 2021, 35, 27–33. [Google Scholar]
- Chennakesavulu, K.; Basariya, M.R.; Sreedevi, P.; Raju, G.B.; Prabhakar, S.; Rao, S.S. Study on thermal decomposition of calix[4]arene and its application in thermal stability of polypropylene. Thermochim. Acta 2011, 515, 24–31. [Google Scholar] [CrossRef]
- Chennakesavulu, K.; Basariya, M.R.; Raju, G.B.; Prabhakar, S. Study on thermal decomposition of calix[6]arene and calix[8]arene. J. Therm. Anal. Calorim. 2011, 103, 853–862. [Google Scholar] [CrossRef]
- Lee, T.H.; Lee, B.K.; Park, J.S.; Park, J.; Kang, J.H.; Yoo, S.Y.; Park, I.; Kim, Y.-H.; Park, H.B. Surface Modification of Matrimid® 5218 Polyimide Membrane with Fluorine-Containing Diamines for Efficient Gas Separation. Membranes 2022, 12, 256. [Google Scholar] [CrossRef] [PubMed]
- Venna, S.R.; Lartey, M.; Li, T.; Spore, A.; Kumar, S.; Nulwala, H.B.; Luebke, D.R.; Rosi, N.L.; Albenze, E. Fabrication of MMMs with improved gas separation properties using externally-functionalized MOF particles. J. Mater. Chem. A 2015, 3, 5014–5022. [Google Scholar] [CrossRef]
- Deligöz, H.; Karakuş, Ö.Ö.; Çilgi, G.K. A Brief Review on the Thermal Behaviors of Calixarene-Azocalixarene Derivatives and Their Complexes. J. Macromol. Sci. Part A Pure Appl. Chem. 2012, 49, 259–274. [Google Scholar] [CrossRef]
- Galindo-García, U.; Torres, L.A. Crystal Structure at the Origin of the Thermal Stability and Large Enthalpy of Fusion and Sublimation Values of Calixarenes. Cryst. Growth Des. 2020, 20, 1302–1310. [Google Scholar] [CrossRef]
- Loloei, M.; Moghadassi, A.; Omidkhah, M.; Amooghin, A.E. Improved CO2 separation performance of Matrimid ® 5218 membrane by addition of low molecular weight polyethylene glycol. Greenh. Gas Sci Technol. 2015, 5, 530–544. [Google Scholar] [CrossRef]
- Castro-Munoz, R.; Fıla, V.; Ahmad, M.Z. Enhancing the CO2 Separation Performance of Matrimid 5218 Membranes for CO2/CH4 Binary Mixtures. Chem. Eng. Technol. 2019, 42, 645–654. [Google Scholar] [CrossRef]
- Weigelt, F.; Georgopanos, P.; Shishatskiy, S.; Filiz, V.; Brinkmann, T.; Abetz, V. Development and Characterization of Defect-Free Matrimid® Mixed-Matrix Membranes Containing Activated Carbon Particles for Gas Separation. Polymers 2018, 10, 51. [Google Scholar] [CrossRef] [PubMed]
- Tiuca, I.; Saponar, A.; Bodoki, A.; Ziémons, E.; Bodoki, E.; Hubert, P.; Oprean, R. ATR-IR and Raman Spectroscopic study of interaction between major Calixarene derivatives and oral anticoagulants. Farmacia 2013, 61, 874–882. [Google Scholar]
- Chennakesavulu, K.; Sreedevi, P.; Basaria, M.R.; Reddy, G.R.; Sasipraba, T.; Raju, G.B.; Prabhakar, S. Thermal decomposition mechanism of p-tert-butyl-calix[n]arenes. Thermochim. Acta 2014, 575, 55–63. [Google Scholar] [CrossRef]
- Furer, V.L.; Vandyukov, A.E.; Zaripov, S.R.; Soloviev, S.E.; Antipin, I.S.; Kovalenko, V.I. FT-IR and FT-Raman study of hydrogen bonding in p-alkylcalix[8]arenes. Vib. Spectrosc. 2018, 95, 38–43. [Google Scholar] [CrossRef]
- Furer, V.L.; Vandyukov, A.E.; Khamatgalimov, A.R.; Kleshnina, S.R.; Solovieva, S.E.; Antipin, I.S.; Kovalenko, V.I. FT-IR and FT- Investigation of hydrogen bonding in p-sulfonatocalix[4]arene and its thermal stability by vibrational spectroscopy. J. Mol. Struct. 2019, 1195, 403–410. [Google Scholar] [CrossRef]
- Rico-Martínez, S.; Álvarez, C.; Hernández, A.; Miguel, J.A.; Lozano, Á.E. Mixed Matrix Membranes Loaded with a Porous Organic Polymer Having Bipyridine Moieties. Membranes 2022, 12, 547. [Google Scholar] [CrossRef]
- Soto-Herranz, M.; Sánchez-Báscones, M.; Hérnandez-Giménez, A.; Calvo-Díez, J.I.; Martín-Gil, J.; Martín-Ramos, P. Effects of Protonation, Hydroxylamination, and Hydrazination of g-C3N4 on the Performance of Matrimid®/g-C3N4 Membranes. Nanomaterials 2018, 8, 1010. [Google Scholar] [CrossRef]
- Mahajan, R.; Burns, R.; Schaeffer, M.; Koros, W.J. Challenges in forming successful mixed matrix membranes with rigid polymeric materials. Appl. Polym. J. 2002, 86, 881–890. [Google Scholar] [CrossRef]
- Gutsche, C.D.; Dhawan, B.; No, K.H.; Muthukrishnan, R. Calixarenes. 4. The synthesis, characterization, and properties of the calixarenes from p-tert-butylphenol. J. Am. Chem. Soc. 1981, 103, 3782–3792. [Google Scholar] [CrossRef]
- Gong, H.; Lee, S.S.; Bae, T.-H. Mixed-matrix membranes containing inorganically surface-modified 5A zeolite for enhanced CO2/CH4 separation. Microporous Mesoporous Mater. 2017, 237, 82–89. [Google Scholar] [CrossRef]
- Gutsche, C.D. Calixarenes; Stoddart, J.F., Ed.; The Royal Society of Chemistry: Cambridge, UK, 1989. [Google Scholar]
- Gutsche, C.D.; Gutsche, A.E.; Karaulov, A.I. Calixarenes 11. Crystal and Molecular Structure of p-Tert-Butylcalix[8]Arene. J. Inclusion Phenom. 1985, 3, 447–451. [Google Scholar] [CrossRef]
- Kieliszek, A.; Malinska, M. Conformations of p-tert-Butylcalix[8]arene in Solvated Crystal Structures. Cryst. Growth Des. 2021, 21, 6862–6871. [Google Scholar] [CrossRef]
- Maxwell, J.C. A Treatise on Electricity and Magnetism; Cambridge University Press: Cambridge, UK, 2010. [Google Scholar]
- Matteucci, S.; Yampolskii, Y.; Freeman, B.D.; Pinnau, I. Transport of Gases and Vapors in Glassy and Rubbery Polymers, Materials Science of Membranes for Gas and Vapor Separation; John Wiley & Sons: Chichester, UK, 2006; pp. 1–47. [Google Scholar]
- Stevens, K.A.; Moon, J.D.; Borjigin, H.; Liu, R.; Joseph, R.M.; Riffle, J.S.; Freeman, B.D. Influence of temperature on gas transport properties of tetraaminodiphenylsulfone (TADPS) based polybenzimidazoles. J. Membr. Sci. 2020, 593, 117427. [Google Scholar] [CrossRef]
- Amooghin, A.E.; Omidkhah, M.; Kargari, A. Enhanced CO2 transport properties of membranes by embedding nano-porous zeolite particles into Matrimid®5218 matrix. RSC Adv. 2015, 5, 8552–8565. [Google Scholar] [CrossRef]
- Zhao, H.Y.; Cao, Y.M.; Ding, X.L.; Zhou, M.Q.; Yuan, Q. Effects of cross-linkers with different molecular weights in cross-linked Matrimid 5218 and test temperature on gas transport properties. J. Membr. Sci. 2008, 323, 176–184. [Google Scholar] [CrossRef]
- Ansaloni, L.; Minelli, M.; Giacinti Baschetti, M.; Sarti, G.C. Effect of relative humidity and temperature on gas transport in Matrimid®: Experimental study and modelling. J. Membr. Sci. 2014, 471, 392–401. [Google Scholar] [CrossRef]
- Cui, L.; Qiu, W.; Paul, D.R.; Koros, W.J. Physical aging of 6FDA-based polyimide membranes monitored by gas permeability. Polymer 2011, 52, 3374–3380. [Google Scholar] [CrossRef]
- Huang, Y.; Paul, D.R. Physical aging of thin glassy polymer films monitored by gas permeability. Polymer 2004, 45, 8377–8393. [Google Scholar] [CrossRef]
- Smith, S.J.D.; Lau, C.H.; Mardel, J.I.; Kitchin, M.; Konstas, K.; Ladewig, B.P.; Hill, M.R. Physical aging in glassy mixed matrix membranes; tuning particle interaction for mechanically robust nanocomposite films. J. Mater. Chem. A 2016, 4, 10627–10634. [Google Scholar] [CrossRef]
- Prasetya, N.; Donose, B.C.; Ladewig, B.P. A new and highly robust light-responsive Azo-UiO-66 for highly selective and low energy post-combustion CO2 capture and its application in a mixed matrix membrane for CO2/N2 separation. J. Mater. Chem. A 2018, 6, 16390–16402. [Google Scholar] [CrossRef]
- Perez, E.V.; Balkus, K.J.; Ferraris, J.P.; Musselman, I.H. Mixed-matrix membranes containing MOF-5 for gas separations. J. Membr. Sci. 2009, 328, 165–173. [Google Scholar] [CrossRef]
- Khan, A.L.; Klaysom, C.; Gahlaut, A.; Khan, A.U.; Vankelecom, I.F. Mixed matrix membranes comprising of Matrimid and –SO3H functionalized mesoporous MCM-41 for gas separation. J. Membr. Sci. 2013, 447, 73–79. [Google Scholar] [CrossRef]
- Musselman, I.; Balkus, K., Jr.; Ferraris, J. Mixed-Matric Membranes for CO2 and H2 Gas Separations Using Metal-Organic Framework and Mesoporus Hybrid Silicas; University of Texas: Dallas, TX, USA, 2009. [Google Scholar]
- Zhang, Y.; Musselman, I.H.; Ferraris, J.P.; Balkus, K.J. Gas permeability properties of Matrimid® membranes containing the metal-organic framework Cu–BPY–HFS. J. Membr. Sci. 2008, 313, 170–181. [Google Scholar] [CrossRef]
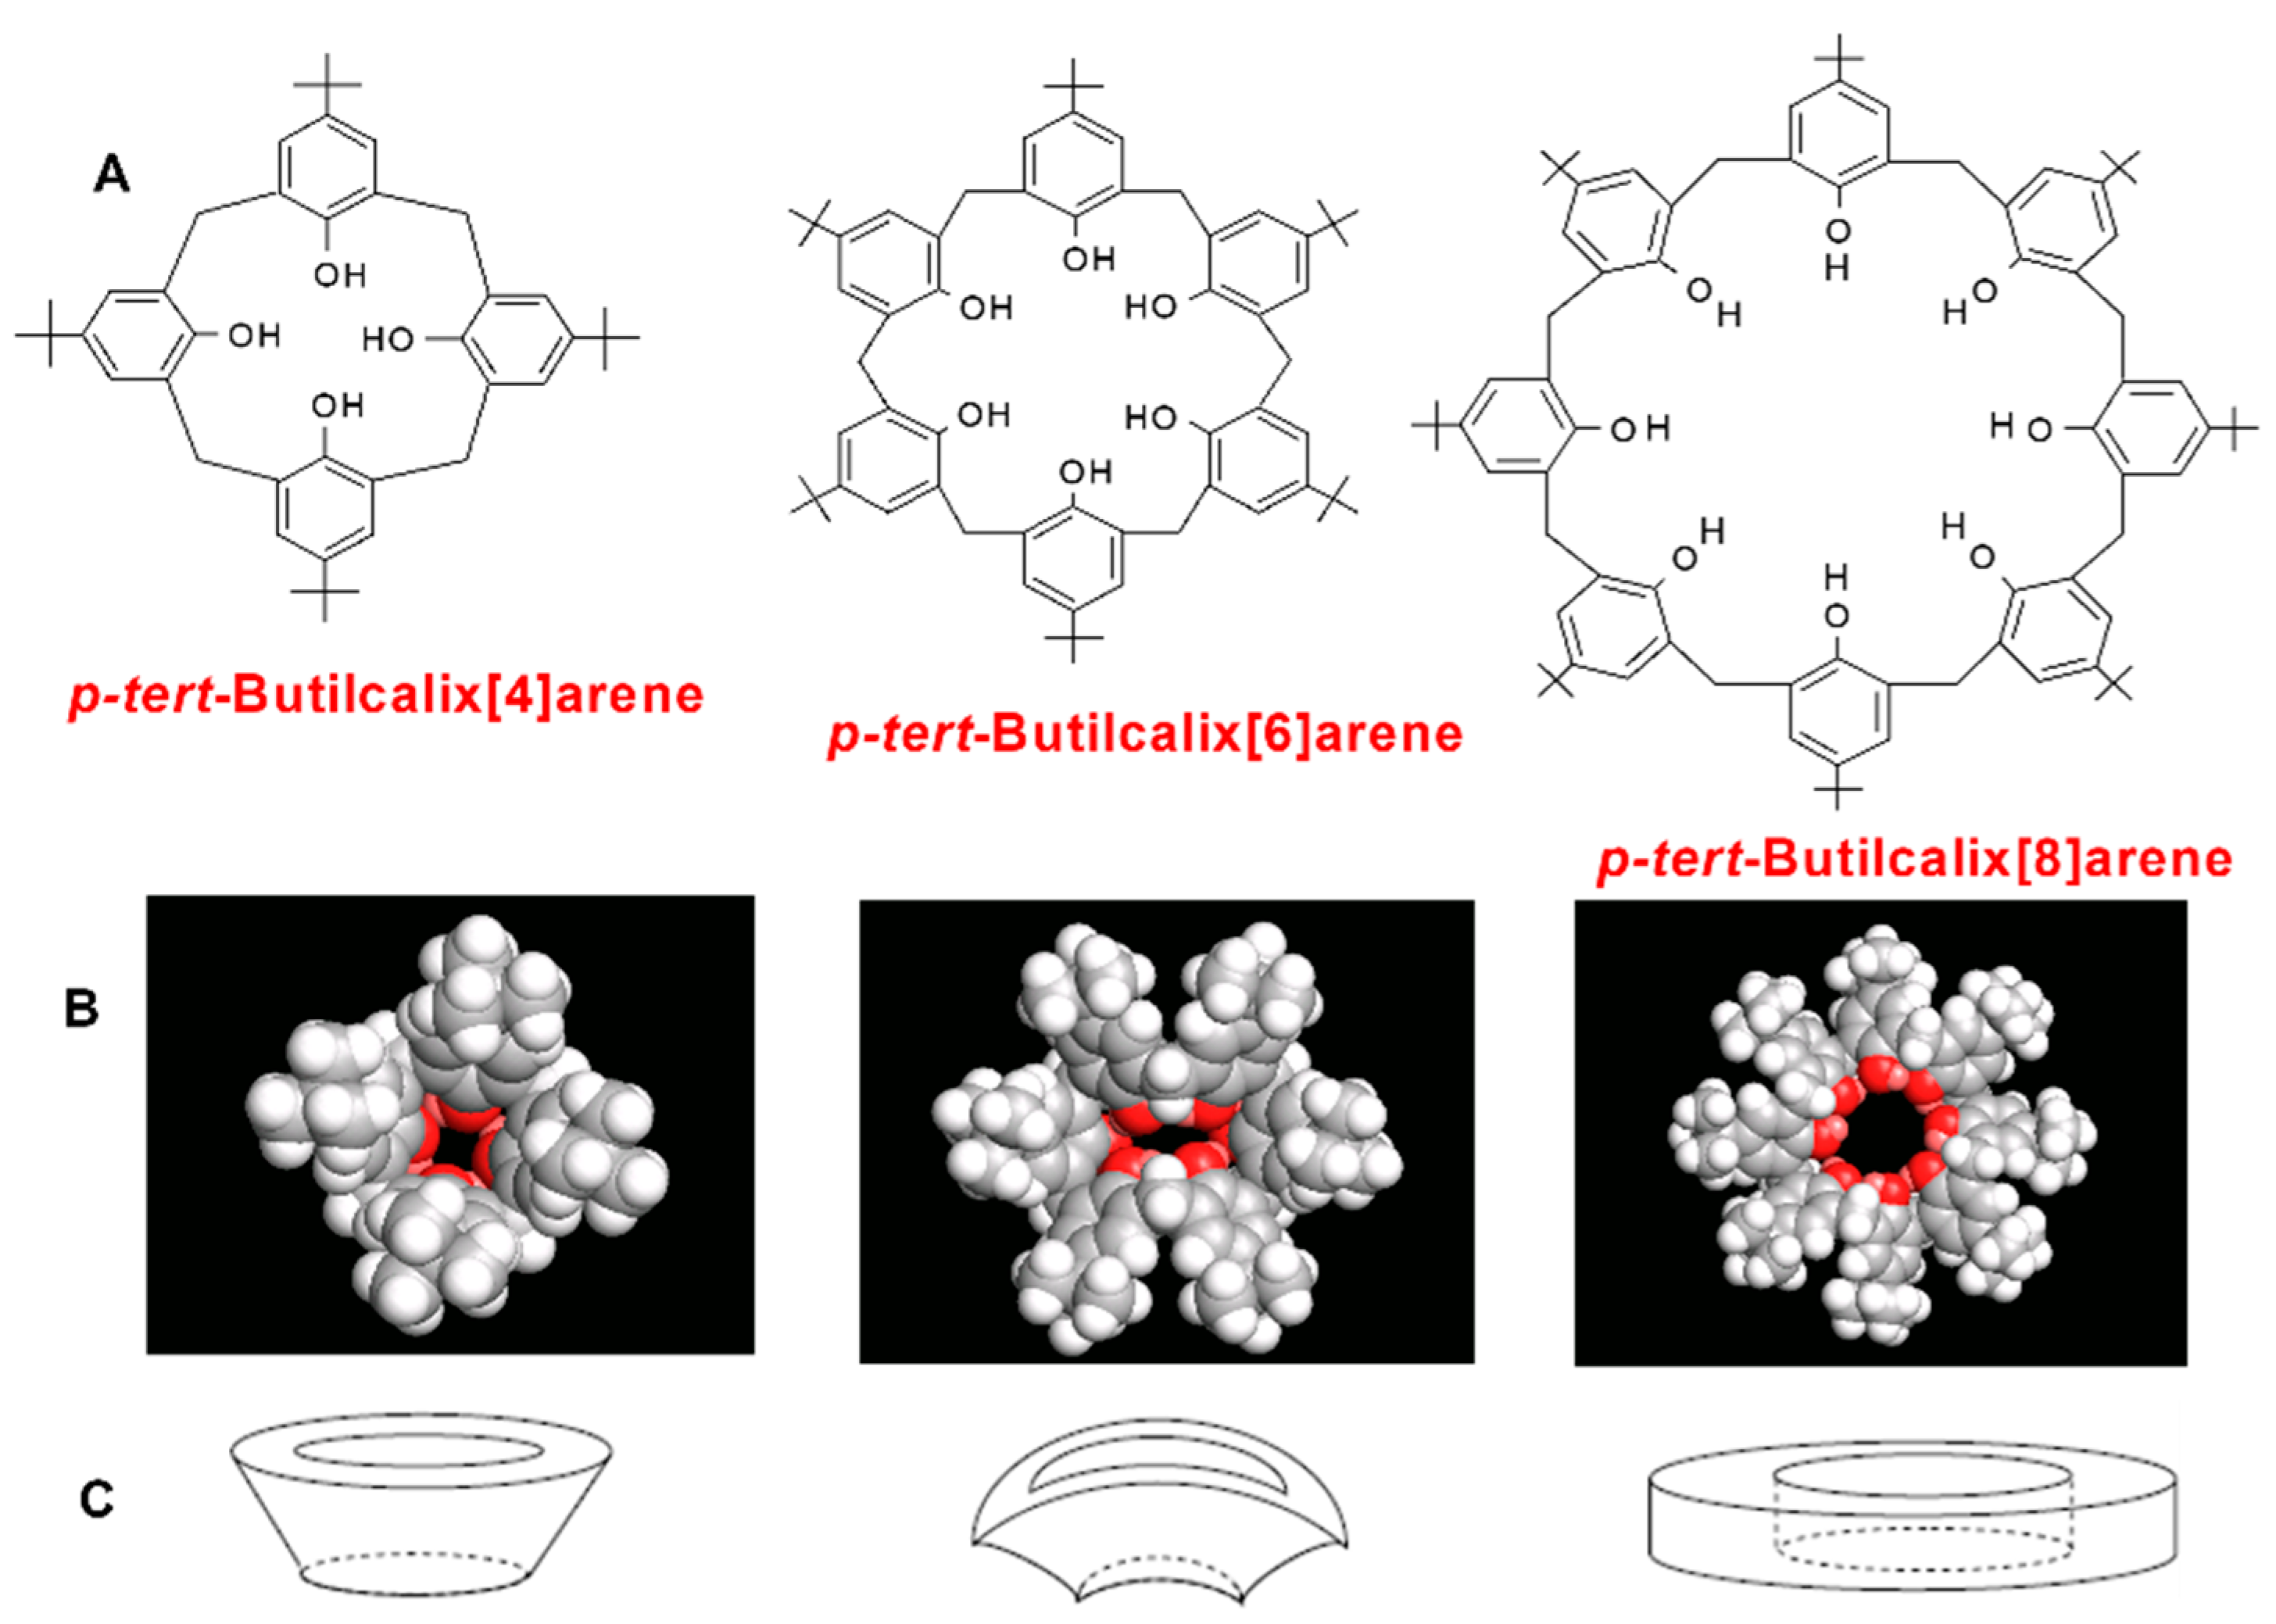
| Code | Additive Type | Upper Rim | Lower Rim | Density g/cm3 | Molar Volume cm3 |
|---|---|---|---|---|---|
| PTBC4 | Calix[4]arene | t-Bu | (OH)4 | 1.1 ± 0.1 | 592.6 |
| PTBC6 | calix[6]arene | t-Bu | (OH)6 | 1.1 ± 0.1 | 888.9 |
| PTBC8 | calix[8]arene | t-Bu | (OH)8 | 1.1 ± 0.1 | 1185.1 |
| Membrane | Matrimid® | M/PTBC4 | M/PTBC6 | M/PTBC8 |
|---|---|---|---|---|
| Group | Frequency (cm−1) | |||
| Polyimide C=O group | 1778 | 1778 | 1778 | 1778 |
| Corresponding asymmetric stretch | 1713 | 1715 | 1756 | |
| Imide C-N stretch | 1365 | 1367 | 1366 | |
| Stretching of aromatic double bond | 1512 | 1509 | 1511 | |
| Imidic group | 1671 | 1672 | 1674 | |
| Sample | Conc. (wt%) | Permeability (Barrer) | |||||
|---|---|---|---|---|---|---|---|
| He | H2 | N2 | O2 | CO2 | CH4 | ||
| Neat Matrimid® | 0 | 18.7 | 19.9 | 0.27 | 1.80 | 9.90 | 0.25 |
| M/PTBC6 | 1 | 20.0 | 22.9 | 0.30 | 1.94 | 11.3 | 0.28 |
| 2.5 | 22.1 | 25.1 | 0.34 | 2.20 | 12.7 | ||
| 4.5 | 20.7 | 23.6 | 0.38 | 2.38 | 14.0 | 0.46 | |
| 9 | 22.0 | 25.1 | 0.37 | 2.04 | 11.4 | ||
| M/PTBC8 | 1 | 16.3 | 18.6 | 0.26 | 1.84 | 12.0 | 0.32 |
| 2.5 | 22.8 | 26.2 | 0.29 | 2.21 | 12.8 | ||
| 4.5 | 22.0 | 25.0 | 0.35 | 2.19 | 13.0 | 0.35 | |
| 1 Barrer = 10−10 cm3 (STP) cm cm–2 cmHg–1 s–1 | |||||||
| Sample | Conc. (wt%) | αGas/N2 (-) | ||||
|---|---|---|---|---|---|---|
| He | H2 | O2 | CO2 | CH4 | ||
| Neat Matrimid® | 0 | 70.0 | 74.5 | 6.73 | 37.1 | 0.93 |
| M/PTBC6 | 1 | 67.4 | 77.3 | 6.57 | 38.2 | 0.93 |
| 2.5 | 65.9 | 75.0 | 6.56 | 37.8 | ||
| 4.5 | 54.8 | 62.6 | 6.31 | 37.2 | 1.22 | |
| 9 | 60.2 | 68.8 | 5.59 | 31.1 | ||
| M/PTBC8 | 1 | 63.4 | 72.4 | 7.13 | 46.7 | 1.24 |
| 2.5 | 77.7 | 89.0 | 7.50 | 43.5 | ||
| 4.5 | 62.7 | 71.2 | 6.22 | 37.0 | 1.00 | |
| Sample | Conc. (wt%) | He | H2 | N2 | O2 | CO2 |
|---|---|---|---|---|---|---|
| D (10−8 cm2/s) | ||||||
| NEAT Matrimid® | 0 | 676 | - | 0.263 | 1.73 | 0.368 |
| M/PTBC6 | 1 | 790 | 147 | 0.361 | 1.80 | 0.430 |
| 4.5 | 730 | 164 | 0.425 | 2.27 | 0.555 | |
| M/PTBC8 | 1 | 884 | 190 | 0.687 | 2.88 | 0.687 |
| 4.5 | 754 | - | 0.282 | 2.24 | 0.505 | |
| Membrane Code | Activation Energy for Diffusivity, ED (kJ/mol) | ||||
|---|---|---|---|---|---|
| H2 | He | CO2 | O2 | N2 | |
| Neat Matrimid® | 25.4 | 35.3 | 30.3 | 31.0 | 29.9 |
| M/PTBC6, 4.5 wt% | 19.6 | 17.6 | 29.0 | 30.1 | 34.3 |
| M/PTBC8, 4.5 wt% | 18.1 | 13.8 | 31.4 | 32.9 | 34.8 |
| Filler | Loading (wt%) | Permeability (Barrer) | CO2/N2 Ideal Selectivity | T (°C) | Feed Pressure (bar) | Ref. | |
|---|---|---|---|---|---|---|---|
| CO2 | N2 | ||||||
| NH2-UiO-66 | 0 | 8 | 0.28 | 29 | 25 | 1.4 | [29] |
| 23 | 23 | 0.66 | 35 | ||||
| NH2-UiO-67PA | 23 | 28 | 0.78 | 36 | |||
| NH2-UiO-68C10 | 23 | 22 | 0.81 | 27 | |||
| NH2-UiO-69SA | 23 | 19 | 0.63 | 30 | |||
| MOF-5 | 0 | 9 | 0.25 | 36 | 35 | 2 | [57] |
| 10 | 11.1 | 0.28 | 39.6 | ||||
| 20 | 13.8 | 0.4 | 34.5 | ||||
| 30 | 20.2 | 0.52 | 38.8 | ||||
| MCM-41 | 0 | 6 | 27 | 25 | 10 | [58] | |
| 10 | 7 | 27 | |||||
| 20 | 8 | 27 | |||||
| 30 | 10 | 26 | |||||
| SO3H-MCM 41 | 0 | 6 | 27 | 25 | 10 | [58] | |
| 10 | 6 | 30 | |||||
| 20 | 8 | 30 | |||||
| 30 | 10 | 31 | |||||
| Cu_MOF | 0 | 7.33 | 0.24 | 30.5 | 35 | 2.67 | [59] |
| 9 | 20.54 | 0.66 | 31.1 | ||||
| 17 | 38.27 | 1.33 | 28.8 | ||||
| 23 | 74.08 | 3.44 | 21.5 | ||||
| 29 | 233.9 | 19.89 | 11.7 | ||||
| 33 | 465 | 102.3 | 4.6 | ||||
| 45 | 3130 | 1204 | 2.6 | ||||
| MOP-18 | 0 | 7.3 | 0.24 | 30.4 | 35 | 2.67 | [59] |
| 23 | 9.4 | 0.34 | 27.6 | ||||
| 33 | 14 | 0.61 | 22.9 | ||||
| 45 | 15.6 | 0.6 | 26 | ||||
| Cu-BPY-HFS | 0 | 7.29 | 0.22 | 33.1 | 35 | 2 | [60] |
| 10 | 7.81 | 0.24 | 32.5 | ||||
| 20 | 9.88 | 0.31 | 31.8 | ||||
| 20 | 10.02 | 0.32 | 31.3 | ||||
| 30 | 10.36 | 0.31 | 33.4 | ||||
| 40 | 15.06 | 0.49 | 30.7 | ||||
| ZIF-8 | 0 | 8 | 0.3 | 26.7 | 35 | 2.7 | [59] |
| 20 | 9 | 0.3 | 30 | ||||
| 30 | 13 | 0.53 | 24.5 | ||||
| 40 | 25 | 1.05 | 23.8 | ||||
| 50 | 4 | 0.18 | 22.2 | ||||
| 60 | 7 | 0.44 | 15.9 | ||||
| UiO-66 | 0 | 6.9 | 0.23 | 29.8 | 35 | 4 | [56] |
| 10 | 7.8 | 0.26 | 29.4 | ||||
| Azo-UiO-66 | 5 | 7.1 | 0.19 | 35 | |||
| 10 | 10 | 0.26 | 37 | ||||
| 20 | 13 | 0.3 | 40 | ||||
| PTBC6 | 0 | 9.9 | 0.27 | 37.1 | 25 | 1 | This work |
| 1 | 11.3 | 0.30 | 38.2 | ||||
| 2.5 | 12.7 | 0.34 | 37.8 | ||||
| PTBC8 | 0 | 9.9 | 0.27 | 37.1 | 25 | 1 | This work |
| 1 | 12 | 0.26 | 46.7 | ||||
| 2.5 | 12.8 | 0.29 | 43.5 | ||||
Disclaimer/Publisher’s Note: The statements, opinions and data contained in all publications are solely those of the individual author(s) and contributor(s) and not of MDPI and/or the editor(s). MDPI and/or the editor(s) disclaim responsibility for any injury to people or property resulting from any ideas, methods, instructions or products referred to in the content. |
© 2024 by the authors. Licensee MDPI, Basel, Switzerland. This article is an open access article distributed under the terms and conditions of the Creative Commons Attribution (CC BY) license (https://creativecommons.org/licenses/by/4.0/).
Share and Cite
Vuono, D.; Clarizia, G.; Ferreri, L.; Consoli, G.M.L.; Zampino, D.C.; Scalzo, G.; Petralia, S.; Bernardo, P. Molecularly Mixed Composite Membranes for Gas Separation Based on Macrocycles Embedded in a Polyimide. Polymers 2024, 16, 460. https://doi.org/10.3390/polym16040460
Vuono D, Clarizia G, Ferreri L, Consoli GML, Zampino DC, Scalzo G, Petralia S, Bernardo P. Molecularly Mixed Composite Membranes for Gas Separation Based on Macrocycles Embedded in a Polyimide. Polymers. 2024; 16(4):460. https://doi.org/10.3390/polym16040460
Chicago/Turabian StyleVuono, Danilo, Gabriele Clarizia, Loredana Ferreri, Grazia Maria Letizia Consoli, Daniela Clotilde Zampino, Giuseppina Scalzo, Salvatore Petralia, and Paola Bernardo. 2024. "Molecularly Mixed Composite Membranes for Gas Separation Based on Macrocycles Embedded in a Polyimide" Polymers 16, no. 4: 460. https://doi.org/10.3390/polym16040460
APA StyleVuono, D., Clarizia, G., Ferreri, L., Consoli, G. M. L., Zampino, D. C., Scalzo, G., Petralia, S., & Bernardo, P. (2024). Molecularly Mixed Composite Membranes for Gas Separation Based on Macrocycles Embedded in a Polyimide. Polymers, 16(4), 460. https://doi.org/10.3390/polym16040460