Article

Performance of Full-Component Coal Gasification Fine Slag: High-Value Utilization as Reinforcing Material in Styrene-Butadiene Rubber (ESBR) for Replacing Carbon Black

1
Chemical Engineering College, Inner Mongolia University of Technology, Hohhot 010051, China
2
Key Laboratory of Resource Circulation, Universities of Inner Mongolia Autonomous Region, Hohhot 010051, China
3
ULANQAB Product Quality Measurement Inspection and Testing Centre, Ulanqab 012000, China
*
Author to whom correspondence should be addressed.
Polymers 2024, 16(4), 522; https://doi.org/10.3390/polym16040522
Submission received: 5 January 2024 / Revised: 25 January 2024 / Accepted: 31 January 2024 / Published: 15 February 2024
(This article belongs to the Section Polymer Composites and Nanocomposites)

Abstract

:
Ultrafine, highly active coal gasification slag (HCGS) was produced via a sustainable, green dry-ball-milling method. Coal gasification fine slag (CGS), a potential environmental pollutant, was used as a new source of rubber filler without pre-treatment, enabling waste utilisation. HCGS was added to styrene-butadiene rubber (ESBR) composites, and the effects of HCGS and the filler content on the mechanical and thermal stabilities of SBR were evaluated. The procedure conforms to important green metrics, requiring no solvent or additional reagent, or solvent-assistance for product collection. HCGS reduced the scorch time (t10) and curing time (t90) of the filled ESBR composites relative to those of pure SBR and improved the mechanical parameters. The tensile strength at 50 phr reached 10.91 MPa, and the tear strength at 90 phr reached 64.92 kN/m, corresponding to 9.4- and 3.92-fold increases relative to that of SBR filled with HCGS, respectively. HCGS exerted a reinforcing effect on ESBR, comparable to that of commercial carbon black (CB) N330. HCGS improves the binding between rubber molecules and filler particles and captures the rubber chain, thereby limiting its movement. HCGS is potentially applicable as a CB substitute in the rubber industry, with environmental and economic benefits in the disposal of CGS.

1. Introduction

Rubber and plastics are engineering materials used for various parts [1] such as seals, conveyor belts, and automotive industry and hydraulic industry parts. Carbon black is a crucial reinforcing filler owing to its strong interactions with polymers, large surface area, and enhanced surface activity [2]. However, carbon black is produced from non-renewable resources such as oil or natural gas, which consume large amounts of resources and causes high environmental pollution [3]. The search for alternative reinforcing polymers has attracted great attention, not only because of sustainable development and environmental conservation, but also for economic interests [4]. The chemical industry provides important materials and guarantees the energy supply for human, economic, and social activities, inevitably increasing solid-waste discharge. Coal gasification, an advanced and clean coal chemical technology, involves complex reactions in a gasifier. Under high temperatures and turbulent conditions, some fine particles from the crude gas are entrained into the gas-washing and -purification black-water treatment system, generating a large amount of solid waste [5], where coal gasification fine slag (CGS) is produced after filtration. Coal gasification slag comprises mineral particles (MPs) and unburned carbon particles (UCs). The MP glassy microspheres consist of crystalline (silicon, aluminium, calcium, and iron oxides) and vitreous (aluminosilicate) components. Most MPs tend to be smooth and spherical, and some spherical particles are attached to fine debris particles. Inorganic elements are uniformly distributed in the sphere. The molecular formula of UC is determined to be C178H73O46N1S1, with a molecular weight of 2991. UC has a high degree of aromaticity and abundant oxygen-containing functional groups. UC is loose and porous, which leads to wrapping and coverage with inorganic ash particles [6]. CGS is considered an industrial solid waste that is mainly piled up in slag yards or landfills, thereby wasting carbon resources. Furthermore, the hazardous trace elements in CGFS may pollute soil and groundwater, posing a potential health and environmental risk. Therefore, achieving large-scale, sustainable, efficient utilisation of CGS is urgent.
“Zero emissions” from coal gasification technologies is strongly supported in China. Maximizing coal gasification fine slag (CGS) utilisation and its conversion into high-value-added materials are important for resource utilisation and the harmless disposal of CGS. The utilisation of CGS generally requires copious acid or alkali, or high-temperature and high-pressure treatment. Zheng et al. [7] subjected CGS to low-temperature oxidation at 485 °C for varying residence times under an atmospheric environment, achieving different degrees of activation and yielding activated carbon as an adsorbent. Yang et al. prepared an X-type zeolite/carbon composite via alkaline leaching. Rui et al. [8] synthesised carbon/P-zeolite composites (CPZCs) by using NaOH as an activator for the synthesis of the zeolite, which was thoroughly mixed with CGFS at a certain mass ratio.
Currently, the utilisation rate of coal gasification slag is only 5%. Traditionally, slag is processed into new materials through acidic and alkaline treatments, generating substantial amounts of liquid waste, which is impractical for large-scale industrial use. This study introduces a novel technology for producing polymers from raw coal gasification fine slag, circumventing secondary pollution and affording substantial economic and environmental benefits.

2. Material and Methods

2.1. Materials

CGS was obtained from an HTL gasifier in the plant at Zhongtianhechuang Erdos Coal Industry Group Co., Ltd. (Erdos, Ordos City, Inner Mongolia Autonomous Region, China). Before the experiment, the ash was dried and dehydrated for 24 h (105 °C). The moisture content of the sample-receiving base was 62.3%, the bulk density of the air-dried base was 382.88 kg/m3, the unburned carbon reached 35.3%, and the zeta potential was −21.95. Commercial carbon black (CB; N330) and solid emulsion styrene-butadiene rubber (ESBR, Mw ~400, 000 g) were purchased from Hangzhou Zhongce Rubber Co., Ltd. (Hangzhou, China) and Shandong Gaoshike Industry and Trade Co., Ltd. (Qingdao, China), respectively. The accelerator (N-tert-buylbenzothiazole-2-sulfenamide (NS)), zinc oxide (ZnO), stearic acid (SA), and sulphur were obtained from Sinopharm Chemical Reagent Co., Ltd., (Tianjin, China).

2.2. Preparation of Ultrafine Coal Gasification Slag (HCGS)

Prior to use, CGS was dried in a high-temperature oven. The dried CGS was put into a polytetrafluoroethylene ball milling tank, after which 1.5 wt% sodium hexametaphosphate solution was added. Ball milling was carried out using the optimised parameters.

2.3. Preparation of HCGS/ESBR Composites

The resulting HCGS was directly added to ESBR in an open two-roll mill, similar to a conventional rubber compounding procedure. Other additives (ZnO, SA, NS, and S) were also mixed with SBR and HCGS to form unvulcanised rubber composites. The compounds were vulcanised in a standard mould at 163 °C for the optimal vulcanisation time (determined based on the vulcanisation behaviour). ZnO, SA, the accelerator (NS), and sulphur were sequentially incorporated into the mixture according to the compositions in Table 1.

2.4. Characterization

The residual carbon in the slags was measured from the loss on ignition; that is, the relative loss of mass after briefly heating the slags at 815 °C.
The sample (5 g) was weighed, added to 20 mL of ethanol, and then introduced into a laser particle size analyser (Dandong Baite BT800S, Dandong, China) with ultrasound assistance, using ethanol as the dispersant.
The X-ray diffraction (XRD) patterns of the prepared intercalation compounds were obtained using a D8 ADVANCE diffractometer (RIGAKU, Tokyo, Japan) with Cu-Kα radiation (λ = 1.540596 nm; 40 kV and 100 mA) in the range of 5–70° at 10°/min.
Fourier-transform infrared spectra (FT-IR; Magna-IR 750 Nicolet instrument Nigoli Instruments, USA) were recorded at a resolution of 4 cm−1 in the range of 4000–400 cm−1.
Gold was sprayed (for 30 s) onto a 2 mm slice cut from the tensile fracture interface, which was then treated with a conductive adhesive. Scanning electron microscopy (SEM) images of the composite samples were obtained by scanning 32 times using a Hitachi SU8020 (Hitachi, Japan) cold-field emission scanning electron microscope at an imaging voltage of 30 kV.
The prepared rubber composites were characterised using a (Talos F200X from FEI, Hillsboro, OR, USA) transmission electron microscope at an acceleration voltage of 200 kV. Sections with approximately 50 nm thickness were prepared via ultramicrotomy of the bulk-cured composites.
Raman spectra (Renishaw INVIA microscope laser Raman spectrometer UK) were acquired using a λ = 532 nm laser; the scanning range was 800–2000 cm−1.
The zeta potential (−200 mV to +200 mV) and particle size (0.6–12.3 μm) were measured using a Nanoplus3 analyser (Shanghai McMurray Tik Instrument Co., Ltd., Shanghai China) as well as dynamic light scattering (DLS) and electrophoretic light scattering (ELS) at 25 °C.
The processing performance of the rubber composites was tested in accordance with GB/T 9869-2014 [9] using an MDR-2000E non-rotor vulcanising machine (Electronics Wuxi Liyuan Chemical Equipment Co., Ltd., Wuxi, China) at 163 °C, using approximately 5 g of composite material.
The mechanical properties of the rubber composites were tested at a tensile speed of 500 mm/min (WDW-5C electrical tensile tester; Shanghai Hualong Test Instrument Co., Ltd., Shanghai, China) by following GB/T 528-2009 [10] standards.
Cross-linking density test: The cross-linking density of the samples was measured using the swelling method. A tensile sample (thickness: 2 mm, length: 2 cm, width: 1 cm) was weighed (m1). The sample was immersed in a toluene solution 100 times at a constant temperature for 72 h. The excess toluene on the surface of the sample was removed using filter paper; the sample mass was quickly recorded (m2). The crosslinking density was calculated using the Flory–Rehner equation [11,12].
The volume fraction (νr) of the rubber part in the swollen rubber was determined using Equation (1).
v r = m 1 / ρ r m 1 / ρ r + m 2 ρ s
Here, ρr is the density of SBR (0.915 g/cm3) and ρs is the density of toluene (0.866 g/cm3).
The rubber crosslinking density D was calculated using Equation (2).
D = ln ( 1 v r ) + v r + x v r 2 v s ( v r 3 v r / 2 )
Here, νs is the molar volume of toluene (106.87 cm3/mol) and x is the parameter of the interaction between the ESBR molecules and solvent molecules (x = 0.386).
Referring to the Flory–Rehner formula, the effective average molecular weight Mc of two crosslinking points is calculated using Equation (3):
M c = ρ r D
The swelling rate Q is calculated using Equation (4):
Q = ( m 2 m 1 ) / ρ s m 2 / ρ r × 100 %
Vulcanisation kinetics: The rate of a chemical reaction can generally be defined as the change in the number of reactants or products per unit of time and space. When other factors are fixed, the mathematical equation that quantitatively describes the influence of the conversion rate of various substances on the reaction rate is called the reaction rate equation. Because the conversion, as a function of time, corresponds to a first-order differential, the vulcanisation kinetics equation can be expressed as Equation (5) [13].
d α d t = K T f ( α )
Here, α is the conversion rate of the vulcanisation reaction. dα/dt represents the vulcanisation rate. T is the temperature. K is the kinetic constant at temperature T. f(α) is a function of the corresponding phenomenon model. The data obtained from the rotorless vulcaniser test can be used to define α according to Equation (6).
α = M t M 0 M h M 0
M0, Mt, and Mh are the torque values at times 0, t, and after the vulcanisation reaction, respectively.
As indicated by the vulcanisation curve, the vulcanisation reaction is an autocatalytic process, and the process equation can be expressed by Equation (7).
f ( α ) = α m ( 1 α ) n
Both m and n are the reaction orders. Therefore, this equation can be written as Equation (8).
d α d t = K T α m ( 1 α ) n

3. Results and Discussion

3.1. Physicochemical Characteristics of CGS

3.1.1. Basic Characteristics of CGS

The raw coal fed into the gasifier was a typical blended coal mix of bitumite and anthracite from China. Proximate and ultimate analyses of the CGS samples (Table 2) were performed according to Chinese National Standards GB/T 212–2008 [14], respectively [7]. The ash compositions are listed in Table 3. The gasification slags comprised SiO2, Al2O3, CaO, Fe2O3, SO3, MgO, TiO2, and Na2O. The high LOI was mainly due to incompletely reacted coal particles, whereas the high contents of Fe2O3 and CaO were primarily due to the addition of flux agents during the gasification process. The sample had a high ash content (66.88 wt%) and relatively high fixed-carbon content (29.45 wt%).

3.1.2. Morphology Analysis

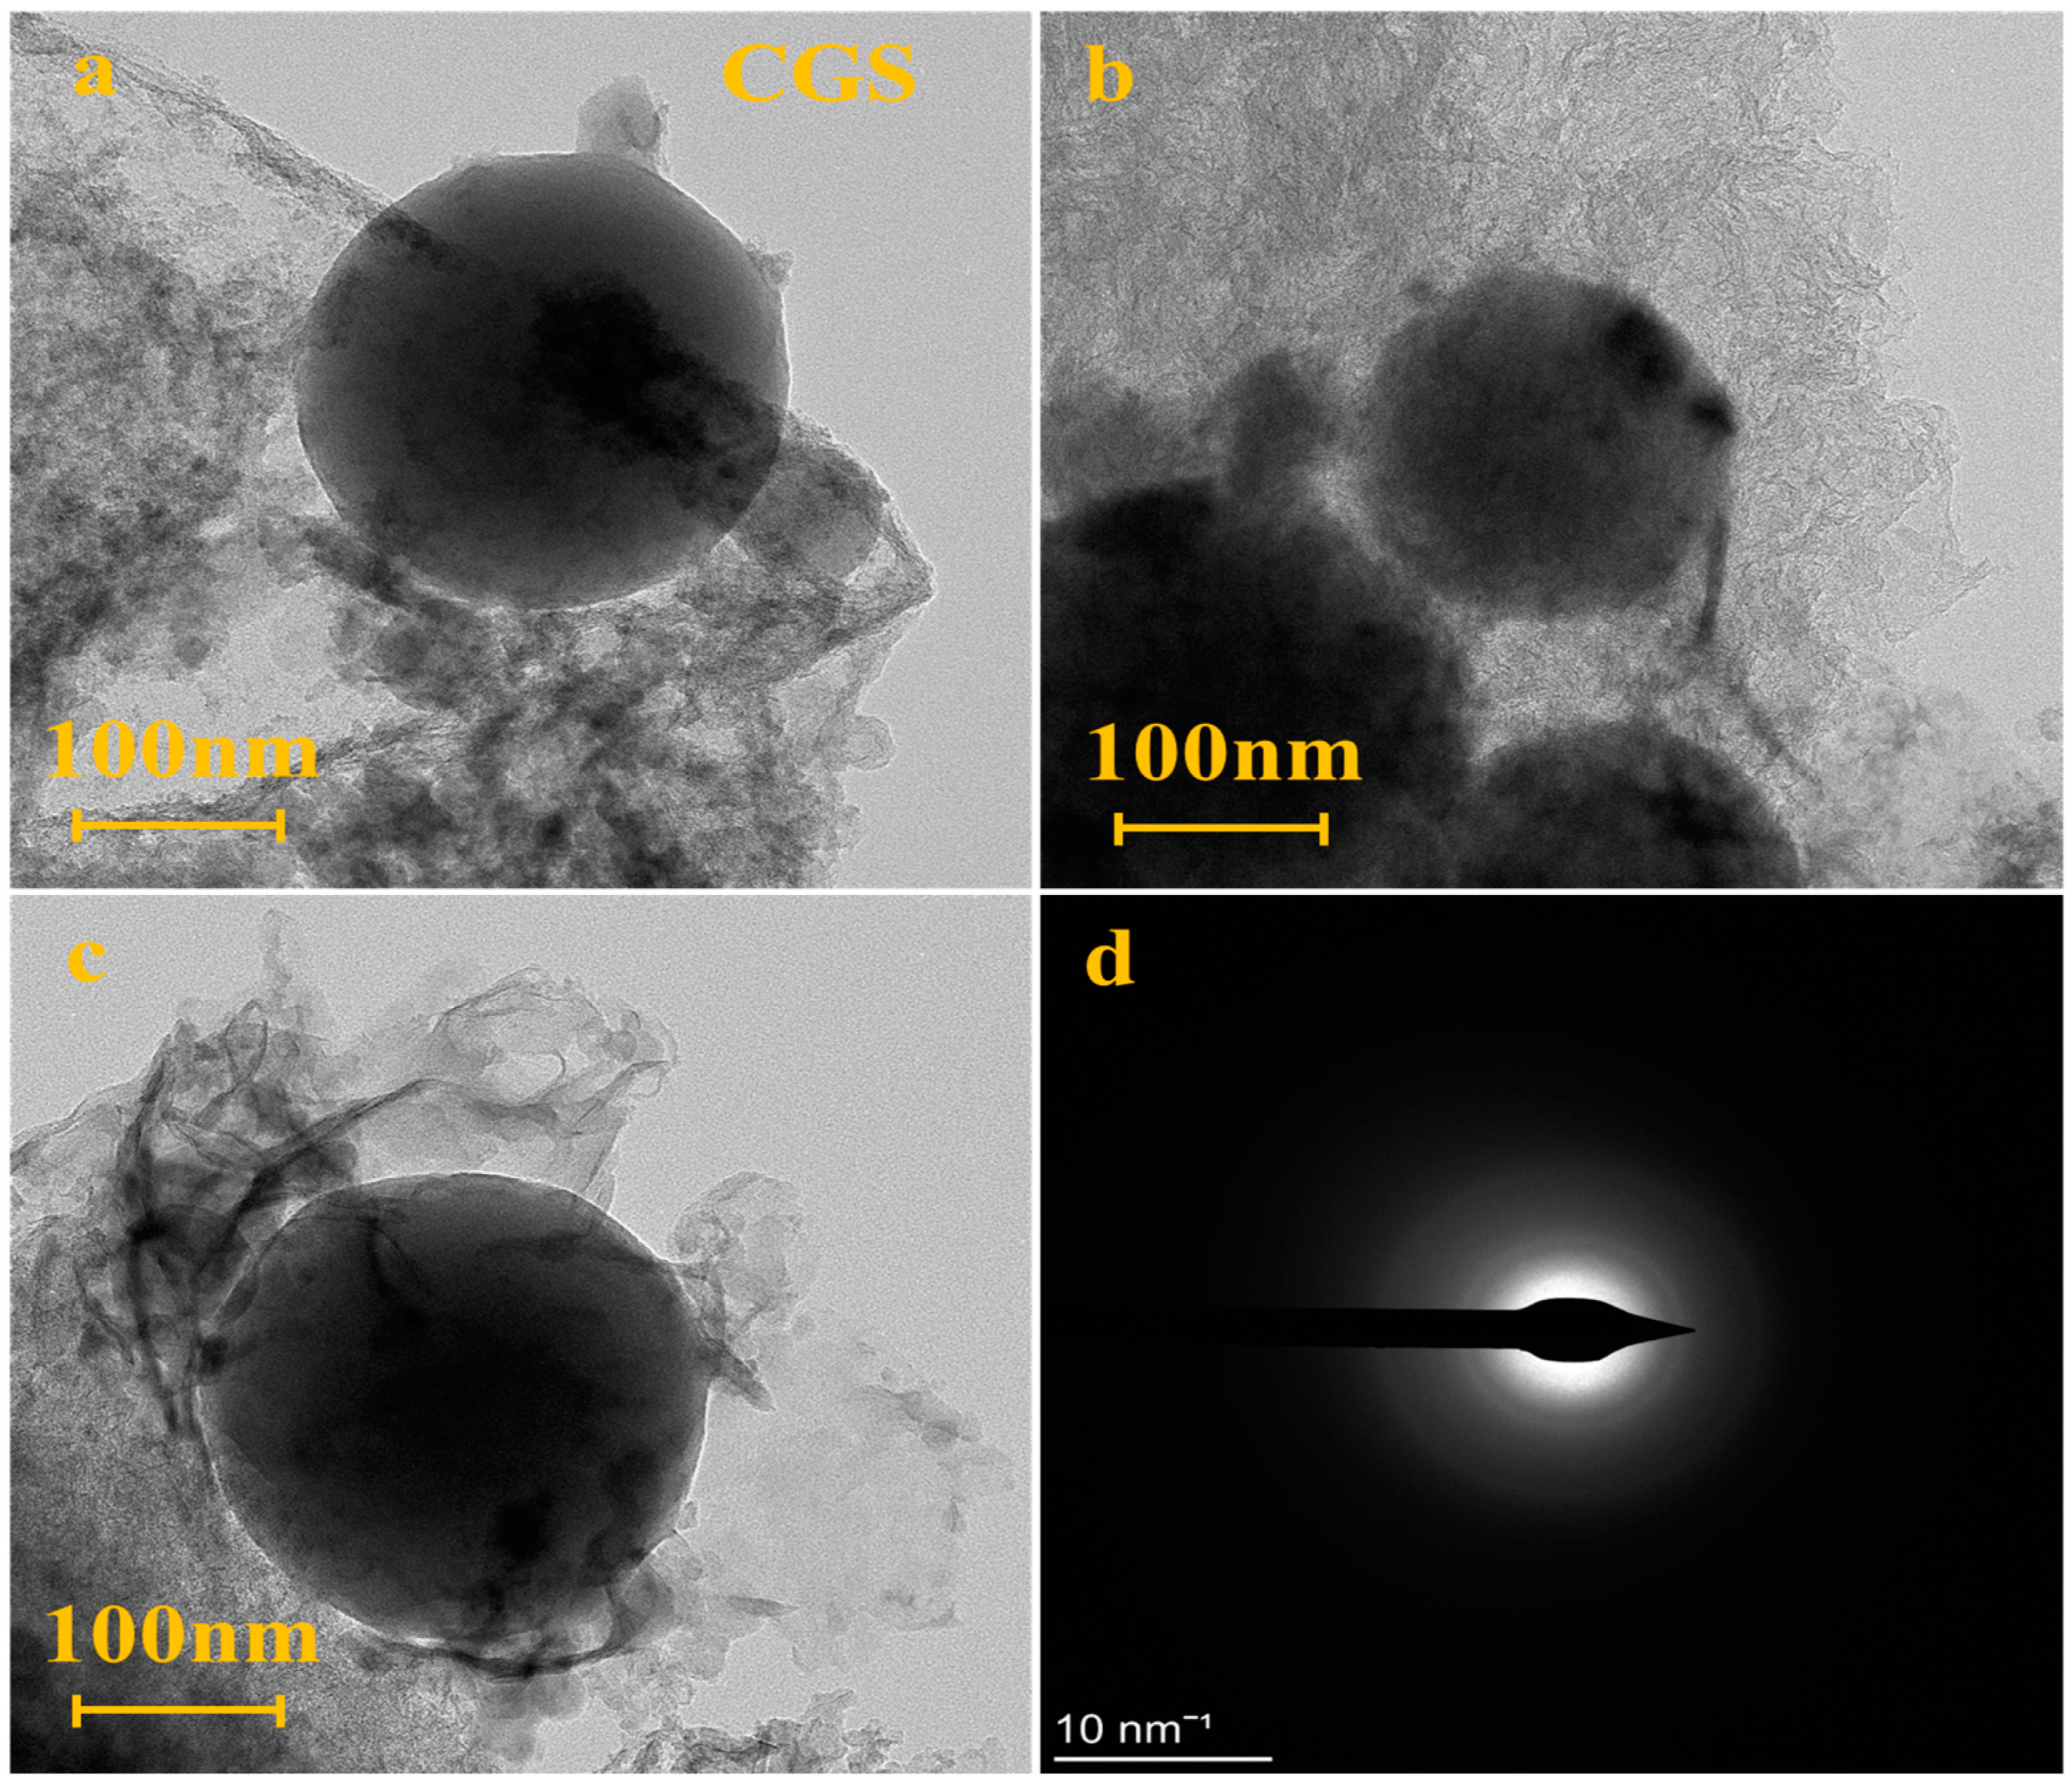
Figure 1 shows the SEM images of CGS. The micromorphology of CGS is a hybrid of massive porous residual carbon and spherical aluminosilicate slag. The residual carbon is the coal char produced by incompletely gasified syngas and the spherical slag is the fine high-temperature molten coal ash produced by syngas in the gasifier [13]. EDS analysis shows that the spherical particles were enriched with inorganic substances including Si, Al, and Fe. The irregular particles were enriched with unburned carbon. The transmission electron microscopy (TEM) diffraction ring of CGS (Figure 2) shows that the CGS phase is highly disordered with an amorphous structure.

3.2. Orthogonal Experiment for Ultra-Fine, Highly Active Coal Gasification Fine Slag

3.2.1. Design of Orthogonal Experiment

The orthogonal design method was used to more accurately and scientifically determine the optimal ball milling parameters by focusing on the material/ball ratio (CGS-Ball milling medium/zirconia ball mass ratio), ball milling time (h), and ball milling rotation using three factors and a five-level orthogonal design L25 (56). The orthogonal design levels are presented in Table 4.

3.2.2. Mechanical Ball Milling Activation and Refinement of Coal Gasification Fine Slag

Using the orthogonal design table, the design level of each factor in Table 5 was arranged in accordance with the orthogonal design table L25(56), and 25 matching schemes were created.

3.2.3. Range Analysis of Experimental Results

The orthogonal test indicated that each factor had a different degree of influence on the ball-milling efficiency. The primary and secondary factors were distinguished by calculating and analysing the range R [15,16]. A larger R indicates a more significant influence of the factors on the experimental indices, and vice versa, and can be used to determine the main influencing factor [17].
The calculated data for the milling mechanical activation refinement are shown in Table 6. The ball-milling speed had the greatest influence, followed by the ball-milling time. The ball-to-material ratio had a relatively small influence. During grinding, impact crushing plays a role in the initial stage of crushing the material particles. However, as the particles become finer, crushing and applying force become increasingly unsuitable for ultrafine crushing, particularly for micron-, submicron-, and even nanomaterial particles. The finer the particles, the fewer the cracks and defects, making them harder to grind. Additionally, the exposed, free, electrically charged bonds on the new surface of the particles promoted attraction and agglomeration of the vicinal particles.

3.2.4. Visual Analysis of Orthogonal Test Efficiency Curve for Mechanical Activation and Refinement by Ball Milling

By analysing the results and range of each group of experiments using the orthogonal test, the influence of each factor on the index can be observed. The results are typically intuitively expressed using a factor index diagram. The intuitive trend diagram of the efficiency curve is shown in Figure 3.
The level of each factor is presented on the abscissa, and the average index of each factor is plotted as the ordinate. The best level for each factor was selected to form a combination, corresponding to the optimal reaction conditions.
In the efficiency curve, (1) A1–A5, (2) B1–B5, and (3) C1–C5 represent the average values of each factor level for the medium/ball ratio, rotation speed, and ball milling time, respectively. As shown in diagram (1), when the ball-to-material ratio was A3 (1:4), D90 was the smallest, indicating that the ball-milling efficiency was the highest. When the speed reached B3 (500 rpm), the efficiency was the highest (Figure 2). Similarly, the efficiency was highest when C4 was 4 h (Figure 3). Therefore, the best combination of factors for dry ball-milling is as follows: medium/ball ratio of 1:4, rotation speed of 500 rpm, ball milling time of 4 h.

3.3. Effect of Mechanical Refinement by Ball Milling on Particle Size Distribution and Surface Properties of Highly Active Coal Gasification Slag

3.3.1. Changes in Particle Size Distribution and Surface Morphology before and after Ball Milling

The morphology of particles is closely related to numerous particle properties, which is an important aspect of particle characterisation, and directly determines the quality of ultrafine grinding product particles from the perspective of detection. The characterization focused on two aspects: particle size and morphology. Figure 4 shows the change in the particle size distribution of the CGS after mechanical activation by ball milling. After ball milling, the particle size distribution of CGS shifted to the small particle size area, and was centred at 0.5–10 μm, indicating a fractal state. This shows that the CGS is mainly divided into two types of particles: easily broken unburned carbon and breakage-resistant glass beads. However, from the grinding perspective, mixing these two types of materials with different susceptibilities to crushing is beneficial.
As shown in the SEM image (Figure 5), the HCGS particles had no sharp edges or corners after mechanical ball milling, indicative of simultaneous brittle and plastic crushing during mechanical crushing. At the same time, the particles do not easily scratch the rubber particles, which is conducive to reinforcement.

3.3.2. Changes in Surface Properties before and after Ball Milling

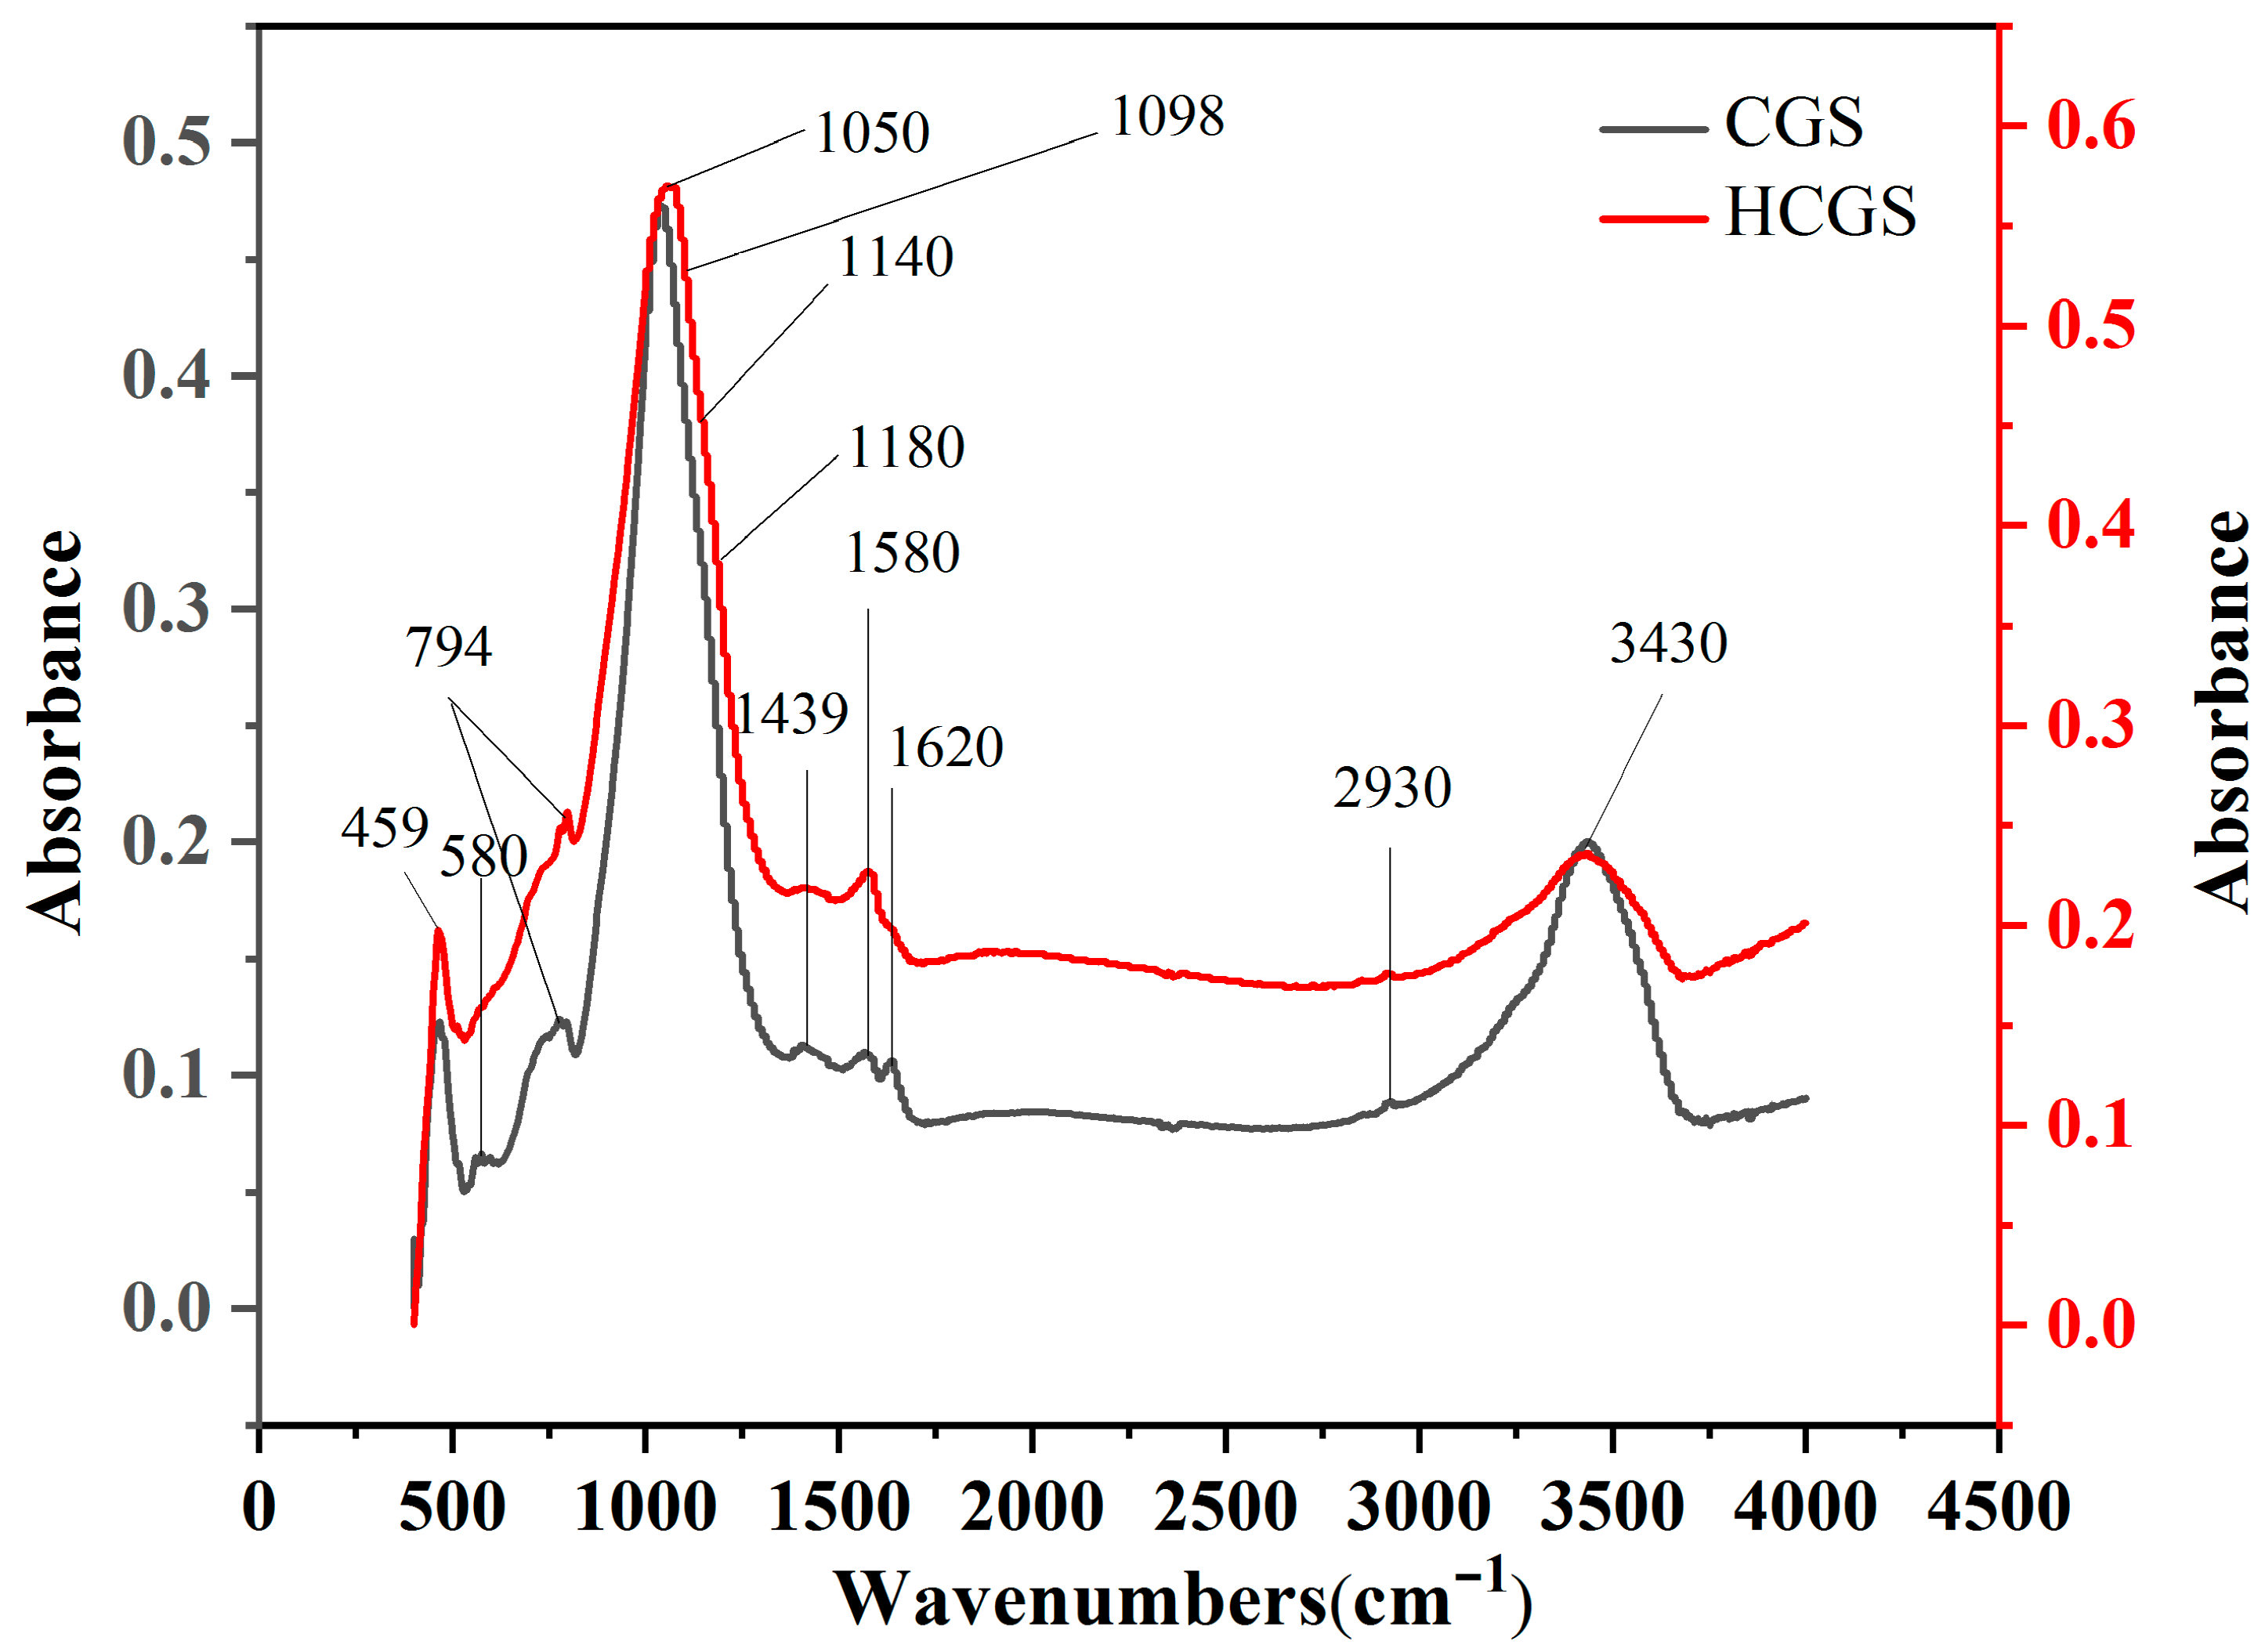
Figure 6 shows an infrared scanning image of the coal gasification fine slag after mechanical activation by ball milling. The peak area of the quantitative infrared spectra provides an estimate of the change in the content of each functional group after mechanical crushing. The assignments of the infrared peaks are listed in Table 7.

3.3.3. Changes in Carbon Morphology and Activity before and after Ball Milling

The first-order region in the FT-IR spectrum of carbonaceous materials usually shows peaks at 1620, 1500, 1350, 1200, and 1580 cm−1, termed D2, D3, D1, D4, and G peaks, respectively [23]. The G peak corresponds to the atomic vibrational mode of the ideal-state graphite lattice (E2g symmetry); D1 corresponds to the atomic vibrational model of the disordered graphite structure (graphene layer edges, A1g symmetry); and the D2 peak, which is usually accompanied by the D1 peak, corresponds to the atomic vibrational mode of the disordered graphite structure (surface graphene layers, E2g symmetry). The D3 peak corresponds to the sp2 bonds of amorphous carbon, including organic molecules and functional group fragments, and the D4 peak corresponds to the sp2–sp3 mixed bonds of microcrystalline edges or polyenes formed via C–C and C=C stretching vibrations, including organic molecules and functional group fragments. The D4 peak corresponds to mixed sp2–sp3 bonds at the edges of microcrystals or polyene structures formed via C–C and C=C stretching vibrations. Both the D3 and D4 peaks arise from reactive sites formed by defects in the carbon structure, which are also known as active sites [23,24,25,26]. The integrated area ratio of the peaks is often used to characterise the structural changes in a sample. The ID3+D4/ IALL ratio can be used to characterise the active sites of the residual carbon; the higher the ratio, the more active sites are present. However, the ID1/IG ratio can be used to characterise the degree of structural ordering of the residual carbon; the smaller the ID1/IG ratio, the higher the degree of structural ordering of the residual carbon [23,27]. The Raman peak fitting (Figure 7) and peak area results are presented in Table 8. ID1/IG decreased after mechanical activation by ball milling, indicating that the degree of order of HCGS increased after activation, possibly due to the dissociation of the graphite microcrystal layers under mechanical force. ID3+D4/ IALL increased after mechanical activation, indicating that mechanical ball milling increased the number of active sites in HCGS compared to that in CGS.

3.3.4. Stability of Dispersion System after Mechanical Activation by Ball Milling

Mechanical activation (ball milling) can increase the number of active sites in fine slag powder, reflected in the surface potential (zeta potential) of the resulting ultrafine powder, which is an important index for characterising the stability of powder dispersion systems [28]. Generally, a larger absolute zeta potential indicates greater electrostatic repulsion between the particles and thus better physical stability, that is, better dissolution or dispersion ability [29]. After mechanical activation by ball milling, the absolute zeta potential increased (Table 9), indicating that the electrostatic repulsion of HCGS increased relative to that of CGS, the dispersion was good, and agglomeration was difficult.

3.4. Characterization of HCGS-Filled ESBR Composites

3.4.1. Cure Behaviour

During vulcanisation, an essential step in rubber production, the modulus of the rubber rapidly increases [30]. Evaluation of the curing parameters of a rubber compound is necessary to determine the optimum curing time for the fabrication of moulded products, and provides insight into the reinforcement in the moulded compounds.
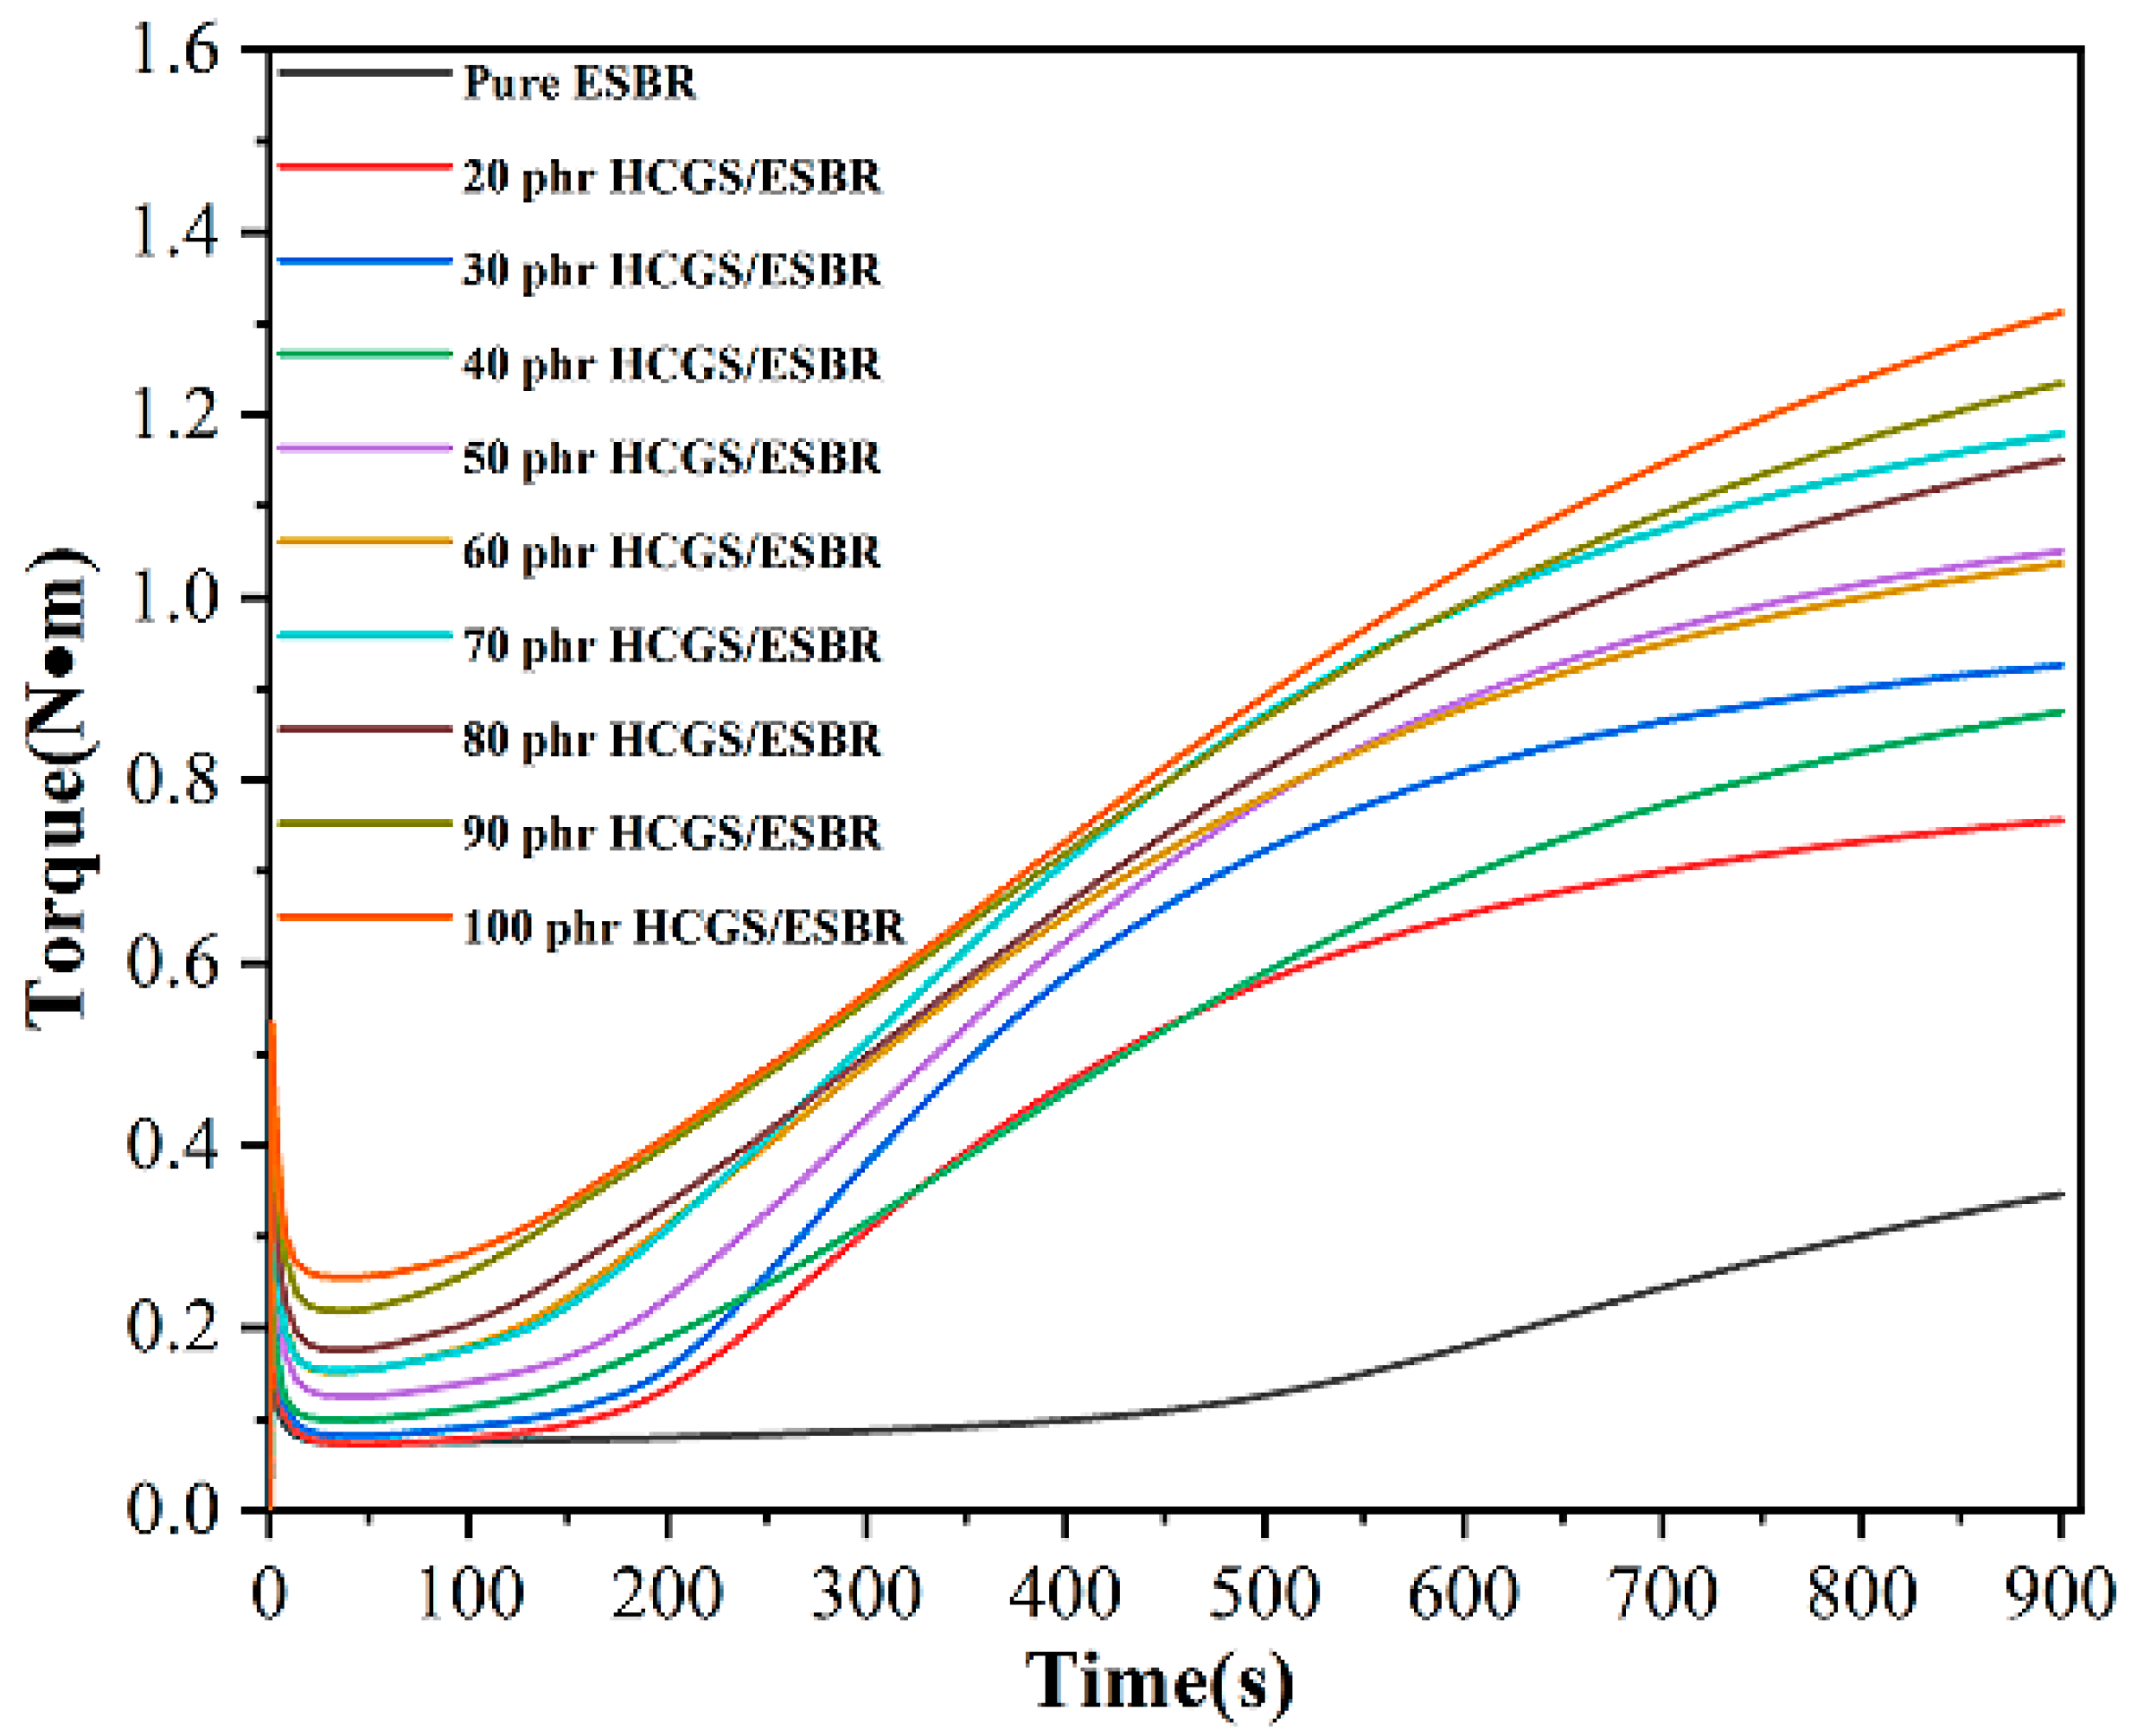
The curing characteristic curves of the ESBR compounds with different filler fractions at 163 °C are shown in Figure 8. With an increase in the amount of filler, the maximum torque of the composite gradually increased, indicating that the more filler added, the stronger the various network mechanisms inside the rubber.
Typical curing parameters, such as the highest torque (MH), lowest torque (ML), and time to achieve 90% of the highest torque (t90), also known as the optimum curing time, are summarised in Table 10. The MH value increased with the filler loading at higher filler contents. The impact of the HCGS content on the vulcanization properties of the HCGS/ESBR composite was also assessed. As the filler content increased, MH, ML, ΔM, and t90 all exhibited an overall trend of first decreasing and then increasing; t10 first increased and then decreased. T10 represents the safety performance of the rubber processing. T90 represents the rubber processing efficiency. At 30 phr, the processing safety was good and the processing efficiency was high.

3.4.2. Mechanical Properties of ESBR-Based HCGS

The static mechanical parameters of pure ESBR and the composites with different filling fractions of HCGS are listed in Table 11. The 100%, 300%, and 500% tensile stress, and tensile strength first increased and then decreased with an increase in the content of HCGS filler.
The maximum value of 10.91 MPa was reached when the filling amount was 50 phr, which was 84% higher than that of pure ESBR. With an increase in the filling time, the tear strength increased gradually. The maximum tear strength appeared at 64.92 kN/m, which is approximately 29% higher than that of pure ESBR. Owing to the improved interaction between the rubber molecules and HCGS particles, the overall static mechanical properties of the HCGS ESBR composites increased significantly with increasing HCGS content. An increase in the HCGS content can increase the number of HCGS particles per unit volume in the composite system, thus restricting the movement of the rubber chain. To a certain extent, this can be explained by the good mutual attraction between the organic components on the surface of HCGS and ESBR.

3.4.3. Microstructural Properties of HCGS/ESBR Composite

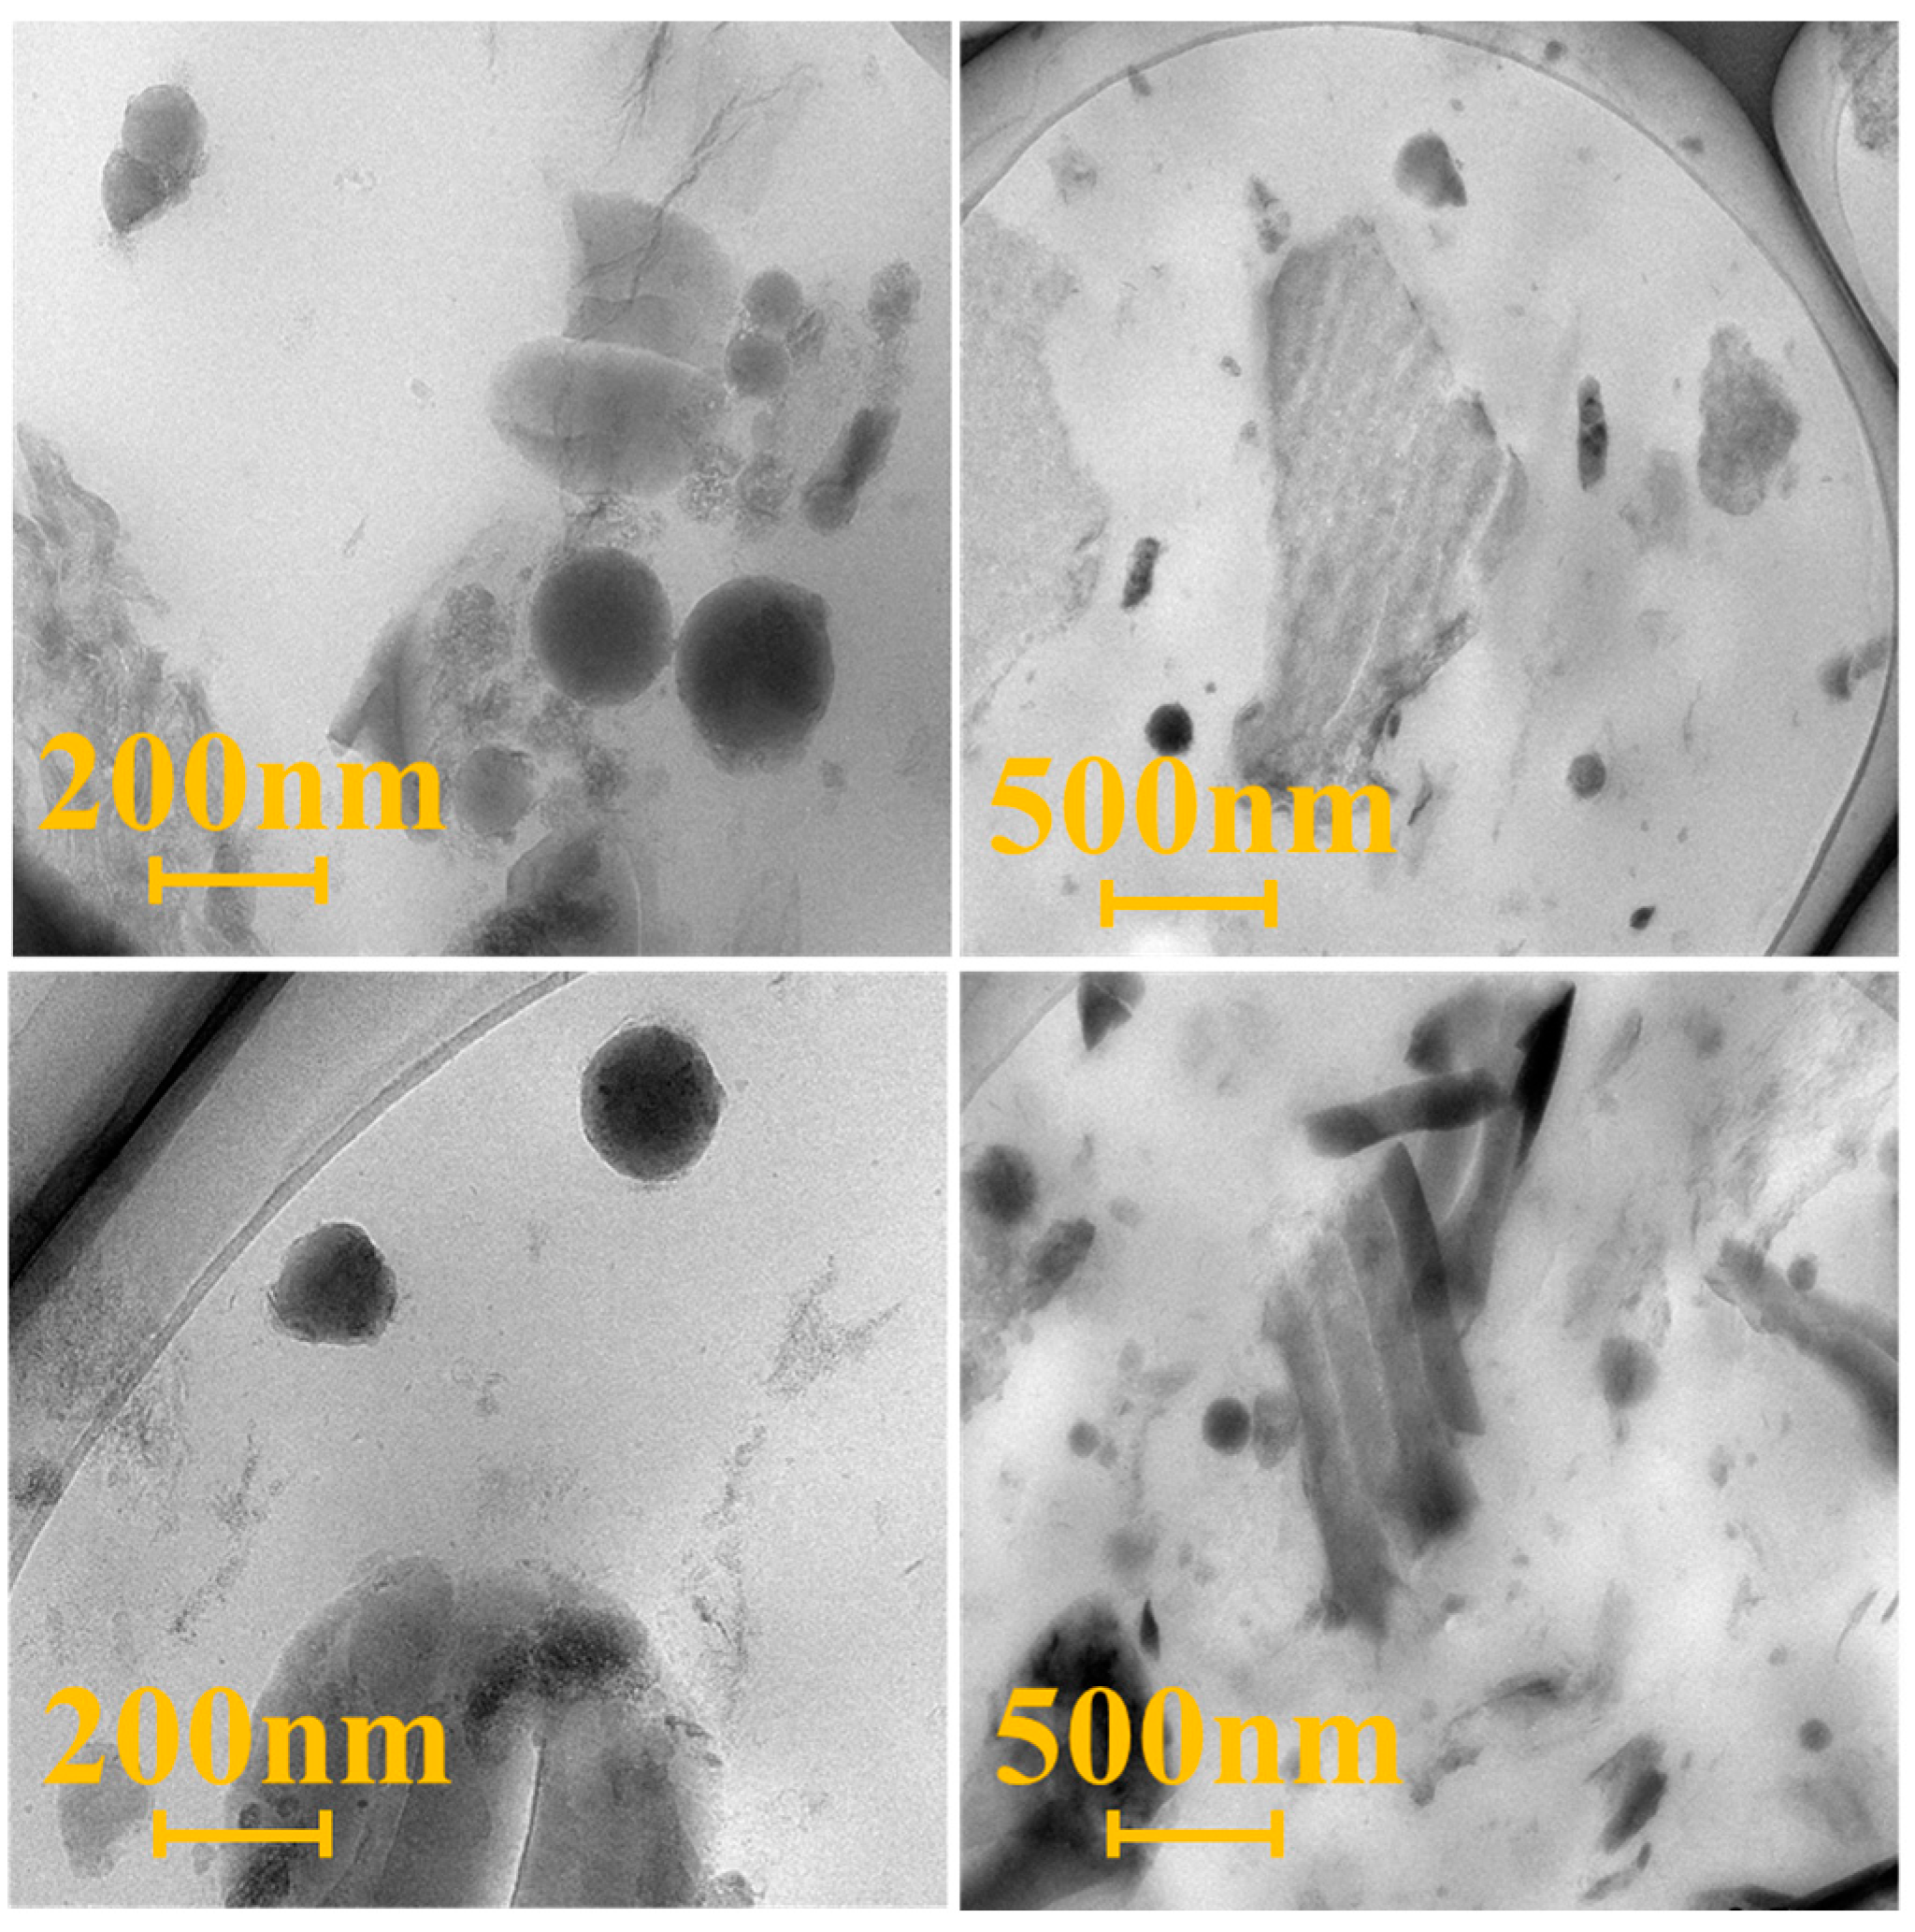
The HCGS/SBR composites were evaluated using SEM (Figure 9) and compared to the non-mechanically activated samples. Numerous rubber chains were enclosed between the HCGS particles, yielding an occluded rubber with restricted rubber chain movement. Additional rigidity was imparted to the rubber molecules, similar to that of the HCGS fillers. TEM images of the composite are presented in Figure 10, revealing that the HCGS particles are arranged in a disorderly manner without any evidence of significant agglomeration below an HCGS particle dose of 50 phr.

3.5. Processing Properties and Static Mechanical Properties of HCGS/CB/ESBR Composites with Different Proportions of Carbon Black

3.5.1. Processing Properties of HCGS/CB-Filled ESBR Composites

To improve the static mechanical properties of HCGS/ESBR, ESBR was filled with HCGS and carbon black, and the effects of different compounding ratios on the static mechanical properties of the rubber composites were investigated.
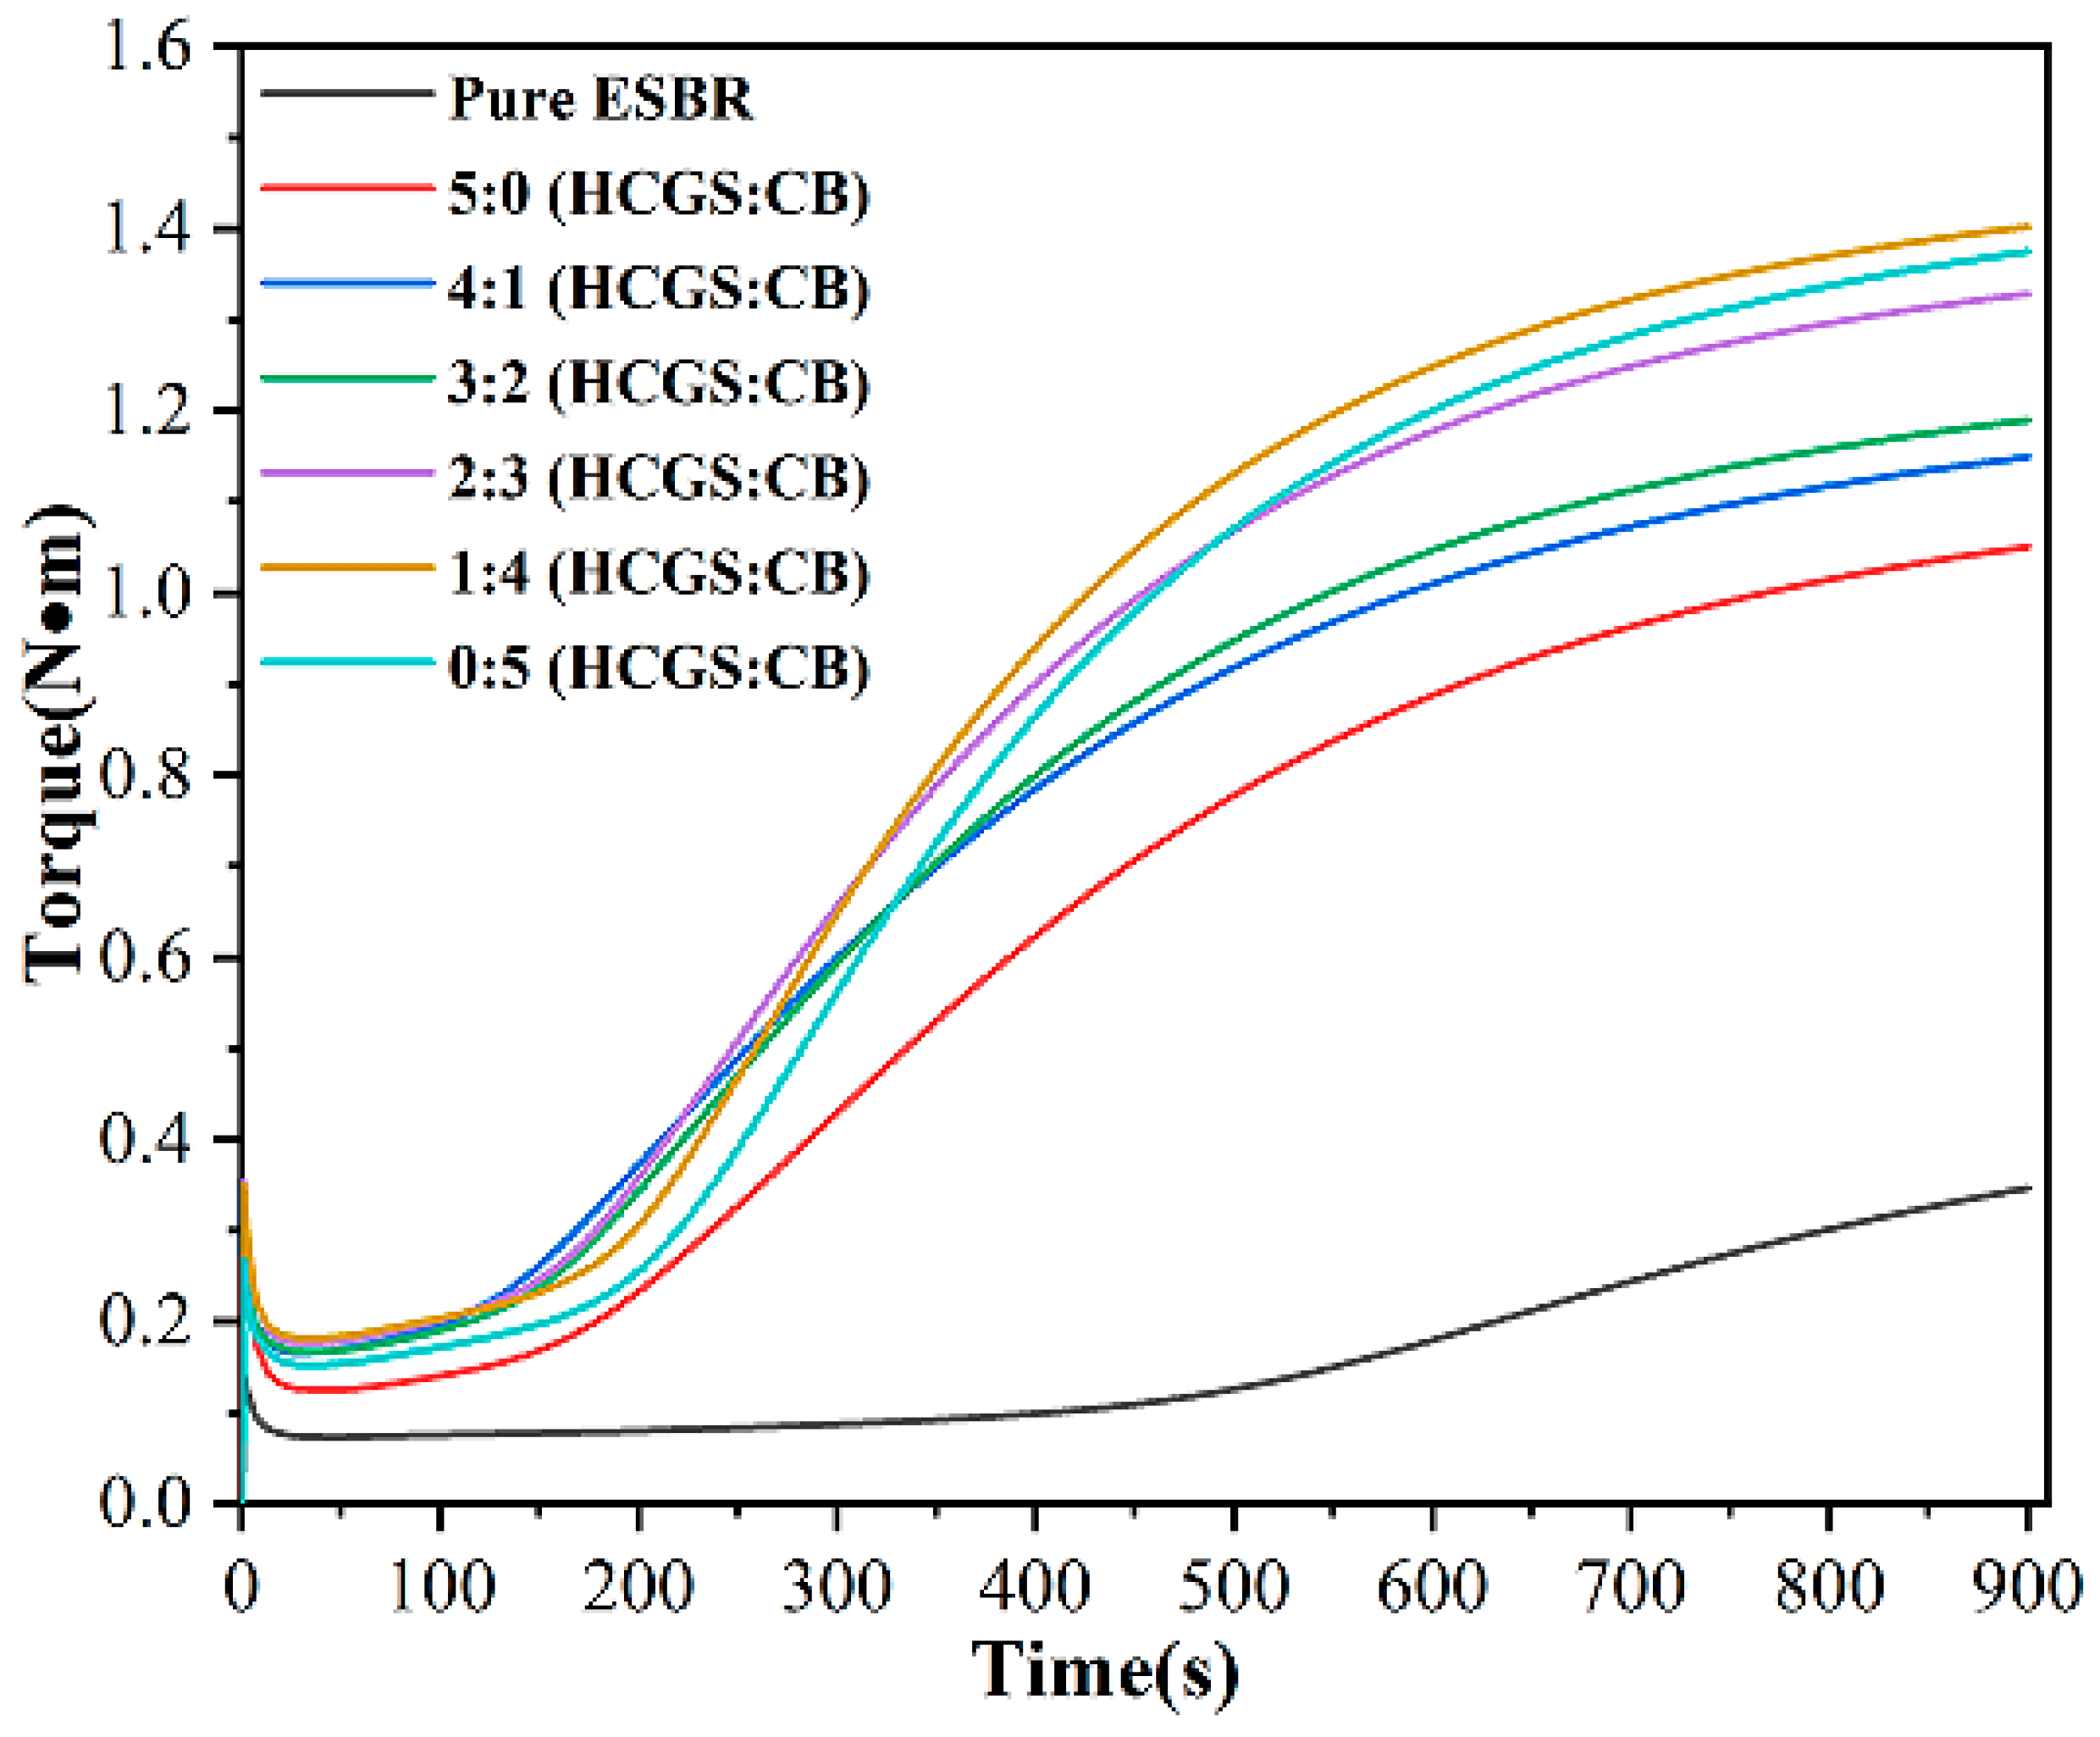
The vulcanisation curves of the ESBR composites with different compounding ratios of HCGS and carbon black are shown in Figure 11. The minimum torques of several composites were not significantly different. The maximum torque of the composites was highest when HCGS/CB = 1:4, indicating the strongest interaction of the filler and ESBR matrix at this ratio.
When HCGS/CB was 1:4, the maximum torque MH was 1.4, and the difference between the maximum and minimum torques was 1.22 (Table 12). t10 was 3.30, reaching a maximum, indicating that the processing safety was relatively good, and t90 was 10.38 min, reaching a minimum, indicating improved processing efficiency. In summary, the comprehensive performance improved after the combination of HCGS and CB, indicating that the combination of HCGS and CB was effective as a filler for reinforcing ESBR.

3.5.2. Mechanical Properties of HCGS/CB-Filled ESBR Composites

The mechanical properties of the ESBR composites prepared with different HCGS/CB ratios are shown in Table 13. At a compounding ratio of 1:4, the tensile and tear mechanical strengths reached a maximum of 12.78 MPa and 90.7 kN/m, respectively. The elongation at break also increased to a maximum of 1301.93. Comprehensive analysis of the mechanical properties showed that HCGS/CB can effectively improve the mechanical properties of ESBR composites.

3.6. Crosslinking Density and Average Molecular Weight of HCGS/CB Filled SBR Composites

The crosslinking density and average molecular weight can reveal the number of crosslinks and reflect the interaction of the rubber chains [31]. The crosslinking densities of the ESBR composites with HCGS and CB are listed in Table 14. The filled rubber composites had higher crosslinking densities than pure ESBR, indicating that the enhanced interactions between the HCGS/CB and rubber matrix increased the number of anchor points for the rubber molecules on the surface of HCGS/CB.
The SBR composite filled with HCGS/CB at 1:4 showed the maximum crosslinking density and minimum average molecular weight. Thus, the HCGS/CB composites showed better crosslinking properties, and ultrafine activated coal gasification fine slag may compound carbon black in the filled rubber system, providing more crosslinking sites. This result is consistent with the observed trends in the tensile strength of the SBR composites.

3.7. Vulcanization Kinetics of HCGS/CB Filled SBR Composites

Table 15 lists the fitting parameters from Equation (8); k is the rate constant. When HCGS/CB = 1:4, the vulcanization rate was the fastest and k reached the maximum. When the ultra-fine coal gasification fine slag replaced 10 parts of carbon black, the performance of the composite material was not affected and vulcanization was promoted.

4. Conclusions

Coal gasification is central to clean coal technology, and the volume of coal gasification slag is expected to increase in the future. Therefore, finding ways to utilise coal gasification slag is currently a top priority. This study is the first to propose the use of mechanically activated coal gasification fine slag as a filler to fill styrene-butadiene rubber-based composites, enabling the utilization of coal-based solid waste and preparation of polymer composites with an excellent performance. The best process route for mechanical activation using a planetary ball mill involved a ball-to-material ratio of 1:4, ball-milling time of 4 h, and ball-milling speed of 500 rpm, at which the ball-milling efficiency was optimal. Quantitative infrared, Raman peak fitting, and zeta potential analyses proved that mechanical activation increases the number of active sites and increases the dispersion of coal gasification fine slag. When HCGS is filled to 50 phr, the static mechanical properties were optimal, and the tensile and tear properties were improved to 10.91 MPa and 64.92 kN/m, respectively. When compounded with carbon black N330, the mechanical properties of the composites improved. When the ratio of HCGS and CB was 1:4, the performance was maximal, and the tensile and tear energy of the composite reached 12.78 MPa and 90.7 kN/m, respectively. The maximum cross-linking density was obtained when the HCGS/CB ratio was 1:4, which was synchronised with the change in the mechanical properties. While this study proposes a method for the large-scale utilisation of coal gasification slag, it is important to focus on future performance degradation mechanisms of rubber products during use.

Author Contributions

Conceptualization, Y.Z. (Yinmin Zhang) and X.F.; Software, Y.Z. (Yongfeng Zhang); Validation, F.L.; Formal analysis, Z.H.; Data curation, Y.W., F.L. and Z.H.; Writing—original draft, X.F.; Writing—review & editing, Y.Z. (Yinmin Zhang); Visualization, Y.W. All authors have read and agreed to the published version of the manuscript.

Funding

This research was funded by the Inner Mongolia Autonomous Region Science and Technology Plan (Nos. 2022YFHH0016 and 2023YFHH0089).

Institutional Review Board Statement

Not applicable.

Data Availability Statement

The data presented in this study are available on request from the corresponding author.

Acknowledgments

The authors express gratitude to the Science and Technology Bureau of Hohhot City in the Inner Mongolia Autonomous Region.

Conflicts of Interest

The funders had no role in the design of the study; in the collection, analyses, or interpretation of data; in the writing of the manuscript; or in the decision to publish the results.

References

  1. Xie, Y.; Jiang, J.; Islam, M.A. Elastomers and plastics for resisting erosion attack of abrasive/erosive slurries. Wear 2019, 426, 612–619. [Google Scholar] [CrossRef]
  2. Pöschl, M.; Vašina, M.; Zádrapa, P.; Měřínská, D.; Žaludek, M. Study of carbon black types in SBR Rubber: Mechanical and vibration damping properties. Materials 2020, 13, 2394. [Google Scholar] [CrossRef] [PubMed]
  3. Da Costa Labanca, A.R. Carbon black and hydrogen production process analysis. Int. J. Hydrog. Energy 2020, 45, 25698–25707. [Google Scholar] [CrossRef]
  4. Chen, S.; Chen, J.; Xu, K.; Pan, R.; Peng, Z.; Ma, L.; Wu, S. Effect of coal gangue/carbon black/multiwall carbon nanotubes hybrid fillers on the properties of natural rubber composites. Polym. Comp. 2016, 37, 3083–3092. [Google Scholar] [CrossRef]
  5. Chai, Z.; Liu, B.; Lv, P.; Bai, Y.; Wang, J.; Song, X.; Su, W.; Yu, G. Recycling of coal gasification fine slag as ultra-high capacity adsorbents for the removal of Rhodamine B dye: Graded synthesis method, kinetics and adsorption mechanism. Fuel 2023, 333, 126318. [Google Scholar] [CrossRef]
  6. Shi, D.; Zhang, J.; Hou, X.; Li, S.; Li, H.; He, F.; Zhu, G. Occurrence mode and molecular structure model of unburned carbon in coal gasification fine slags. Fuel 2022, 323, 124364. [Google Scholar] [CrossRef]
  7. Gao, Z.; Han, X.; Wang, G.; Liu, J.; Cui, X.; Zhang, C.; Wang, J. Preparation of activated carbon adsorption materials derived from coal gasification fine slag via low-temperature air activation. Gas Sci. Eng. 2023, 117, 205069. [Google Scholar] [CrossRef]
  8. Shu, R.; Bai, J.; Guo, F.; Mao, S.; Qiao, Q.; Dong, K.; Qian, L.; Bai, Y. Synthesis of carbon/P-zeolite composites from coal gasification fine slag and studies on adsorption characteristics for methylene blue. Korean J. Chem. Eng. 2023, 40, 1639–1649. [Google Scholar] [CrossRef]
  9. GB/T 9869-2014; Determination of Vulcanization Characteristics of Rubber Compounds-Disc Oscillating Vulcanization Apparatus Method. China Petroleum and Phemical Industry Association: Beijing, China, 2015.
  10. GB/T 528-2009; Determination of Tensile Stress-Strain Properties of Vulcanized Rubber or Thermoplastic Rubber. China Petroleum and Phemical Industry Association: Beijing, China, 2009.
  11. Xiao, K.; Zhang, Y.; Zhang, Y.; Gong, Y. Preparation of stearic acid/halloysite intercalation compound and their reinforcement for styrene butadiene rubber composite. J. Polym. Res. 2022, 29, 451. [Google Scholar] [CrossRef]
  12. Flory, P.J.; Rehner, J. Statistical mechanics of cross-linked polymer networks I. Rubberlike elasticity. J. Chem. Phys. 1943, 11, 521–526. [Google Scholar] [CrossRef]
  13. Wu, J.; Xing, W.; Huang, G.; Li, H.; Tang, M.; Wu, S.; Liu, Y. Vulcanization kinetics of graphene/natural rubber nanocomposites. Polymer 2013, 54, 3314–3323. [Google Scholar] [CrossRef]
  14. GB/T 212-2008; Industrial Analysis Method of Coal. China Coal Industry Association: Beijing, China, 2008.
  15. Wu, R.; Lv, P.; Wang, J.; Bai, Y.; Wei, J.; Song, X.; Su, W.; Yu, G. Catalytic upgrading of cow manure pyrolysis vapors over zeolite/carbon composites prepared from coal gasification fine slag: High quality bio-oil obtaining and mechanism investigation. Fuel 2023, 339, 126941. [Google Scholar] [CrossRef]
  16. Yin, Z.; Peng, Y.; Zhu, Z.; Yu, Z.; Li, T.; Zhao, L.; Xu, J. Experimental study of charge dynamics in a laboratory-scale ball mill. Proc. Inst. Mech. Eng. Part C J. Mech. Eng. Sci. 2017, 232, 3491–3499. [Google Scholar] [CrossRef]
  17. Zhou, Z.; Li, F.; Yang, H.; Gao, W.; Miao, L. Orthogonal experimental study of soil–rock mixtures under the freeze–thaw cycle environment. Int. J. Pave. Eng. 2019, 22, 1376–1388. [Google Scholar] [CrossRef]
  18. Ke, C.; Li, X.; Jiang, J. Dynamic response analysis of RC frame against progressive collapse based on orthogonal test. Appl. Sci. 2023, 13, 4317. [Google Scholar] [CrossRef]
  19. Shu, R.; Qiao, Q.; Guo, F.; Dong, K.; Liu, S.; Xu, L.; Bai, Y.; Zhou, N. Controlled design of Na-P1 zeolite/porous carbon composites from coal gasification fine slag for high-performance adsorbent. Environ. Res. 2023, 217, 114912. [Google Scholar] [CrossRef] [PubMed]
  20. Xue, Z.; Zhao, P.; Yang, C.; Dong, L.; Bao, W.; Wang, J.; Fan, P. Capture performance and quantum chemistry simulation of composite collectors for coal gasification coarse slag. Energy Sources Part A Recovery Util. Environ. Eff. 2023, 45, 1807–1821. [Google Scholar] [CrossRef]
  21. Li, M.; Li, P.; Wu, J.; Teng, D.; Zhou, G.; Cao, Y.; Fan, G. Directly application of waste cooking oil on the flotation of coal gasification fine slag. Fuel 2023, 331, 125666. [Google Scholar] [CrossRef]
  22. Zhang, J.; Yang, H.; Shen, G.; Cheng, P.; Zhang, J.; Guo, S. Reduction of graphene oxide via L-ascorbic acid. Chem. Commun. 2010, 46, 1112–1114. [Google Scholar] [CrossRef]
  23. Zhang, X.; Zhang, Y.; He, J.; Li, H.; Bai, Y.; Gao, S. ZnFe2O4 nanospheres decorated residual carbon from coal gasification fine slag as an ultra-thin microwave absorber. Fuel 2023, 331, 125811. [Google Scholar] [CrossRef]
  24. Shen, Y.; Lu, G.; Bai, Y.; Lv, P.; Yong, Z.; Wang, J.; Song, X.; Yan, L.; Yu, G. Structural features of residue carbon formed by gasification of different coal macerals. Fuel 2022, 320, 123918. [Google Scholar] [CrossRef]
  25. Potgieter-Vermaak, S.; Maledi, N.; Wagner, N.; Van Heerden, J.H.P.; Van Grieken, R.; Potgieter, J.H. Raman spectroscopy for the analysis of coal: A review. J. Raman Spectros. 2011, 42, 123–129. [Google Scholar] [CrossRef]
  26. Sadezky, A.; Muckenhuber, H.; Grothe, H.; Niessner, R.; Pöschl, U. Raman microspectroscopy of soot and related carbonaceous materials: Spectral analysis and structural information. Carbon 2005, 43, 1731–1742. [Google Scholar] [CrossRef]
  27. Reich, S.; Thomsen, C. Raman spectroscopy of graphite. Philos. Trans. A Math. Phys. Eng. Sci. 2004, 362, 2271–2288. [Google Scholar] [CrossRef] [PubMed]
  28. LÜ, D.-P.; Bai, Y.-H.; Wang, J.-F.; Song, X.-D.; Su, W.-G.; Yu, G.-S.; Zhu, H.; Tang, G.-J. Structural features and combustion reactivity of residual carbon in fine slag from entrained-flow gasification. J. Fuel Chem. Technol. 2021, 49, 129–136. [Google Scholar] [CrossRef]
  29. Predota, M.; Machesky, M.L.; Wesolowski, D.J. Molecular origins of the zeta potential. Langmuir 2016, 32, 10189–10198. [Google Scholar] [CrossRef] [PubMed]
  30. Manciu, M.; Manciu, F.S.; Ruckenstein, E. On the surface tension and zeta potential of electrolyte solutions. Adv. Colloid. Interface Sci. 2017, 244, 90–99. [Google Scholar] [CrossRef] [PubMed]
  31. Wang, W.; Zhang, Y.; Zhang, Y.; Sun, J. Vulcanization, static mechanical properties, and thermal stability of activated calcium silicate/styrene-butadiene rubber composites prepared via a latex compounding method. J. Appl. Polym. Sci. 2021, 139, 51462. [Google Scholar] [CrossRef]
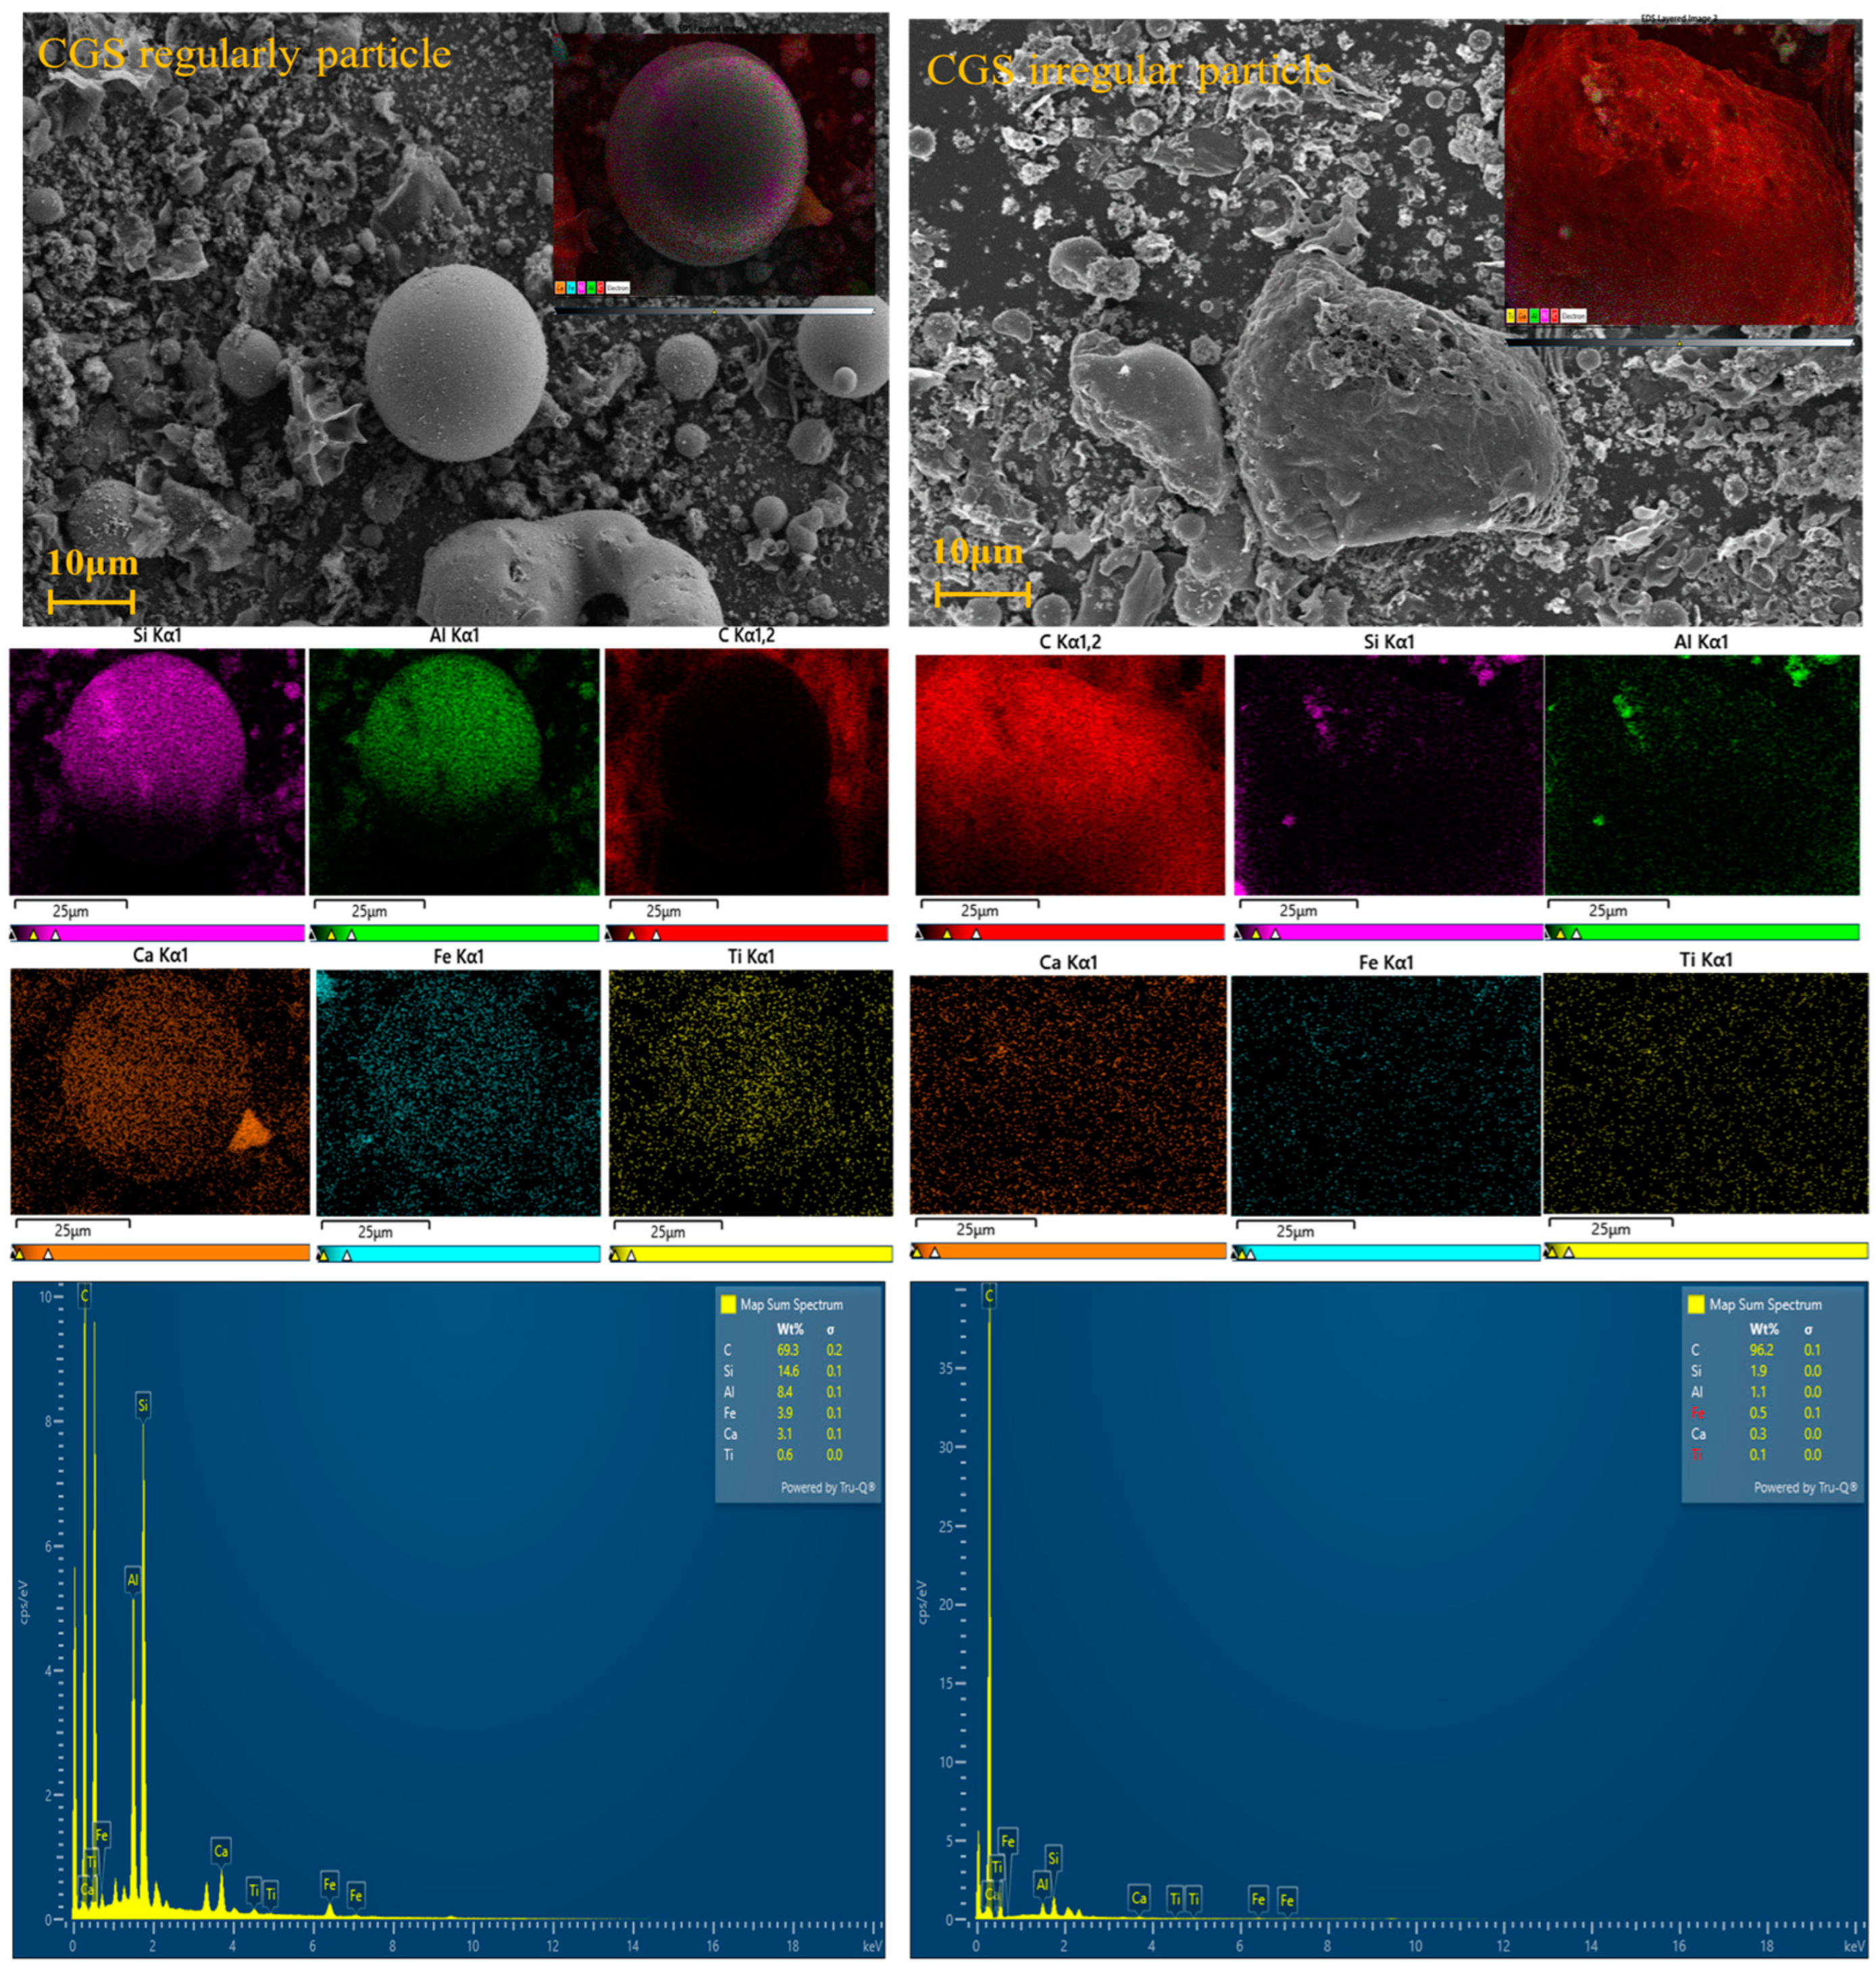
Figure 1. SEM image and EDS energy spectrum of CGS.
Polymers 16 00522 g001
Figure 2. TEM images(ac) and diffraction rings(d) of CGS.
Polymers 16 00522 g002
Figure 3. Intuitive analysis of orthogonal experiment efficiency curve.
Polymers 16 00522 g003
Figure 4. Particle size distribution before and after mechanical activation by ball milling.
Polymers 16 00522 g004
Figure 5. SEM images before and after mechanical activation by ball milling treatment.
Polymers 16 00522 g005
Figure 6. FTIR scanning spectra of CGS and HCGS.
Polymers 16 00522 g006
Figure 7. Raman spectra and fitting peaks of CGS and HCGS.
Polymers 16 00522 g007
Figure 8. Vulcanization curves of ESBR compounds prepared with different filler contents at 163 °C.
Polymers 16 00522 g008
Figure 9. SEM images of HCGS/ESBR composites: (ac) CGS/ESBR composite; (ef) HCGS/ESBR composite.
Polymers 16 00522 g009
Figure 10. TEM images of HCGS/ESBR composites.
Polymers 16 00522 g010
Figure 11. Vulcanization curve of ESBR composite prepared with HCGS and CB at 163 °C.
Polymers 16 00522 g011
Table 1. Composition of HCGS/ESBR composites.
ComponentESBRHCGS/ESBRZnOSANSSulfur
Content/phr100.00Variable3.001.001.001.75
Table 2. Proximate analyses of coal gasification fine slag.
Sample (mm)Mad%Ad%Vdaf%Fcad%
Raw CGFS0.7566.8810.429.45
Table 3. Chemical compositions of ash from coal gasification fine slag.
SampleNa2OMgOAl2O3SiO2SO3CaOTiO2Fe2O3LOI815/%
CGFS0.231.4519.647.054.906.771.2511.6535.3
Table 4. Factors and levels of orthogonal experiment.
FactorsMaterial:Ball RatioBall Milling Time (h)Rotation (rpm)
Value level1:21300
1:32400
1:43500
1:54600
1:65700
Table 5. Results of orthogonal array experiment.
Experimental SchemeExperimental Results
Serial NumberA Material/Ball RatioB (rpm) RotationC (h) Ball Milling TimeD10D50D90
11:230012.3815.2545.3
21:240021.538.5622.86
31:250030.934.2513.34
41:260040.943.4613.31
51:270050.892.9916.02
61:340011.429.3925.43
71:350020.974.4815.65
81:360030.893.0213.32
91:370040.832.3719.28
101:330051.075.6032.55
111:450011.015.3415.12
121:460020.923.2714.49
131:470030.822.2710.59
141:430040.914.3715.05
151:440050.892.9813.64
161:560010.894.0416.34
171:570020.923.4438.77
181:530030.934.5015.47
191:540040.852.5110.73
201:550050.846.6517.51
211:670010.904.3222.88
221:630021.033.9921.73
231:640030.872.8918.26
241:650040.7927.1
251:660050.761.7712.35
Table 6. Range analysis of orthogonal experiment.
D90K122.1726.0225.01
K221.2518.1822.7
K313.7813.7414.20
K419.7613.9613.09
K516.4621.5118.41
Poor R 8.3912.2811.92
Table 7. Assignment of absorption peaks in FTIR scanning spectra of CGS and HCGS.
Wavenumber/cm−1Peak Assignment
459Al-O bending vibration peak [18]
580Vibration of C–S–C skeleton [18]
794Si–O–Si [19]
1050C–O–C [19]
1098Stretching vibration of Si–O–Al [20]
1140C–O from alkoxides in RC [21]
1180Characteristic vibration peak of C–S [18]
1439C=O bond stretching vibration peak [7]
1580Characteristic C–C peak of the benzene skeleton [18]
1620C=C bond stretching vibration peak [20]
2930Vibration of C–H [22]
3430OH bonds [22]
Table 8. Area ratio of Raman bands.
Peak TypeArea (CGS)Area (HCGS)
D438,947.671132,370.39397
D1328,489.60646152,371.04697
D347,477.8147429,243.27679
G161,914.2112186,728.18662
D22192.33696971.39049
ID1/G2.0291.757
ID3+D4/IALL0.14930.2003
Table 9. Zeta potential before and after mechanical activation (ball milling).
SampleZeta Potential
Raw CGS−21.95
HCGS−26.05
Table 10. Vulcanization parameters of ESBR compounds prepared with different filler contents at 163 °C.
Vulcanization Index (phr)ML (dN·m)MH (dN·m)MH-ML (dN·m)t10 (min)t90 (min)
Pure ESBR0.070.350.286.4913.56
200.070.760.693.2611.1
300.080.930.853.2710.52
400.100.870.773.0912.19
500.121.050.933.111.32
600.151.040.892.3611.39
700.151.181.032.511.43
800.181.150.972.3812.18
900.221.231.032.2512.28
1000.261.311.052.4612.43
Table 11. Mechanical parameters of ESBR composites with different HCGS filling fractions.
Different FillersTensile
Strength/MPa
Tear
Strength/(KN/m)
Modulus/MPaElongation at Break/%
100%300%500%
Pure ESBR1.16 ± 0.13316.57 ± 2.4400.43 ± 0.0160.56 ± 0.0050.60 ± 0.008786.72 ± 139.7
20 phr 6.09 ± 1.47134 ± 3.3470.85 ± 0.0191.35 ± 0.0132.06 ± 0.064915.54 ± 82.35
30 phr8 ± 0.57842.25 ± 8.3130.94 ± 0.0271.56 ± 0.0612.49 ± 0.179985.12 ± 54.6
40 phr10.48 ± 0.97347.41 ± 5.8970.98 ± 0.0411.51 ± 0.0972.39 ± 0.271337.18 ± 148.4
50 phr 10.91 ± 1.87749.01 ± 6.3411.17 ± 0.0712.05 ± 0.1853.48 ± 0.4831023.60 ± 144.3
60 phr 9.96 ± 0.37257.04 ± 3.3071.22 ± 0.031.99 ± 0.0693.28 ± 0.1871160.44 ± 63.05
70 phr 9.97 ± 0.2558.21 ± 2.9811.4 ± 0.0782.48 ± 0.2514.28 ± 0.593991.52 ± 132.7
80 phr 6.96 ± 0.20662.34 ± 2.8911.45 ± 0.0792.33 ± 0.1633.61 ± 0.235999.22 ± 65.3
90 phr 7.87 ± 0.27664.92 ± 2.8961.71 ± 0.0812.86 ± 0.114.54 ± 0.201907.16 ± 17.24
100 phr 6.53 ± 0.39263.02 ± 2.2721.83 ± 0.0633.03 ± 0.1474.48 ± 0.305818.10 ± 66.21
Table 12. Vulcanization parameters of ESBR composite with HCGS and CB prepared at 163 °C.
Vulcanization IndexML (dN·m)MH (dN·m)MH-ML (dN·m)t10 (min)t90 (min)
pure SBR0.070.350.286.4913.56
HCGS:CB 5:00.181.050.872.5412
HCGS:CB 4:10.171.150.982.3211.01
HCGS:CB 3:20.171.191.022.4910.57
HCGS:CB 2:30.181.331.152.5510.45
HCGS:CB 1:40.181.401.223.3010.38
HCGS:CB 0:50.151.371.223.3010.58
Table 13. Mechanical properties of ESBR composites prepared with HCGS and CB.
Different FillersTensile
Strength/MPa
Tear
Strength/(KN/m)
Modulus/MPaElongation at Break/%
100%300%500%
Pure SBR1.16 ± 0.13316.57 ± 2.4400.43 ± 0.0160.56 ± 0.0050.60 ± 0.008782.72 ± 139.7
HCGS:CB 5:010.91 ± 1.87749.01 ± 6.3411.17 ± 0.0712.05 ± 0.1853.48 ± 0.4831023.60 ± 144.3
HCGS:CB 4:110.89 ± 0.29764.67 ± 12.820.96 ± 0.2052.11 ± 0.2763.95 ± 0.2661259.35 ± 70.65
HCGS:CB 3:211.12 ± 0.7769.74 ± 10.560.96 ± 0.0971.87 ± 0.1093.4 ± 0.2751286.32 ± 84.89
HCGS:CB 2:311.89 ± 0.44282.91 ± 6.2991.37 ± 0.1212.58 ± 0.1354.44 ± 0.1591285.45 ± 44.82
HCGS:CB 1:412.78 ± 0.4290.70 ± 9.9961.14 ± 0.0122.42 ± 0.1114.36 ± 0.2591301.93 ± 88.55
HCGS:CB 0:512.52 ± 0.00789.55 ± 6.5831.15 ± 0.0072.1 ± 0.1063.79 ± 0.2471289.23 ± 39.28
Table 14. Crosslinking density of ESBR composites with HCGS and CB.
Type of ModifierCrosslinking Density (×10−4 mol/cm3)Swelling Ratio (%)Available Average Molecular Weight (×10−4 g/mol)
Pure SBR0.333096.45820.02748
HCGS:CB 5:02.167875.65070.4221
HCGS:CB 4:12.288579.14780.3998
HCGS:CB 3:22.350678.75220.3893
HCGS:CB 2:32.783576.60020.3287
HCGS:CB 1:42.936475.24600.3116
HCGS:CB 0:52.897576.32260.3263
Table 15. Kinetic parameters obtained by fitting the experimental curing data to Equation (8).
ParpaleCB (phr)KmnR2
00.003840.684140.717960.85805
100.004340.501270.821080.96624
200.005650.710010.922560.96605
300.007020.839061.014560.97042
400.011971.204231.254990.94793
500.011181.152321.224750.93476
Disclaimer/Publisher’s Note: The statements, opinions and data contained in all publications are solely those of the individual author(s) and contributor(s) and not of MDPI and/or the editor(s). MDPI and/or the editor(s) disclaim responsibility for any injury to people or property resulting from any ideas, methods, instructions or products referred to in the content.