
Development of an Optical Sensor Using a Molecularly Imprinted Polymer as a Selective Extracting Agent for the Direct Quantification of Tartrazine in Real Water Samples
 ,
,  , ,
, , 
Abstract
1. Introduction
2. Experimental Section
2.1. Chemicals and Solutions
2.2. Instrumentation
2.3. Functionalization of Optical Fiber (FF)
2.4. Synthesis of Molecularly Imprinted Polymer (MIP) on the Surface of the Functionalized Optical Fiber (FF-MIP)
2.5. Optimization of Reflectance Response of FF-MIP Sensor
2.6. Reusability and Repeatability of FF-MIP and FF-NIP Sensors
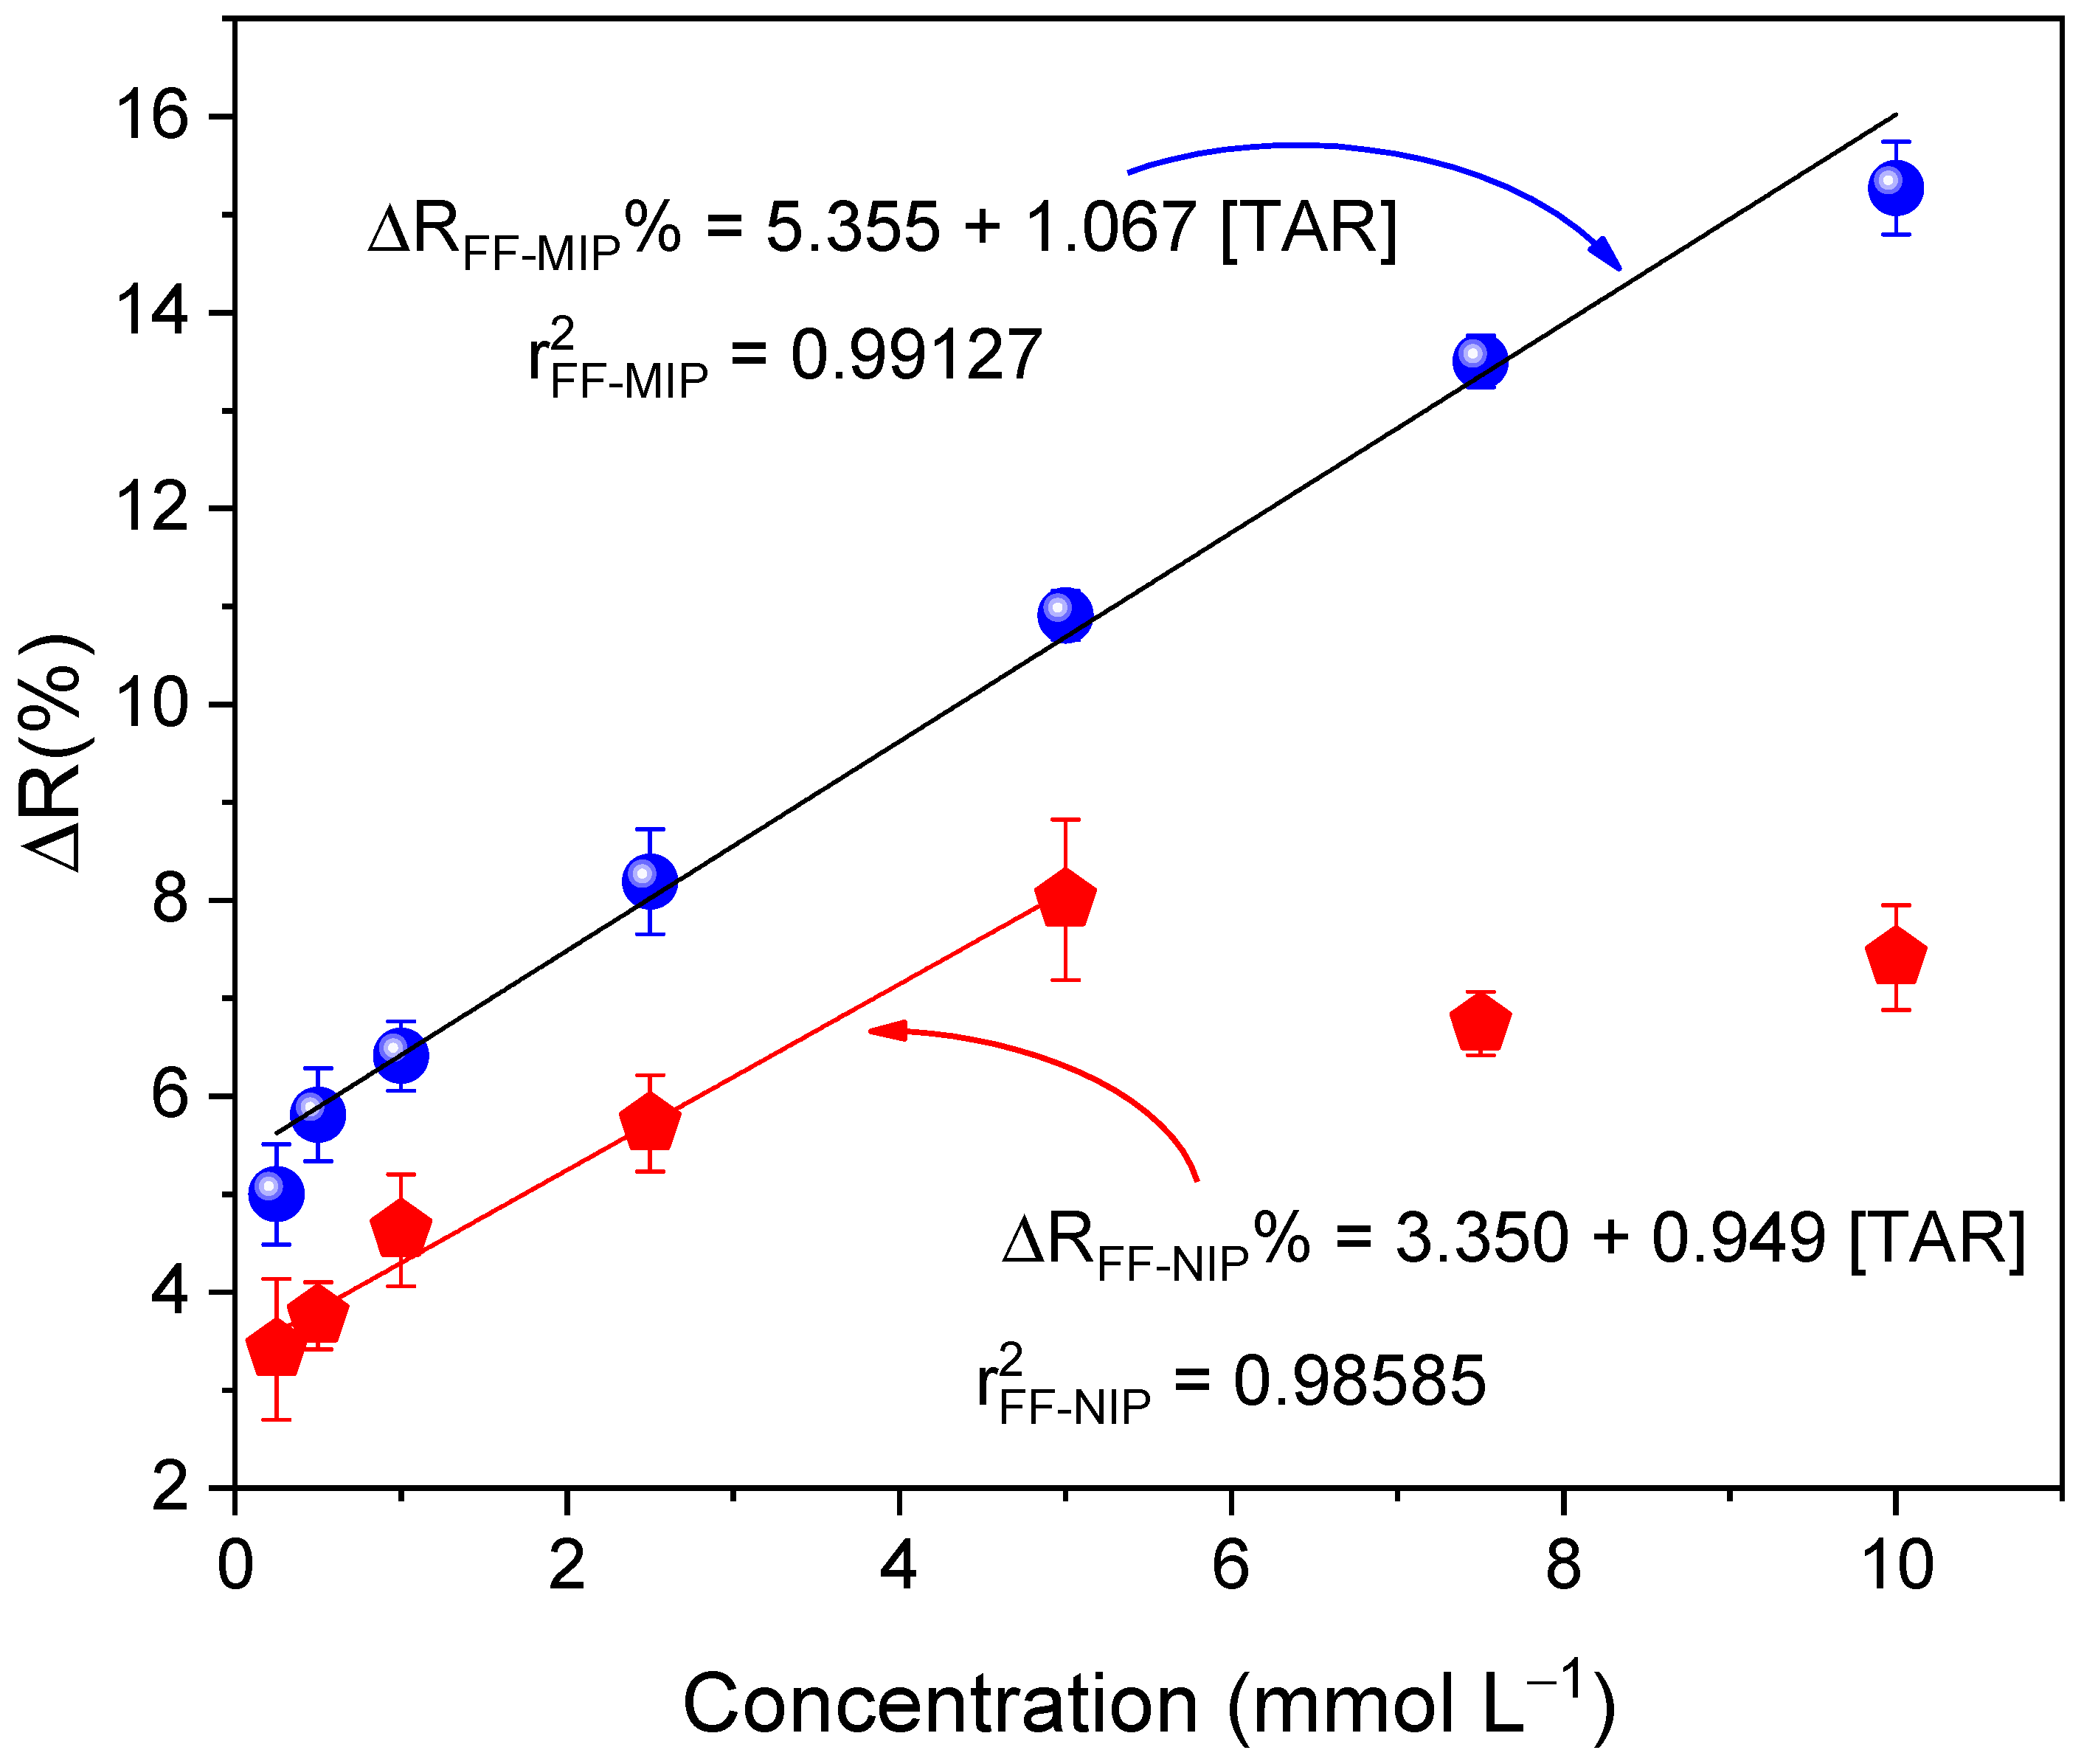
2.7. Calibration Curve
2.8. Selectivity Tests
2.9. Application of the FF-MIP
3. Results and Discussion
3.1. Morphological and FTIR Characterization of the FF-MIP and FF-NIP
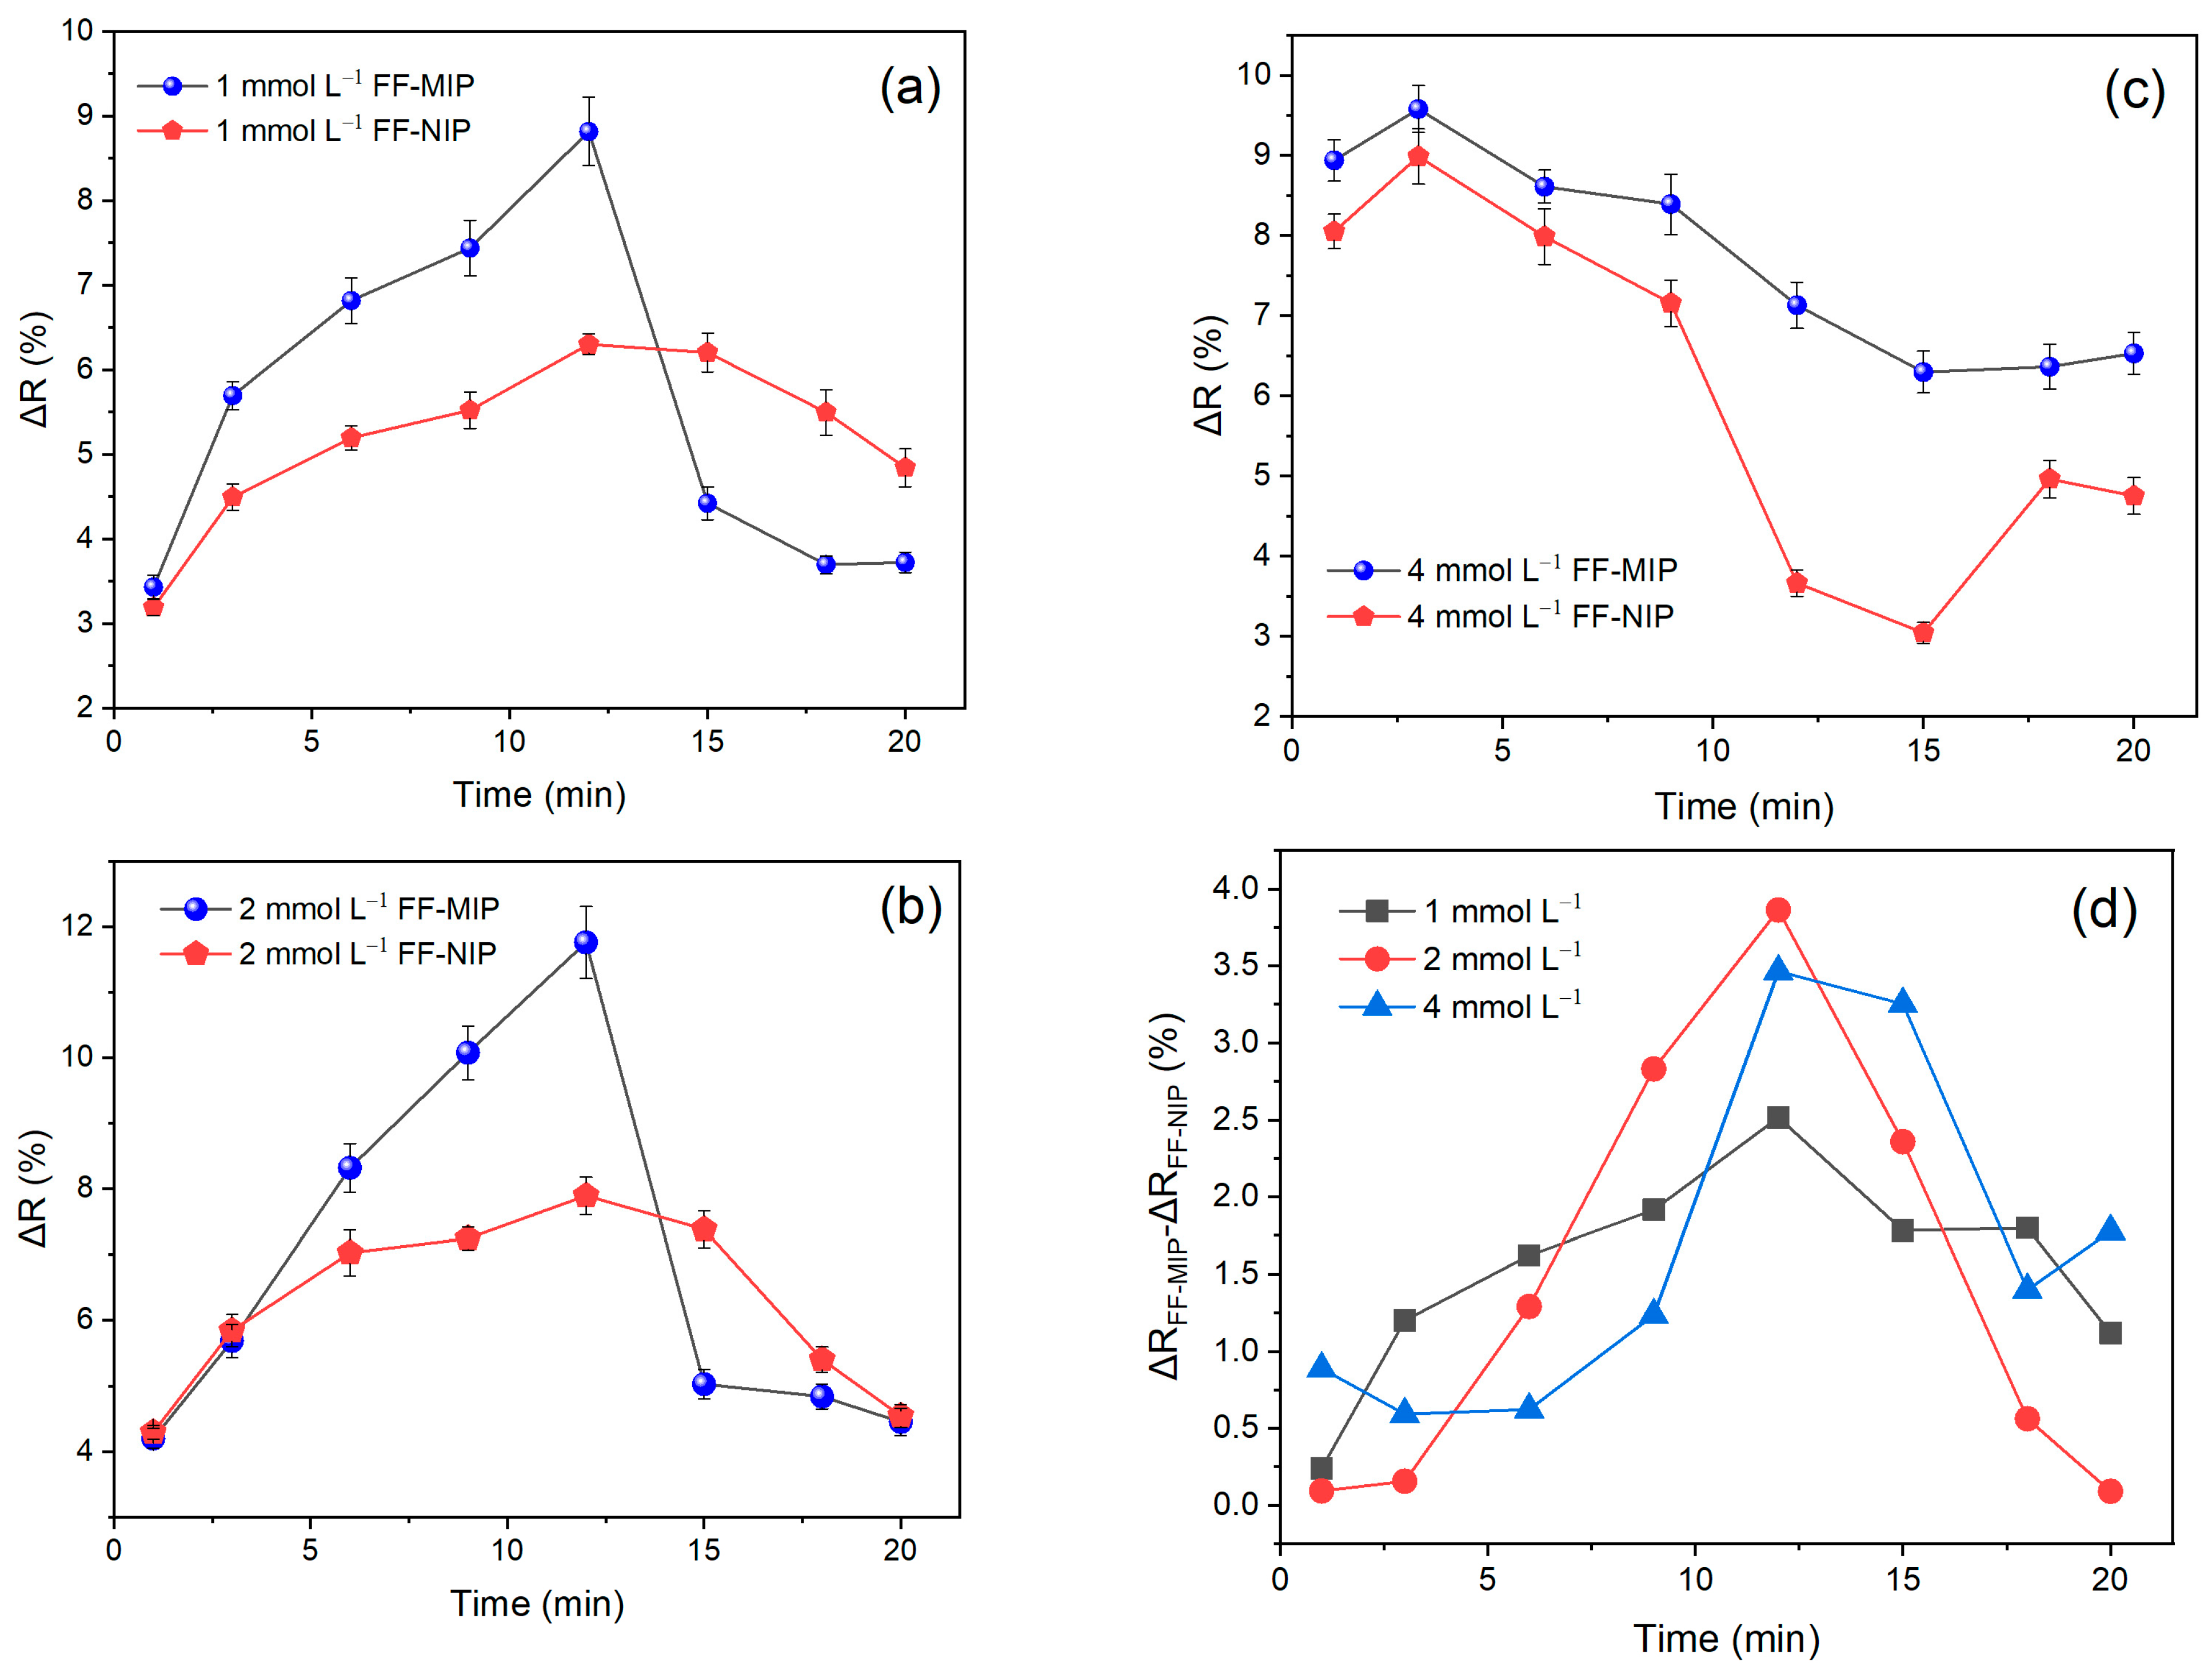
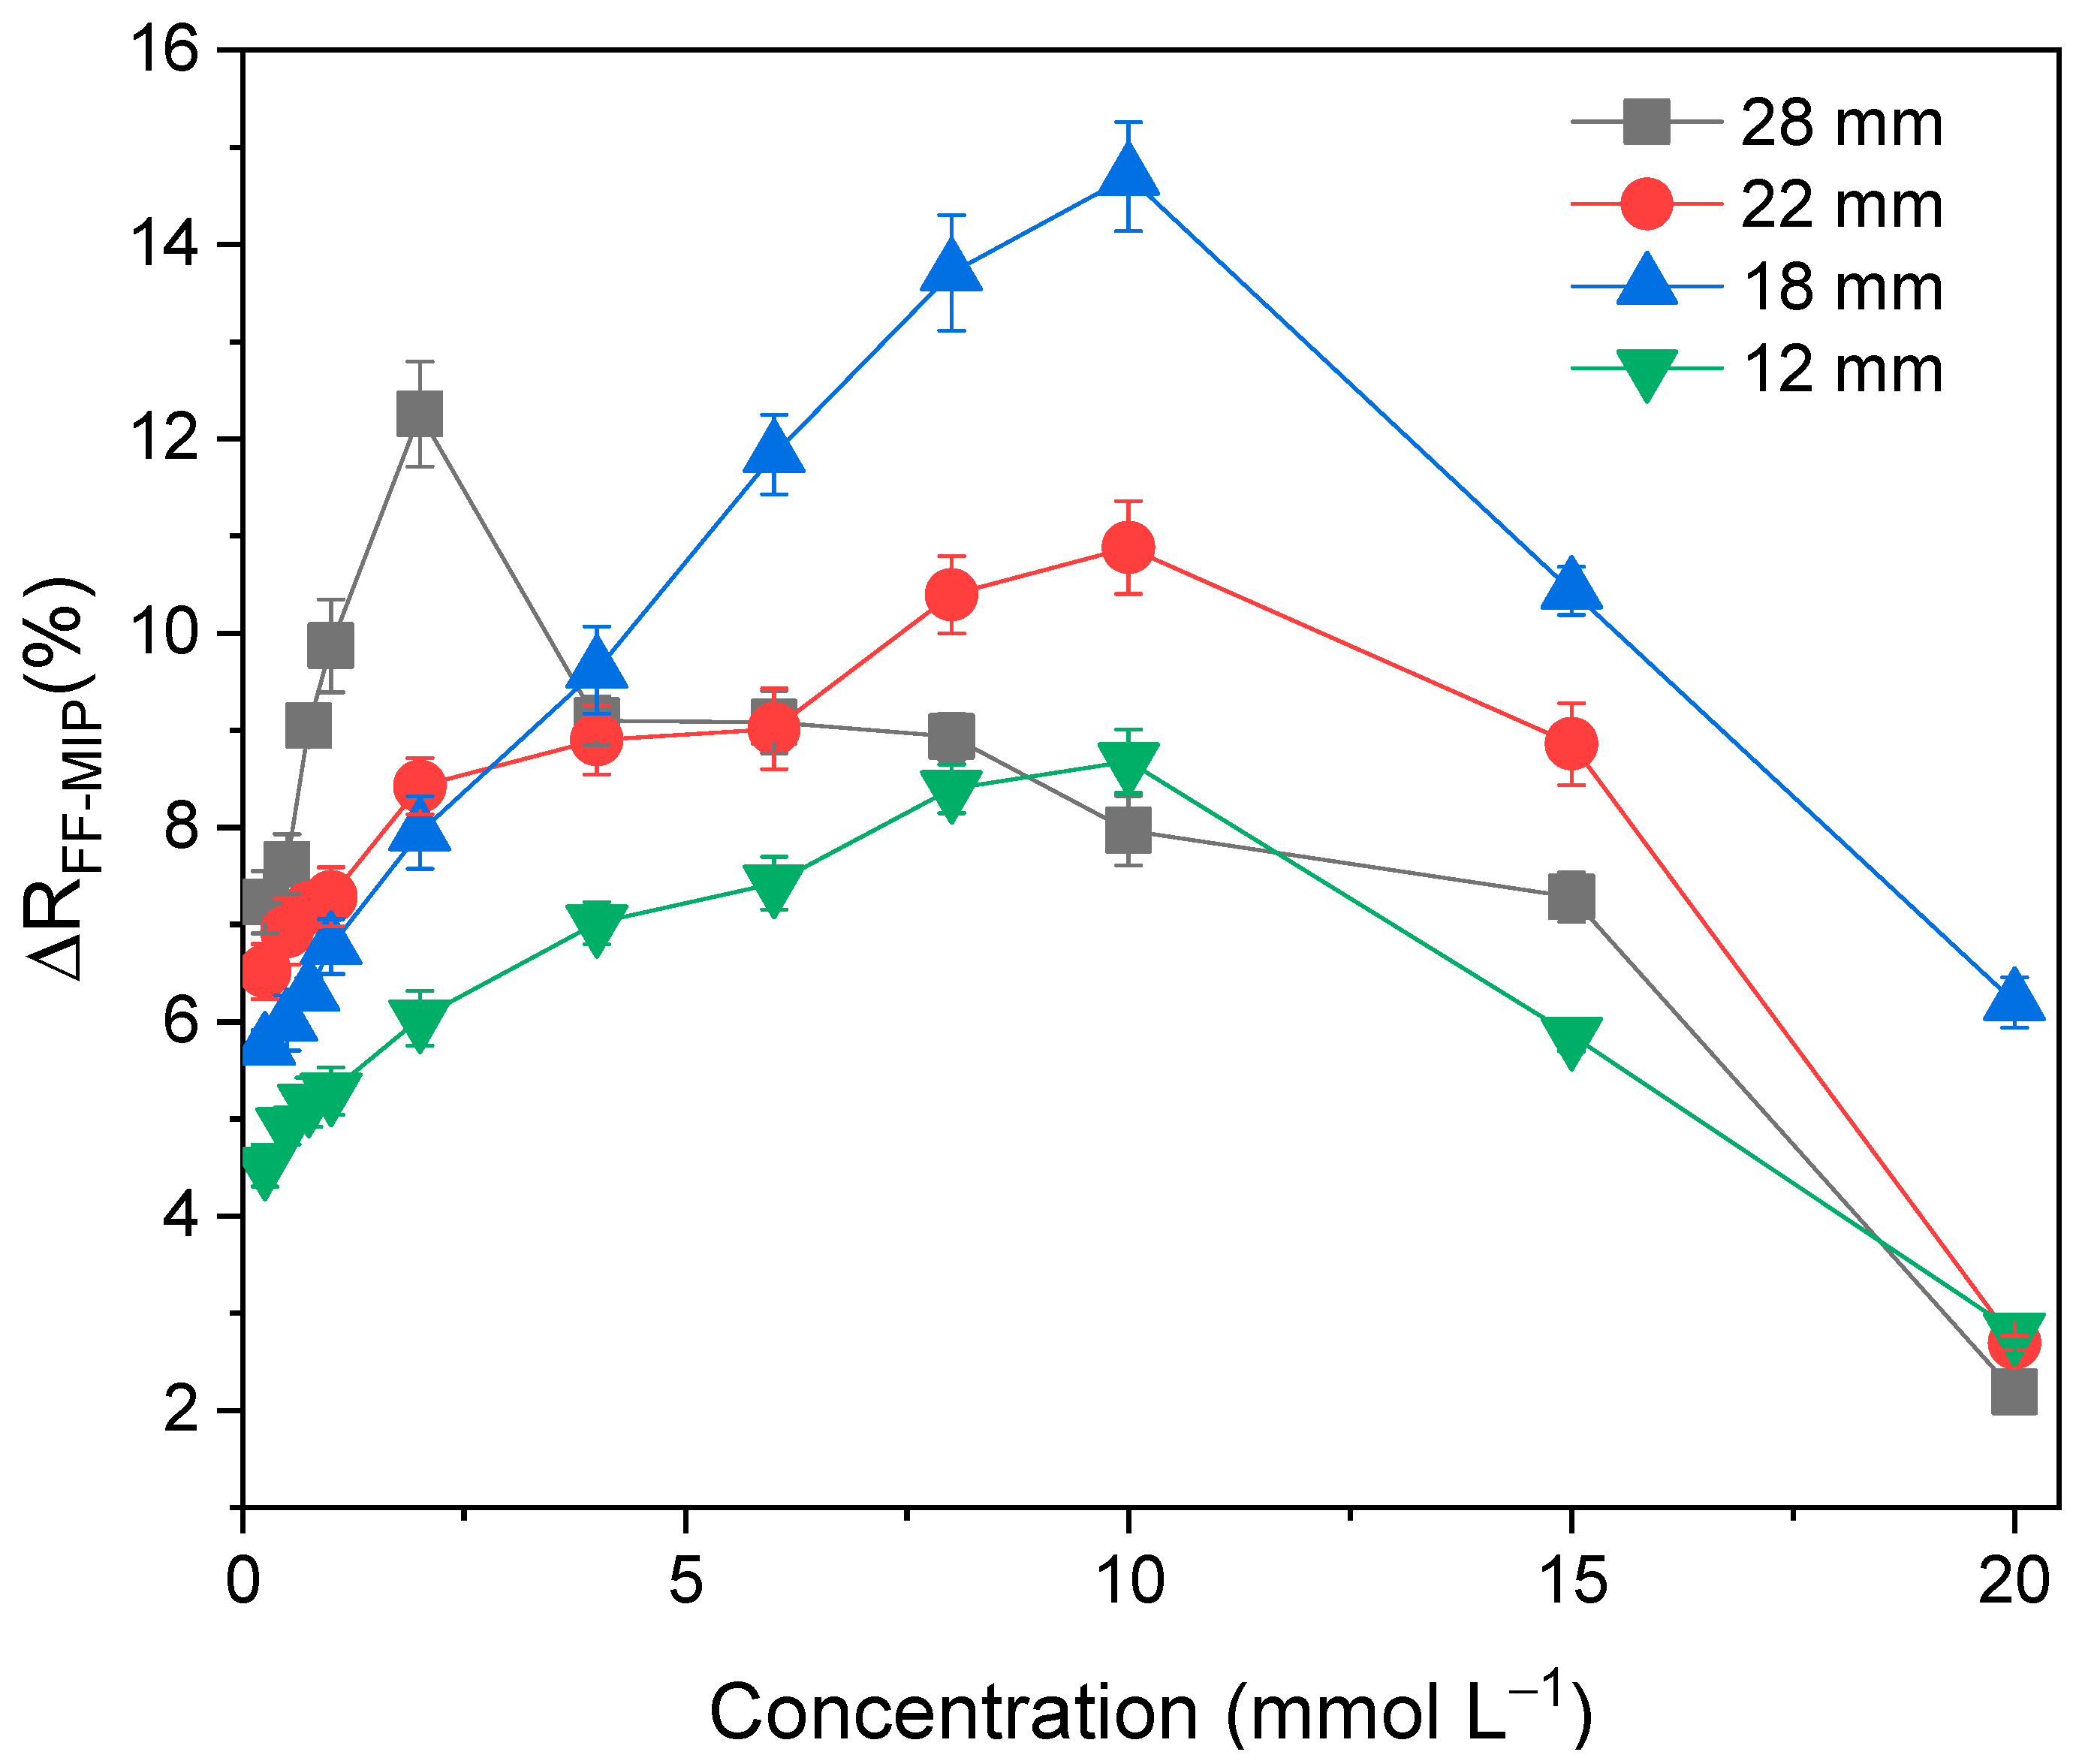
3.2. Optimization of the Sensor Response
3.3. Reusability of the Fiber Sensor and Repeatability of the Obtained Signal
3.4. Analysis of Interference and Selectivity
3.5. Response Profile of the FF-MIP and the Application of the Sensor in Real Samples
4. Conclusions
Supplementary Materials
Author Contributions
Funding
Institutional Review Board Statement
Data Availability Statement
Conflicts of Interest
References
- Vidal, M.; Garcia-Arrona, R.; Bordagaray, A.; Ostra, M.; Albizu, G. Simultaneous determination of color additives tartrazine and allura red in food products by digital image analysis. Talanta 2018, 184, 58–64. [Google Scholar] [CrossRef] [PubMed]
- Amchova, P.; Kotolova, H.; Ruda-Kucerova, J. Health safety issues of synthetic food colorants. Regul. Toxicol. Pharmacol. 2015, 73, 914–922. [Google Scholar] [CrossRef] [PubMed]
- Rovina, K.; Siddiquee, S.; Shaarani, S.M. A Review of Extraction and Analytical Methods for the Determination of Tartrazine (E 102) in Foodstuffs. Crit. Rev. Anal. Chem. 2017, 47, 309–324. [Google Scholar] [CrossRef] [PubMed]
- Hurst, W.J.; McKim, J.M.; Martin, R.A. Determination of Tartrazine in Food Products by HPLC. J. Food Sci. 1981, 46, 419–420. [Google Scholar] [CrossRef]
- De Andrade, F.I.; Guedes, M.I.F.; Pinto, Í.G.; Pereira, F.N.; Salmito, P.A.; Costa, C.S.; Ávila, M.M.M.; Ribeiro, L.d.M. Determination of synthetic food dyes in commercial soft drinks by TLC and ion-pair HPLC. Food Chem. 2014, 157, 193–198. [Google Scholar] [CrossRef] [PubMed]
- Wittmer, D.P.; Nuessle, N.O.; Haney, W.G. Simultaneous analysis of tartrazine and its intermediates by reversed phase liquid chromatography. Anal. Chem. 1975, 47, 1422–1423. [Google Scholar] [CrossRef] [PubMed]
- Pérez-Urquiza, M.; Beltrán, J. Determination of dyes in foodstuffs by capillary zone electrophoresis. J. Chromatogr. A 2000, 898, 271–275. [Google Scholar] [CrossRef]
- Huang, H.-Y.; Shih, Y.-C.; Chen, Y.-C. Determining eight colorants in milk beverages by capillary electrophoresis. J. Chromatogr. A 2002, 959, 317–325. [Google Scholar] [CrossRef]
- Noormohamadi, H.R.; Fathi, M.; Ghaedi, M. Fabrication of polyethyleneimine modified cobalt ferrite as a new magnetic sorbent for the micro-solid phase extraction of tartrazine from food and water samples. J. Colloid Interface Sci. 2018, 531, 343–351. [Google Scholar] [CrossRef]
- Mortari, B.; Khan, S.; Wong, A.; Fireman Dutra, R.A.; Sotomayor, M.D.P.T. Next generation of optodes coupling plastic antibody with optical fibers for selective quantification of Acid Green 16. Sens. Actuators B Chem. 2019, 305, 127553. [Google Scholar] [CrossRef]
- Belbruno, J.J. Molecularly Imprinted Polymers. Chem. Rev. 2019, 119, 94–119. [Google Scholar] [CrossRef] [PubMed]
- Janczura, M.; Lulinski, P.; Sobiech, M. Imprinting Technology for effective sorbent fabrication: Current state-of-art and future prospects. Materials 2021, 14, 1850. [Google Scholar] [CrossRef] [PubMed]
- Liu, Y.; Wang, L.; Li, H.; Zhao, L.; Ma, Y.; Zhang, Y.; Liu, J.; Wei, Y. Rigorous recognition mode analysis of molecularly imprinted polymers-Rational design, challenges, and opportunities. Prog. Polym. Sci. 2024, 150, 101790. [Google Scholar] [CrossRef]
- Khan, S.; Wong, A.; Zanoni, M.V.B.; Sotomayor, M.D.P.T. Electrochemical sensors based on biomimetic magnetic molecularly imprinted polymer for selective quantification of methyl green in environmental samples. Mater. Sci. Eng. C. 2019, 103, 109825. [Google Scholar] [CrossRef]
- Haupt, K.; Mosbach, K. Molecularly Imprinted Polymers and Their Use in Biomimetic Sensors. Chem. Rev. 2000, 100, 2495–2504. [Google Scholar] [CrossRef]
- Kong, X.; Gao, R.; He, X.; Chen, L.; Zhang, Y. Synthesis and characterization of the core–shell magnetic molecularly imprinted polymers (Fe3O4@MIPs) adsorbents for effective extraction and determination of sulfonamides in the poultry feed. J. Chromatogr. A 2012, 1245, 8–16. [Google Scholar] [CrossRef]
- Ma, J.; Yuan, L.; Ding, M.; Wang, S.; Ren, F.; Zhang, J.; Du, S.; Li, F.; Zhou, X. The study of core–shell molecularly imprinted polymers of 17β-estradiol on the surface of silica nanoparticles. Biosens. Bioelectron. 2011, 26, 2791–2795. [Google Scholar] [CrossRef]
- Hu, Y.; Feng, S.; Gao, F.; Li-Chan, E.C.Y.; Grant, E.; Lu, X. Detection of melamine in milk using molecularly imprinted polymers–surface enhanced Raman spectroscopy. Food Chem. 2015, 176, 123–129. [Google Scholar] [CrossRef]
- Wan, W.; Biyikal, M.; Wagner, R.; Sellergren, B.; Rurack, K. Fluorescent Sensory Microparticles that “Light-up” Consisting of a Silica Core and a Molecularly Imprinted Polymer (MIP) Shell. Angew. Chem. Int. Ed. 2013, 52, 7023–7027. [Google Scholar] [CrossRef]
- Ruiz-Córdova, G.A.; Khan, S.; Gonçalves, L.M.; Pividori, M.I.; Picasso, G.; Sotomayor, M.D.P.T. Electrochemical sensing using magnetic molecularly imprinted polymer particles previously captured by a magneto-sensor. Talanta 2018, 181, 19–23. [Google Scholar] [CrossRef]
- Yang, W.; Ma, Y.; Sun, H.; Huang, C.; Shen, X. Molecularly imprinted polymers based optical fiber sensors: A review. TrAC Trends Anal. Chem. 2022, 152, 116608. [Google Scholar] [CrossRef]
- Ayankojo, A.G.; Reut, J.; Nguyen, V.B.C.; Boroznjak, R.; Syritski, V. Advances in Detection of Antibiotic Pollutants in Aqueous Media Using Molecular Imprinting Technique—A review. Biosensors 2022, 12, 441. [Google Scholar] [CrossRef] [PubMed]
- Ruiz-Córdova, G.A.; Villa, J.E.L.; Khan, S.; Picasso, G.; Sotomayor, M.D.P.T. Surface molecularly imprinted core-shell nanoparticles and reflectance spectroscopy for direct determination of tartrazine in soft drinks. Anal. Chim. Acta 2021, 1159, 338443. [Google Scholar] [CrossRef] [PubMed]
- Jiao, L.; Zhong, N.; Zhao, X.; Ma, S.; Fu, X.; Dong, D. Recent advances in fiber-optic evanescent wave sensors for monitoring organic and inorganic pollutants in water. TrAC Trends Anal. Chem. 2020, 127, 115892. [Google Scholar] [CrossRef]
- Maithani, S.; Maity, S.; Pradhan, M. A prototype Evanescent Wave-Coupled Cavity Ring-down Spectrometer for Probing Real-Time Aggregation Kinetics of Gold and Silver Nanoparticles. Anal. Chem. 2020, 92, 3998–4005. [Google Scholar] [CrossRef] [PubMed]
- Minnes, R.; Brider, T.; Goryachev, A.; Grushchenko, A.; Tor, R.; Nevo, A.; Lifshitz, D.; Katzir, A.; Raichlin, Y. Fiber optic Evanescent Wave Spectroscopy (FEWS) of crystals from a urine sample as a tool for evaluating the chemical composition of kidney stones. Anal. Methods 2020, 11, 2404–2409. [Google Scholar] [CrossRef]
- Ponchai, A.; Rattana, S.; Thongprajukaew, K. A portable sol-gel urea colorimetric method for determination of urea in feedstuffs. Food Chem. 2020, 319, 126545. [Google Scholar] [CrossRef]
- Aydin, D.; Gunay, I.B.; Karuk, K.; Savran, T.; Arslan, F.N.; Sadi, G. A simple and sensitive fluorescent sensor platform for Al3+ sensing in aqueous media and monitoring through combined PET and ESIPT mechanisms: Practical Applications in drinking water and bio-imaging. N. J. Chem. 2020, 44, 12079–12089. [Google Scholar] [CrossRef]
- Mezentseva, O.L.; Slepchenko, G.B.; Dorozhko, E.V.; Moiseeva, E.S.; Kruykovskiy, V.P.; Zaycev, N.K. Electrochemical Sensor for Selectivie Detection of Meldonium in Urine by Voltammetry. Electroanalysis 2022, 35, 202200252. [Google Scholar] [CrossRef]
- Masti, R.; Barolo, E.; Bertolini, F.M.; De Arcangeli, S.; Furlanello, T.; Del Pulgar, J.S. Analysis of Metaldehyde in Animal Whole Blood and Serum by Gas Cromatography–Mass Spectrometry. J. Anal. Toxicol. 2023, 47, 464–469. [Google Scholar] [CrossRef]
- Faraji, M.; Afsharsaveh, Z.; Shirani, M. Application of vortex assisted dispersive liquid-liquid microextraction based on a new deep eutectic solvent for microextraction of aromatic amines from simulant of kitchenware samples by HPLC-UV. Microchem. J. 2022, 175, 107124. [Google Scholar] [CrossRef]
- Doostmohammadi, A.; Youseff, K.; Akhtarian, S.; Tabesh, E.; Kraft, G.; Brar, S.K.; Rezai, P. Molecularly imprinted polymer (MIP) based core-shell microspheres for bacteri isolation. Polymer 2022, 251, 124917. [Google Scholar] [CrossRef]
- Caban, R. FTIR-ATR spectroscopic, thermal and microstructural studies on polypropylene-glass fiber composites. J. Mol. Struct. 2022, 1264, 133181. [Google Scholar] [CrossRef]
- Haris, N.I.N.; Ilyas, R.A.; Hassan, M.Z.; Sapuan, S.M.; Afdzaluddin, A.; Jamaludin, K.R.; Zaki, S.A.; Ramlie, F. Dynamic Mechanical Properties and Thermal Properties of Longitudinal Basalt/Woven Glass Fiber Reinforced Unsaturated Polyester Hybrid Composites. Polymers 2021, 13, 3343. [Google Scholar] [CrossRef] [PubMed]
- Nguyen, T.; Nguyen, T.; Vu, D.; Dinh, D.; Nguyen, A.; Ly, T.; Dao, P.; Nguyen, T.; Bach, L.; Thai, H. Modification of Titanium Dioxide Nanoparticles with 3-(Trimethoxysilyl)propyl Methacrylate Silane Coupling Agent. J. Chem. 2020, 2020, 1381407. [Google Scholar] [CrossRef]
- Mohammed, A.H.; Ahmad, M.B.; Ibrahim, N.A.; Zainuddin, N. Synthesis and monomer reactivity ratios of acrylamide with 3-(trimethoxysilyl)propyl methacrylate and tris(methoxyethoxy)vinylsilane copolymers. Polimery 2021, 61, 758–765. [Google Scholar] [CrossRef]
- Lopes, I.M.F.; Abersfelder, K.; Oliveira, P.W.; Mousavi, S.H.; Junqueira, R.M.R. Flower-like silicon dioxide/polymer composite particles synthesized by dispersion polymerization route. J. Mater. Sci. 2018, 53, 11367–11377. [Google Scholar] [CrossRef]
- Xiao, Z.; Feng, S.; Zhew, Z.; Yue, X.; Xuqeuin, R. Synthesis of a novel crosslinker doubles as a functional monomer for preparing a water compatible molecularly imprinted polymer. Anal. Methods 2014, 6, 9483–9489. [Google Scholar] [CrossRef]
- Meza, F.L.; Khan, S.; Picasso, G.; Sotomayor, M.P.T. A novel highly sensitive imprinted polymer-based optical sensor for the detection of Pb (II) in water samples. Environ. Nanotechnol. Monit. Manag. 2021, 16, 100497. [Google Scholar] [CrossRef]
- Handayani, D.S.; Rahayu, P.; Firdaus, M. Synthesis and Characterisation of Copoly-(Eugenol-N,N’-Methylene Bis(Acrylamide)). J. Phys. Sci. 2019, 30, 87–100. [Google Scholar] [CrossRef]
- Vinodkumar, G.S.; Mathew, B. Polymer-metal complexes of glycine functions supported on N,N’-methylene-bis-acrylamide (NNMBA)-crosslinked polyacrylamides: Synthesis, Characterisation and Catalytic Activity. Eur. Polym. J. 1998, 34, 1185–1190. [Google Scholar] [CrossRef]
- Prasad, B.B.; Singh, K. Molecularly imprinted polymer-based core-shells (solid vs hollow) @ pencil graphite electrode for electrochemical sensing of certain anti-HIV drugs. Sens. Actuators B Chem. 2017, 244, 167–174. [Google Scholar] [CrossRef]
- Madhusudhama, K.; Anbananthan, N.; Varada, A. Bicontinuous highly cross-linked poly(acrylamide-co-ethyleneglycol dimethacrylate) porous materials synthesized within high internal phase emulsions. Soft Matter 2011, 7, 10780–10786. [Google Scholar] [CrossRef]
- Abdullah, A.; Yener, G.; Burak, A.; Selahattin, S.A. A novel catalist system for the synthesis of N-N´-Methylenebisacrylamide from acrylamide. Des. Monomers Polym. 2017, 20, 434–440. [Google Scholar] [CrossRef]
- Vlad, C.; Dinu, M.; Dragan, S. Thermogravimetric analysis of some crosslinked acrylamide copolymers and ion exchangers. Polym. Degrad. Stab. 2003, 79, 153–159. [Google Scholar] [CrossRef]
- Foroughirad, S.; Arabzadeh, N.; Mohammadi, A.; Khosravi, A. Synthesis and characterization of novel water-compatible magnetic molecularly imprinted polymer for tartrazine. J. Chin. Adv. Mater. Soc. 2018, 6, 706–721. [Google Scholar] [CrossRef]
- Bereli, N.; Cimen, D.; Denizli, A. Optical Sensor Based Molecular Imprinted Poly(hydroxyethyl methacrylate-N-methacryloyl-(L)-histidine methyl ester) Thin Films for Determination of Tartrazine in Fruit Juice. IEEE Sens. J. 2021, 21, 13215–13222. [Google Scholar] [CrossRef]


| Fiber (TAR Concentration) | s b | RSDexp | RSDHorwitz | |
|---|---|---|---|---|
| FF-MIP (1.0 mmol L−1) | 1.009 | 0.018 | 1.784 | 2.080 |
| FF-NIP (1.0 mmol L−1) | 0.861 | 0.057 | 6.620 | 2.130 |
| FF-MIP (2.5 mmol L−1) | 2.508 | 0.043 | 1.715 | 1.813 |
| FF-NIP (2.5 mmol L−1) | 2.609 | 0.159 | 6.092 | 1.803 |
| FF-MIP (7.5 mmol L−1) | 7.454 | 0.083 | 1.112 | 1.539 |
| Dye | Structure | Selectivity Parameters | |
|---|---|---|---|
| α (MIP/NIP) | β (Analyte/Interferent) | ||
| TAR |  | 1.405 | - |
| SY |  | 0.936 | 1.501 |
| C |  | 0.684 | 2.054 |
| RB |  | 0.692 | 2.030 |
| TB | 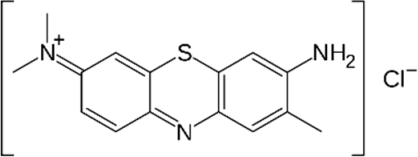 | 0.468 | 3.002 |
| MB | 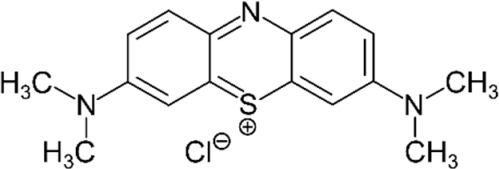 | 0.513 | 2.739 |
| AB | 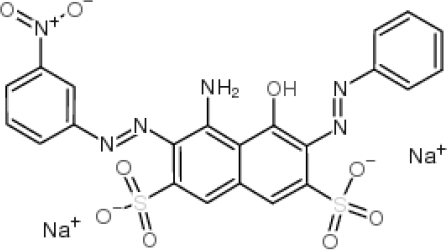 | 0.112 | 12.545 |
| Method | Material | Imprinting Factor (α) | Selectivity (β) | Reference |
|---|---|---|---|---|
| Reflectance Spectrophotometry | Functionalized Silica Optical Fiber | 1.41 | 1.501–12.545 | Present study |
| Reflectance Spectrophotometry | SiO2@MIP | 1.27 | 1.4–264 | Ruiz, 2021 [23] |
| UV-Vis Spectrophotometry | Fe3O4@SiO2 | 2.46 | 2.035–2.253 | Foroughirad, 2018 [46] |
| Surface Plasmon Resonance | PHEMAH * thin films | 6.20 | 1.196–7.207 | Bereli, 2021 [47] |
| Sample (Symbol) | Method a | |
|---|---|---|
| HPLC b | Proposed (FF-MIP) c,d | |
| Drinkable Water 1 (A) | 1.141 ± 0.007 | 1.173 ± 0.054 |
| Drinkable Water 2 (B) | 1.281 ± 0.004 | 1.215 ± 0.083 |
| Cachi River Water (C) | 1.056 ± 0.003 | 1.059 ± 0.057 |
| Millpu River Water (D) | 1.071 ± 0.010 | 1.078 ± 0.067 |
| Waste Water (E) | 1.062 ± 0.003 | 1.073 ± 0.051 |
Disclaimer/Publisher’s Note: The statements, opinions and data contained in all publications are solely those of the individual author(s) and contributor(s) and not of MDPI and/or the editor(s). MDPI and/or the editor(s) disclaim responsibility for any injury to people or property resulting from any ideas, methods, instructions or products referred to in the content. |
© 2024 by the authors. Licensee MDPI, Basel, Switzerland. This article is an open access article distributed under the terms and conditions of the Creative Commons Attribution (CC BY) license (https://creativecommons.org/licenses/by/4.0/).
Share and Cite
Ruiz-Córdova, G.A.; Vega-Chacón, J.; Sotomayor, M.d.P.T.; Tuesta, J.C.; Khan, S.; Picasso, G. Development of an Optical Sensor Using a Molecularly Imprinted Polymer as a Selective Extracting Agent for the Direct Quantification of Tartrazine in Real Water Samples. Polymers 2024, 16, 733. https://doi.org/10.3390/polym16060733
Ruiz-Córdova GA, Vega-Chacón J, Sotomayor MdPT, Tuesta JC, Khan S, Picasso G. Development of an Optical Sensor Using a Molecularly Imprinted Polymer as a Selective Extracting Agent for the Direct Quantification of Tartrazine in Real Water Samples. Polymers. 2024; 16(6):733. https://doi.org/10.3390/polym16060733
Chicago/Turabian StyleRuiz-Córdova, Gerson A., Jaime Vega-Chacón, Maria del Pilar Taboada Sotomayor, Juan C. Tuesta, Sabir Khan, and Gino Picasso. 2024. "Development of an Optical Sensor Using a Molecularly Imprinted Polymer as a Selective Extracting Agent for the Direct Quantification of Tartrazine in Real Water Samples" Polymers 16, no. 6: 733. https://doi.org/10.3390/polym16060733
APA StyleRuiz-Córdova, G. A., Vega-Chacón, J., Sotomayor, M. d. P. T., Tuesta, J. C., Khan, S., & Picasso, G. (2024). Development of an Optical Sensor Using a Molecularly Imprinted Polymer as a Selective Extracting Agent for the Direct Quantification of Tartrazine in Real Water Samples. Polymers, 16(6), 733. https://doi.org/10.3390/polym16060733