
The Discharge Behavior and Mechanism of Polyimide Aerogel under Electron Irradiation
 ,
,
Abstract
:1. Introduction
2. Materials and Methods
2.1. Materials
2.2. Electron Irradiation
2.3. Characterizations
2.4. Simulation Software
3. Results and Discussion
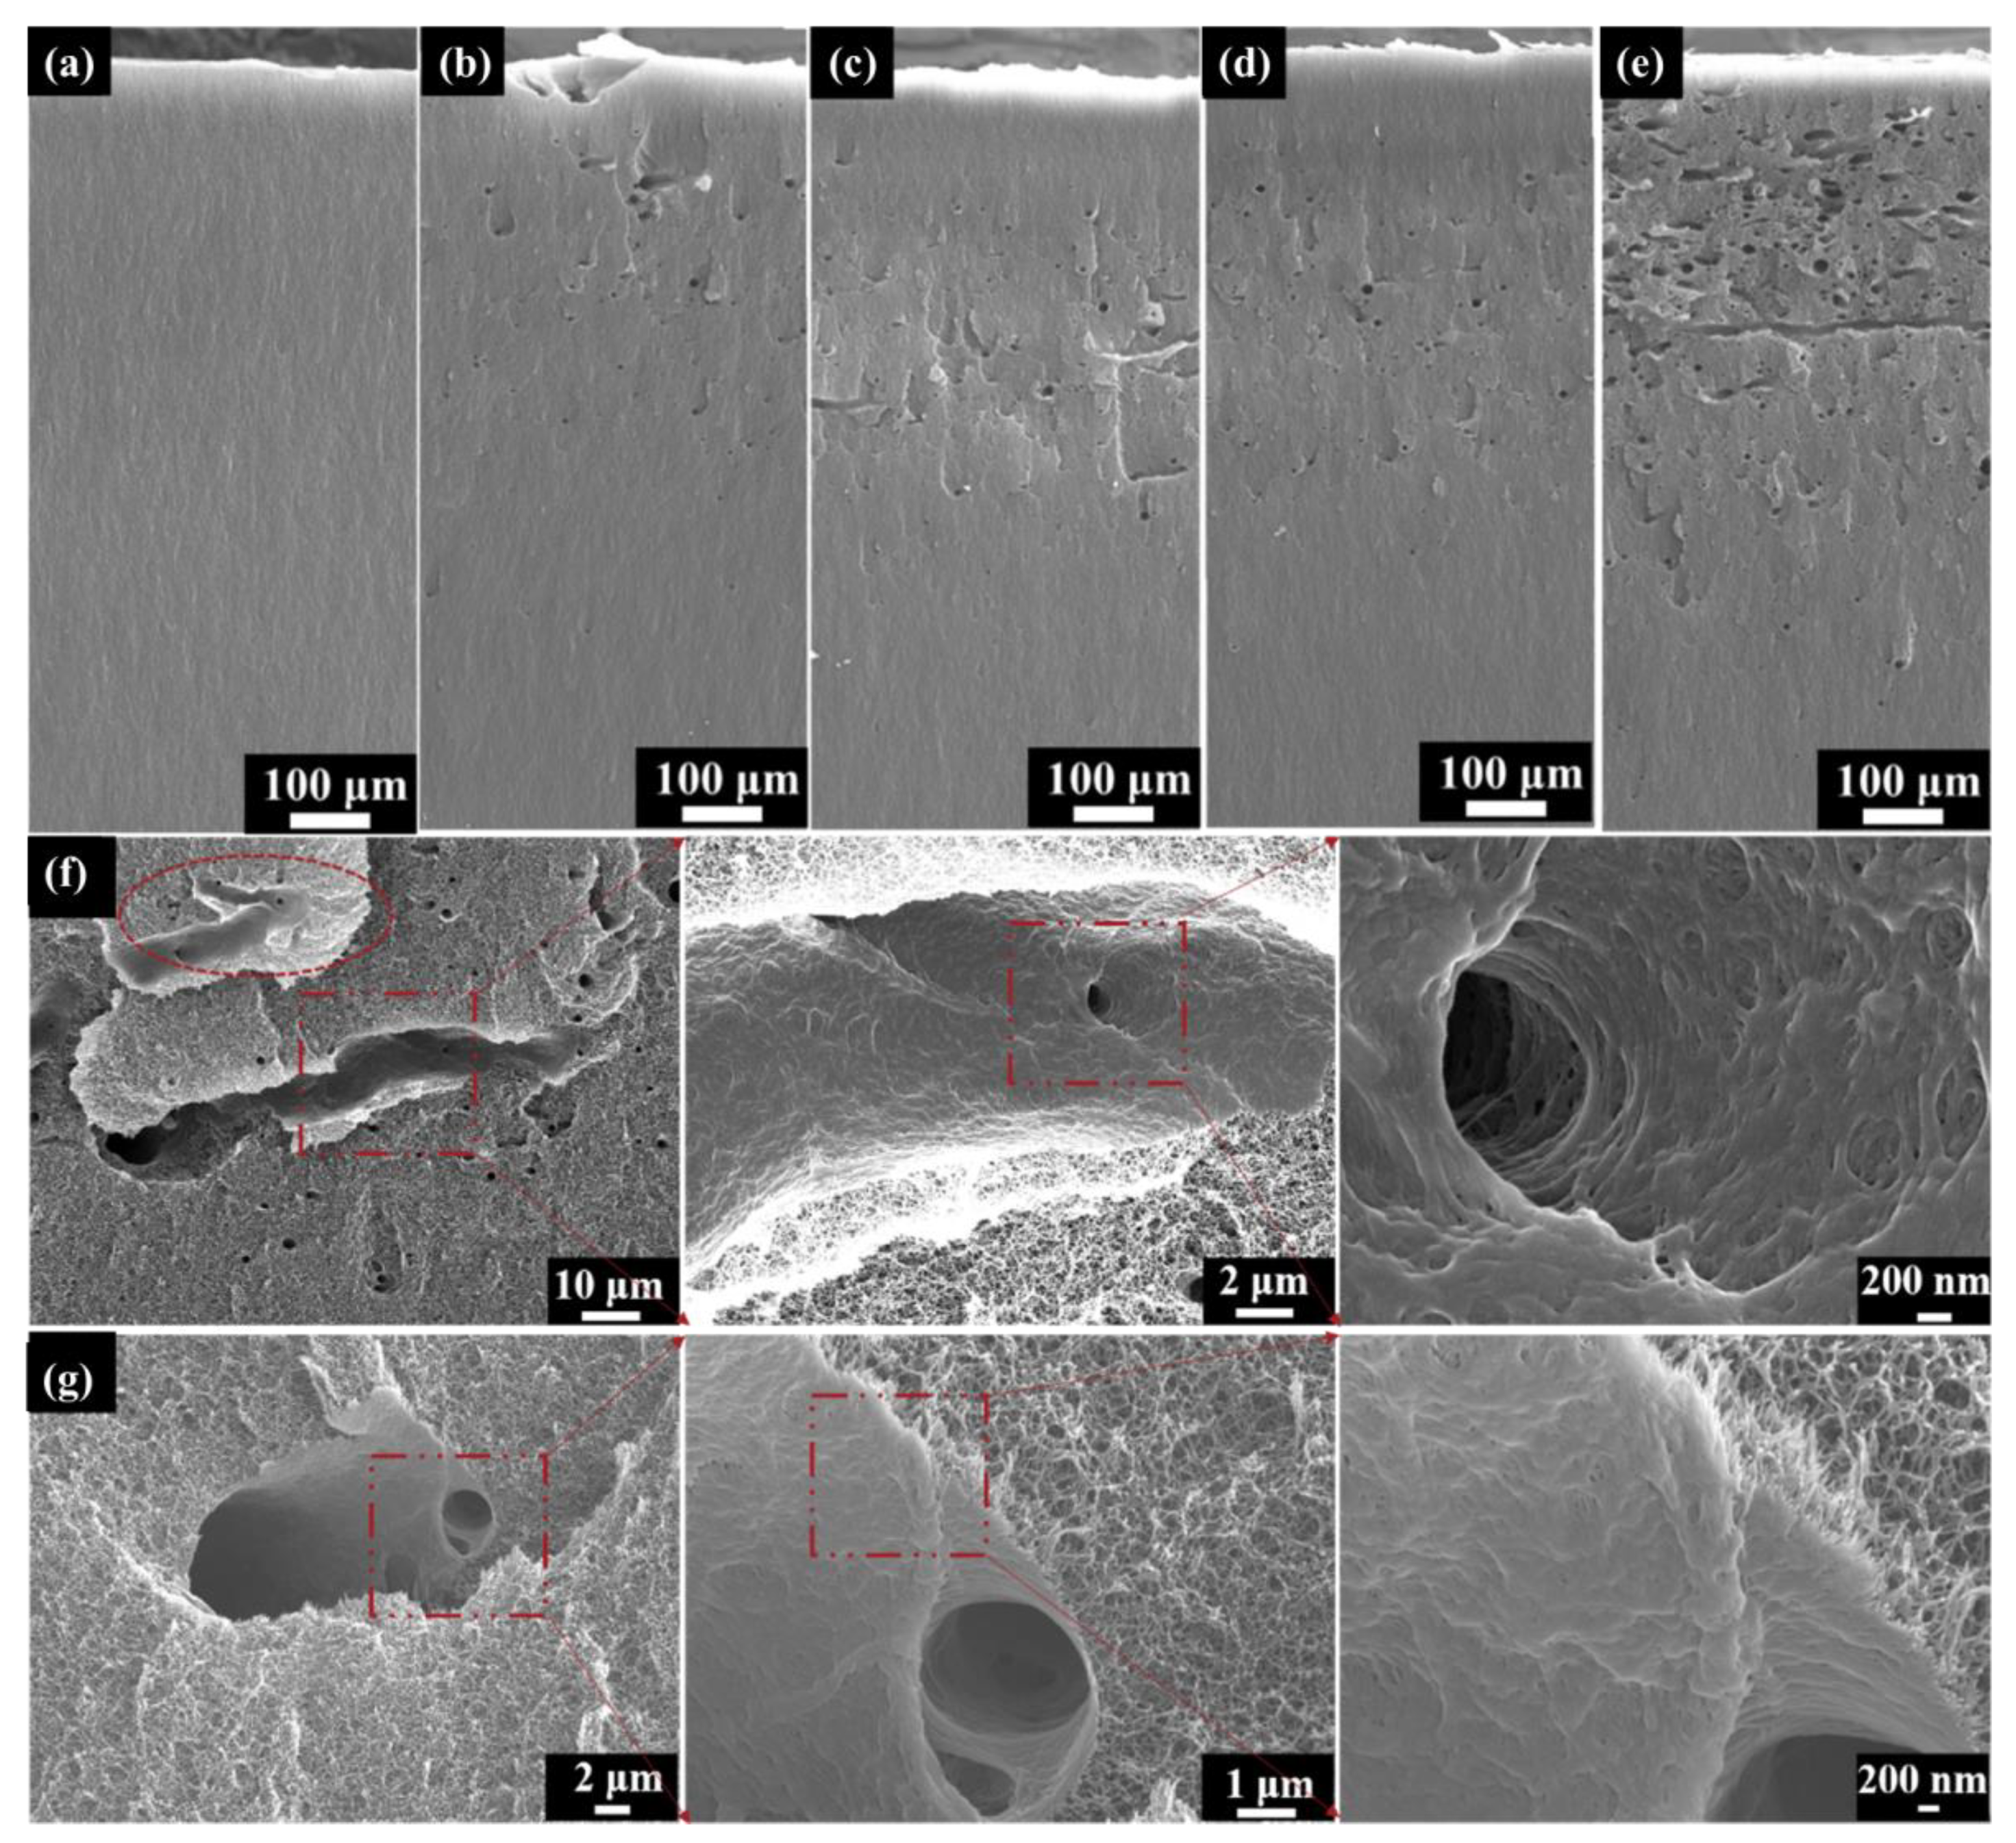
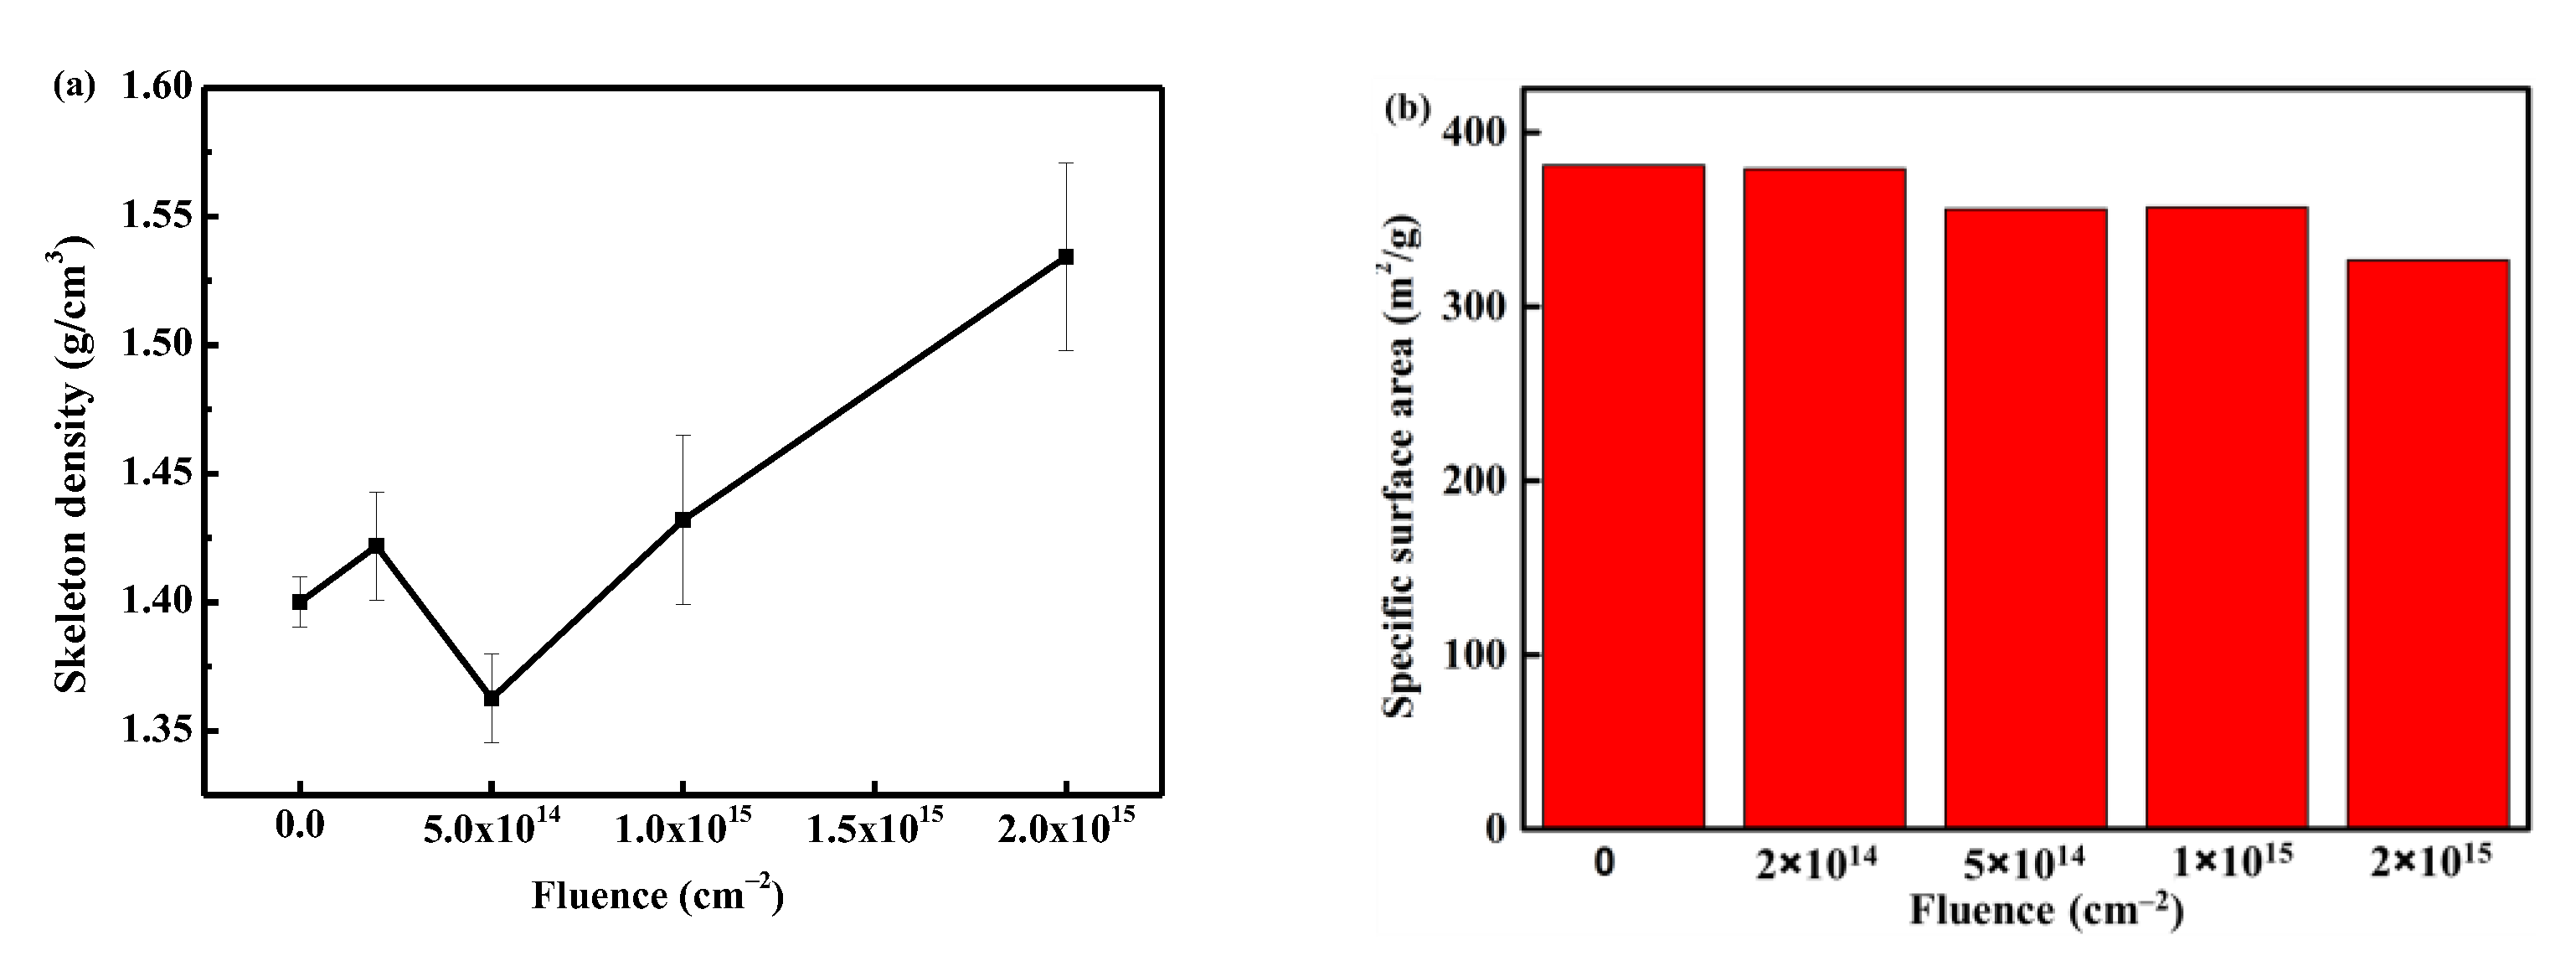
3.1. The Influence of Irradiation Fluence on Discharge Behavior
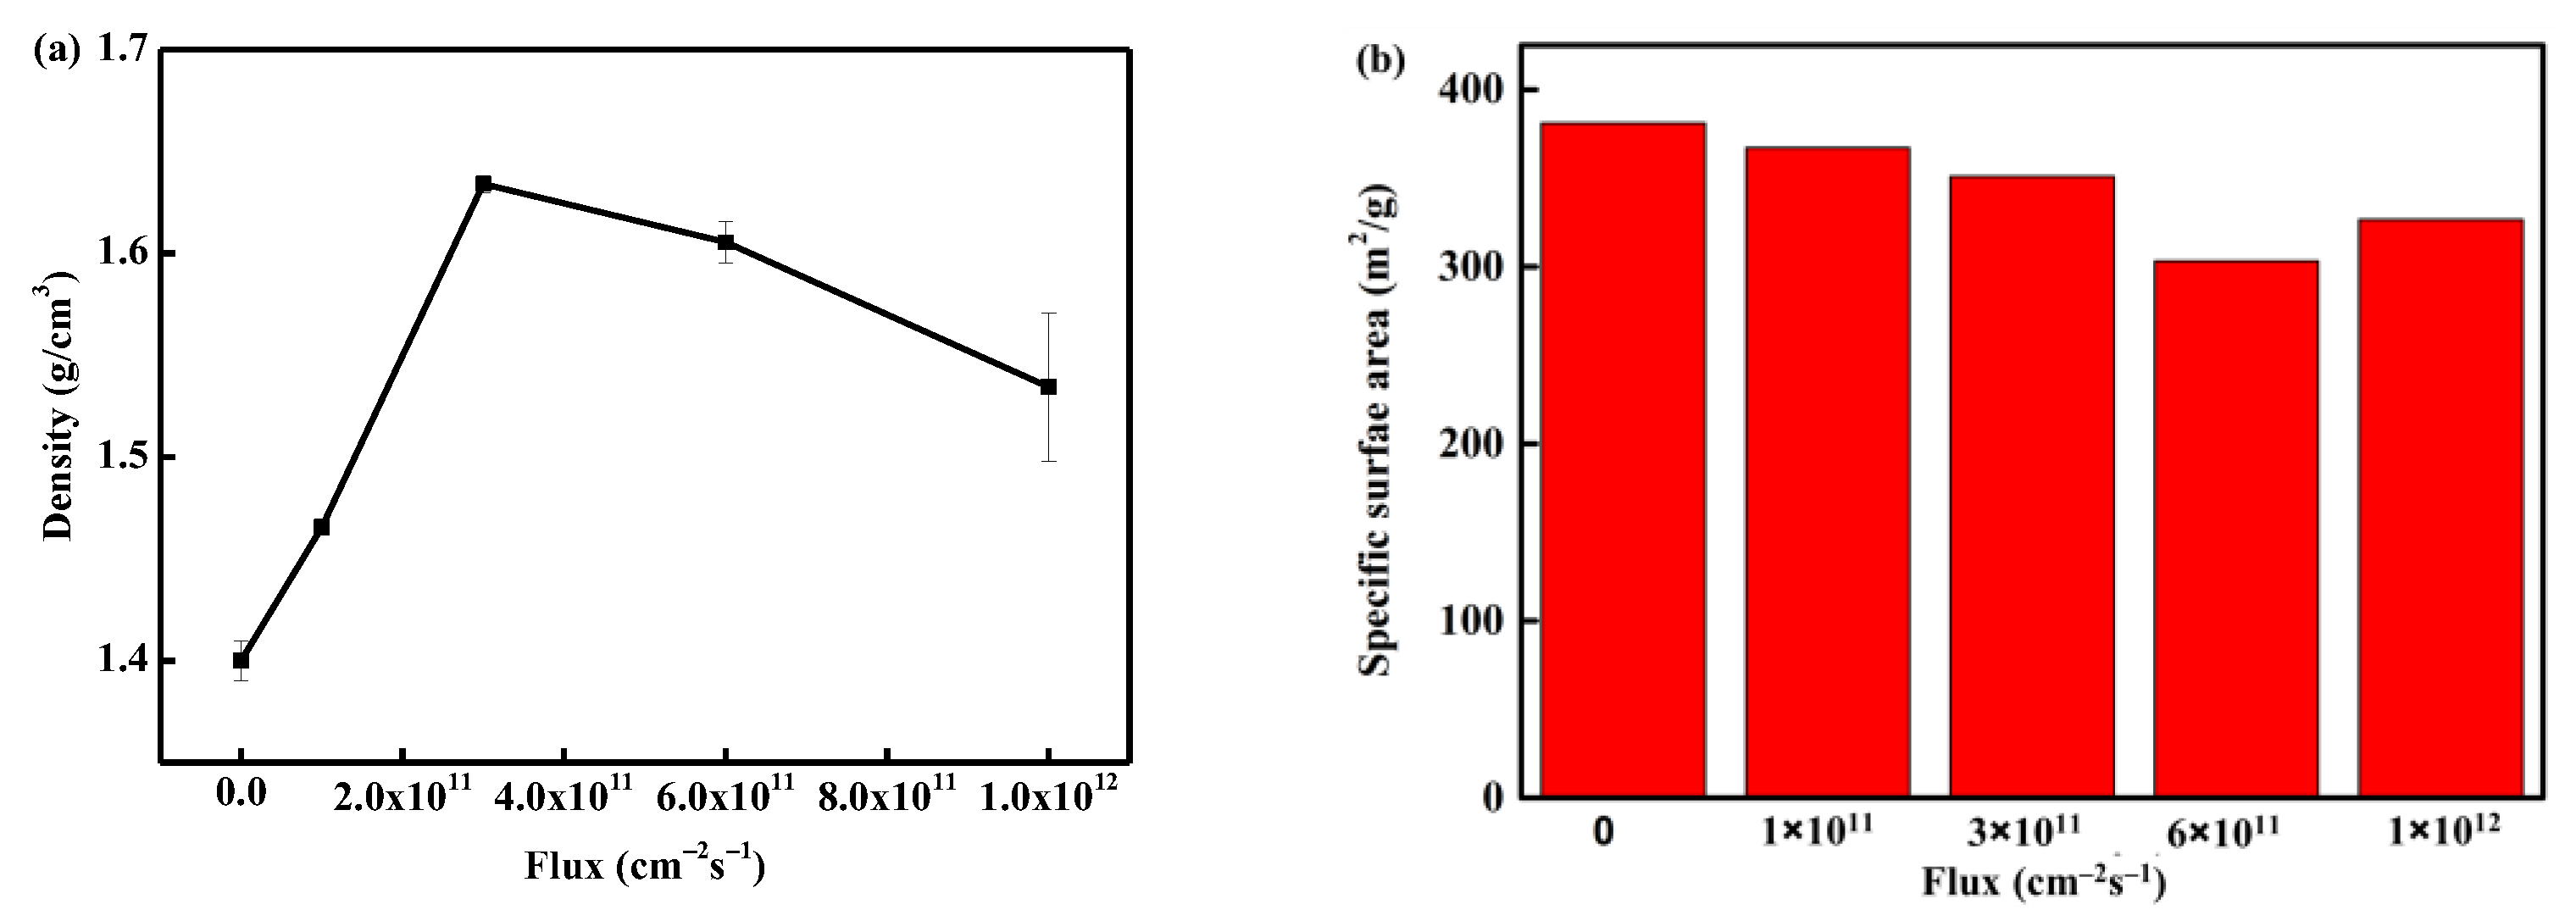
3.2. The Influence of Irradiation Flux on Discharge Behavior
3.3. The Influence of Residual Gas on Discharge Behavior
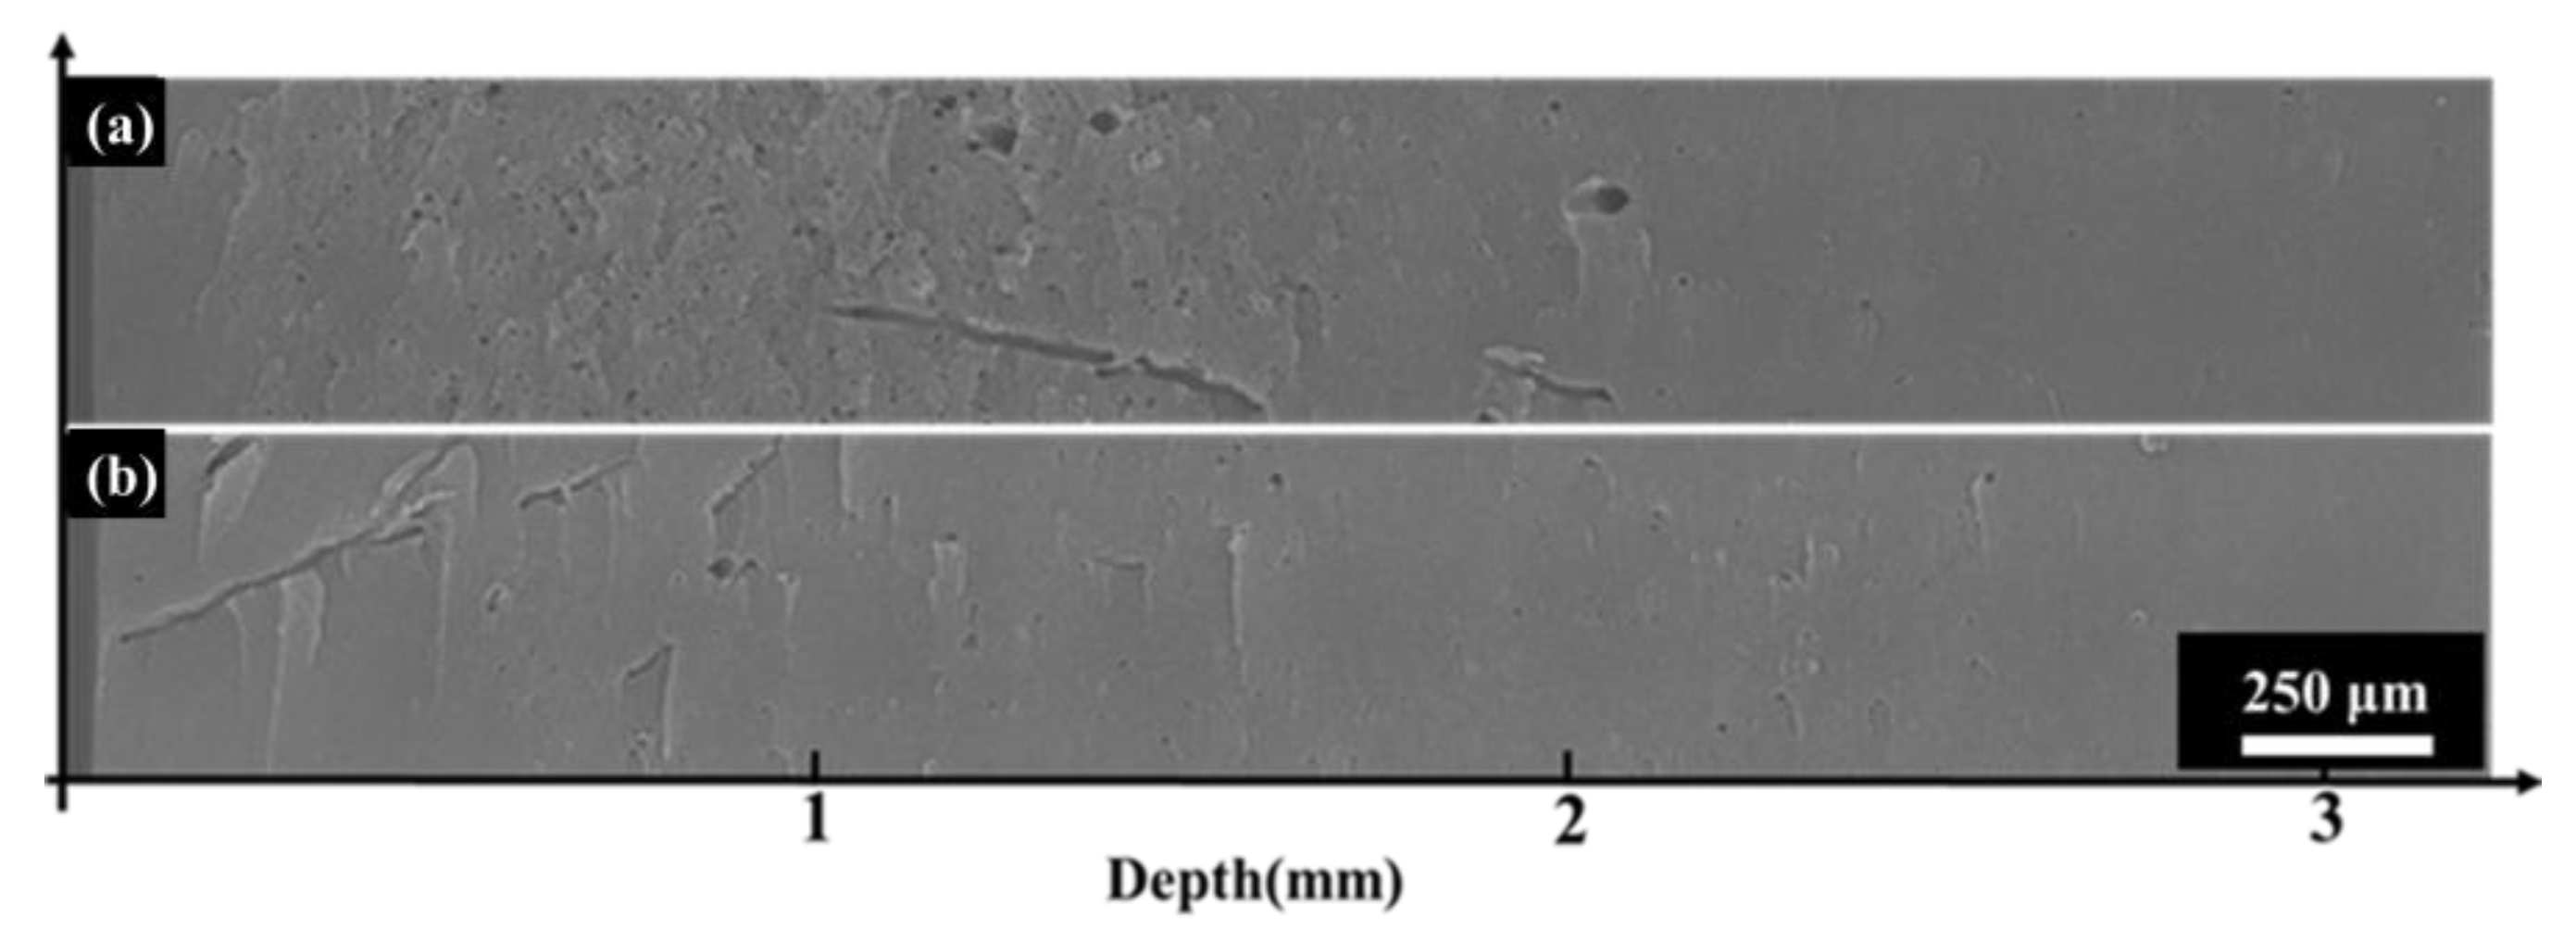
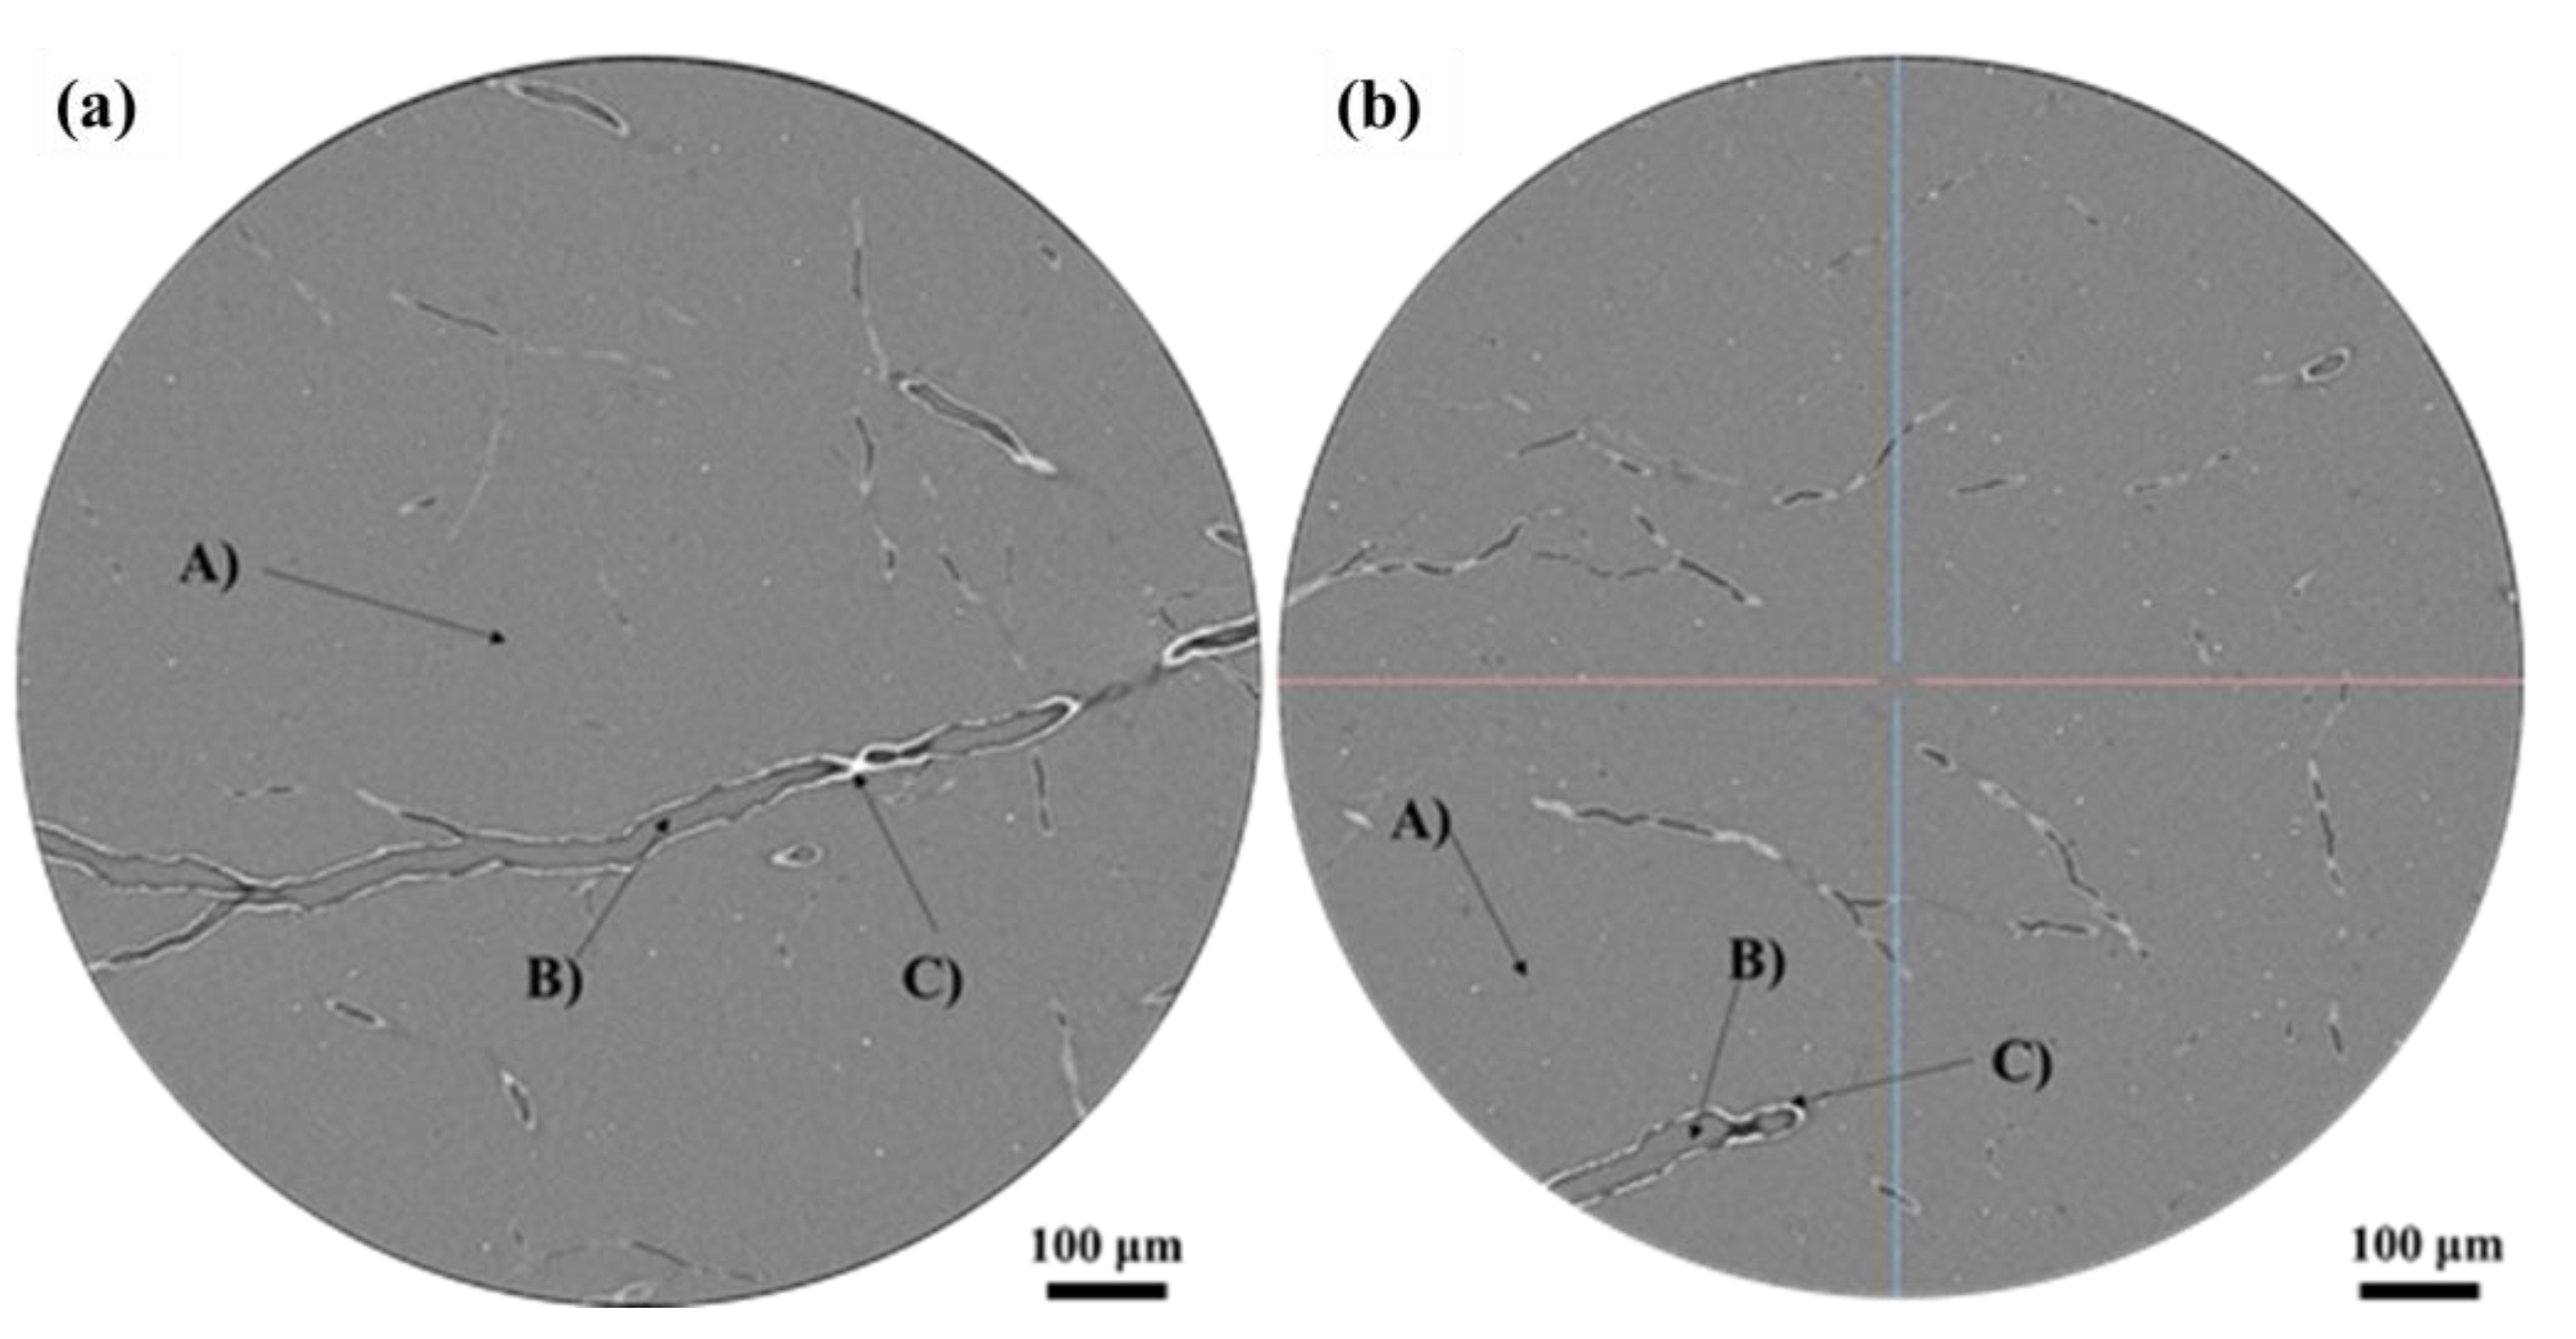
3.4. Analysis of Discharge Channel Anisotropy
3.5. Discussion of Discharge Mechanism
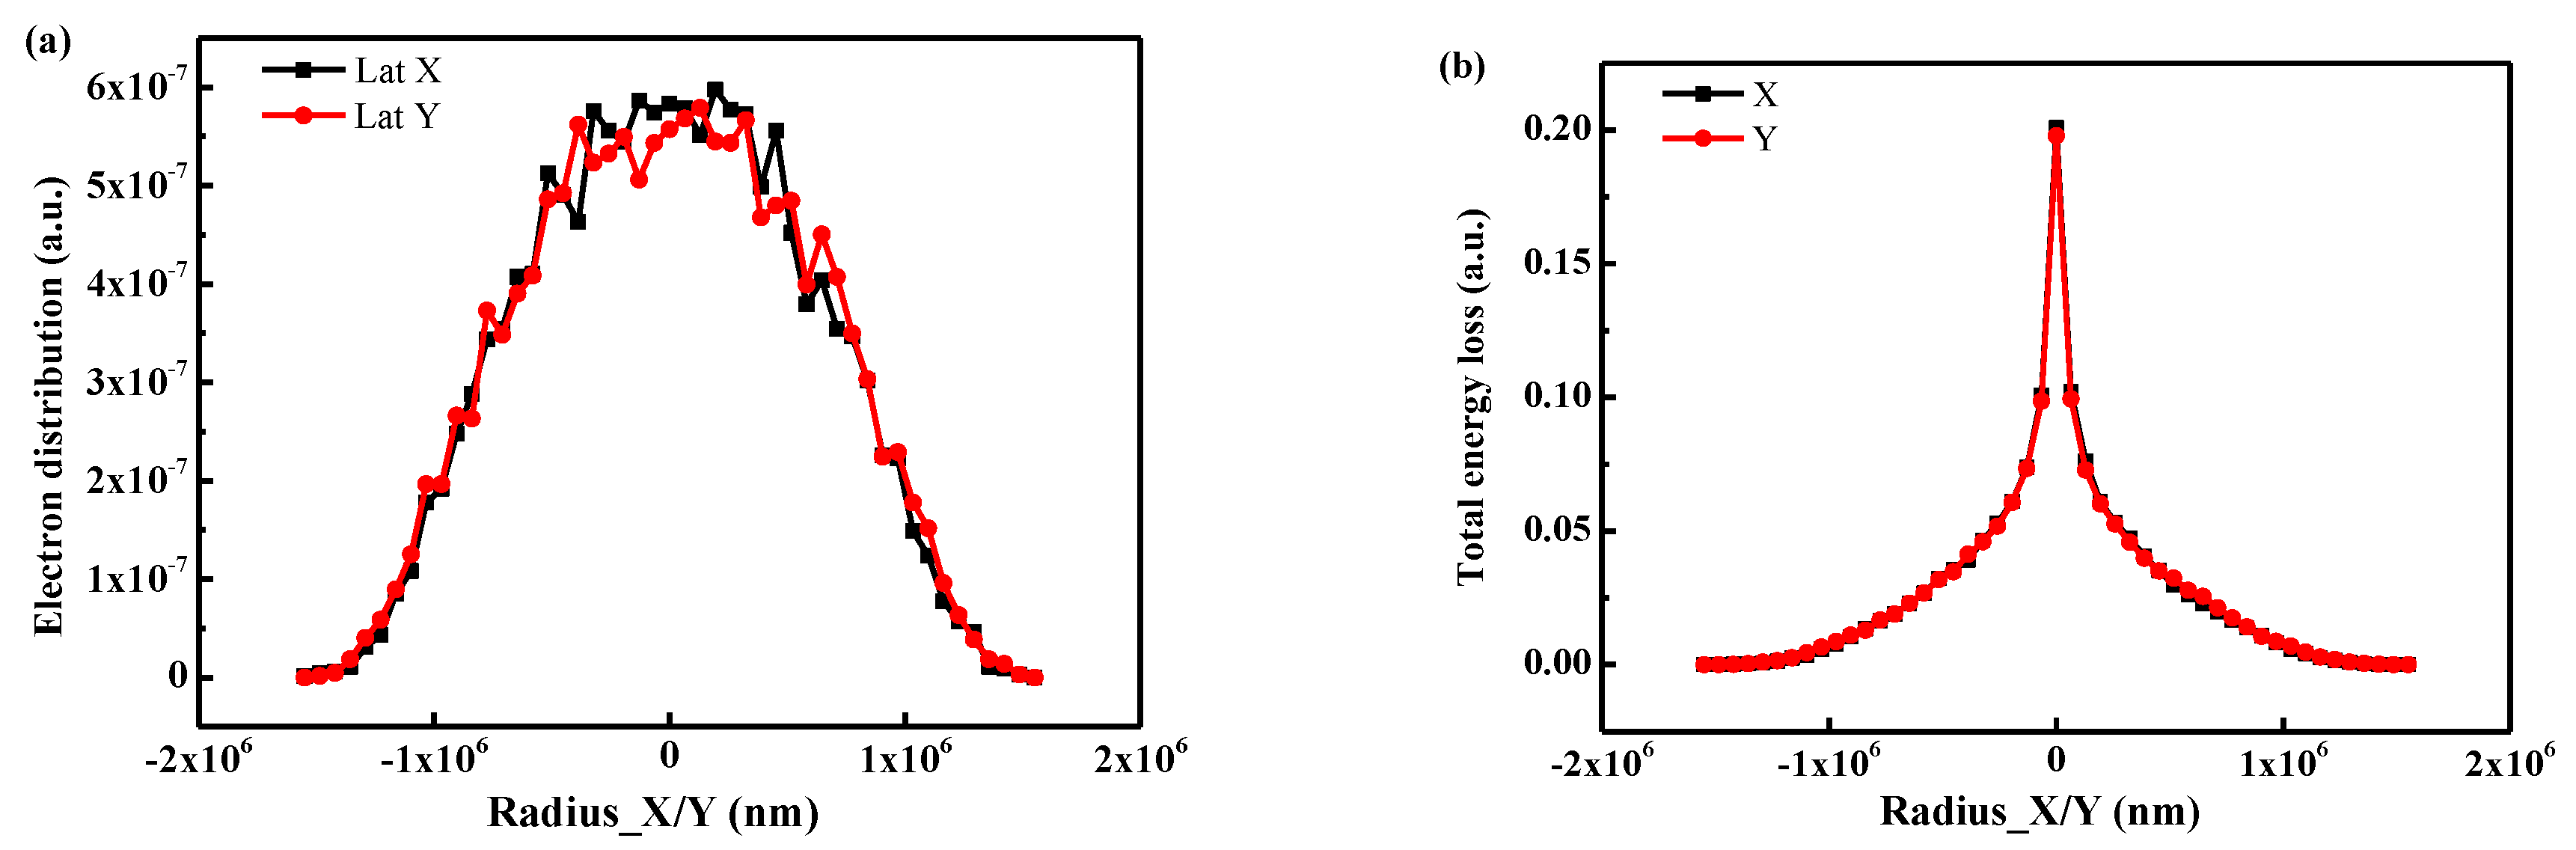
3.5.1. The Simulation of Electron Transport Behavior into Nanoporous Polyimide
3.5.2. Mechanisms of Flux Influence on Discharge Behaviors
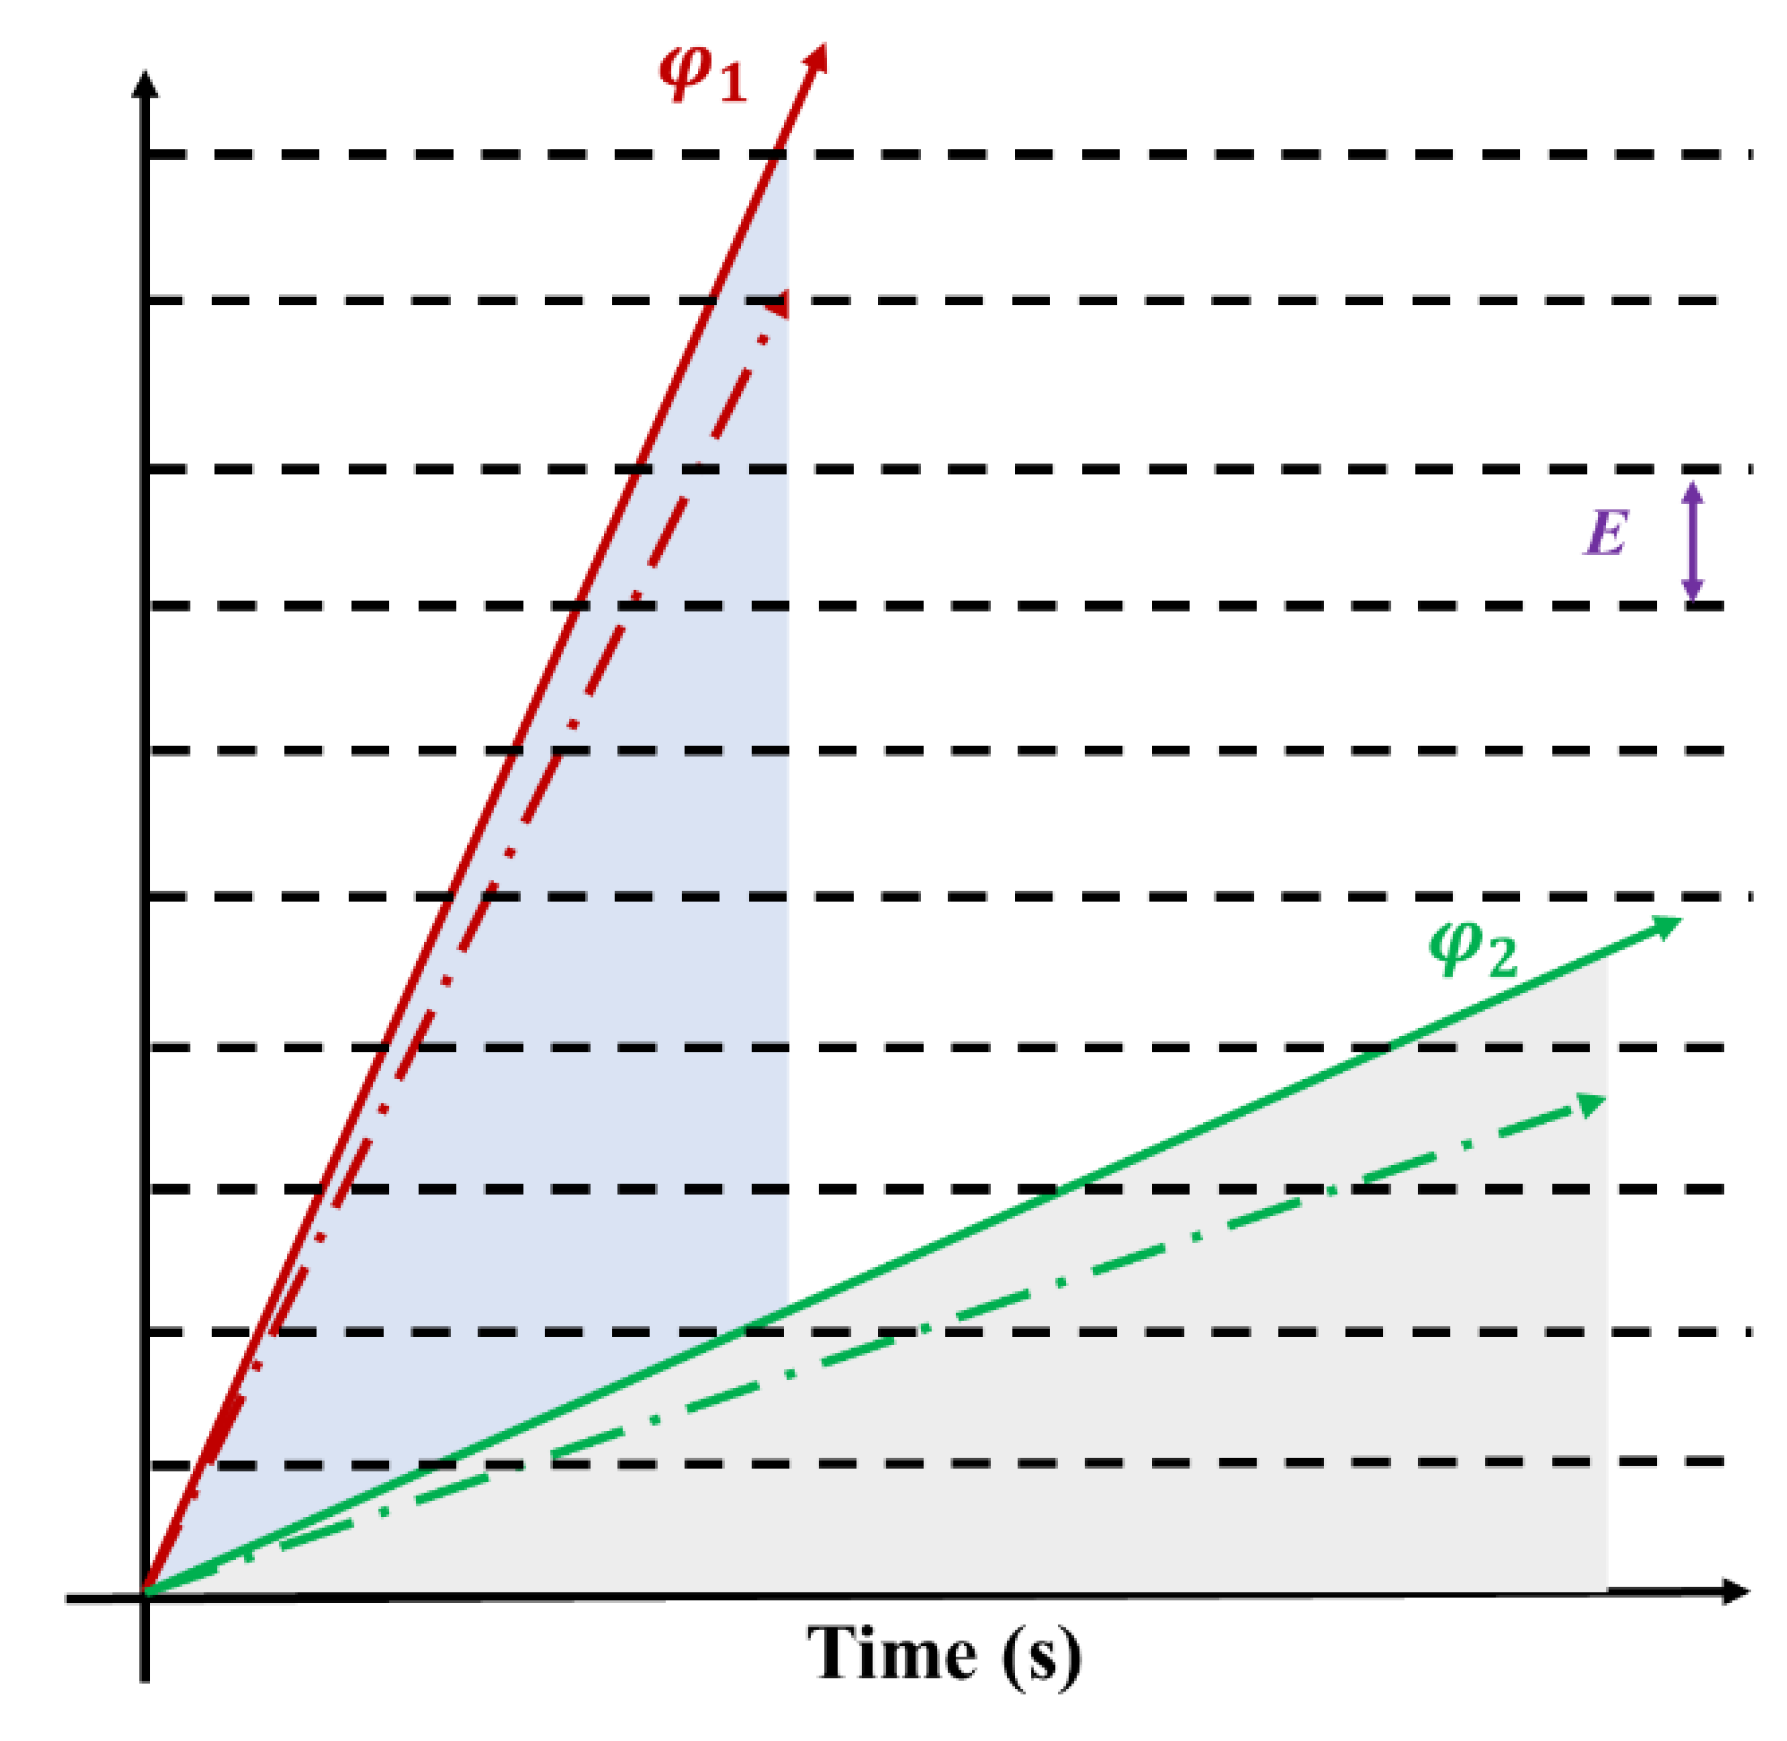
- (1)
- For a given incident electron energy, its transport behavior in the material is determined. With a fixed number of incident electrons (200,000 in this case), the difference in secondary electrons between point U and point V is 53,258 in Figure 16c; this implies that, for every 100 incident electrons, there is a difference of 26 electrons between U and V. The amount of secondary electron deposition at points U and V is proportional to the number of incident electrons.
- (2)
- When secondary electrons are deposited into the nano-skeleton, the annihilation rate remains constant (denoted as k) and does not change with the flux.
- (3)
- The local charge difference between points U and V equals the difference between the secondary electrons and the annihilation part.
- (4)
- The breakdown strength of the material is denoted as E. When the electric field strength at points U and V equals the breakdown strength E, discharge occurs and the accumulated charge on the skeleton is completely released.
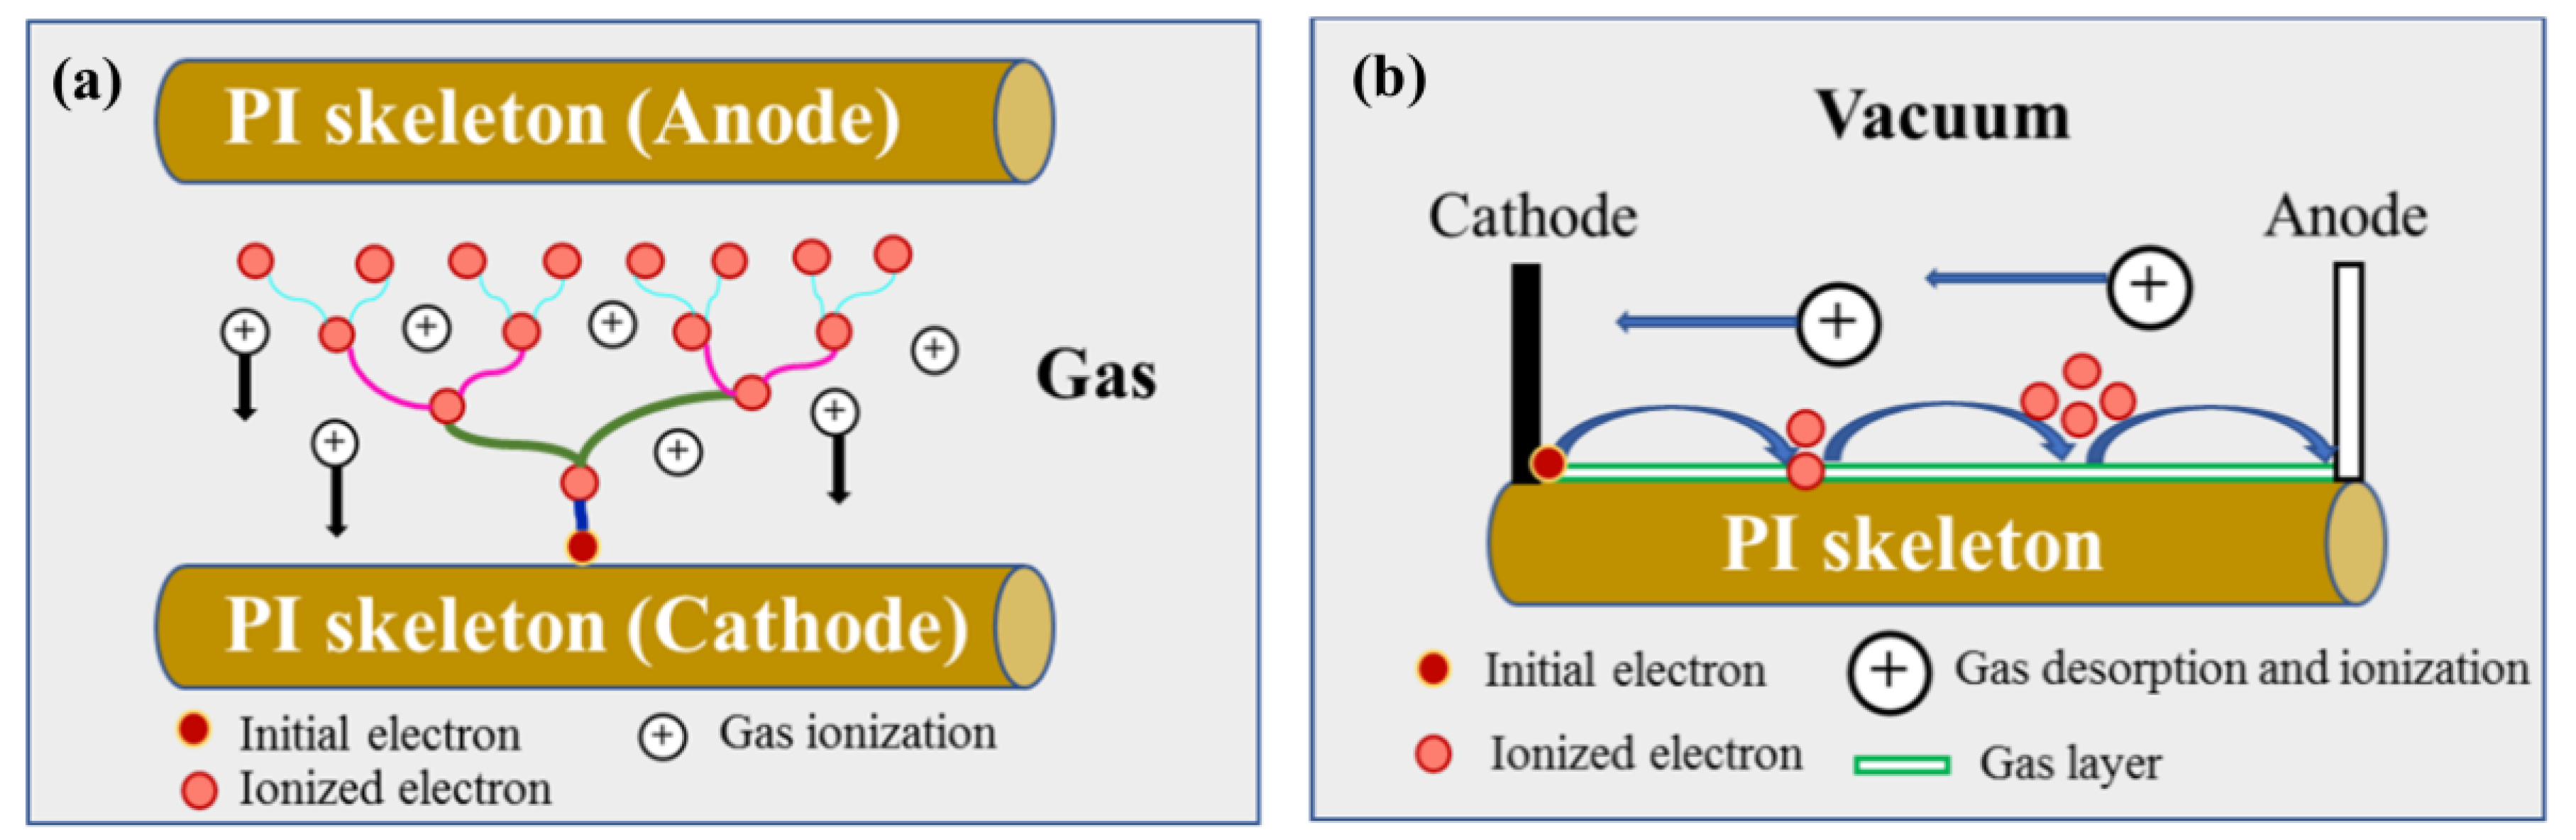
3.5.3. Discharge Mechanism Analysis
4. Conclusions
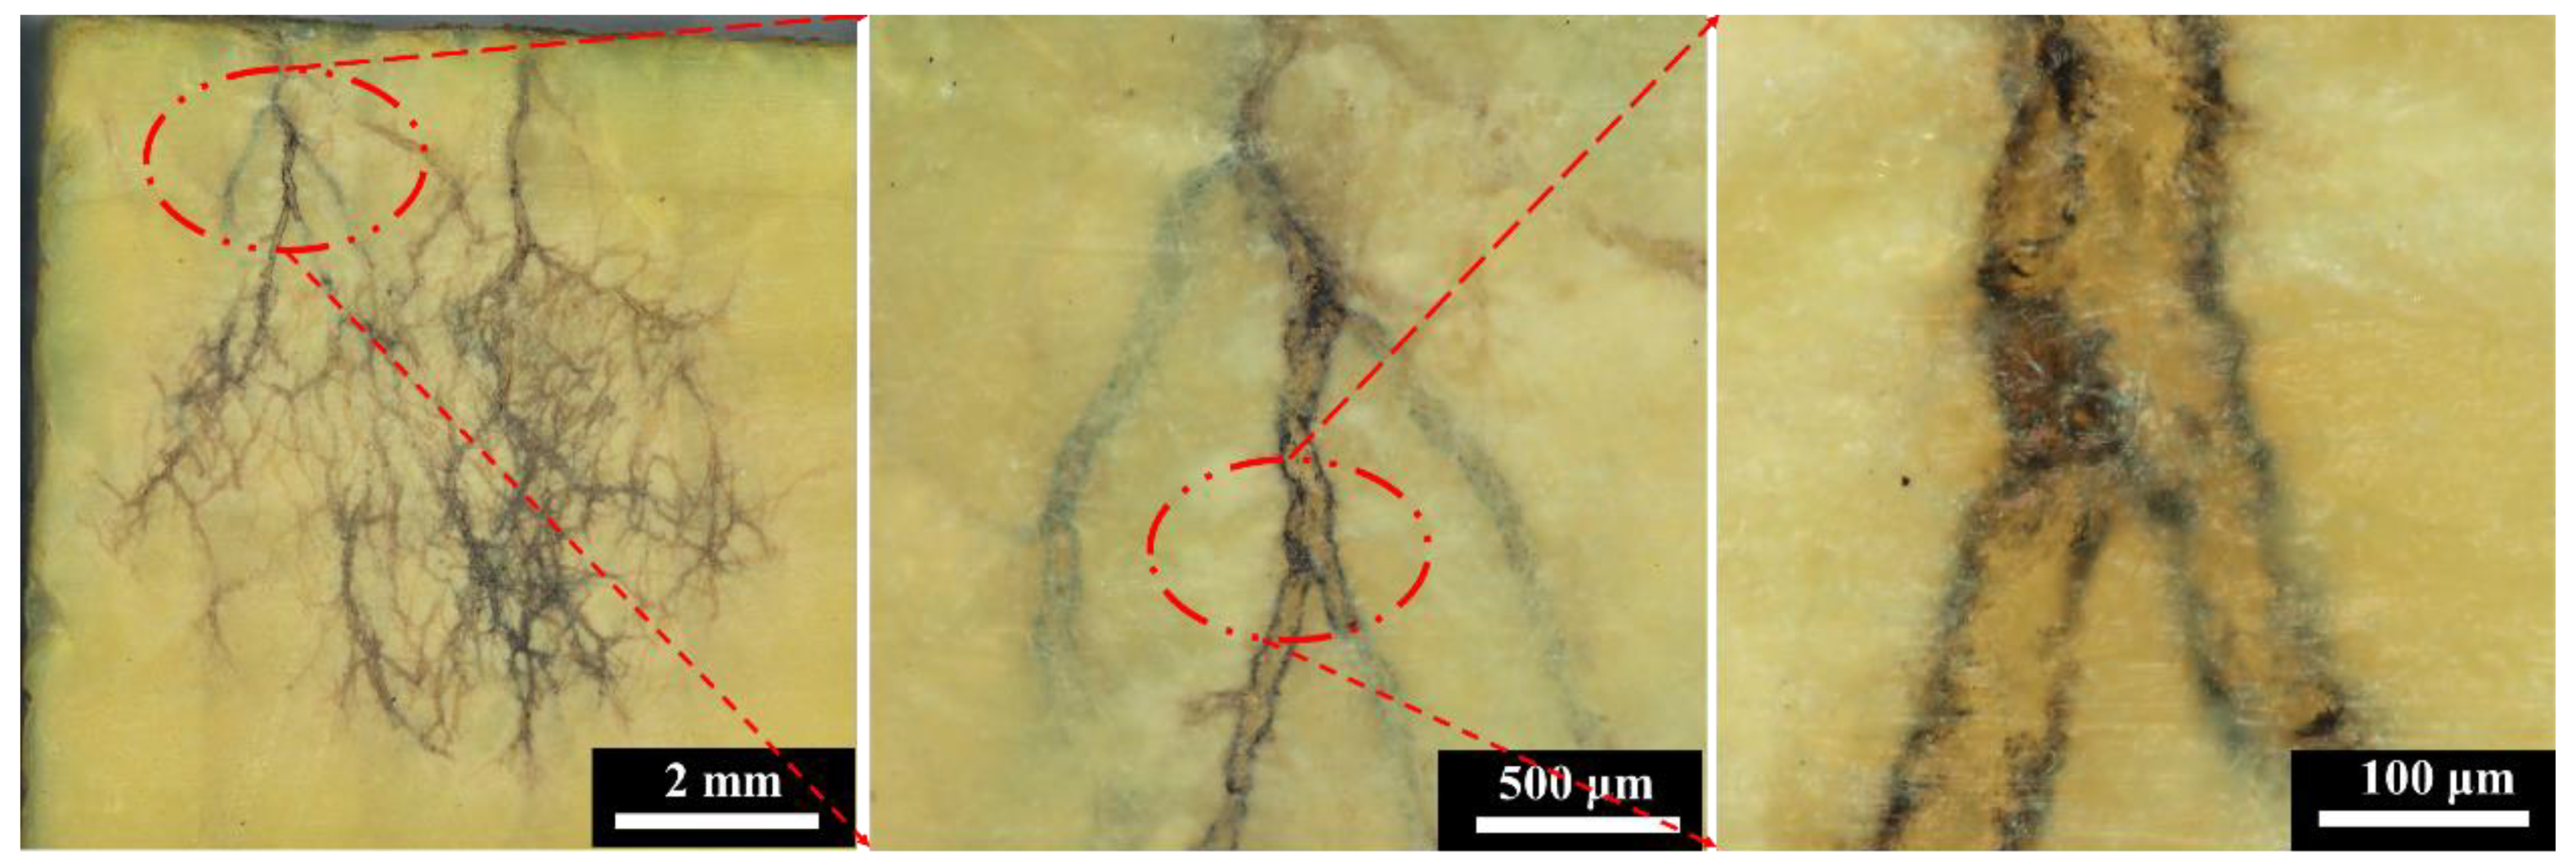
- The electron irradiation induces internal discharge in the PI aerogel, forming dendritic discharge channels and micrometer-scale pores. The specific surface area decreases with the increase of fluence and flux. Dense tissue forms around the discharge channel due to the welding effect during the discharge process. Higher flux increases the discharge risk by creating more discharge paths. Moreover, the degree of discharge and the discharge type are related to the internal residual gas content. Greater residual gas leads to a more severe discharge phenomenon.
- The transport behaviors of electron in nanoporous matter were investigated, revealing local inhomogeneity in electron distribution due to the presence of voids. The incident electron number initially increases to a peak, then decreases to a valley, and continues to distribute along the depth. The distance between adjacent peaks and valleys exhibits periodicity. The non-uniformity distribution of the incident electrons is influenced by nanoporous geometry, resulting in an extremely high electrical potential (up to 8.5 × 10¹⁰ V/m), surpassing the breakdown strength (2 × 10⁸ V/m) of bulk polyimide materials.
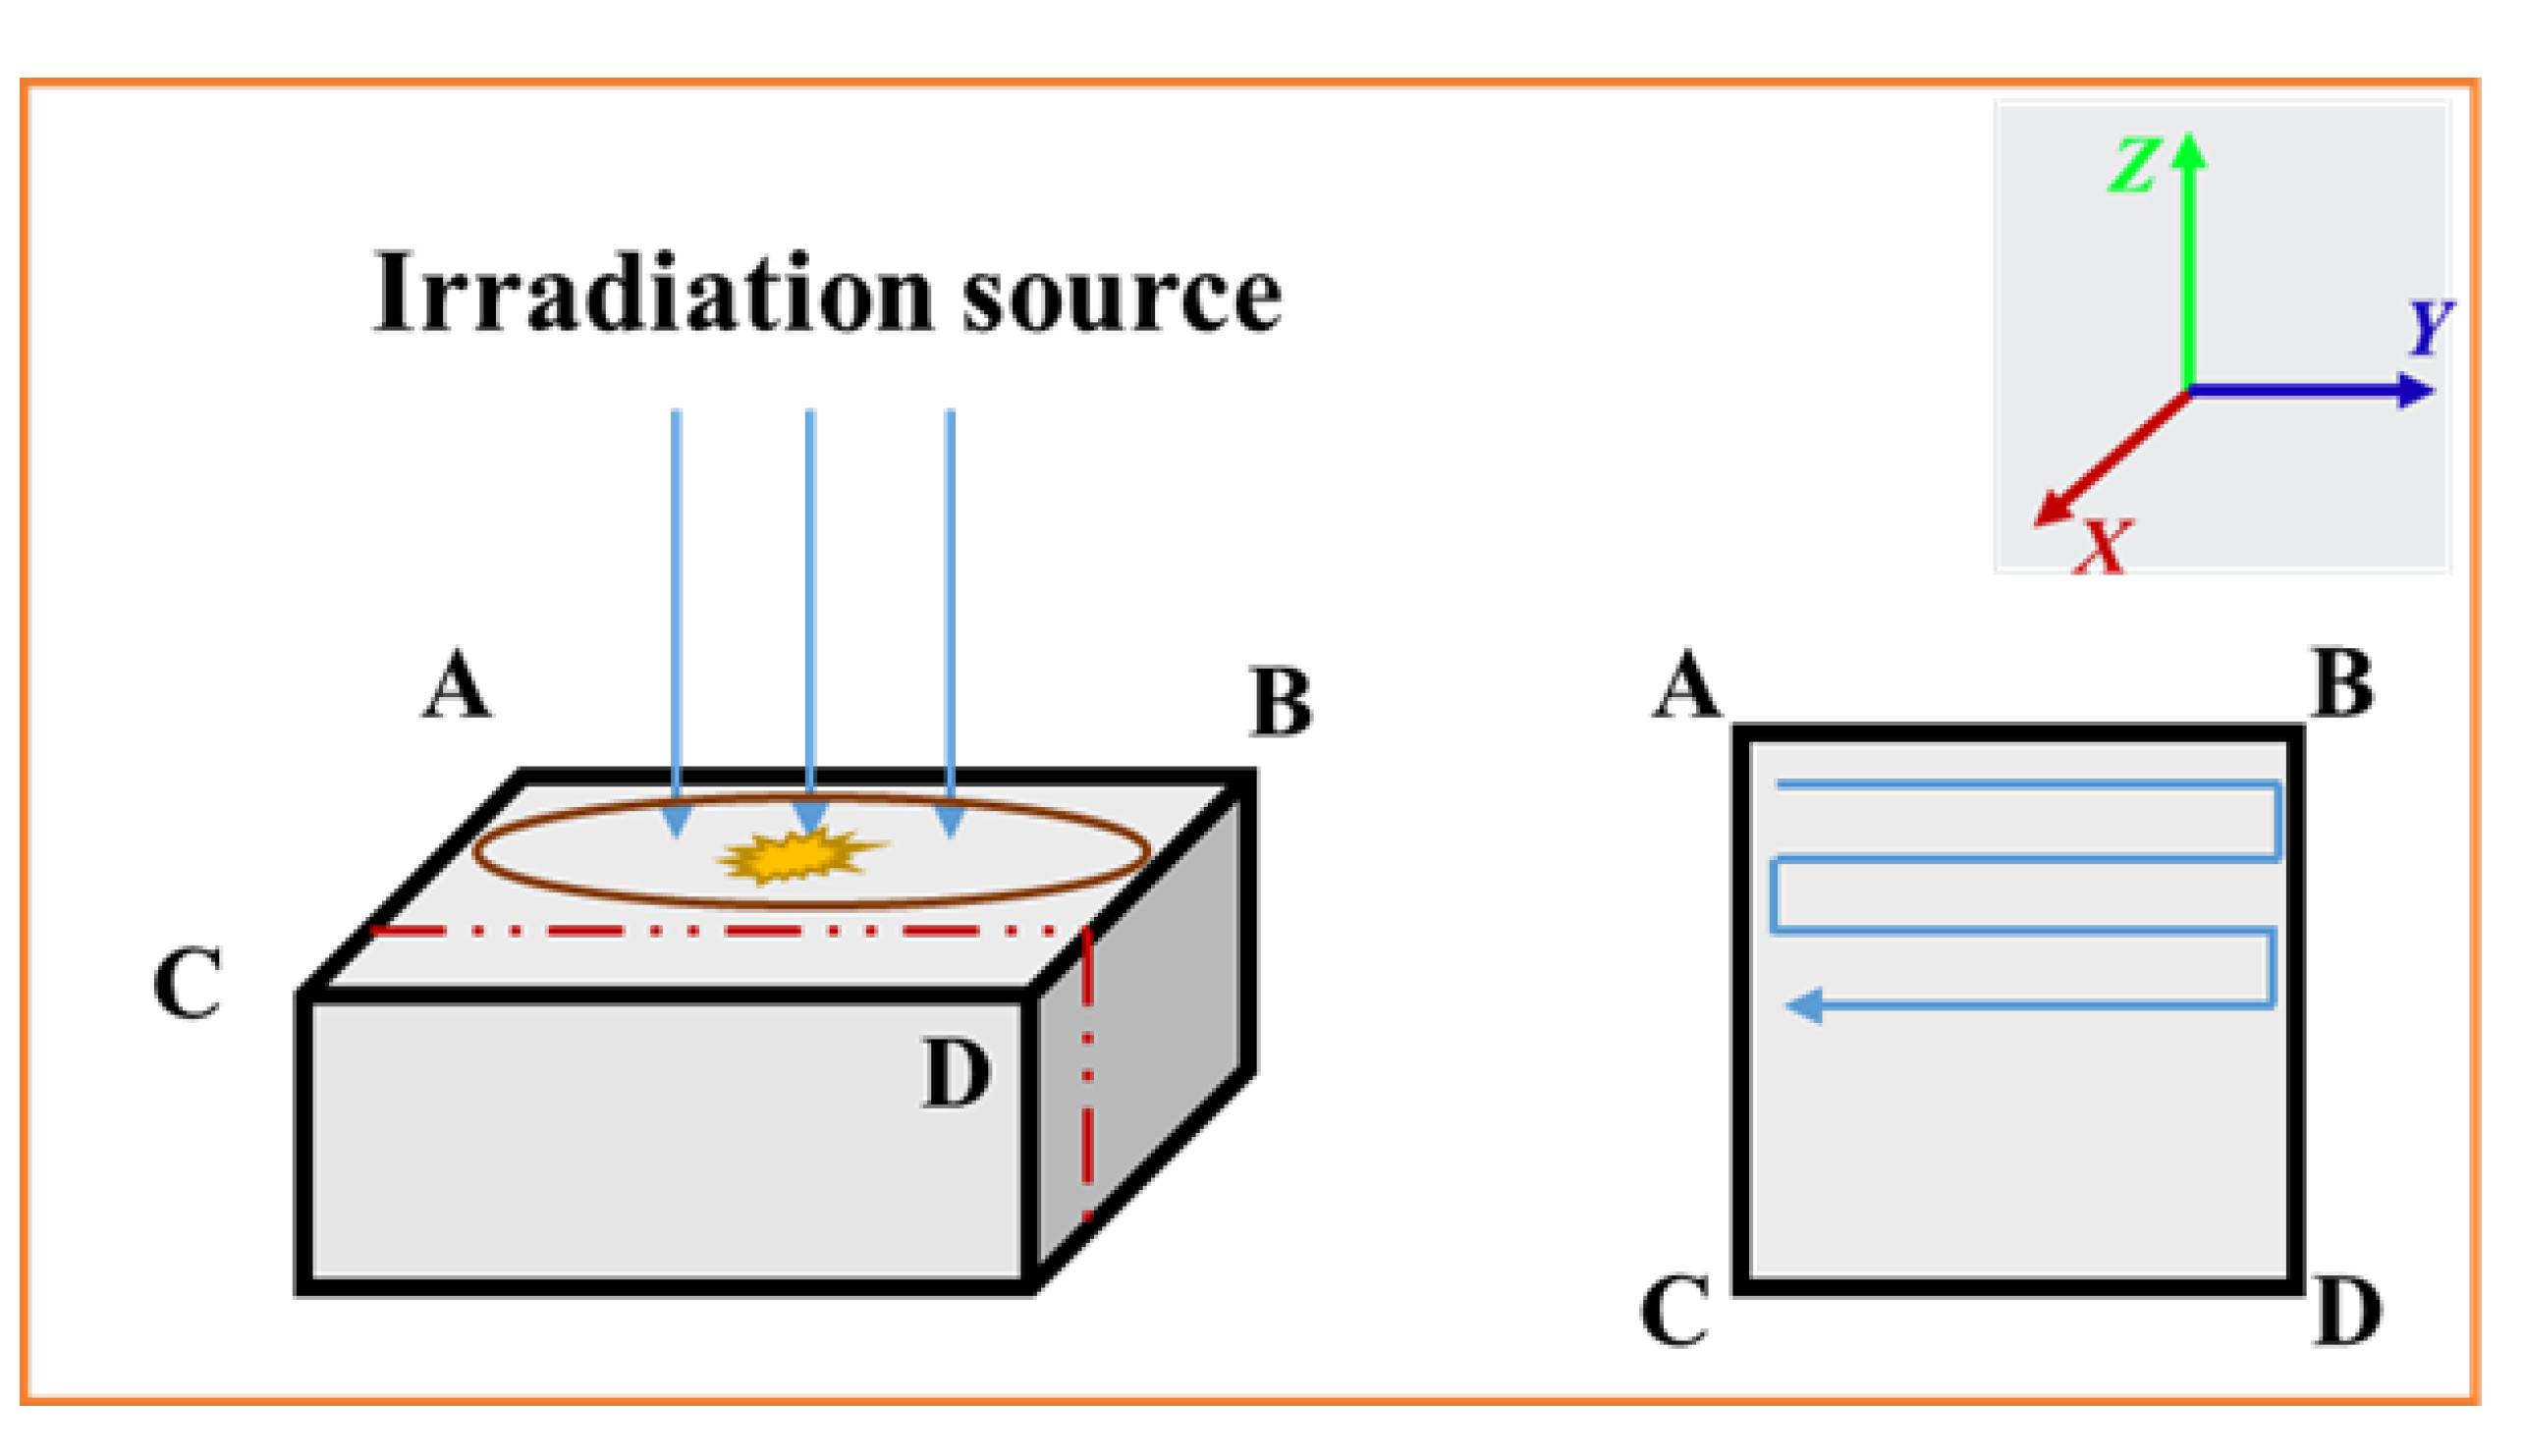
- The anisotropy discharge channels form after electron irradiation, attributed to the scanning mode of electron control. The Z-shaped scanning mode introduces a time difference in the charge accumulation process. Under identical incident electron energy and fluence, higher flux accelerates charge deposition, facilitates charge difference establishment, and shortens the time to reach the discharge threshold. Consequently, higher flux exacerbates discharge damage.
Author Contributions
Funding
Institutional Review Board Statement
Data Availability Statement
Conflicts of Interest
References
- Beyerlein, I.J.; Caro, A.; Demkowicz, M.J.; Mara, N.A.; Misra, A.; Uberuaga, B.P. Radiation damage tolerant nanomaterials. Mater. Today 2013, 16, 443–449. [Google Scholar] [CrossRef]
- Hou, L.; Wu, Y.; Xiao, J.; Guo, B.; Zong, Y. Degeneration and damage mechanism of epoxy-based shape memory polymer under 170 keV vacuum proton irradiation. Polym. Degrad. Stab. 2019, 166, 8–16. [Google Scholar] [CrossRef]
- Du, A.; Zhou, B.; Zhang, Z.; Shen, J. A Special Material or a New State of Matter: A Review and Reconsideration of the Aerogel. Materials 2013, 6, 941–968. [Google Scholar] [CrossRef] [PubMed]
- Xu, X.; Zhang, Q.; Hao, M.; Hu, Y.; Lin, Z.; Peng, L.; Wang, T.; Ren, X.; Wang, C.; Zhao, Z.; et al. Double-negative-index ceramic aerogel for thermal superinsulation. Science 2019, 363, 723–727. [Google Scholar] [CrossRef] [PubMed]
- Randall, J.P.; Meador, M.A.; Jana, S.C. Tailoring mechanical properties of aerogels for aerospace applications. ACS Appl. Mater. Interfaces 2011, 3, 613–626. [Google Scholar] [CrossRef] [PubMed]
- Jones, S.M. Aerogel: Space exploration applications. J. Sol-Gel Sci. Technol. 2006, 40, 351–357. [Google Scholar] [CrossRef]
- Guo, H.; Meador, M.A.; McCorkle, L.; Quade, D.J.; Guo, J.; Hamilton, B.; Cakmak, M. Tailoring properties of cross-linked polyimide aerogels for better moisture resistance, flexibility, and strength. ACS Appl. Mater. Interfaces 2012, 4, 5422–5429. [Google Scholar] [CrossRef]
- Guo, H.; Dewey, O.S.; McCorkle, L.S.; Meador, M.A.B.; Pasquali, M. Polyimide Aerogels as Lightweight Dielectric Insulators for Carbon Nanotube Cables. ACS Appl. Polym. Mater. 2019, 1, 1680–1688. [Google Scholar] [CrossRef]
- Pantoja, M.; Boynton, N.; Cavicchi, K.A.; Dosa, B.; Cashman, J.L.; Meador, M.A.B. Meador, Increased Flexibility in Polyimide Aerogels Using Aliphatic Spacers in the Polymer Backbone. ACS Appl. Mater. Interfaces 2019, 11, 9425–9437. [Google Scholar] [CrossRef]
- Meador, M.A.; Wright, S.; Sandberg, A.; Nguyen, B.N.; Van Keuls, F.W.; Mueller, C.H.; Rodriguez-Solis, R.; Miranda, F.A. Low dielectric polyimide aerogels as substrates for lightweight patch antennas. ACS Appl. Mater. Interfaces 2012, 4, 6346–6353. [Google Scholar] [CrossRef]
- Sun, C.; Wu, Y.; Yue, L.; Shi, Y.; Xiao, J. Investigation on the recombination kinetics of the pyrolytic free-radicals in the irradiated polyimide. Nucl. Instrum. Methods Phys. Res. Sect. B 2012, 271, 61–64. [Google Scholar] [CrossRef]
- Sun, C.; Wu, Y.; Xiao, J.; Li, R.; Yang, D.; He, S. Pyrolytic-carbon free–radical evolution and irradiation damage of polyimide under low energy proton-irradiation. J. Appl. Phys. 2011, 110, 124909. [Google Scholar] [CrossRef]
- Kang, P.-H.; Jeon, Y.-K.; Jeun, J.-P.; Shin, J.-W.; Nho, Y.-C. Effect of electron beam irradiation on polyimide film. J. Ind. Eng. Chem. 2008, 14, 672–675. [Google Scholar] [CrossRef]
- Alegaonkar, P.S.; Bhoraskar, V.N. Effect of MeV electron irradiation on the free volume of polyimide. Radiat. Eff. Defects Solids 2004, 159, 511–516. [Google Scholar] [CrossRef]
- Dong, S.-S.; Shao, W.-Z.; Yang, L.; Ye, H.-J.; Zhen, L. Microstructure evolution of polyimide films induced by electron beam irradiation-load coupling treatment. Polym. Degrad. Stab. 2018, 155, 230–237. [Google Scholar] [CrossRef]
- Mishra, R.; Tripathy, S.P.; Dwivedi, K.K.; Khathing, D.T.; Ghosh, S.; Müller, M.; Fink, D. Spectroscopic and thermal studies of electron irradiated polyimide. Radiat. Measur. 2003, 36, 621–624. [Google Scholar] [CrossRef]
- Yue, L.; Wu, Y.; Sun, C.; Xiao, J.; Shi, Y.; Ma, G.; He, S. Investigation on the radiation induced conductivity of space-applied polyimide under cyclic electron irradiation. Nucl. Instrum. Methods Phys. Res. Sect. B Beam Interact. Mater. At. 2012, 291, 17–21. [Google Scholar] [CrossRef]
- Wu, Y.; Ju, D.; Wang, H.; Sun, C.; Wu, Y.; Cao, Z.; Tolochko, O.V. Simulation of the Particle Transport Behaviors in Nanoporous Matter. Polymers 2022, 14, 3563. [Google Scholar] [CrossRef]
- Wu, Y.; Ju, D.; Wang, H.; Zhao, H.; Sun, C.; Wu, Y.; Guo, B.; Wang, Y. Modification of surface structure and mechanical properties in polyimide aerogel by low-energy proton implantation. Surf. Coat. Technol. 2020, 403, 126364. [Google Scholar] [CrossRef]
- Wu, Y.; Ju, D.; Liu, Y.; Zhao, H.; Wang, H.; Sun, C.; Wu, Y.; Cao, Z.; Guo, B. Evaluation of radiation damage behavior in polyimide aerogel by infrared camera and photoacoustic spectroscopy. Polym. Test. 2020, 85, 106405. [Google Scholar]
- Fang, G.; Li, H.; Liu, J.; Ni, H.; Yang, H.; Yang, S. Intrinsically Atomic-oxygen-resistant POSS-containing Polyimide Aerogels: Synthesis and Characterization. Chem. Lett. 2015, 44, 1083–1085. [Google Scholar] [CrossRef]
- Dissado, L.A.; Fothergill, J.C. Stevens, Electrical Degradation and Breakdown in Polymers; The Institution of Engineering and Technology: London, UK, 1992. [Google Scholar]
- Iizuka, T.T.T. Generic PD Resistance Characteristics of Polymer Nanocomposites. In Proceedings of the 2010 Annual Report Conference on Electrical Insulation and Dielectic Phenomena, West Lafayette, IN, USA, 17–20 October 2010. [Google Scholar]
- ASTM E1559-09(2022); Standard Test Method for Contamination Outgassing Characteristics of Spacecraft Materials. ASTM International: West Conshohocken, PA, USA, 2022.
- Diaham, S.Z.S.; Locatelli, M.-L.; Dinculescu, S.; Decup, M.; Lebey, T. Dielectric Breakdown of Polyimide Films: Area, Thickness and Temperature Dependence. IEEE Trans. Dielectr. Electr. Insul. 2010, 17, 18–27. [Google Scholar] [CrossRef]


| Electron Energy (keV) | Fluence (cm−2) | Flux (cm−2s−1) | Sample Size (mm × mm × mm) | Pumping Time (h) |
|---|---|---|---|---|
| 170 | 2 × 10¹⁵ | 1 × 10¹² | 20 × 20 × 5 | 0.5 |
| 9 | ||||
| 90 | 2 × 10¹⁴ | 1 × 10¹² | 10 × 10 × 2 | 3 |
| 5 × 10¹⁴ | ||||
| 1 × 10¹⁵ | ||||
| 2 × 10¹⁵ | ||||
| 90 | 2 × 10¹⁵ | 1 × 10¹¹ | 10 × 10 × 2 | 3 |
| 3 × 10¹¹ | ||||
| 6 × 10¹¹ |
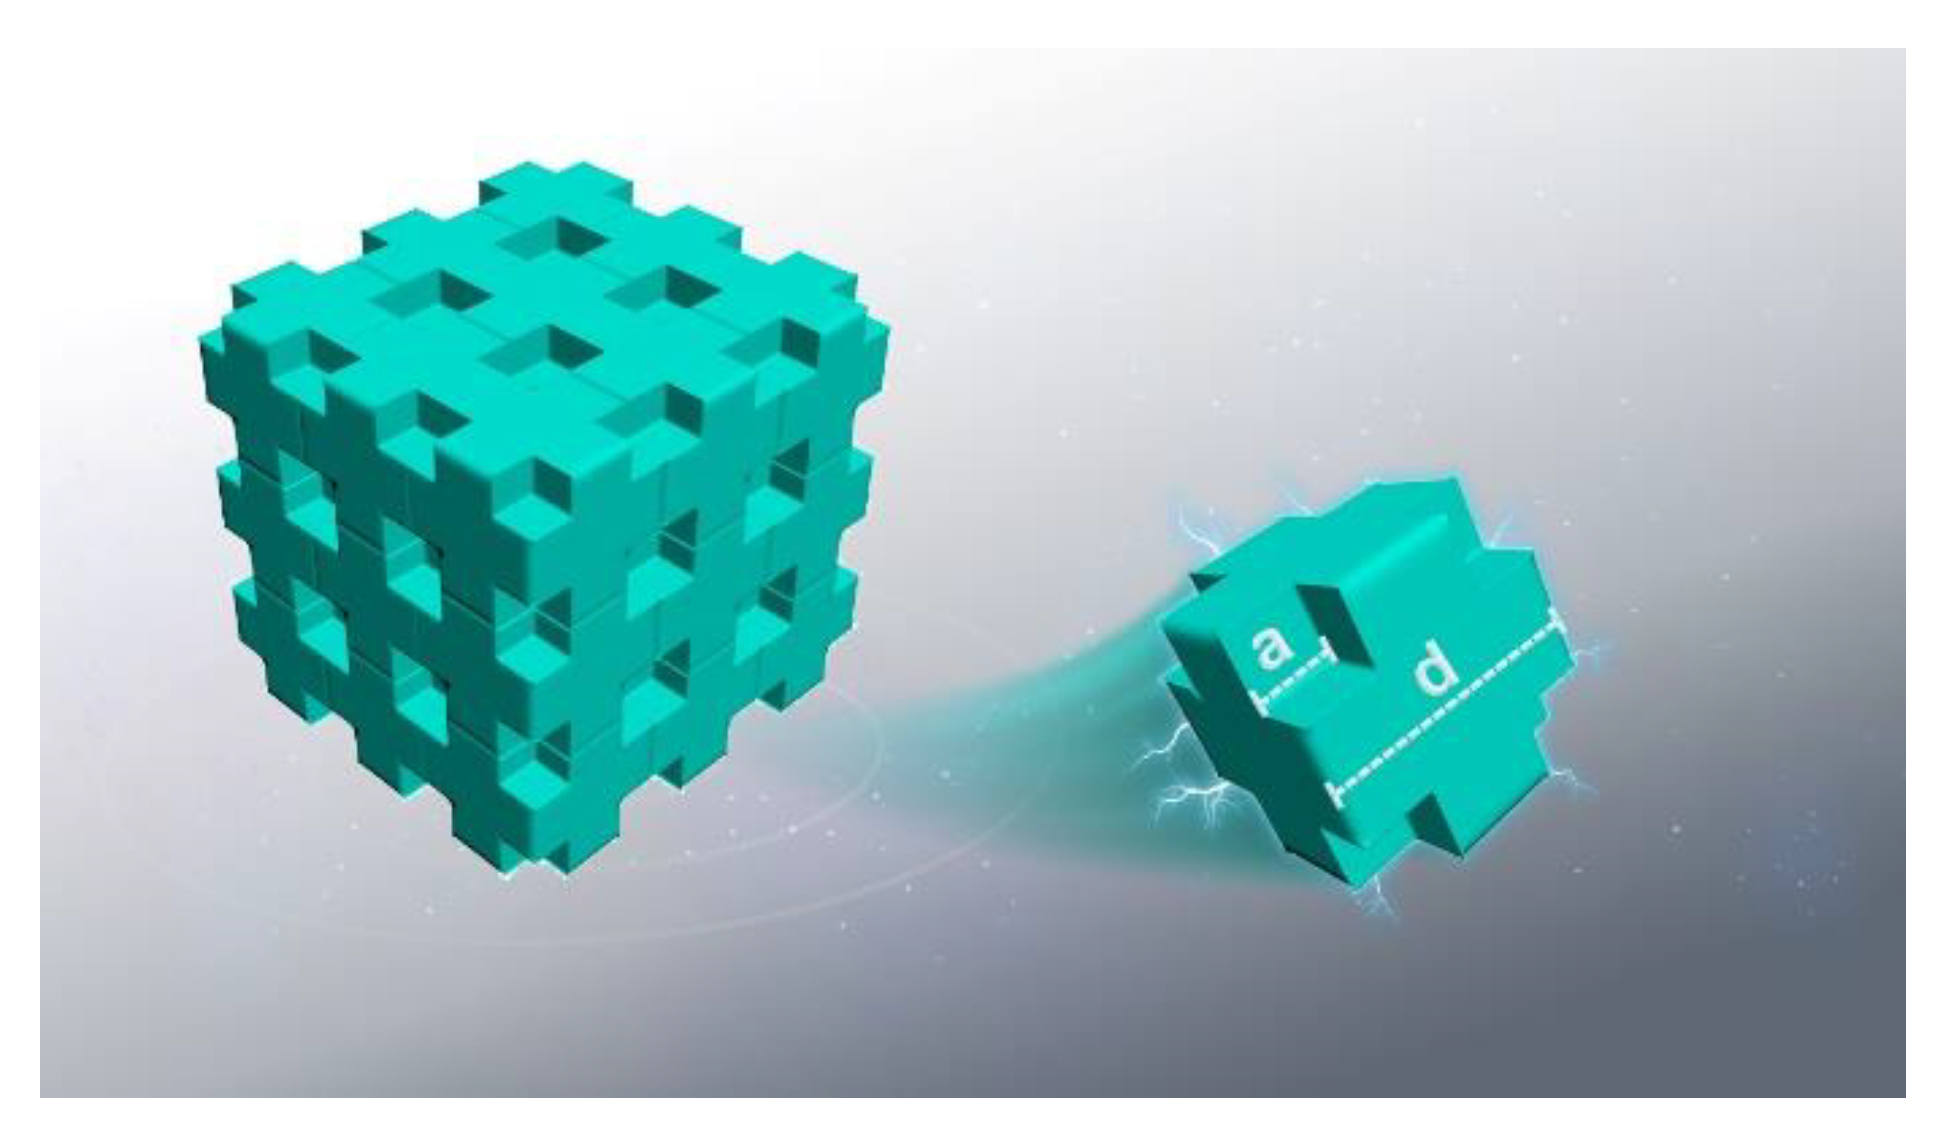
| a (nm) | d (nm) | Porosity |
|---|---|---|
| 50 | 102 | 94% |
| 50 | 105 | 86% |
| 50 | 110 | 75% |
| 50 | 138 | 38% |
Disclaimer/Publisher’s Note: The statements, opinions and data contained in all publications are solely those of the individual author(s) and contributor(s) and not of MDPI and/or the editor(s). MDPI and/or the editor(s) disclaim responsibility for any injury to people or property resulting from any ideas, methods, instructions or products referred to in the content. |
© 2024 by the authors. Licensee MDPI, Basel, Switzerland. This article is an open access article distributed under the terms and conditions of the Creative Commons Attribution (CC BY) license (https://creativecommons.org/licenses/by/4.0/).
Share and Cite
Ju, D.; Wu, Y.; Wang, H.; Sun, C.; Wu, Y.; Cao, Z.; Wang, X.; Jing, G.; Li, C. The Discharge Behavior and Mechanism of Polyimide Aerogel under Electron Irradiation. Polymers 2024, 16, 773. https://doi.org/10.3390/polym16060773
Ju D, Wu Y, Wang H, Sun C, Wu Y, Cao Z, Wang X, Jing G, Li C. The Discharge Behavior and Mechanism of Polyimide Aerogel under Electron Irradiation. Polymers. 2024; 16(6):773. https://doi.org/10.3390/polym16060773
Chicago/Turabian StyleJu, Dandan, You Wu, Hao Wang, Chengyue Sun, Yiyong Wu, Zhengli Cao, Xueqiang Wang, Guiru Jing, and Changjiang Li. 2024. "The Discharge Behavior and Mechanism of Polyimide Aerogel under Electron Irradiation" Polymers 16, no. 6: 773. https://doi.org/10.3390/polym16060773