

Effect of Starch and Paperboard Reinforcing Structures on Insulative Fiber Foam Composites

 , ,
, ,  ,
,
Abstract
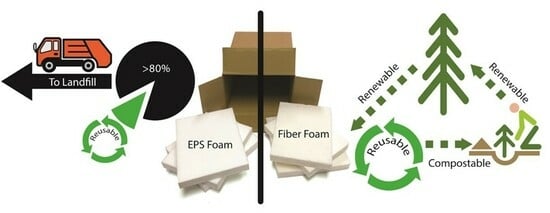
1. Introduction
2. Materials and Methods
2.1. Materials
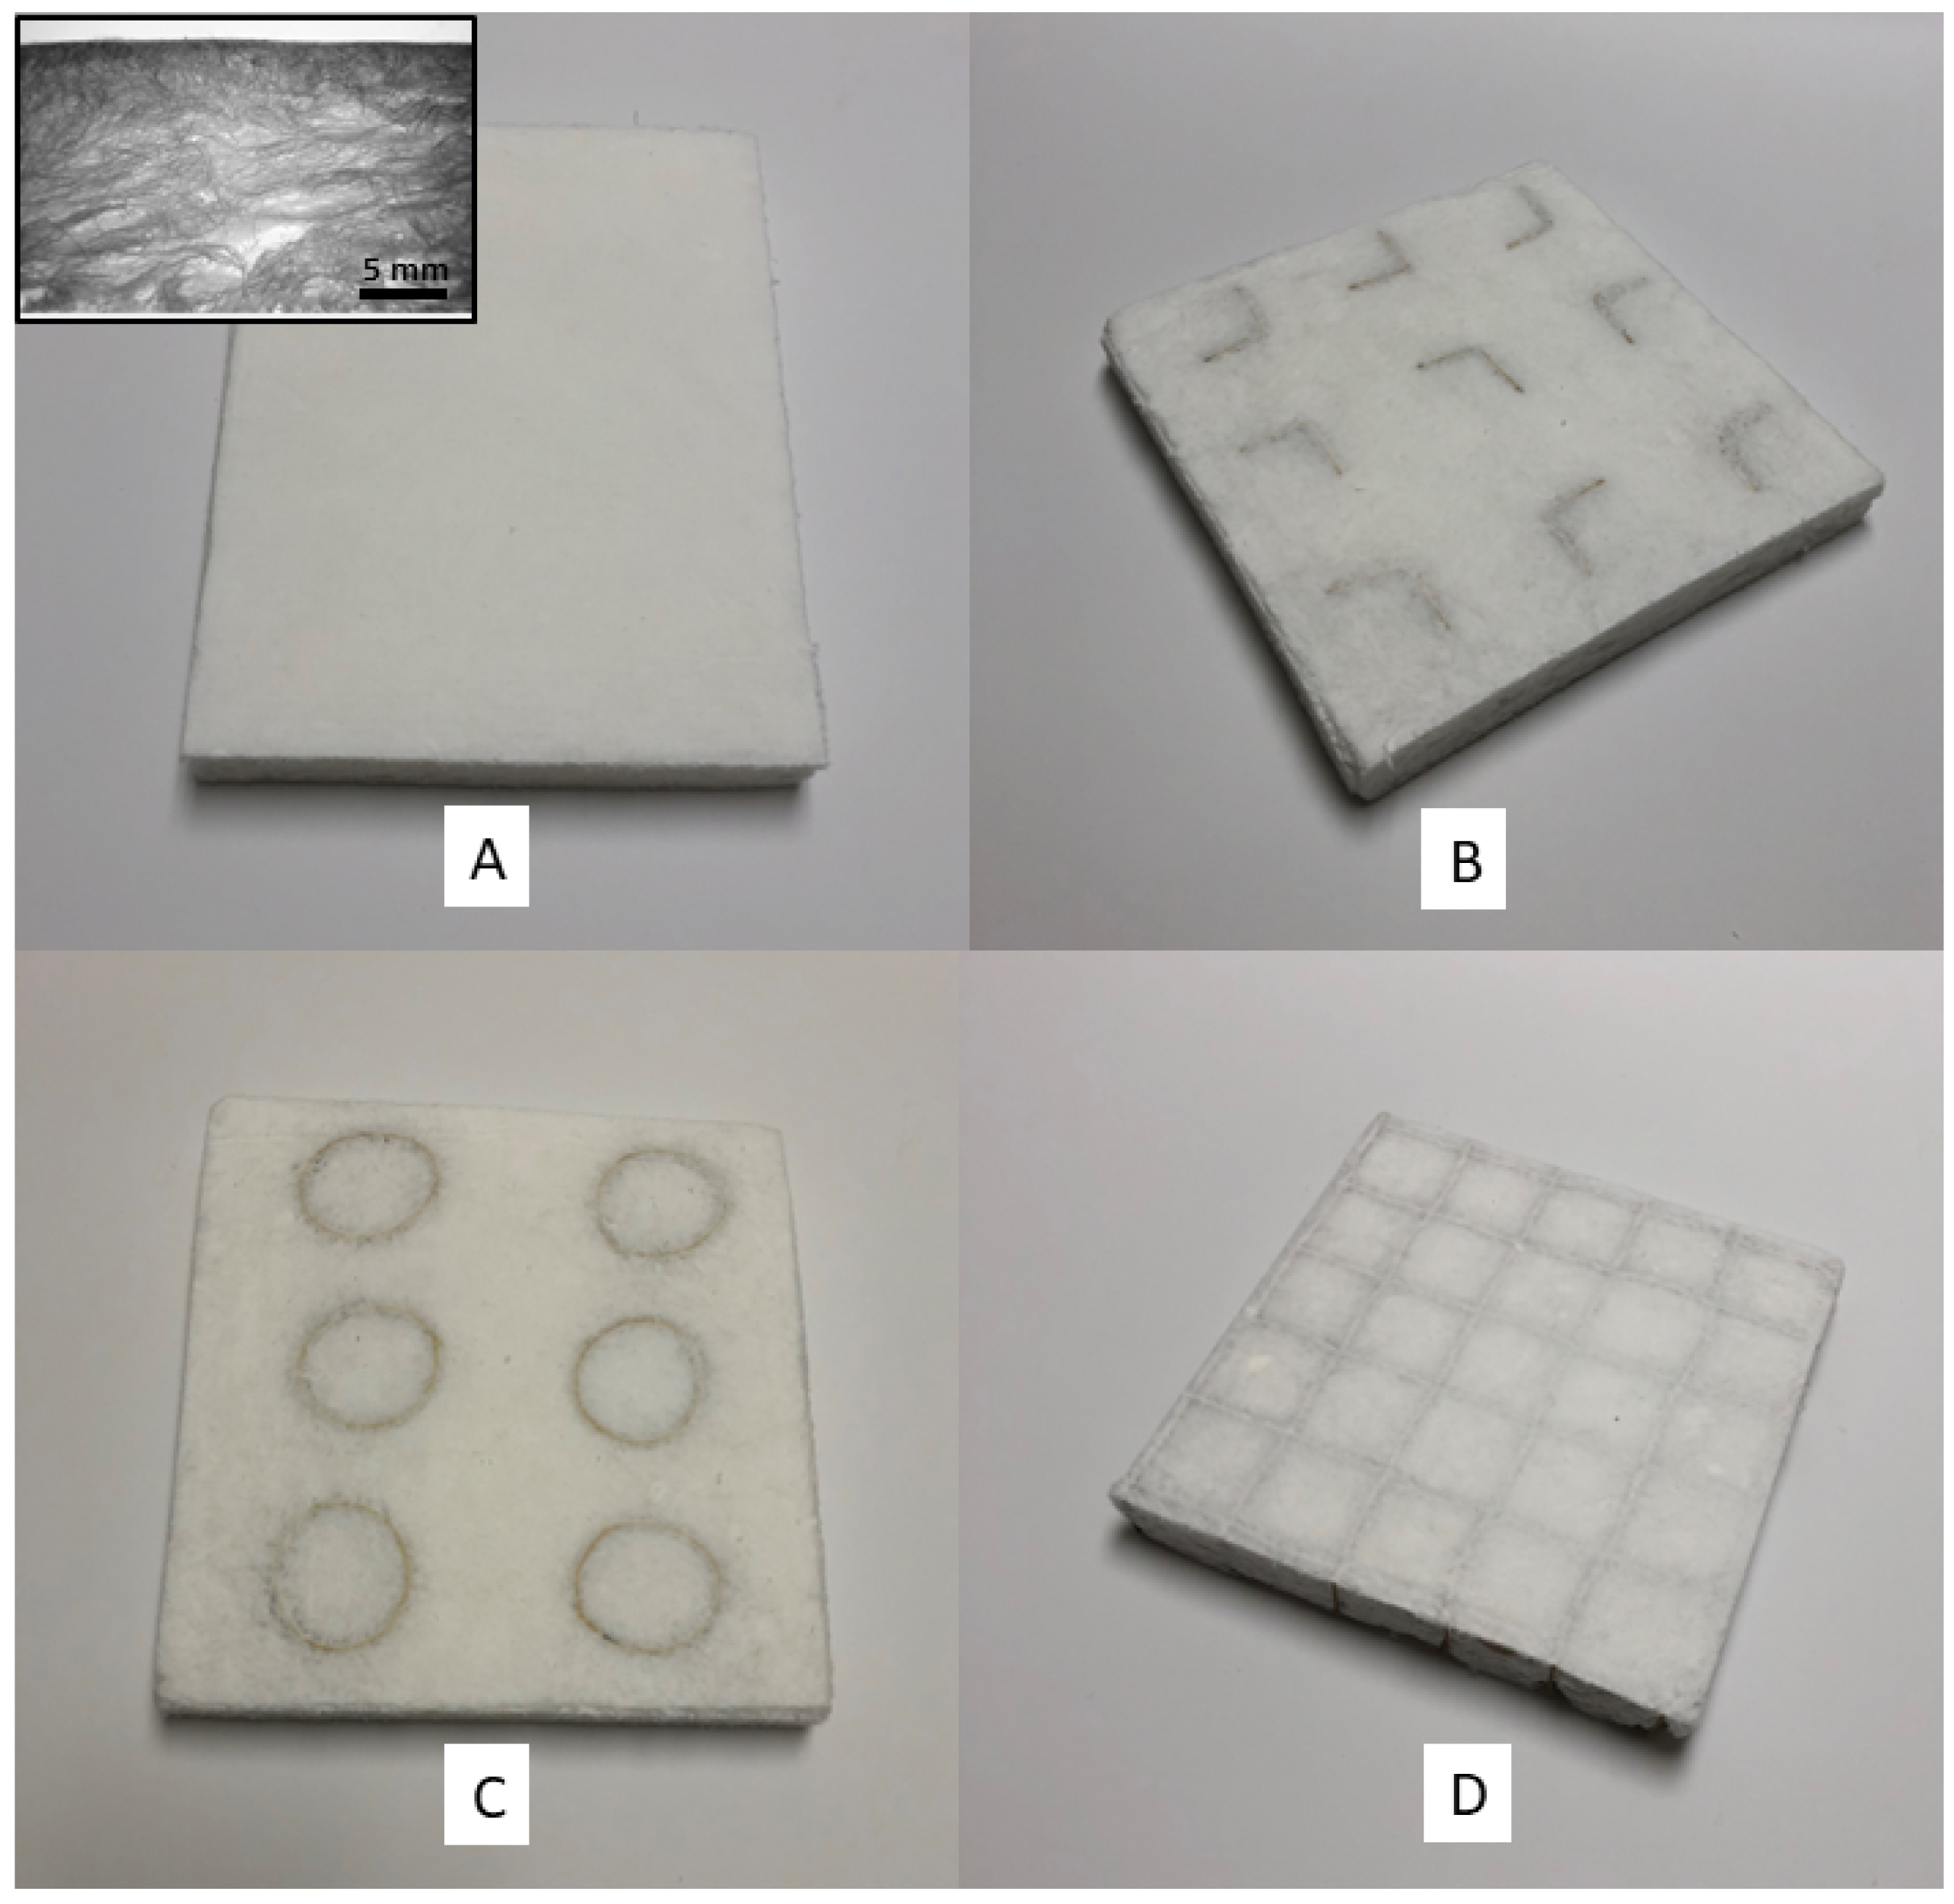
2.2. Paperboard Support Elements
2.3. Solution Preparation
2.4. Foam Procedure
2.5. Compression Molding
2.6. Drying
2.7. Mechanical Properties
2.8. Flexural Tests
2.9. Physical Properties
2.10. Thermal Conductivity
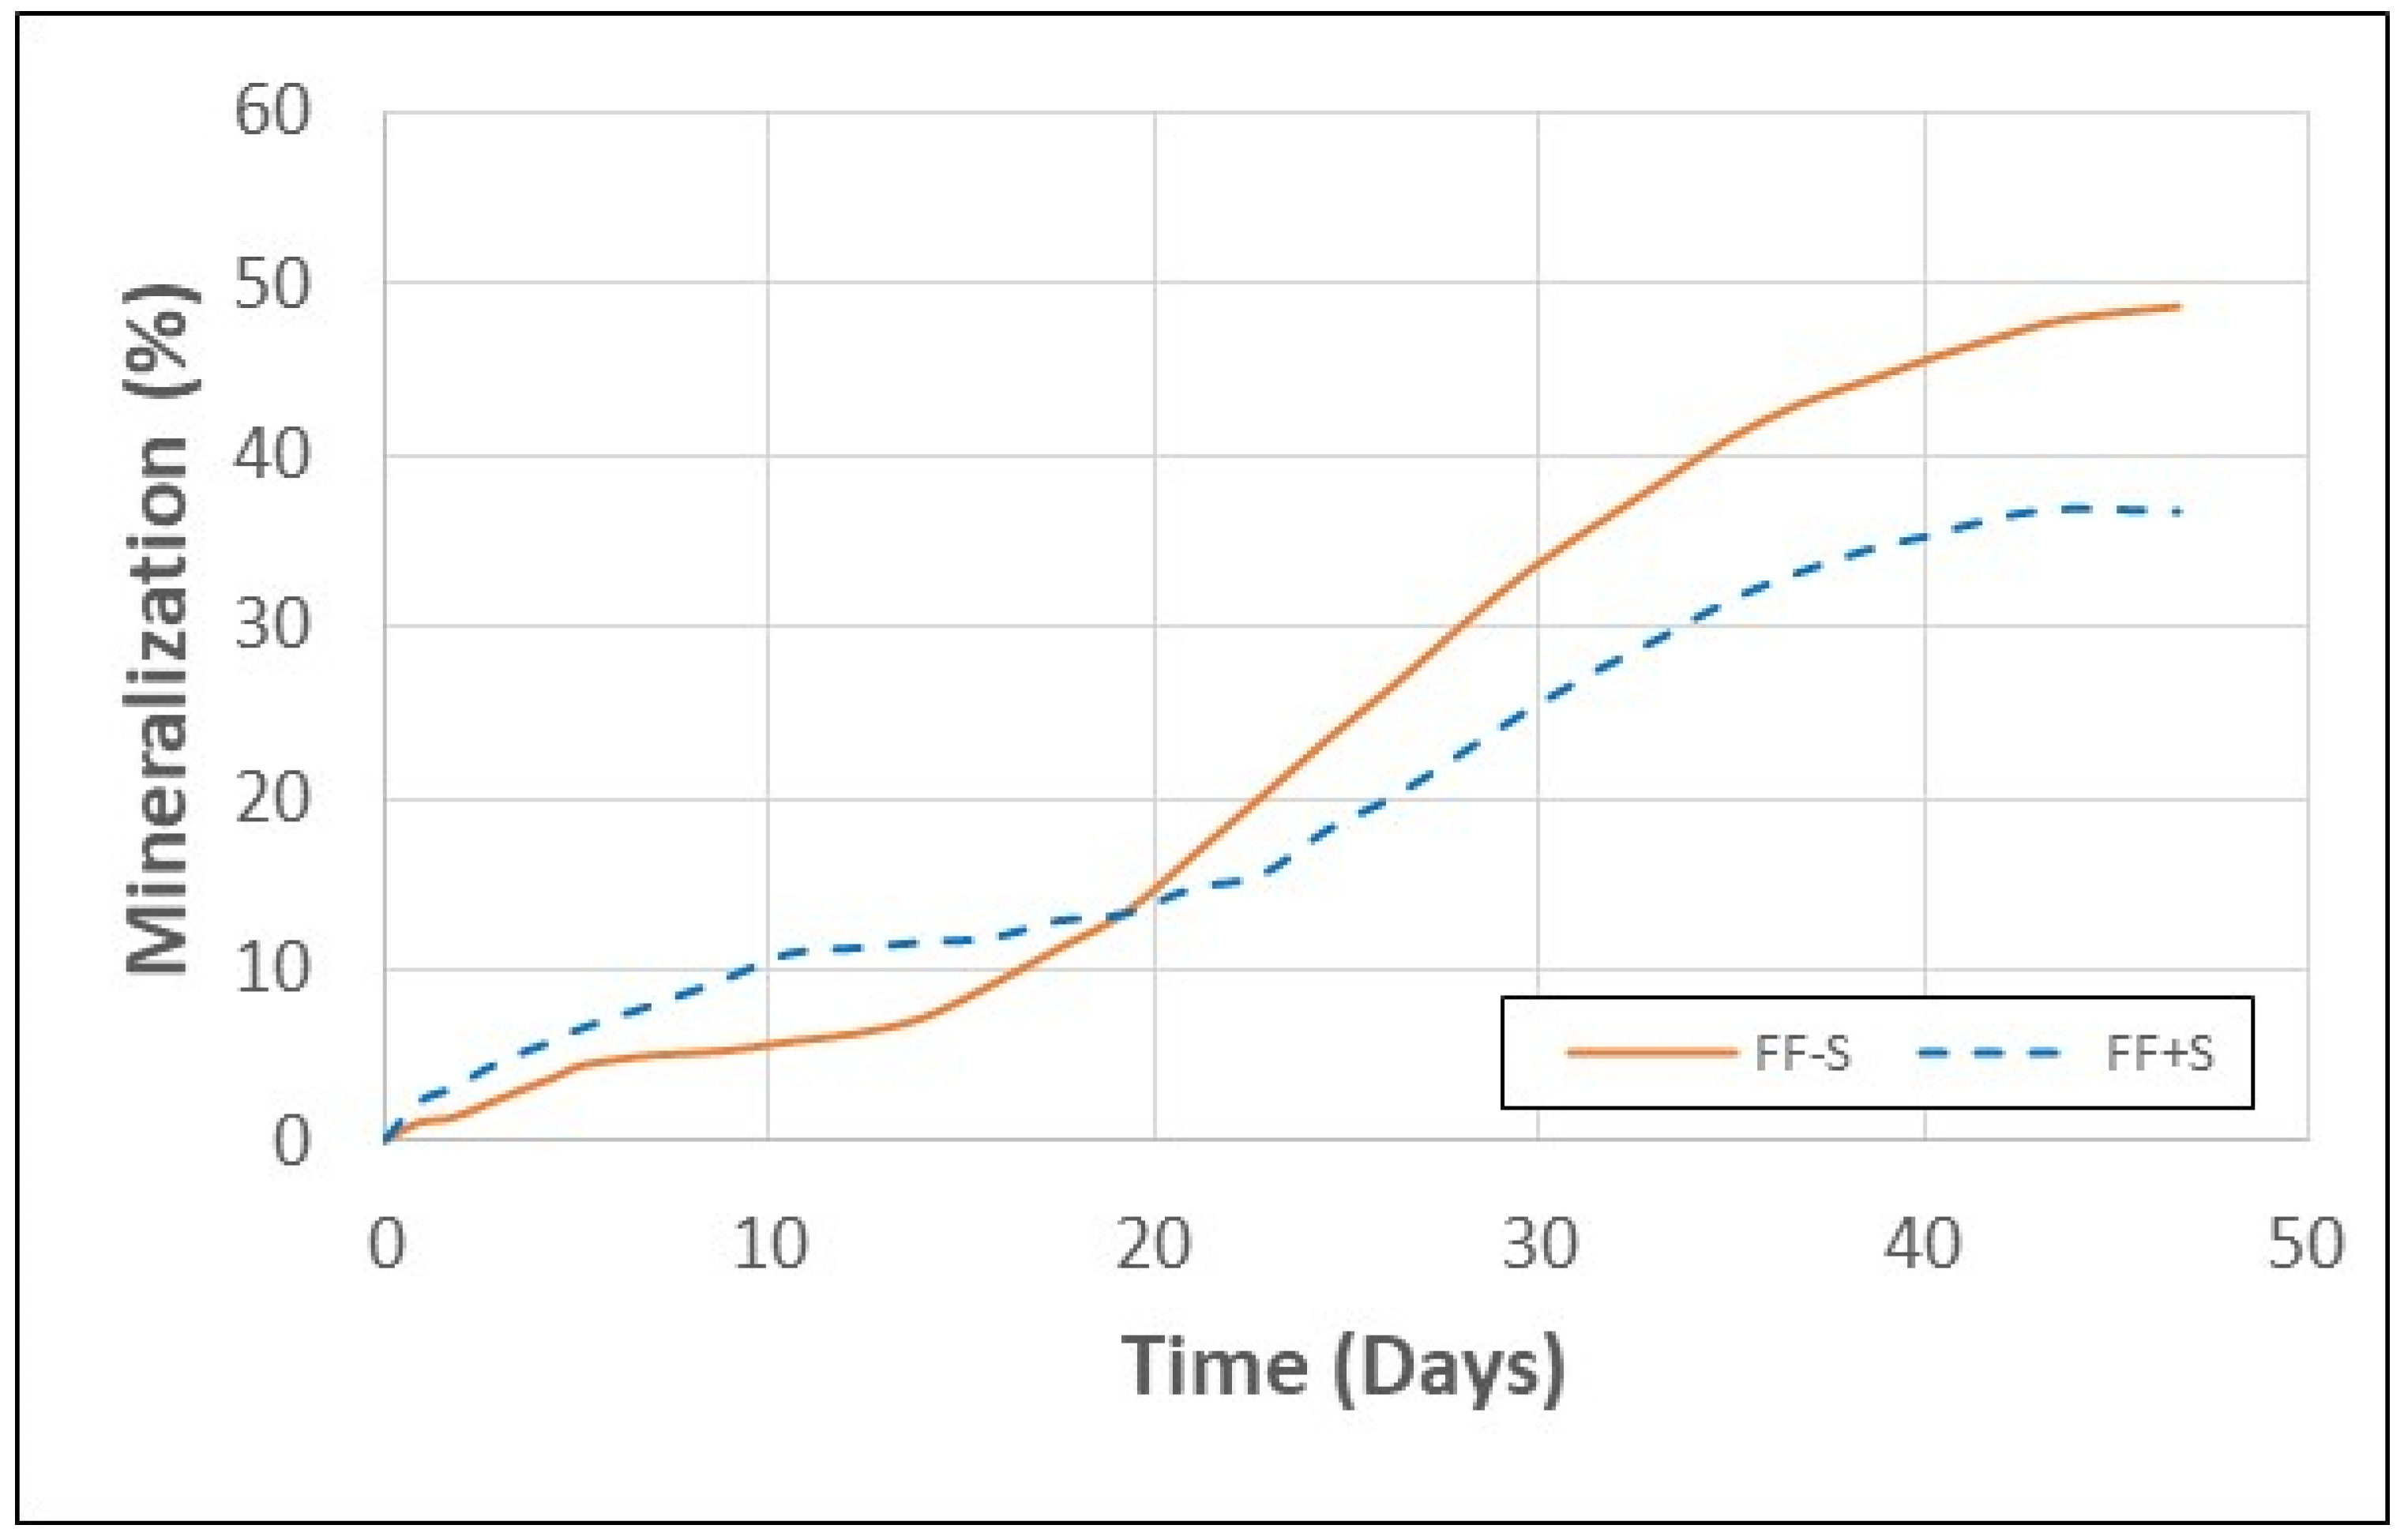
2.11. Respirometry
2.12. Microscopy
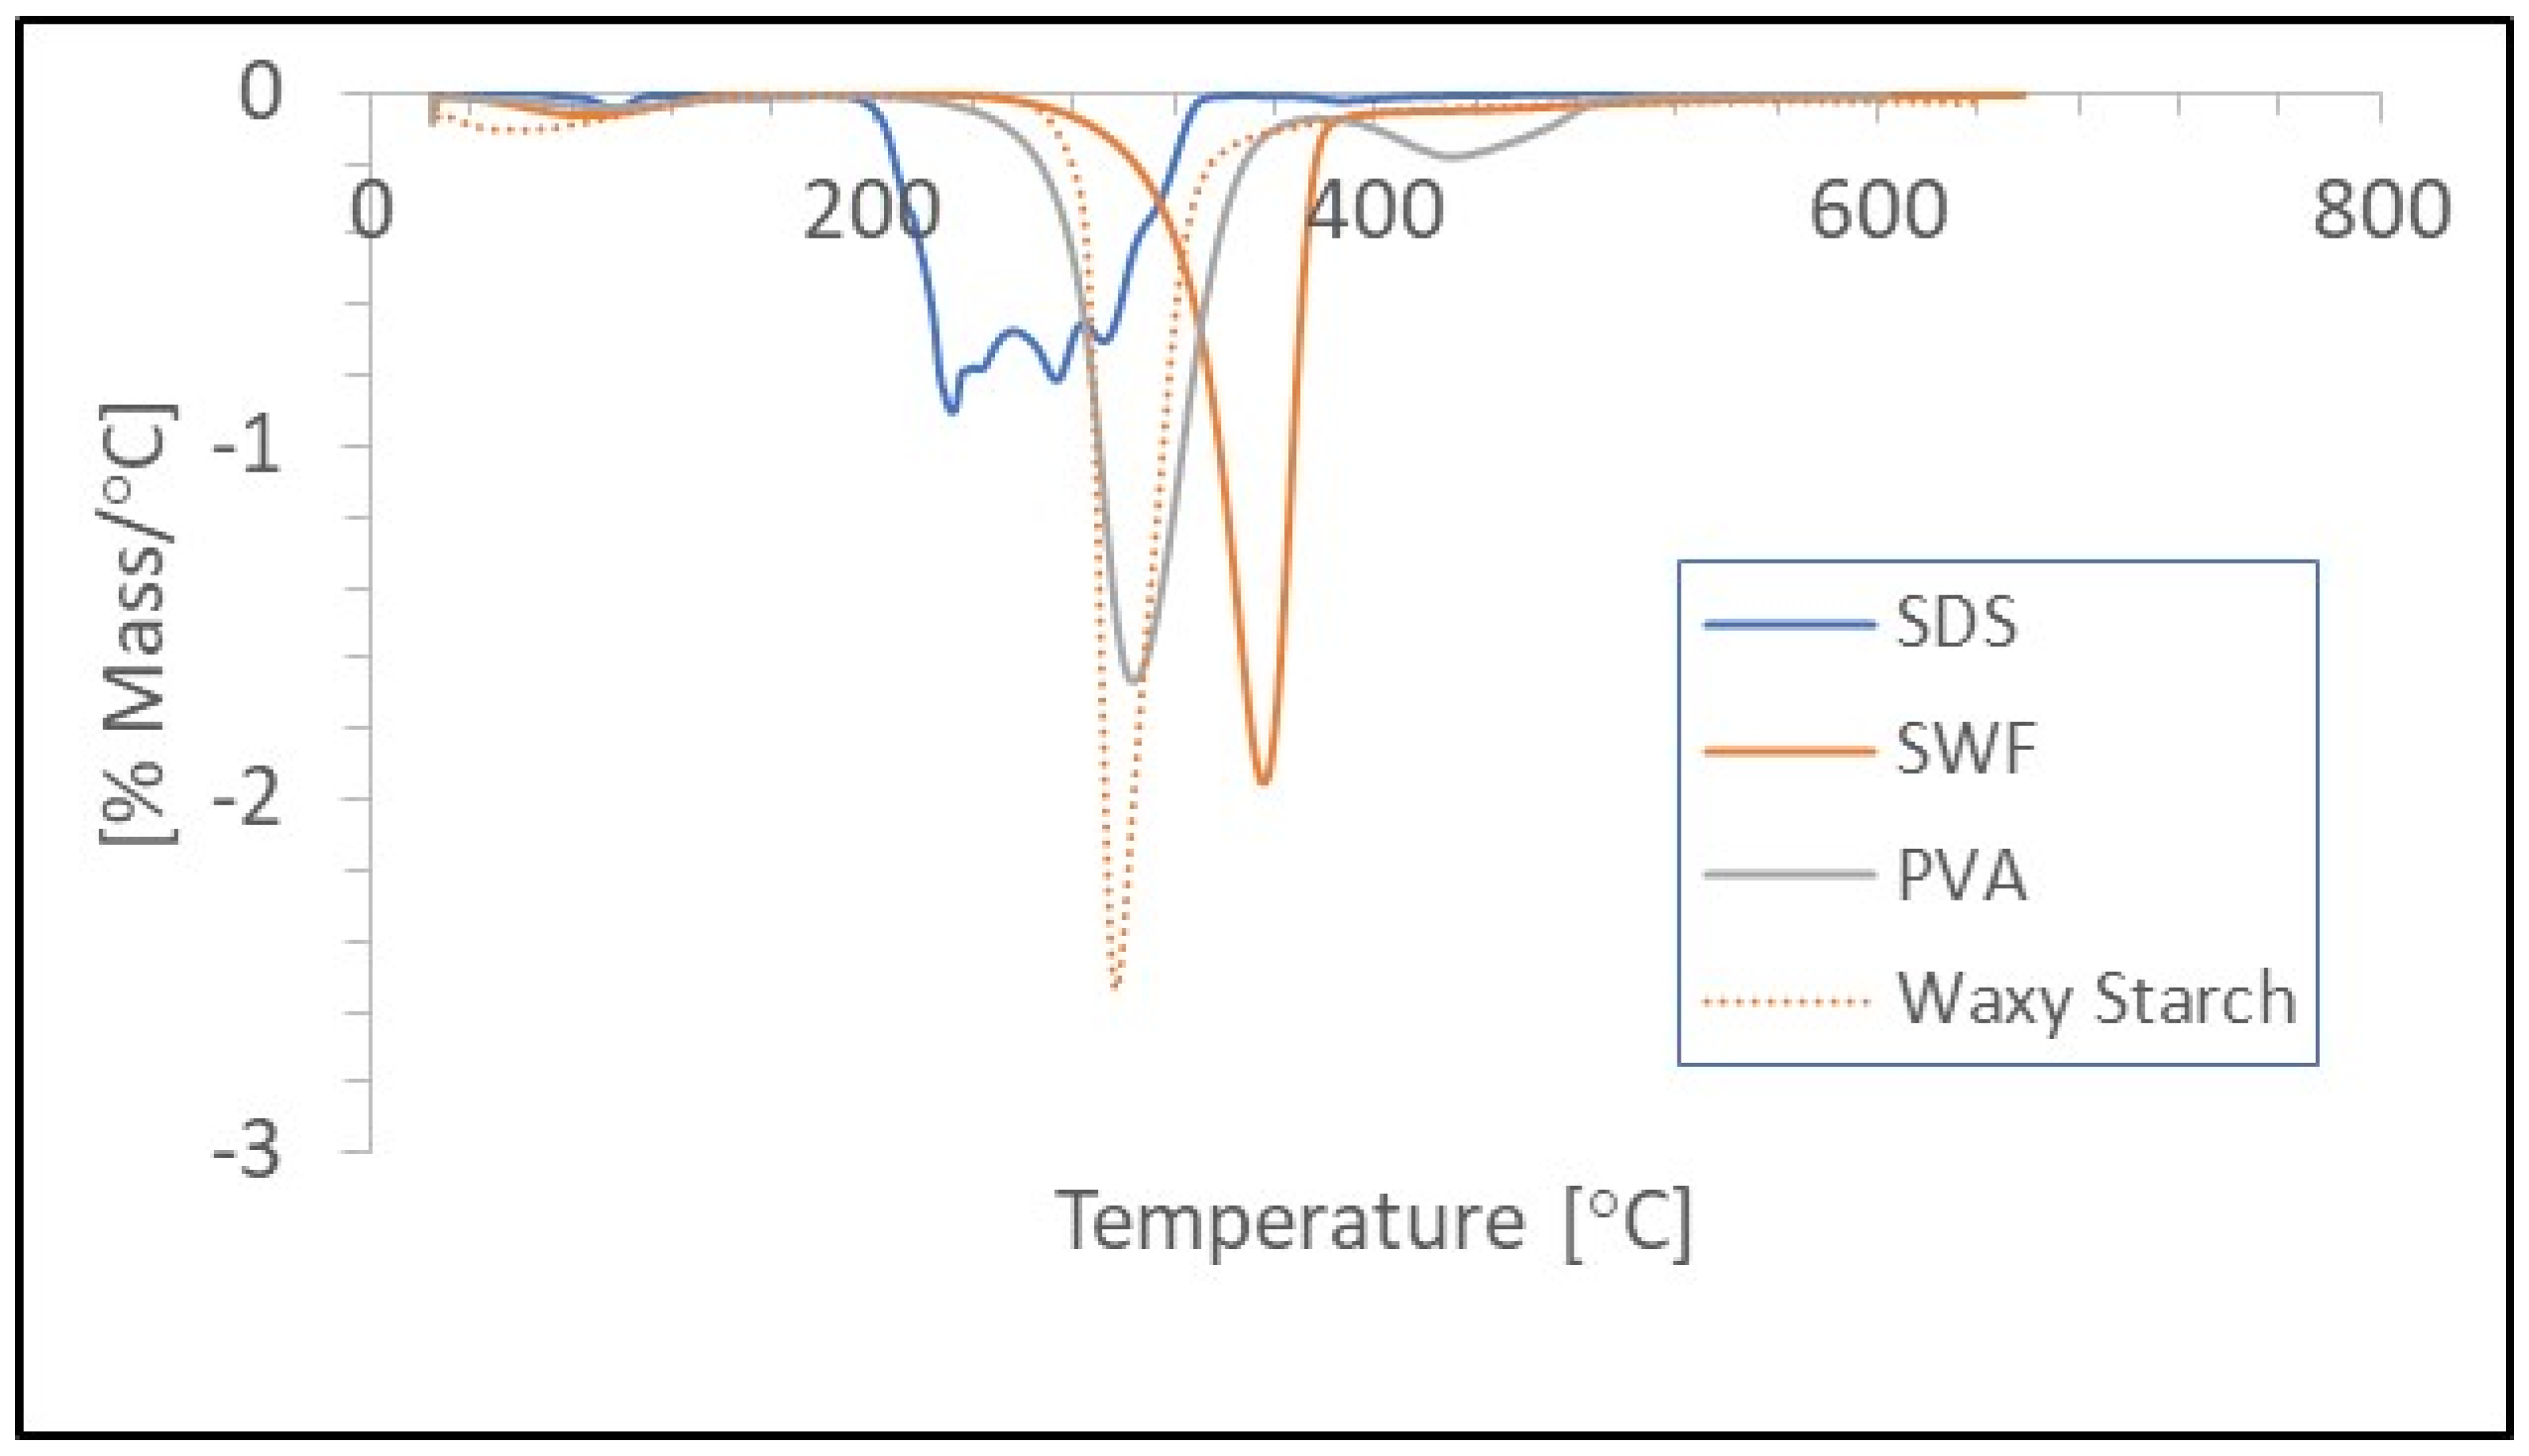
2.13. Thermogravimetric Analysis (TGA)
2.14. Statistical Analysis
3. Results and Discussion
4. Conclusions
Author Contributions
Funding
Institutional Review Board Statement
Data Availability Statement
Conflicts of Interest
References
- Ge, C.; Huang, H. Corner foam versus flat foam: An experimental comparison on cushion performance. Packag. Technol. Sci. 2015, 28, 217–225. [Google Scholar] [CrossRef]
- Marcondes, P.D.G. Minimum Sample Size Needed to Construct Cushion Curves Based on the Stress-Energy Method. Clemson University, All Theses. 135, 2007. Available online: https://tigerprints.clemson.edu/all_theses/135 (accessed on 15 January 2024).
- Statistica. Global Parcel Shipping Volume between 2013 and 2027 (in Billion Parcels). Available online: https://www.statista.com/statistics/1139910/parcel-shipping-volume-worldwide/#:~:text=In%202022%2C%20global%20parcel%20shipping,growth%20rate%20of%2059%20percent (accessed on 15 January 2024).
- Geyer, R.; Jambeck, J.R.; Law, K.L. Production, use, and fate of all plastics ever made. Sci. Adv. 2017, 3, e1700782. [Google Scholar] [CrossRef]
- PEMRG. The Compelling Facts about Plastics. 2008. Available online: https://plasticseurope.org/wp-content/uploads/2021/10/2006-Compelling-facts.pdf (accessed on 9 January 2024).
- Bökman, A.; Le, A. Driving Forces Behind Global Trade with Plastic Waste-Based on Reported Trade Statistics. Bachelor’s Thesis, 2023. Available online: http://hdl.handle.net/20.500.12380/307287 (accessed on 25 March 2024).
- Andena, L.; Caimmi, F.; Leonardi, L.; Nacucchi, M.; De Pascalis, F. Compression of polystyrene and polypropylene foams for energy absorption applications: A combined mechanical and microstructural study. J. Cell. Plast. 2019, 55, 49–72. [Google Scholar] [CrossRef]
- Chen, W.; Hao, H.; Hughes, D.; Shi, Y.; Cui, J.; Li, Z.-X. Static and dynamic mechanical properties of expanded polystyrene. Mater. Des. 2015, 69, 170–180. [Google Scholar] [CrossRef]
- Hidalgo-Crespo, J.; Moreira, C.; Jervis, F.; Soto, M.; Amaya, J.; Banguera, L. Circular economy of expanded polystyrene container production: Environmental benefits of household waste recycling considering renewable energies. Energy Rep. 2022, 8, 306–311. [Google Scholar] [CrossRef]
- Ghoshal, T.; Parmar, P.R.; Bhuyan, T.; Bandyopadhyay, D. Polystyrene Foams: Materials, Technology, and Applications. In Polymeric Foams: Fundamentals and Types of Foams; ACS Publications: Washington, DC, USA, 2023; Volume 1, pp. 121–141. [Google Scholar]
- Li, X.; Lin, Y.; Liu, M.; Meng, L.; Li, C. A review of research and application of polylactic acid composites. J. Appl. Polym. Sci. 2023, 140, e53477. [Google Scholar] [CrossRef]
- Ho, B.T.; Roberts, T.K.; Lucas, S. An overview on biodegradation of polystyrene and modified polystyrene: The microbial approach. Crit. Rev. Biotechnol. 2018, 38, 308–320. [Google Scholar] [CrossRef]
- iSustain. Can Polystyrene Be Cost-Effectively Recycled? 2024. Available online: https://isustainrecycling.com/can-polystyrene-cost-effectively-recycled/#:~:text=The%20good%20news%20is%20that,percent%20of%20post%2Dindustrial%20EPS (accessed on 9 January 2024).
- Noguchi, T.; Miyashita, M.; Inagaki, Y.; Watanabe, H. A new recycling system for expanded polystyrene using a natural solvent. Part 1. A new recycling technique. Packag. Technol. Sci. Int. J. 1998, 11, 19–27. [Google Scholar] [CrossRef]
- Shin, C. Filtration application from recycled expanded polystyrene. J. Colloid Interface Sci. 2006, 302, 267–271. [Google Scholar] [CrossRef]
- Colorado General Assembly. HB21-1162. Management of Plastic Products. 2021. Available online: https://leg.colorado.gov/bills/hb21-1162 (accessed on 25 March 2024).
- Emblidge, D. State Ban on Some Materials to Take Effect New Year’s Day. 2024. Available online: https://13wham.com/news/local/state-ban-on-some-products-to-take-effect-new-years-day (accessed on 9 January 2024).
- Murphy, P. Murphy Administration Marks First Anniversary of Law Limiting Single-Use Plastics in New Jersey. 2023. Available online: https://www.nj.gov/dep/newsrel/2023/23_0027.htm (accessed on 9 January 2024).
- Walker, J.-C.; Pecht, A.M. California Enacts EPR Law Aimed at Single-Use Plastic Packaging and Food Service Ware; Keller & Heckman: Washington, DC, USA, 2022; Available online: https://www.khlaw.com/insights/california-enacts-epr-law-aimed-single-use-plastic-packaging-and-food-service-ware?language_content_entity=en (accessed on 9 January 2024).
- House-of-Comons. Single Use Plastic: How Do Bans Differ across the UK and EU? UK Parliament, 2022. Available online: https://commonslibrary.parliament.uk/single-use-plastic-how-do-bans-differ-across-the-uk-and-eu/#:~:text=The%20UK%20Government’s%20proposed%20restrictions,the%20UK%2FEU%20Withdrawal%20Agreement (accessed on 9 January 2024).
- Tapia-Blácido, D.R.; Aguilar, G.J.; de Andrade, M.T.; Rodrigues-Júnior, M.F.; Guareschi-Martins, F.C. Trends and challenges of starch-based foams for use as food packaging and food container. Trends Food Sci. Technol. 2022, 119, 257–271. [Google Scholar] [CrossRef]
- Muniyasamy, S.; Ofosu, O.; John, M.J.; Anandjiwala, R.D. Mineralization of poly (lactic acid)(PLA), poly (3-hydroxybutyrate-co-valerate)(PHBV) and PLA/PHBV blend in compost and soil environments. J. Renew. Mater. 2016, 4, 133. [Google Scholar] [CrossRef]
- Skye, C. Bioplastics, Biodegradable Plastics, & Compostable Plastics: What’s the Difference? Earth911. 2021. Available online: https://earth911.com/business-policy/bioplastics-biodegradable-plastics-compostable-plastics/ (accessed on 9 January 2024).
- Villamil Jiménez, J.A.; Le Moigne, N.; Bénézet, J.-C.; Sauceau, M.; Sescousse, R.; Fages, J. Foaming of PLA composites by supercritical fluid-assisted processes: A review. Molecules 2020, 25, 3408. [Google Scholar] [CrossRef] [PubMed]
- EPA. National Overview: Facts and Figures on Materials, Wastes and Recycling. US EPA. 2023. Available online: https://www.epa.gov/facts-and-figures-about-materials-waste-and-recycling/national-overview-facts-and-figures-materials#Recycling/Composting (accessed on 9 January 2024).
- Ozola, Z.U.; Vesere, R.; Kalnins, S.N.; Blumberga, D. Paper waste recycling. Circular economy aspects. Environ. Clim. Technol. 2019, 23, 260–273. [Google Scholar] [CrossRef]
- Wang, D.; Yang, R. Study on damping characteristic of honeycomb paperboard and vibration reduction mechanism of packaging system. J. Vib. Control 2019, 25, 1536–1542. [Google Scholar] [CrossRef]
- Xing, Y.; Sun, D.; Deng, Z. An Analysis of the Vibration Transmission Properties of Assemblies Using Honeycomb Paperboard and Expanded Polyethylene. Materials 2023, 16, 6554. [Google Scholar] [CrossRef] [PubMed]
- Li, K.; Wang, J.; Lu, L.; Qin, Q.; Chen, J.; Shen, C.; Jiang, M. Mechanical properties and energy absorption capability of a new multi-cell lattice honeycomb paperboard under out-plane compression: Experimental and theoretical studies. Packag. Technol. Sci. 2022, 35, 273–290. [Google Scholar] [CrossRef]
- Abd Kadir, N.; Aminanda, Y.; Ibrahim, M.; Mokhtar, H. Experimental study on energy absorption of foam filled kraft paper honeycomb subjected to quasi-static uniform compression loading. In IOP Conference Series: Materials Science and Engineering; IOP Publishing: Bristol, UK, 2016; Volume 152, p. 012048. [Google Scholar]
- Nechita, P.; Năstac, S.M. Overview on foam forming cellulose materials for cushioning packaging applications. Polymers 2022, 14, 1963. [Google Scholar] [CrossRef] [PubMed]
- Enso, S. Cellulose Foam Papira®. 2024. Available online: https://www.storaenso.com/en/products/bio-based-materials/cellulose-foam (accessed on 1 March 2024).
- Glenn, G.; Orts, W.; Klamczynski, A.; Shogren, R.; Hart-Cooper, W.; Wood, D.; Lee, C.; Chiou, B.-S. Compression molded cellulose fiber foams. Cellulose 2023, 30, 3489–3503. [Google Scholar] [CrossRef]
- Xiaolin, C.; Deng, X.J.; Nicolas, D.; Lebel, S.; Brunette, G.; Dorris, G.M.; Ben, Y.; Ricard, M.; Zhang, Y.Z.; Yang, D.-Q. Method of Producing Ultra-Low Density Fiber Composite Materials. US Patent No. 9,994,712, 12 June 2018. [Google Scholar]
- Niu, Z.; Chen, F.; Zhang, H.; Liu, C. High Content of Thermoplastic Starch, Poly (butylenes adipate-co-terephthalate) and Poly (butylene succinate) Ternary Blends with a Good Balance in Strength and Toughness. Polymers 2023, 15, 2040. [Google Scholar] [CrossRef]
- ASTM D1621-16; Standard Test Method for Compressive Properties of Rigid Cellular Plastics. ASTM: West Conshohocken, PA, USA, 2016. [CrossRef]
- Kawai, F.; Hu, X. Biochemistry of microbial polyvinyl alcohol degradation. Appl. Microbiol. Biotechnol. 2009, 84, 227–237. [Google Scholar] [CrossRef]
- ASTM D790-17; Standard Test Methods for Flexural Properties of Unreinforced and Reinforced Plastics and Electrical Insulating Materials. ASTM: West Conshohocken, PA, USA, 2017. [CrossRef]
- Liu, Y.; Kong, S.; Xiao, H.; Bai, C.; Lu, P.; Wang, S. Comparative study of ultra-lightweight pulp foams obtained from various fibers and reinforced by MFC. Carbohydr. Polym. 2018, 182, 92–97. [Google Scholar] [CrossRef] [PubMed]
- ASTM C177-19; Standard Test Method for Steady-State Heat Flux Measurements and Thermal Transmission Properties by Means of the Guarded-Hot-Plate Apparatus. ASTM: West Conshohocken, PA, USA, 2019. [CrossRef]
- Imam, S.H.; Gordon, S.H. Biodegradation of coproducts from industrially processed corn in a compost environment. J. Polym. Environ. 2002, 10, 147–154. [Google Scholar] [CrossRef]
- Hnin, K.K.; Zhang, M.; Mujumdar, A.S.; Zhu, Y. Emerging food drying technologies with energy-saving characteristics: A review. Dry. Technol. 2018, 37, 1465–1480. [Google Scholar] [CrossRef]
- Sigma-Aldrich. Sodium Dodecyl Sulfate -Product Information. Available online: https://www.sigmaaldrich.com/deepweb/assets/sigmaaldrich/product/documents/263/218/l4522pis.pdf (accessed on 25 March 2024).
- Turner, A. Foamed Polystyrene in the Marine Environment: Sources, Additives, Transport, Behavior, and Impacts. Environ. Sci. Technol. 2020, 54, 10411–10420. [Google Scholar] [CrossRef] [PubMed]
- Venelampi, O.; Weber, A.; Rönkkö, T.; Itävaara, M. The biodegradation and disintegration of paper products in the composting environment. Compost. Sci. Util. 2003, 11, 200–209. [Google Scholar] [CrossRef]
- Alvarez, J.V.L.; Larrucea, M.A.; Bermúdez, P.A.; Chicote, B.L. Biodegradation of paper waste under controlled composting conditions. Waste Manag. 2009, 29, 1514–1519. [Google Scholar] [CrossRef] [PubMed]
- Bondi, C.A.; Marks, J.L.; Wroblewski, L.B.; Raatikainen, H.S.; Lenox, S.R.; Gebhardt, K.E. Human and environmental toxicity of sodium lauryl sulfate (sls): Evidence for safe use in household cleaning products. Environ. Health Insights 2020, 9. [Google Scholar] [CrossRef] [PubMed]
- PubChem. Sodium Dodecyl Sulfate; National Institute of Health: Bethesda, MD, USA, 2024. Available online: https://pubchem.ncbi.nlm.nih.gov/compound/Sodium-dodecyl-sulfate (accessed on 10 January 2024).
- Wang, T.; Chang, D.; Huang, D.; Liu, Z.; Wu, Y.; Liu, H.; Yuan, H.; Jiang, Y. Application of surfactants in papermaking industry and future development trend of green surfactants. Appl. Microbiol. Biotechnol. 2021, 105, 7619–7634. [Google Scholar] [CrossRef] [PubMed]
- Liu, B.; Zhang, J.; Guo, H. Research progress of polyvinyl alcohol water-resistant film materials. Membranes 2022, 12, 347. [Google Scholar] [CrossRef]
- Chiellini, E.; Corti, A.; D’Antone, S.; Solaro, R. Biodegradation of poly (vinyl alcohol) based materials. Prog. Polym. Sci. 2003, 28, 963–1014. [Google Scholar] [CrossRef]
- Halima, N.B. Poly (vinyl alcohol): Review of its promising applications and insights into biodegradation. RSC Adv. 2016, 6, 39823–39832. [Google Scholar] [CrossRef]
- Li, M.; Zhang, D.; Du, G.; Chen, J. Enhancement of PVA-degrading enzyme production by the application of pH control strategy. J. Microbiol. Biotechnol. 2012, 22, 220–225. [Google Scholar] [CrossRef] [PubMed]
- Marcuello, C.; Chabbert, B.; Berzin, F.; Bercu, N.B.; Molinari, M.; Aguié-Béghin, V. Influence of surface chemistry of fiber and lignocellulosic materials on adhesion properties with polybutylene succinate at nanoscale. Materials 2023, 16, 2440. [Google Scholar] [CrossRef] [PubMed]
- Mane, J.; Chandra, S.; Sharma, S.; Ali, H.; Chavan, V.; Manjunath, B.; Patel, R. Mechanical property evaluation of polyurethane foam under quasi-static and dynamic strain rates-an experimental study. Procedia Eng. 2017, 173, 726–731. [Google Scholar] [CrossRef]
- Sadighi, M.; Salami, S. An investigation on low-velocity impact response of elastomeric & crushable foams. Open Eng. 2012, 2, 627–637. [Google Scholar]


| Sample | FF (−S) | FF (+S) |
|---|---|---|
| Fiber | 50 g | 50 g |
| (19.7%) | (15.9%) | |
| Water | 100 g | 150 g |
| (39.4%) | (47.6%) | |
| PVA (5% soln) | 100 g | 100 g |
| (39.4%) | (31.7%) | |
| SDS (29% soln) | 4 g | 8 g |
| (1.57%) | (2.54%) | |
| Starch | 0 g | 7 g |
| (2.22%) |
| Sample | FF-S | FF+S | FF-S Angle | FF+S Angle | FF-S Cyl. | FF+S Cyl. | FF-S Grid | FF+S Grid | EPS Foam |
|---|---|---|---|---|---|---|---|---|---|
| Dw (kg/m3) | 125 a* | 182 b | N/A | N/A | N/A | N/A | N/A | N/A | N/A |
| Va (%) | 869 a | 601 b | N/A | N/A | N/A | N/A | N/A | N/A | N/A |
| Td (min) | 336 a | 528 c | 333 a | 510 c | 311 a | 529 c | 399 b | 553 c | N/A |
| T (cm) | 2.66 a | 2.62 a | 2.63 a | 2.63 a | 2.62 a | 2.61 a | 2.70 a | 2.65 a | 2.61 a |
| Dd (kg/m3) | 33.1 b | 39.1 c | 35.9 b,c | 44.9 d | 39.1 c | 44.9 d | 57.1 e | 64.9 f | 14.1 a |
| P (%) | 97.9 a | 97.5 a | N/A | N/A | N/A | N/A | N/A | N/A | 98.6 b |
| TC (W/mK) | 0.039 a,b | 0.043 a,b,c | 0.042 a,b | 0.044 b,c,d | 0.042 a,b | 0.044 b,c,d | 0.048 c,d | 0.049 d | 0.038 a |
| Sample | FF-S | FF+S | FF-S Angle | FF+S Angle | FF-S Cyl. | FF+S Cyl. | FF-S Grid | FF+S Grid | EPS Foam |
|---|---|---|---|---|---|---|---|---|---|
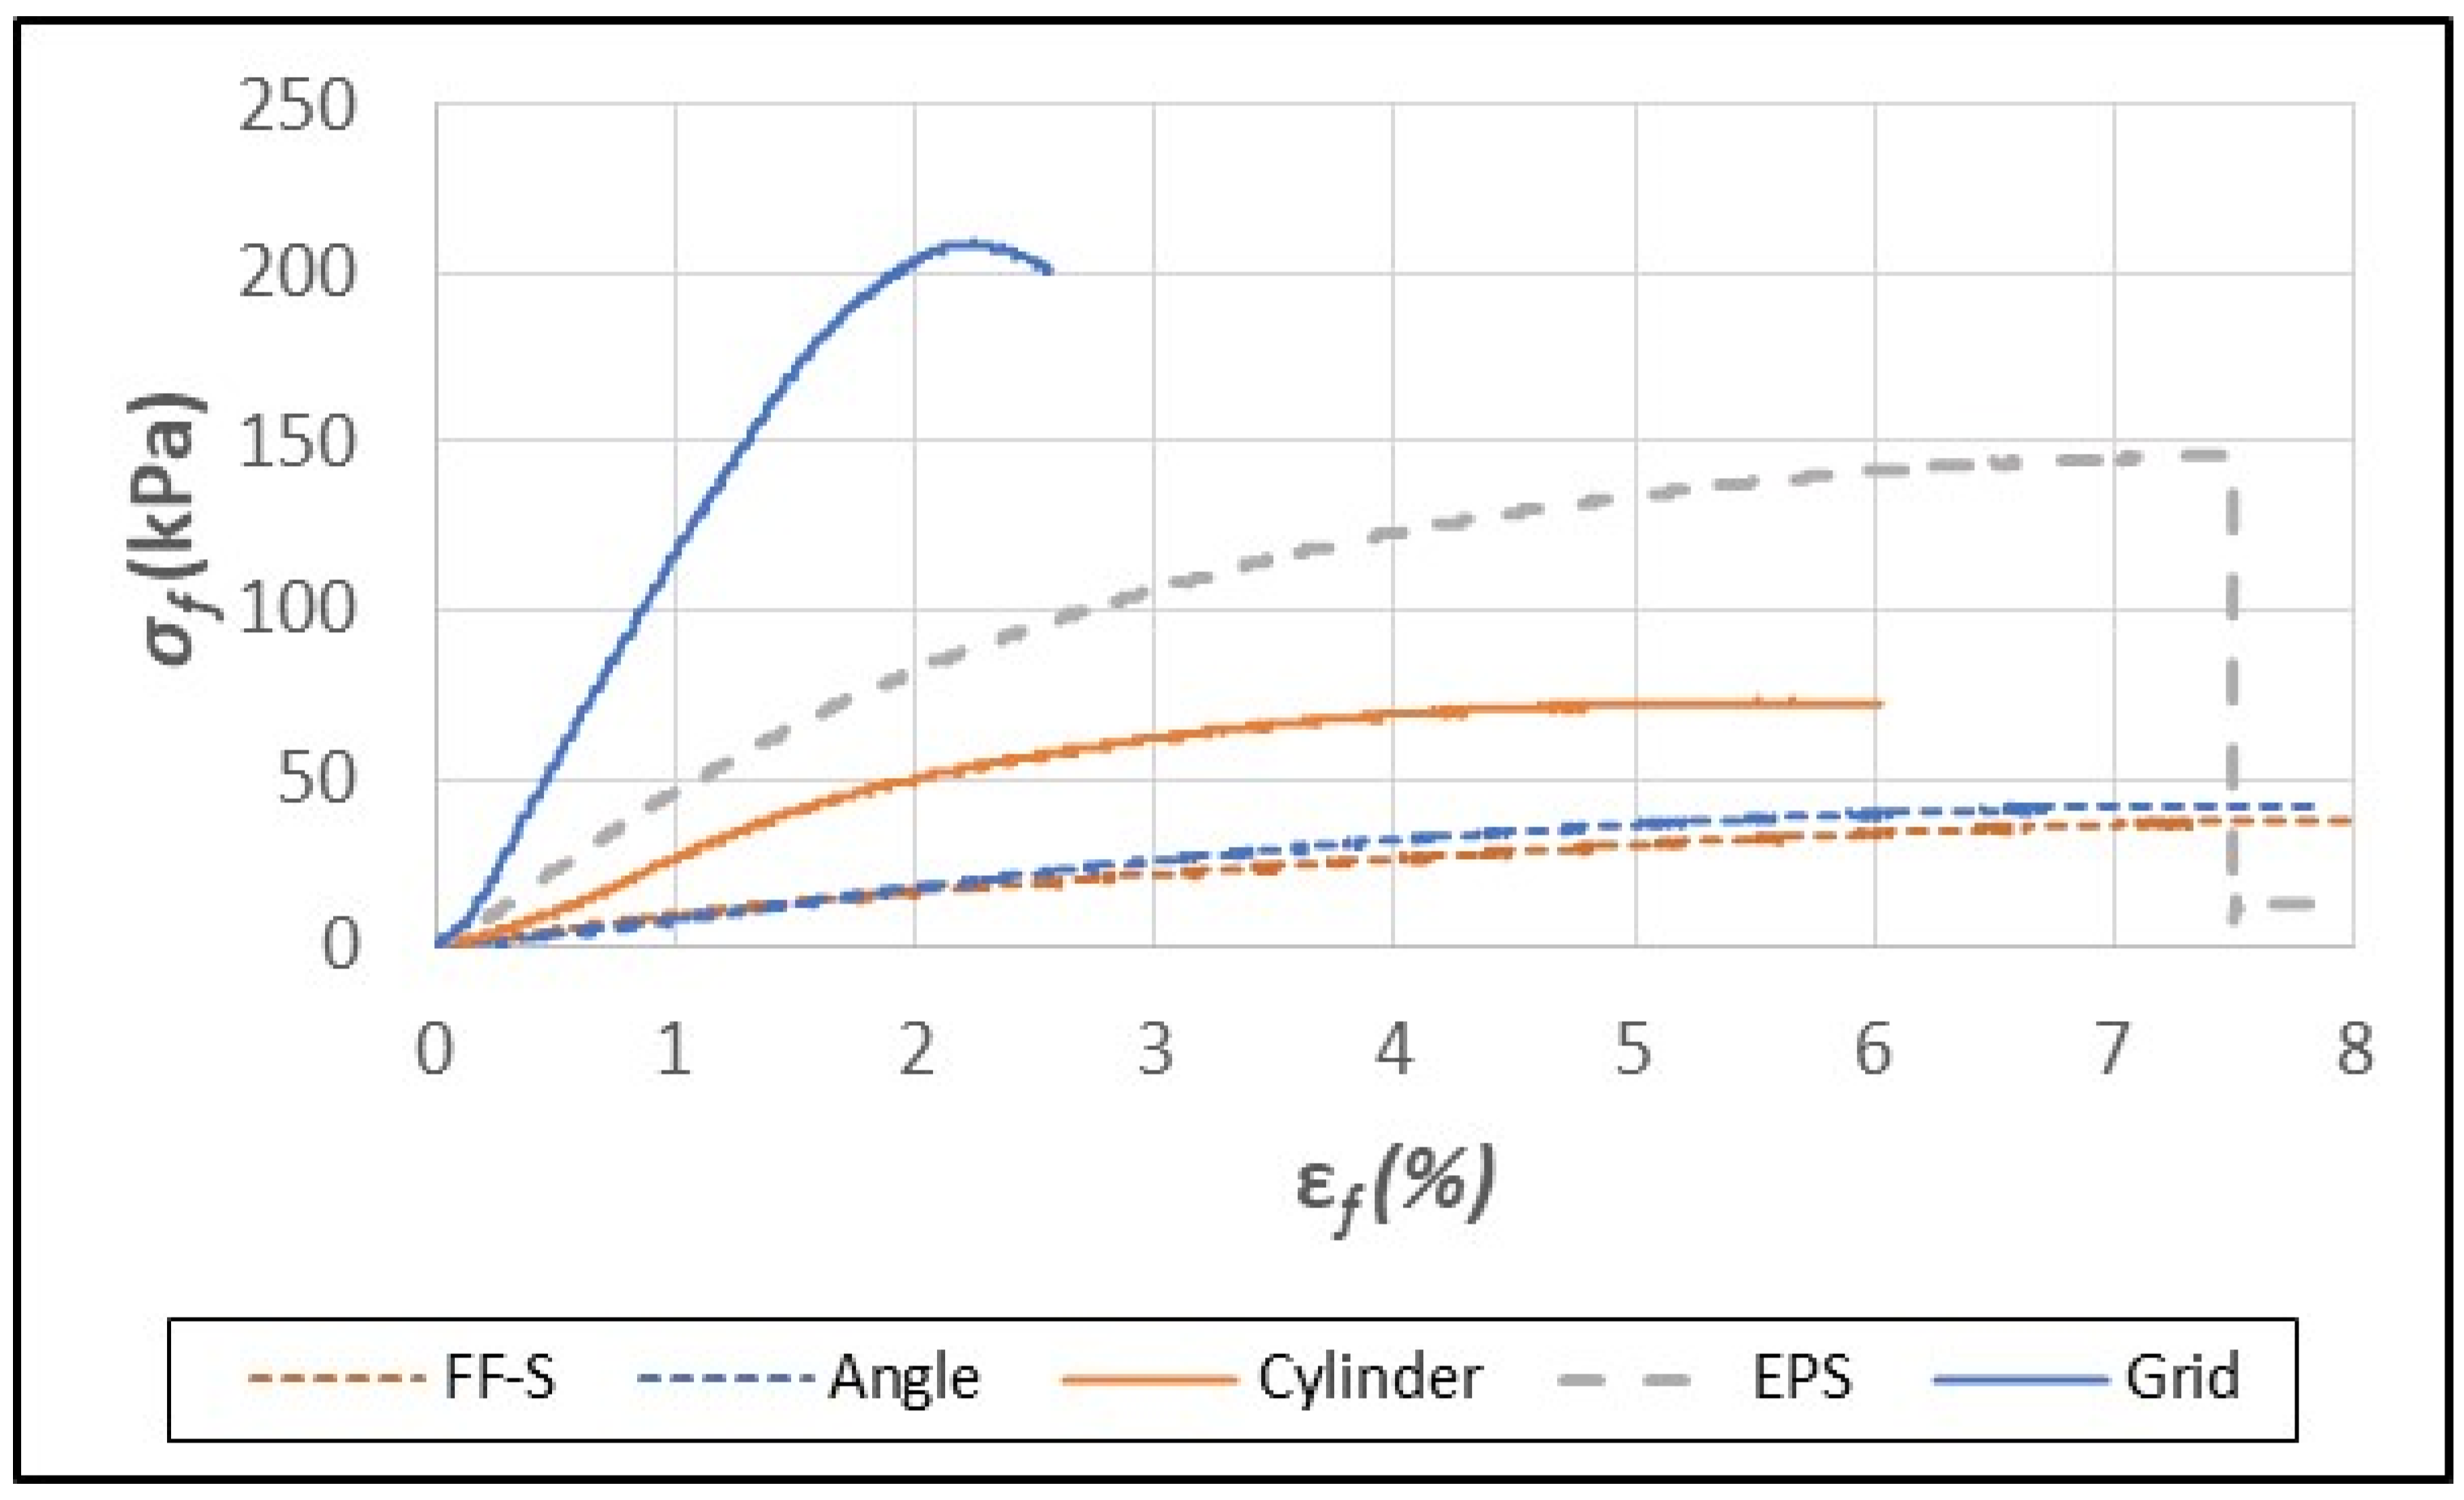
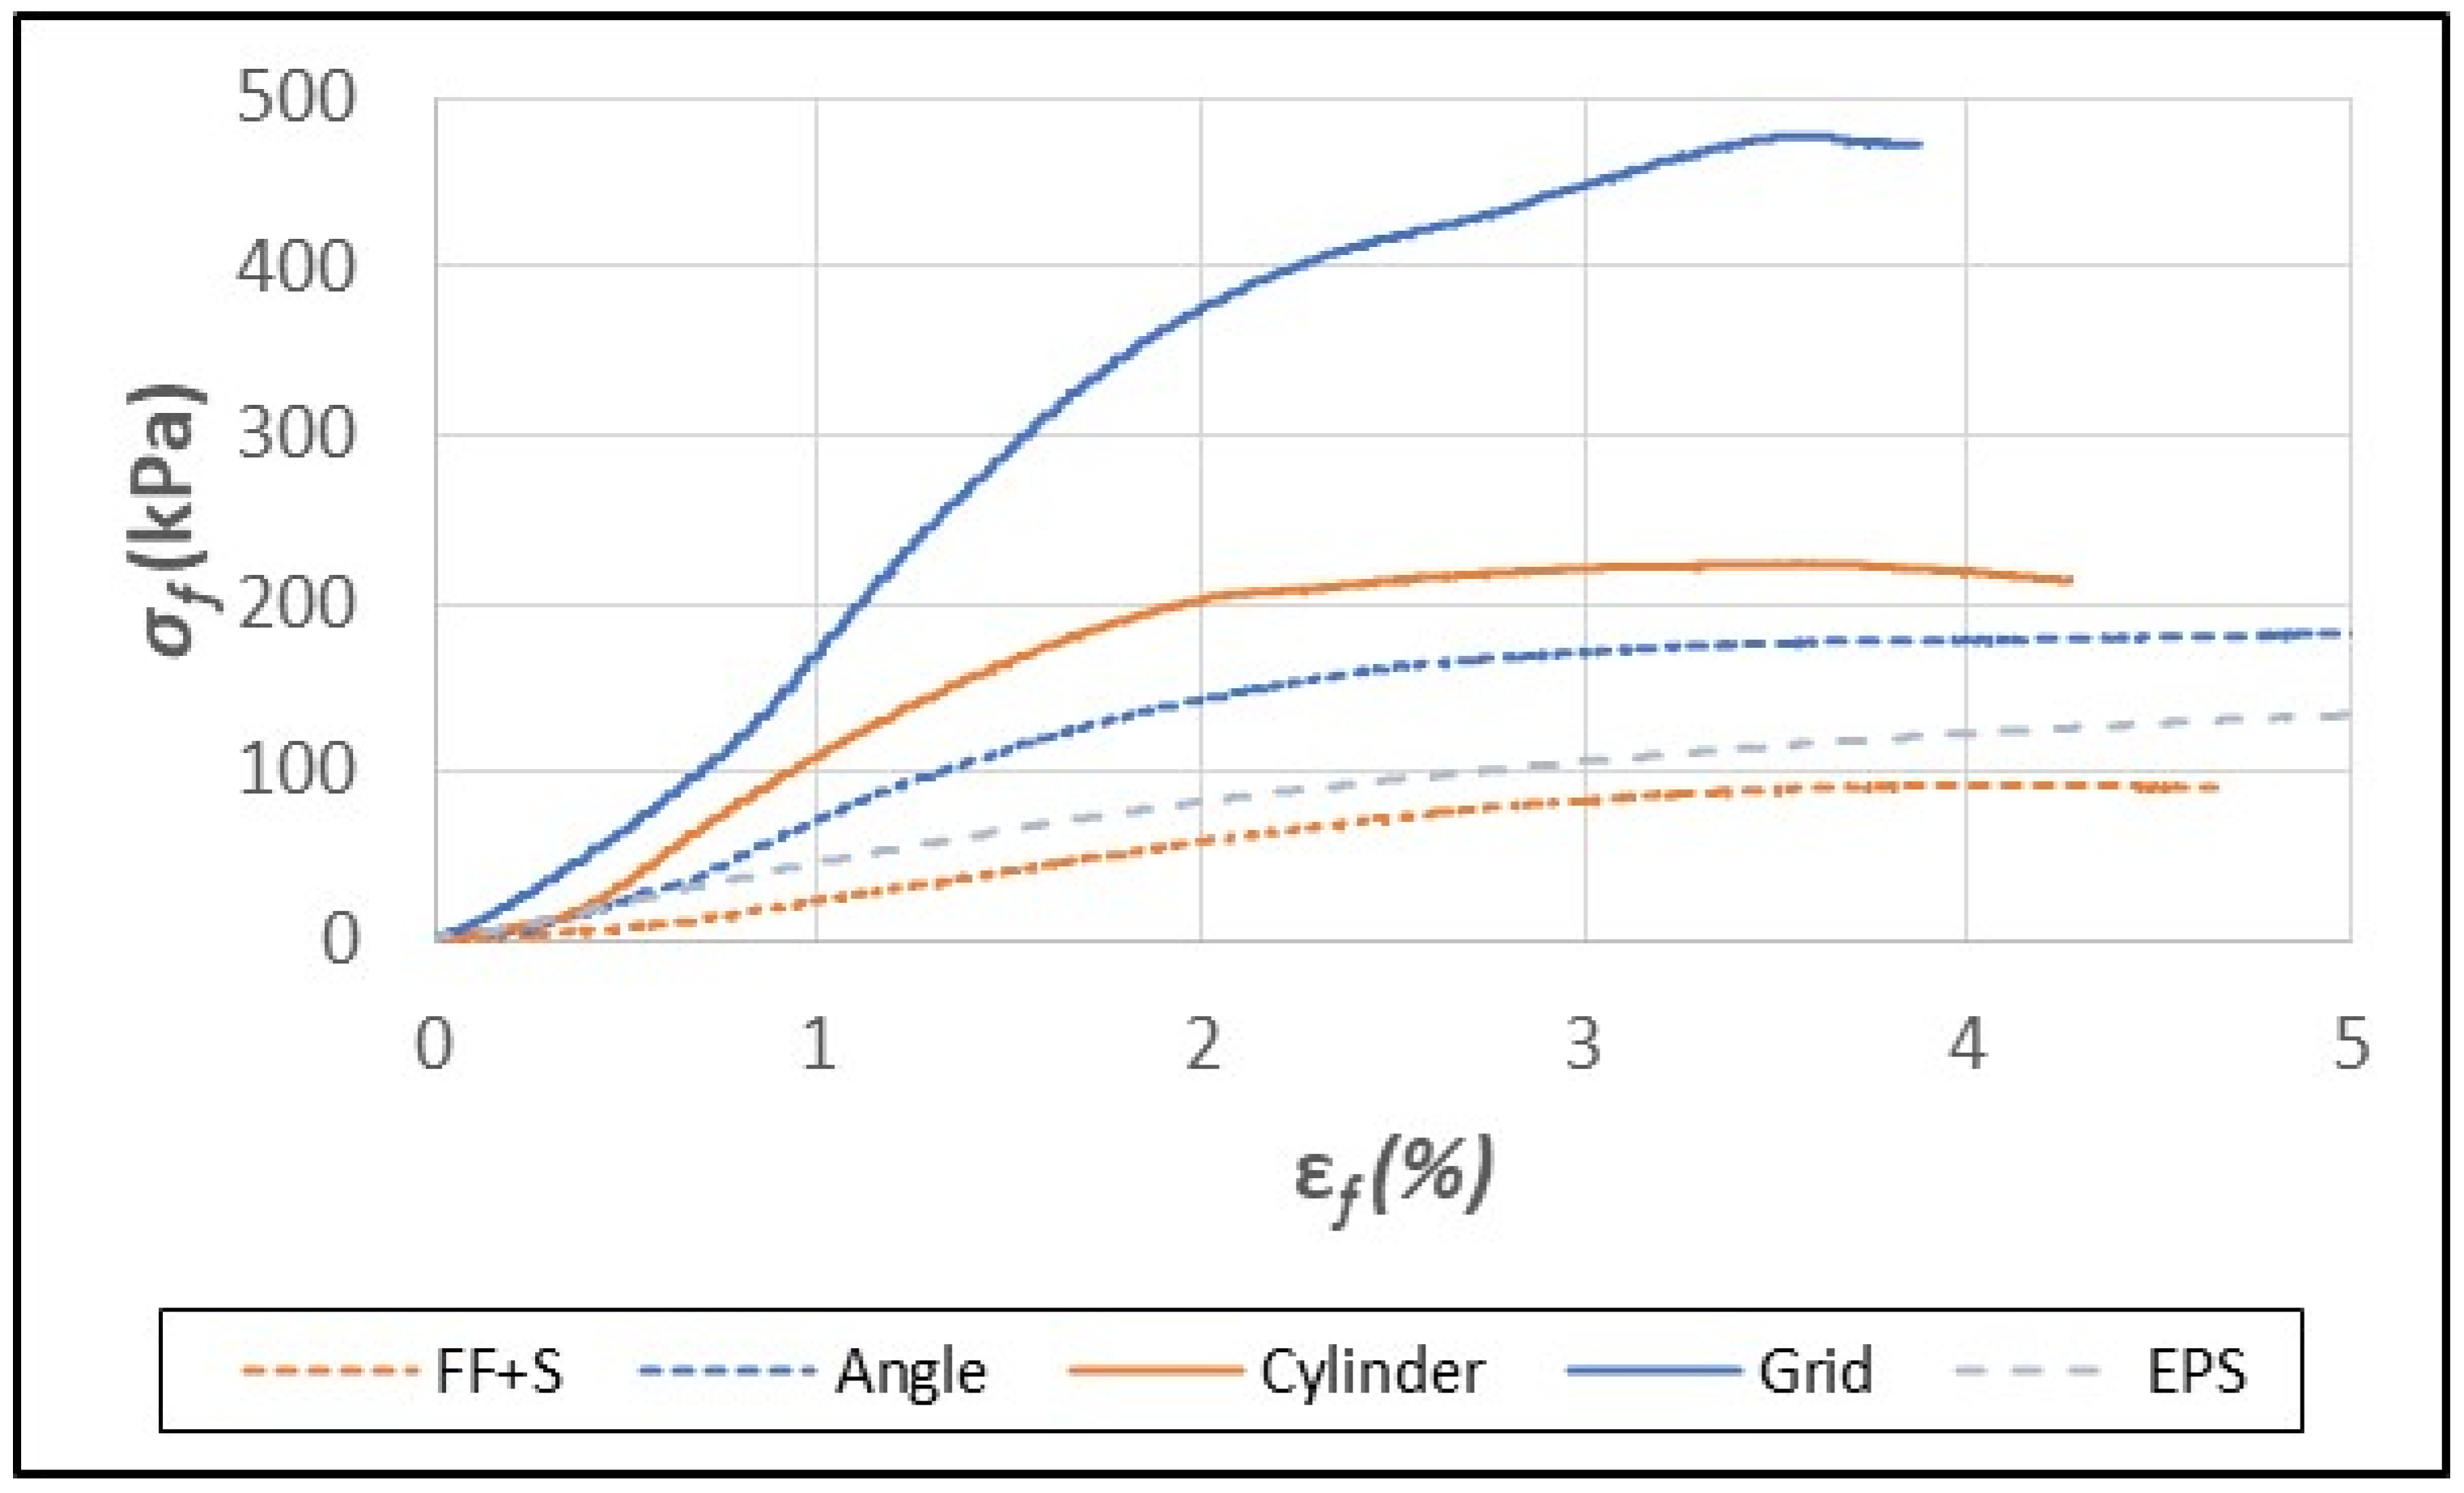
| σfM (kPa) | 30.8 a* | 94 bc | 36 a | 173 d | 67 ab | 224 e | 191 de | 460 f | 133 cd |
| εfM (%) | 5.0 | 3.57 ab | 5.0 | 4.18 ab | 5.0 | 4.40 ab | 2.90 a | 3.29 a | 5.00 c |
| Ef (MPa) | 1.12 a | 4.32 ab | 1.21 a | 9.45 bc | 2.57 a | 11.9 c | 10.6 c | 22.9 d | 4.29 a |
| Sample | FF-S | FF+S | FF-S Angle | FF+S Angle | FF-S Cyl. | FF+S Cyl. | FF-S Grid | FF+S Grid | EPS Foam |
|---|---|---|---|---|---|---|---|---|---|
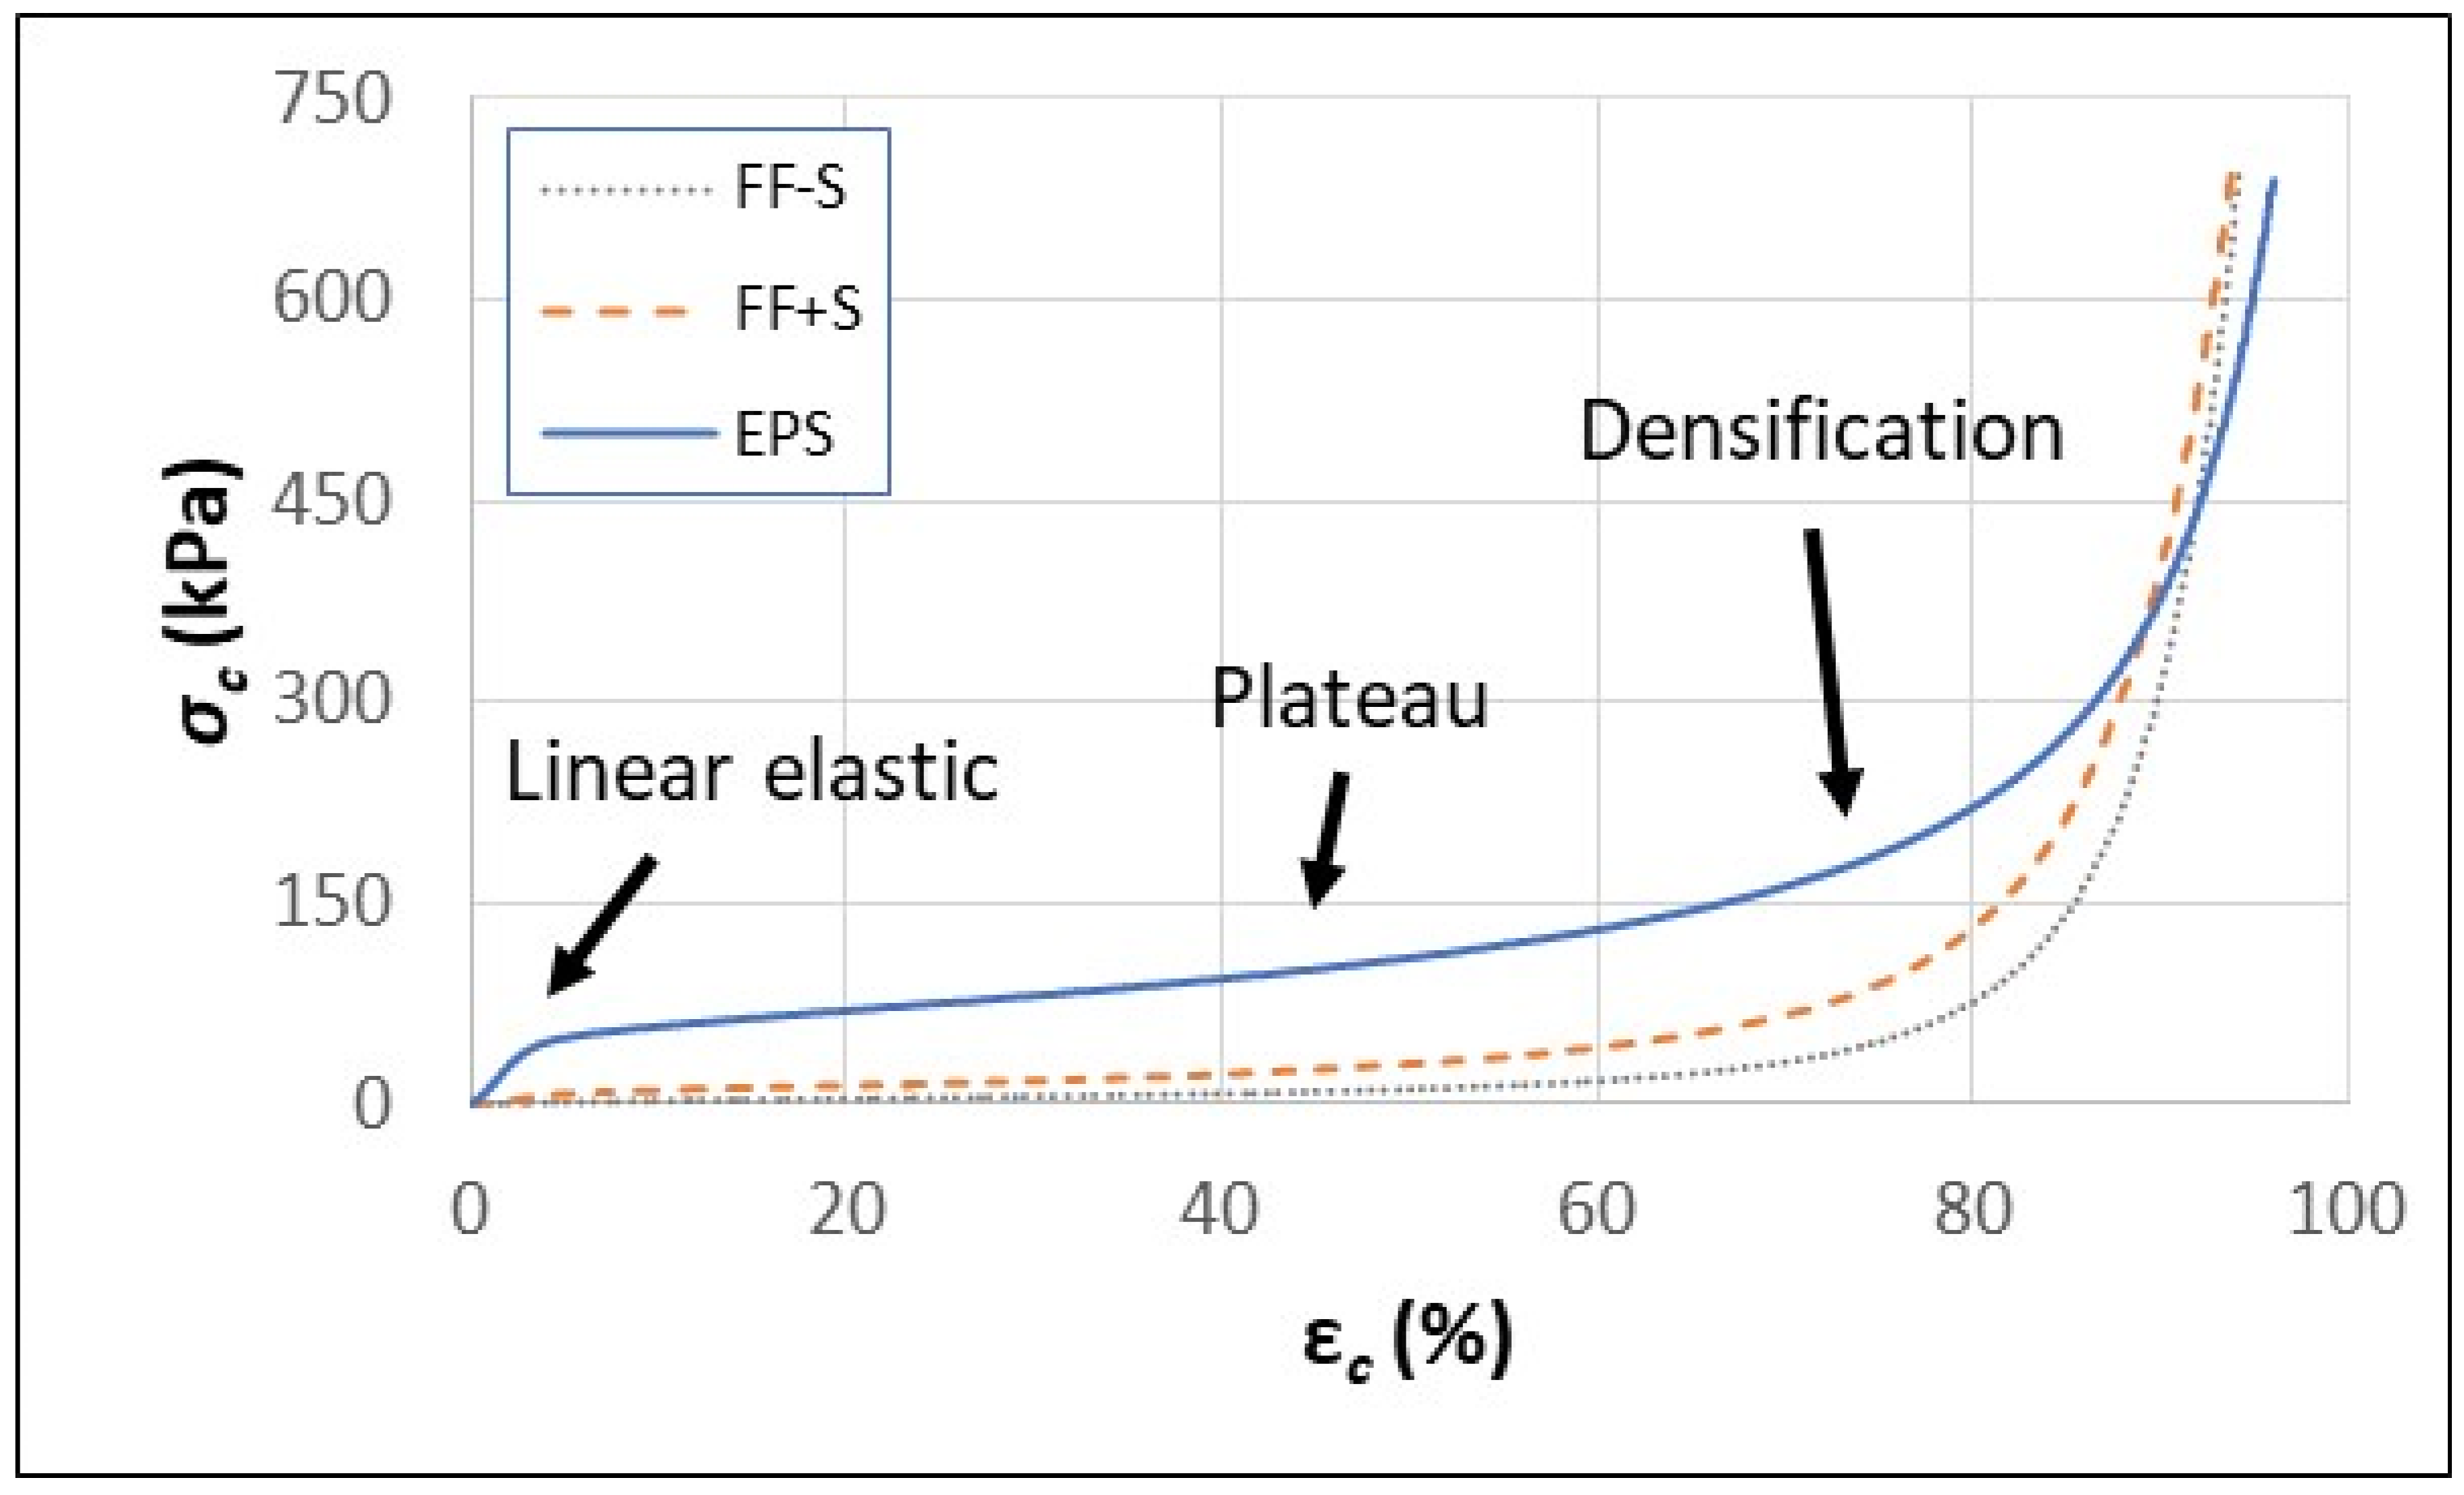
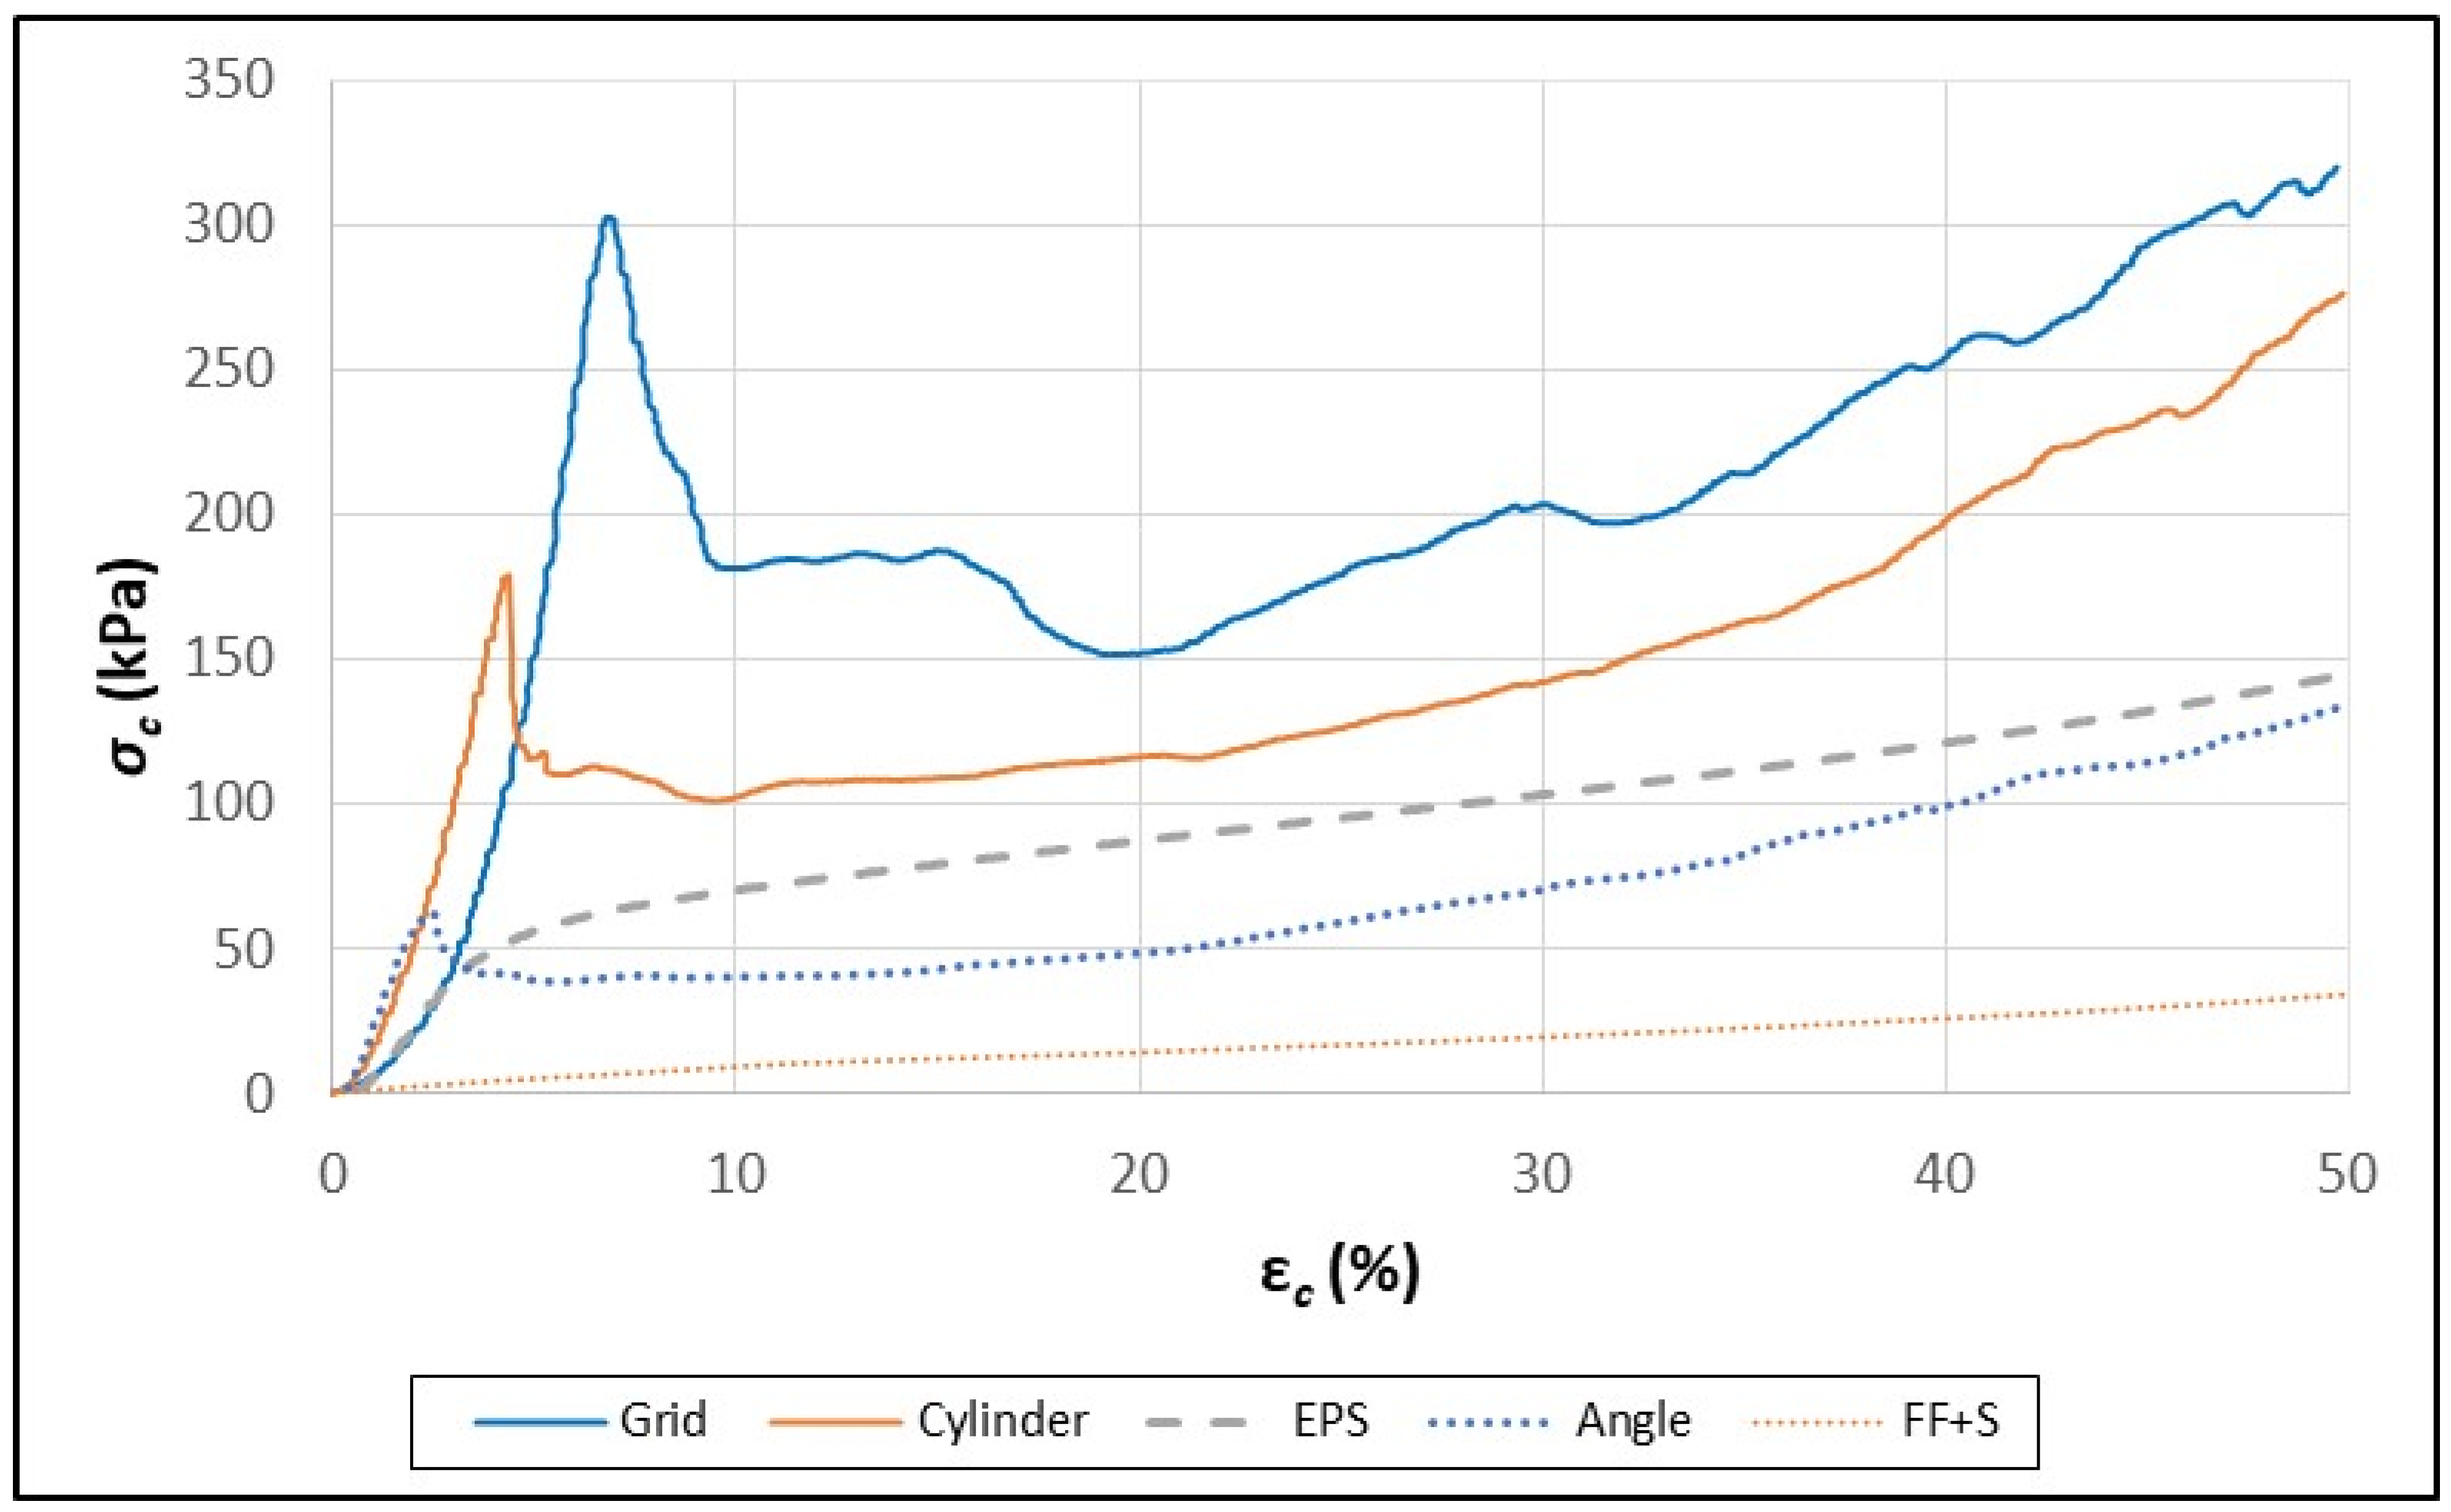
| CS (kPa) | 1.6 a* | 10 ab | 30 abc | 63 c | 121 d | 187 e | 192 e | 305 f | 55 bc |
| εc (%) | 10 e | 9.22 e | 6.0 cd | 2.1 a | 6.8 d | 3.9 abc | 4.5 bc | 3.7 ab | 4.0 cde |
| Ec (MPa) | 0.016 a | 0.16 a | 0.70 a | 3.4 bc | 2.1 ab | 5.0 bc | 5.1 bc | 8.7 d | 1.7 ab |
| Ωc (J) εc = 10% | 0.0056 a | 0.041 a | 0.13 ab | 0.24 b | 0.46 c | 0.74 d | 0.77 d | 1.1 e | 0.34 c |
| Ωc (J) εc = 50% | 0.14 a | 0.63 a | 0.66 a | 2.1 b | 2.2 b | 4.8 d | 2.5 bc | 6.2 e | 3.1 c |
Disclaimer/Publisher’s Note: The statements, opinions and data contained in all publications are solely those of the individual author(s) and contributor(s) and not of MDPI and/or the editor(s). MDPI and/or the editor(s) disclaim responsibility for any injury to people or property resulting from any ideas, methods, instructions or products referred to in the content. |
© 2024 by the authors. Licensee MDPI, Basel, Switzerland. This article is an open access article distributed under the terms and conditions of the Creative Commons Attribution (CC BY) license (https://creativecommons.org/licenses/by/4.0/).
Share and Cite
Glenn, G.M.; Tonoli, G.H.D.; Silva, L.E.; Klamczynski, A.P.; Wood, D.; Chiou, B.-S.; Lee, C.; Hart-Cooper, W.; McCaffrey, Z.; Orts, W. Effect of Starch and Paperboard Reinforcing Structures on Insulative Fiber Foam Composites. Polymers 2024, 16, 911. https://doi.org/10.3390/polym16070911
Glenn GM, Tonoli GHD, Silva LE, Klamczynski AP, Wood D, Chiou B-S, Lee C, Hart-Cooper W, McCaffrey Z, Orts W. Effect of Starch and Paperboard Reinforcing Structures on Insulative Fiber Foam Composites. Polymers. 2024; 16(7):911. https://doi.org/10.3390/polym16070911
Chicago/Turabian StyleGlenn, Gregory M., Gustavo H. D. Tonoli, Luiz E. Silva, Artur P. Klamczynski, Delilah Wood, Bor-Sen Chiou, Charles Lee, William Hart-Cooper, Zach McCaffrey, and William Orts. 2024. "Effect of Starch and Paperboard Reinforcing Structures on Insulative Fiber Foam Composites" Polymers 16, no. 7: 911. https://doi.org/10.3390/polym16070911
APA StyleGlenn, G. M., Tonoli, G. H. D., Silva, L. E., Klamczynski, A. P., Wood, D., Chiou, B.-S., Lee, C., Hart-Cooper, W., McCaffrey, Z., & Orts, W. (2024). Effect of Starch and Paperboard Reinforcing Structures on Insulative Fiber Foam Composites. Polymers, 16(7), 911. https://doi.org/10.3390/polym16070911