


Comparative Analysis of the Effects of Incorporating Post-Industrial Recycled LLDPE and Post-Consumer PE in Films: Macrostructural and Microstructural Perspectives in the Packaging Industry


Abstract
1. Introduction
2. Materials and Methods
2.1. Materials
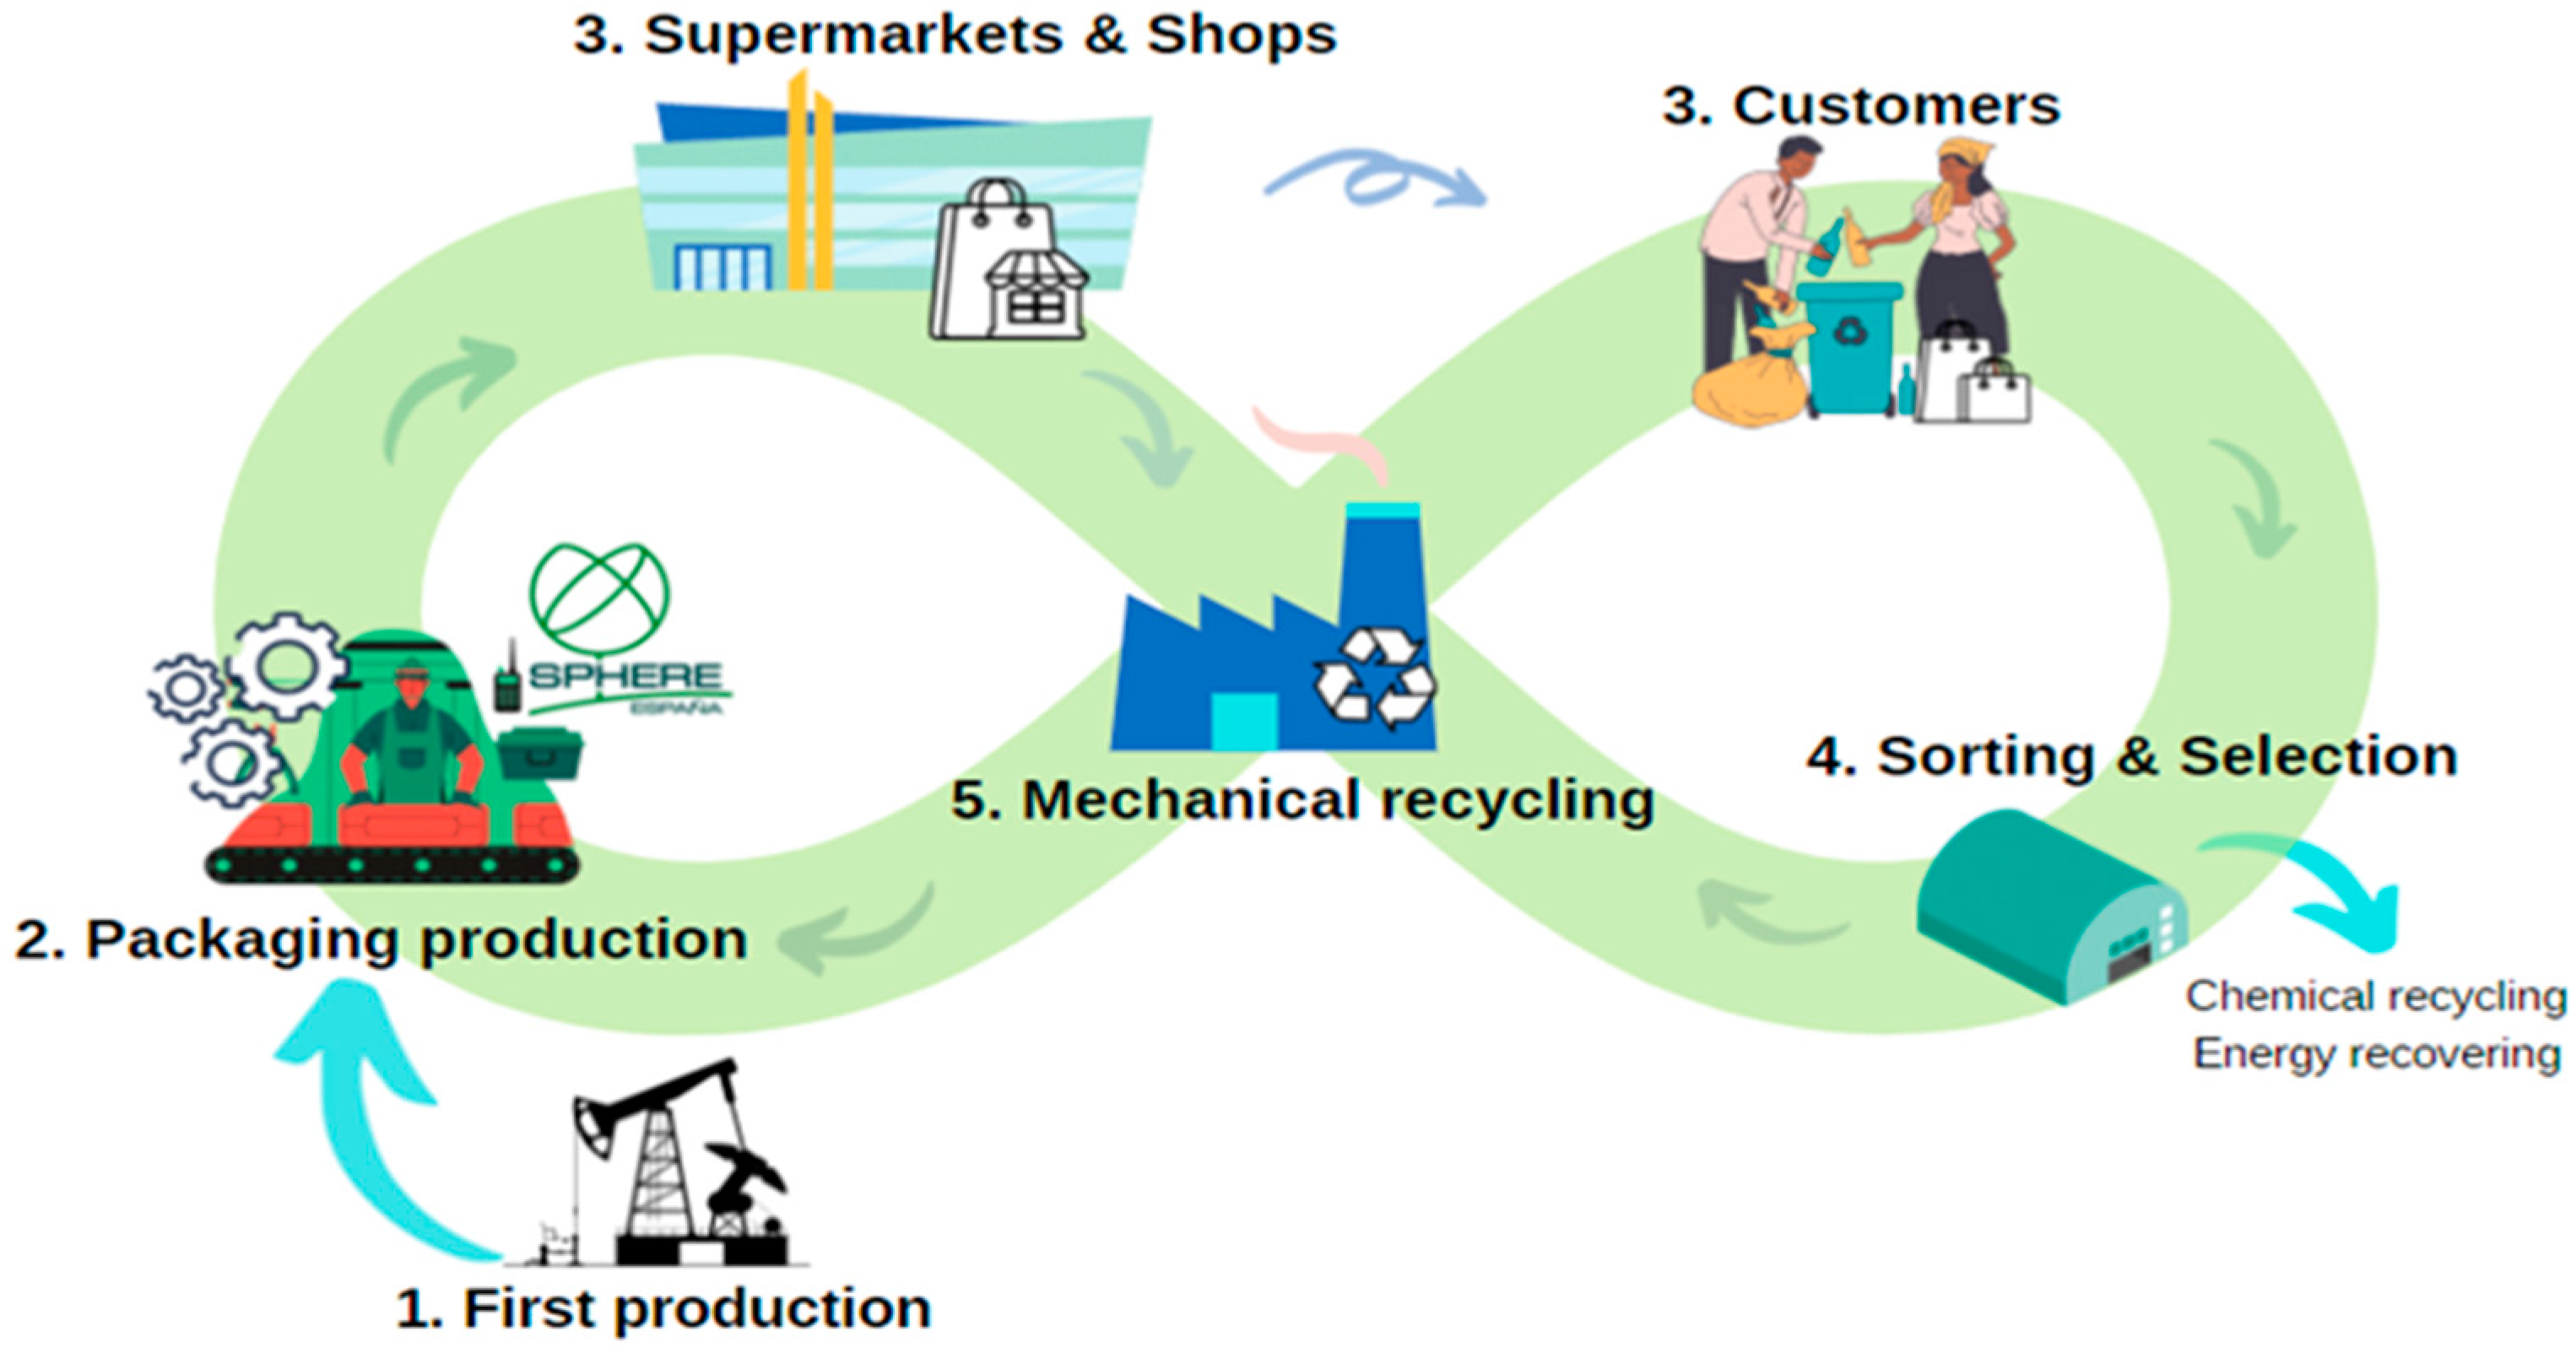
2.2. Circular Economy Applied to Packaging of Plastics
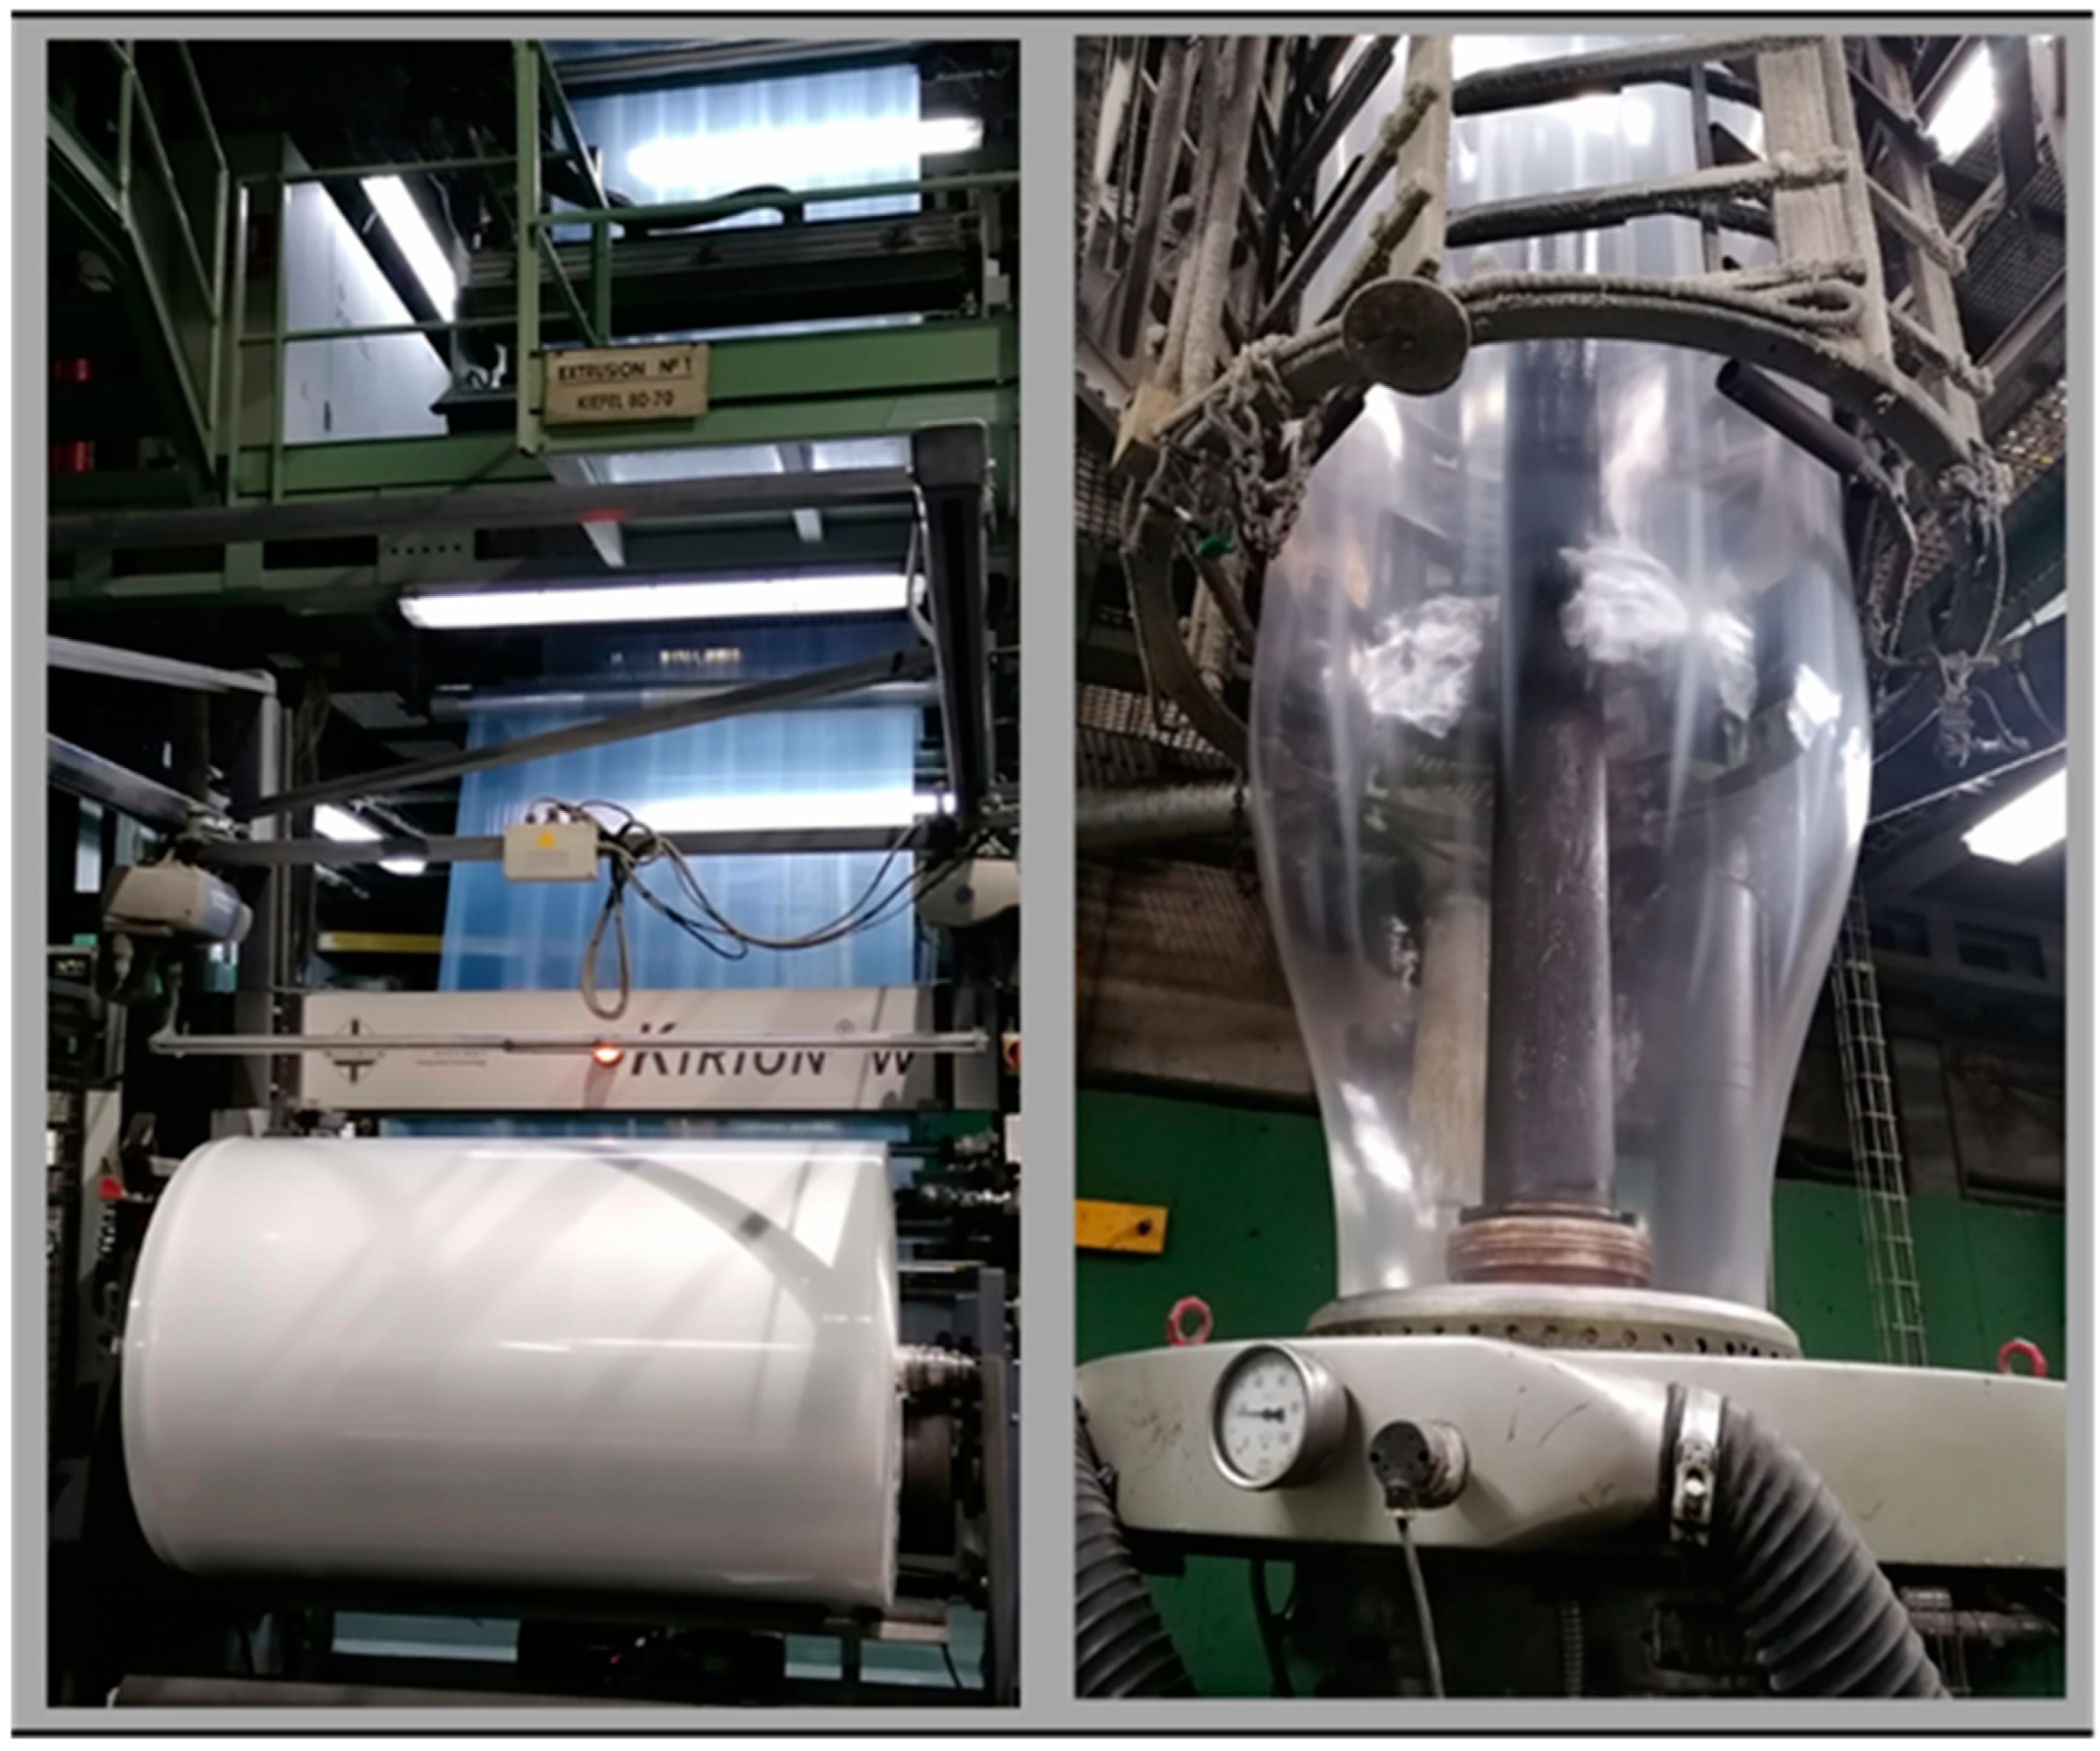
2.3. Manufacture of the Samples
- Fabrication of a first reference sample using LLDPE by blown film extrusion;
- The obtained film is ground and recovered by extrusion forming newly pellets;
- The pellets are used again in the production of film by blown extrusion;
- This process is repeated 4 times, analyzing the changes induced in the samples by the repeated recycling of the film.
2.4. Film Characterization
3. Results
3.1. Specifications
3.2. Mechanical Properties
3.2.1. Tensile Strength
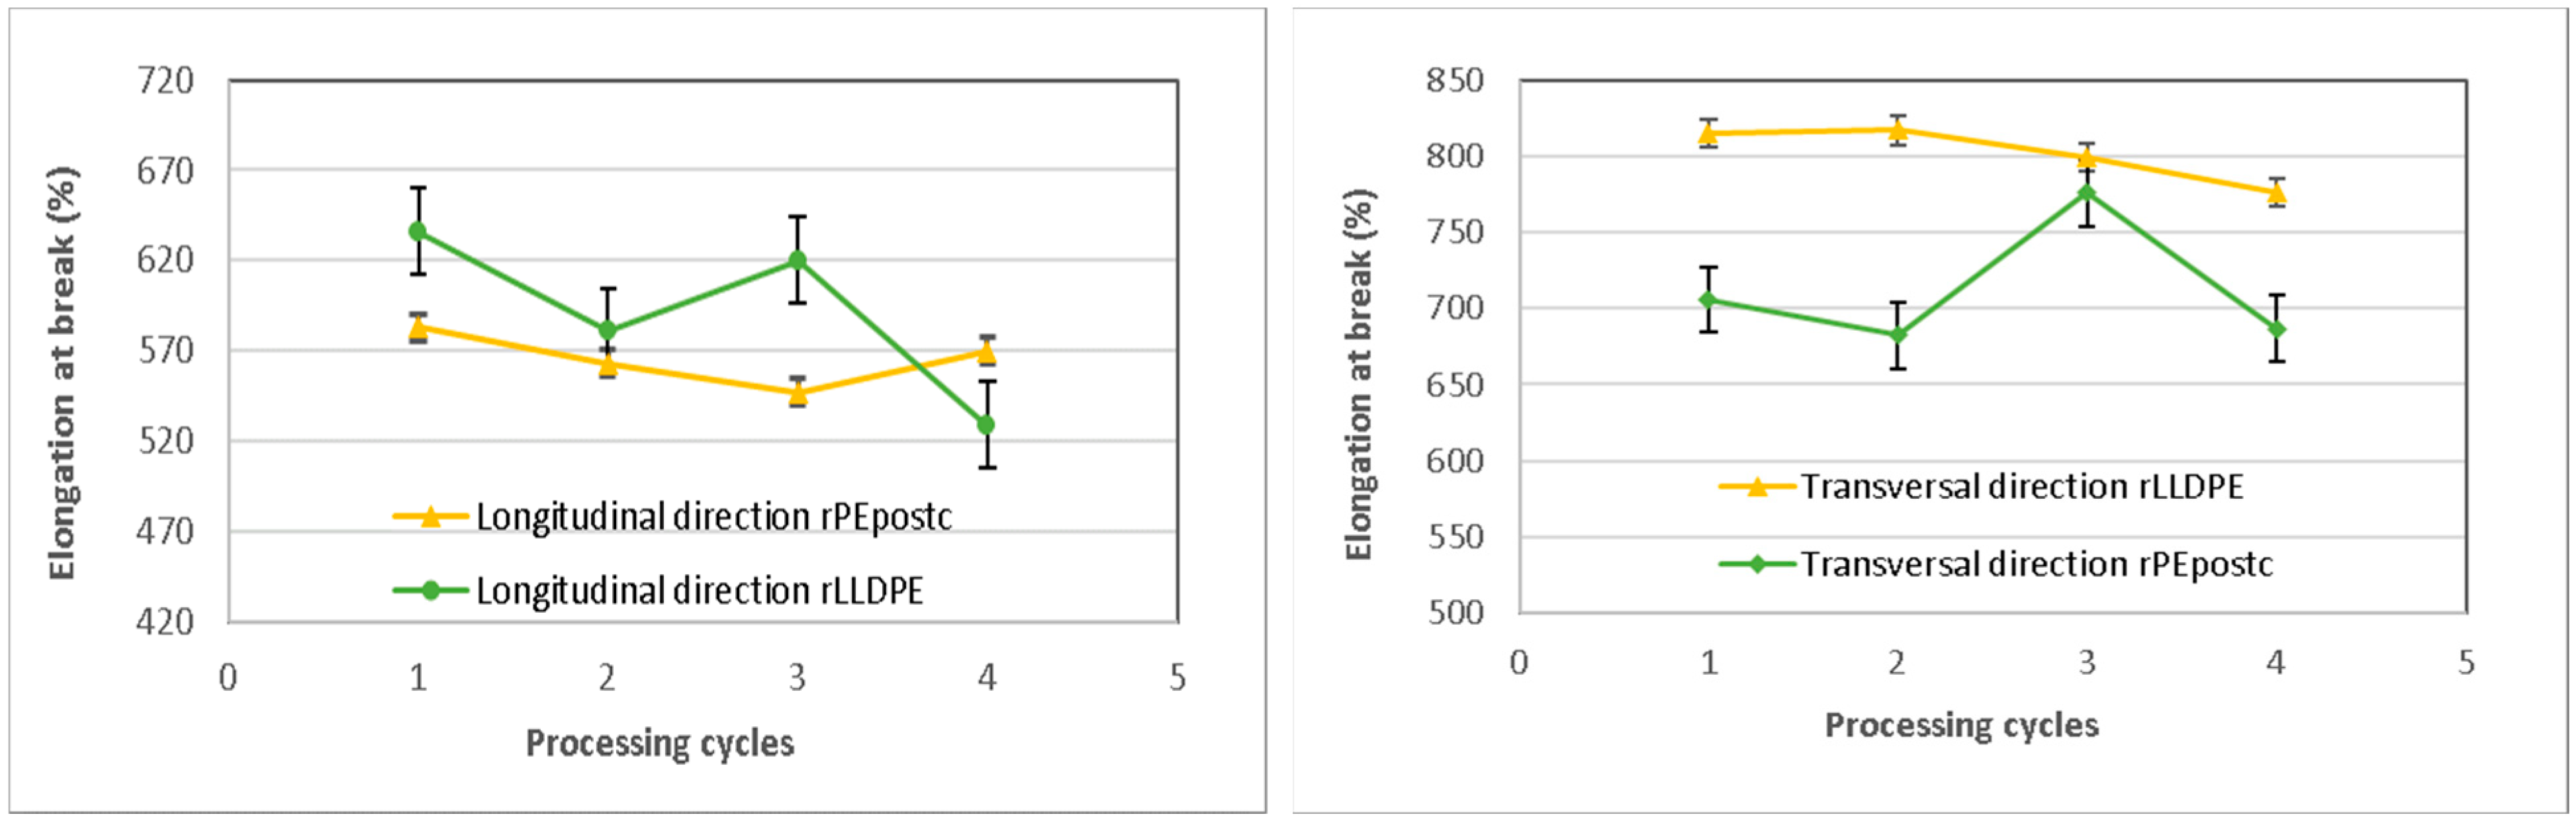
3.2.2. Elongation at Break
3.2.3. Elmendorf Tear Strength Test
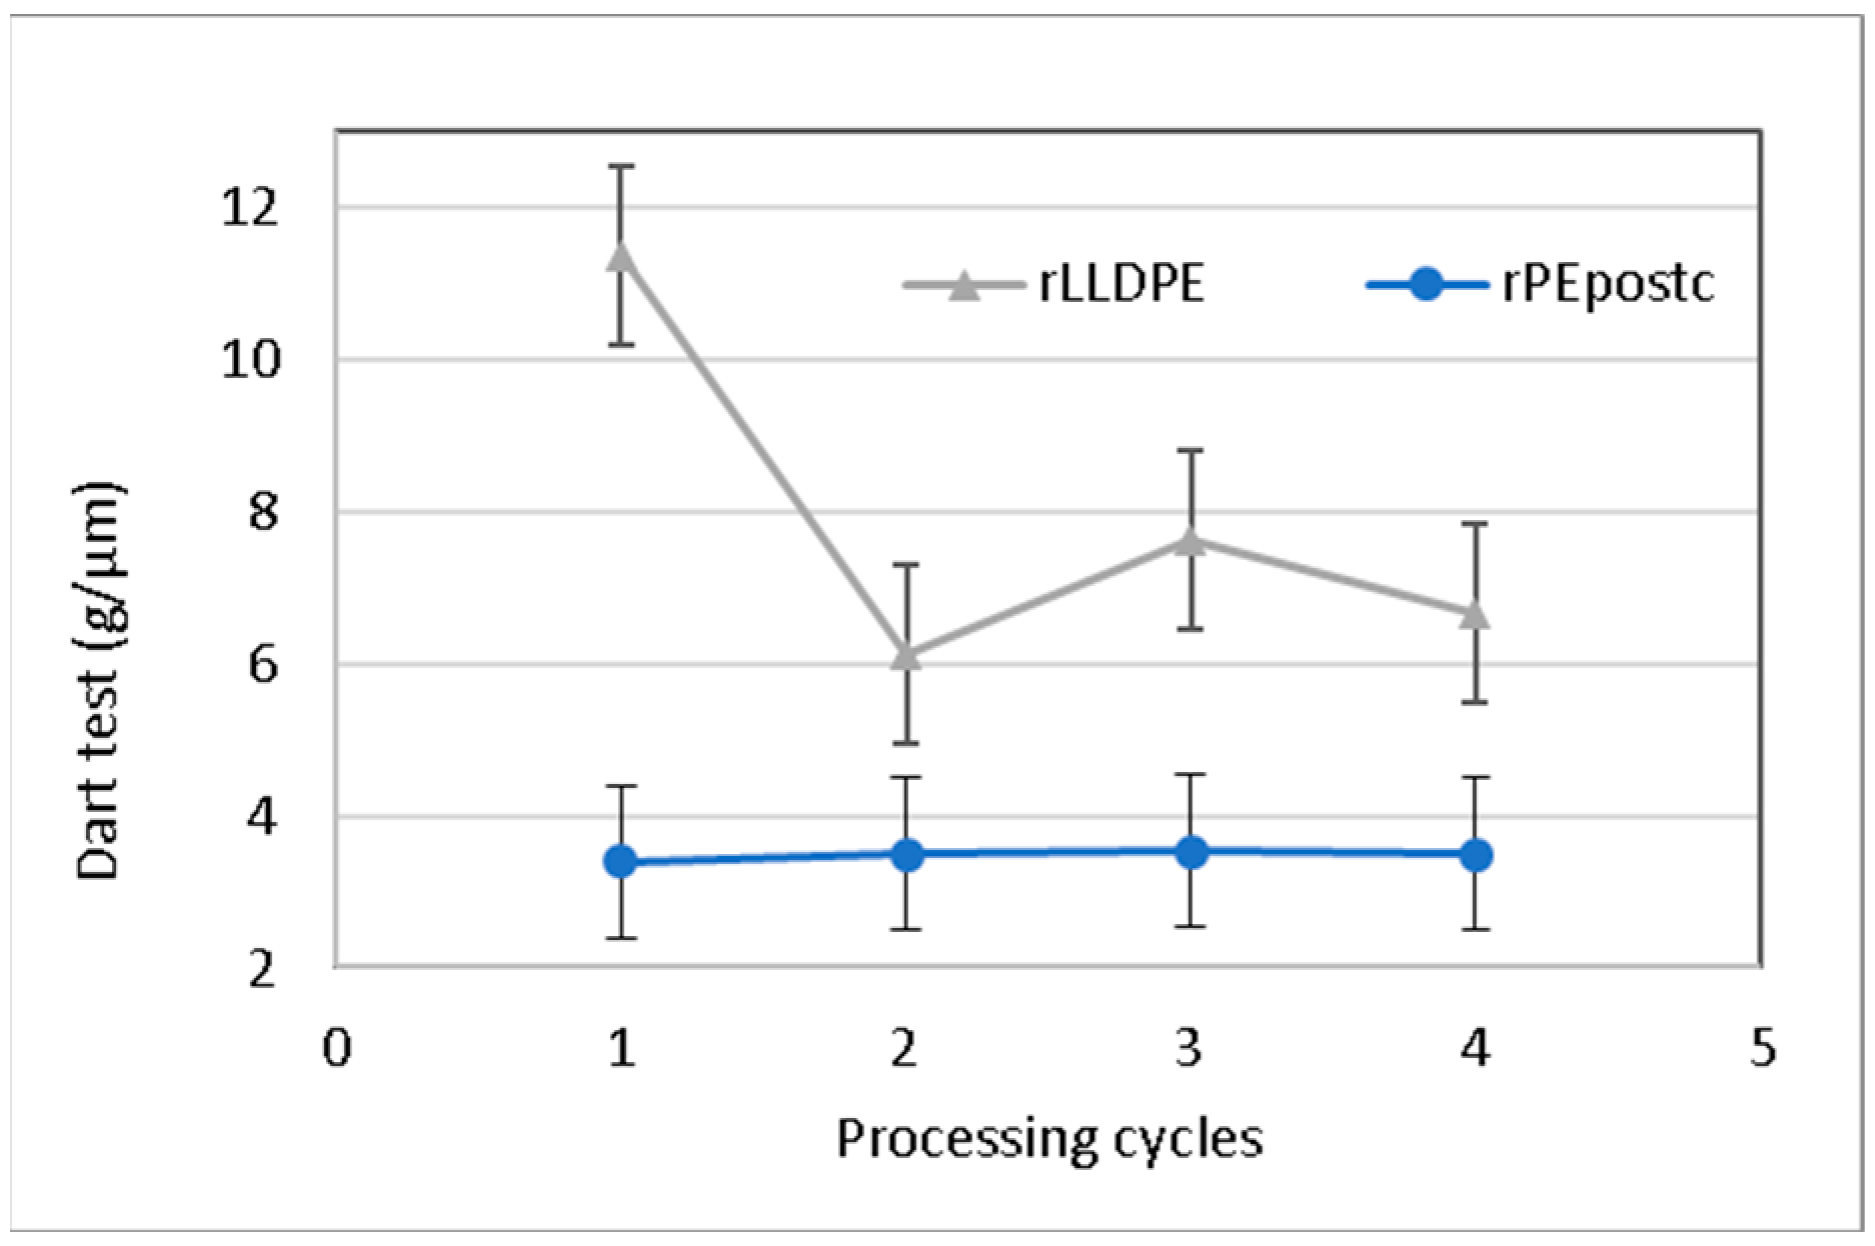
3.2.4. Impact Test
3.3. Colorimetry and Optical Properties
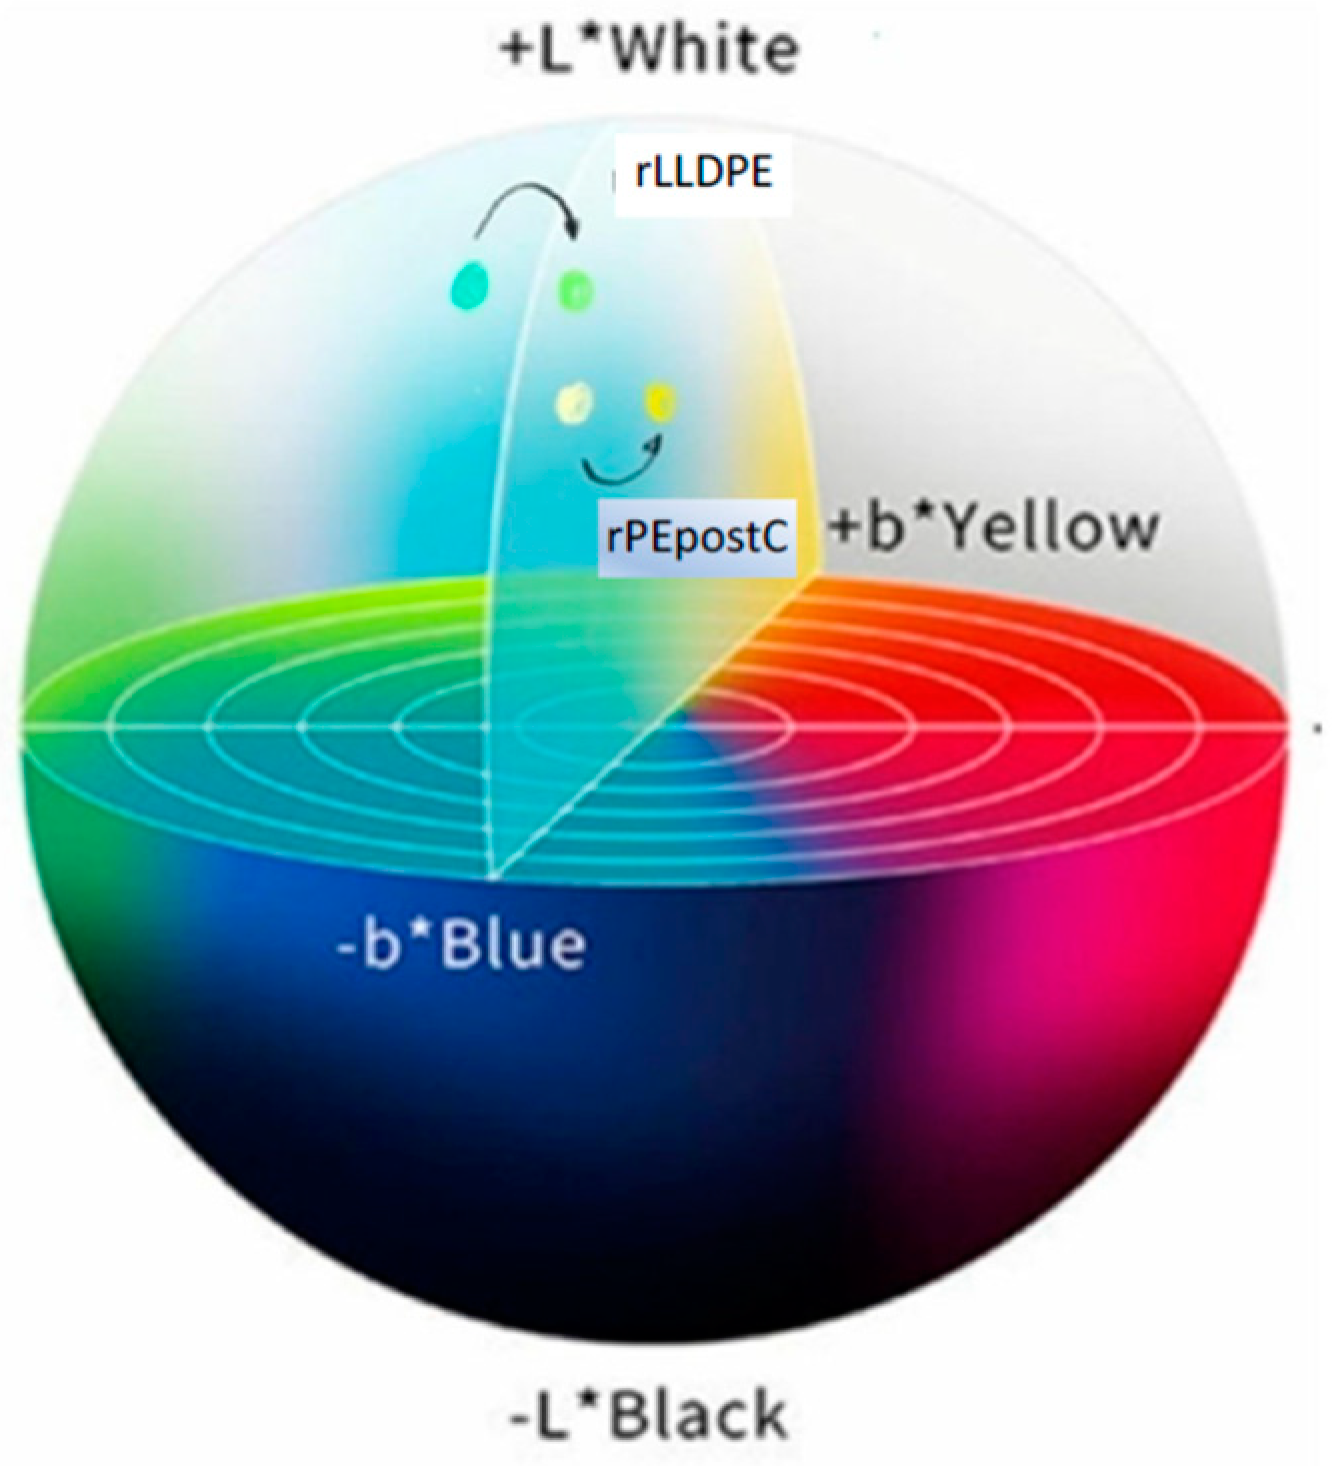
3.3.1. Colorimetry
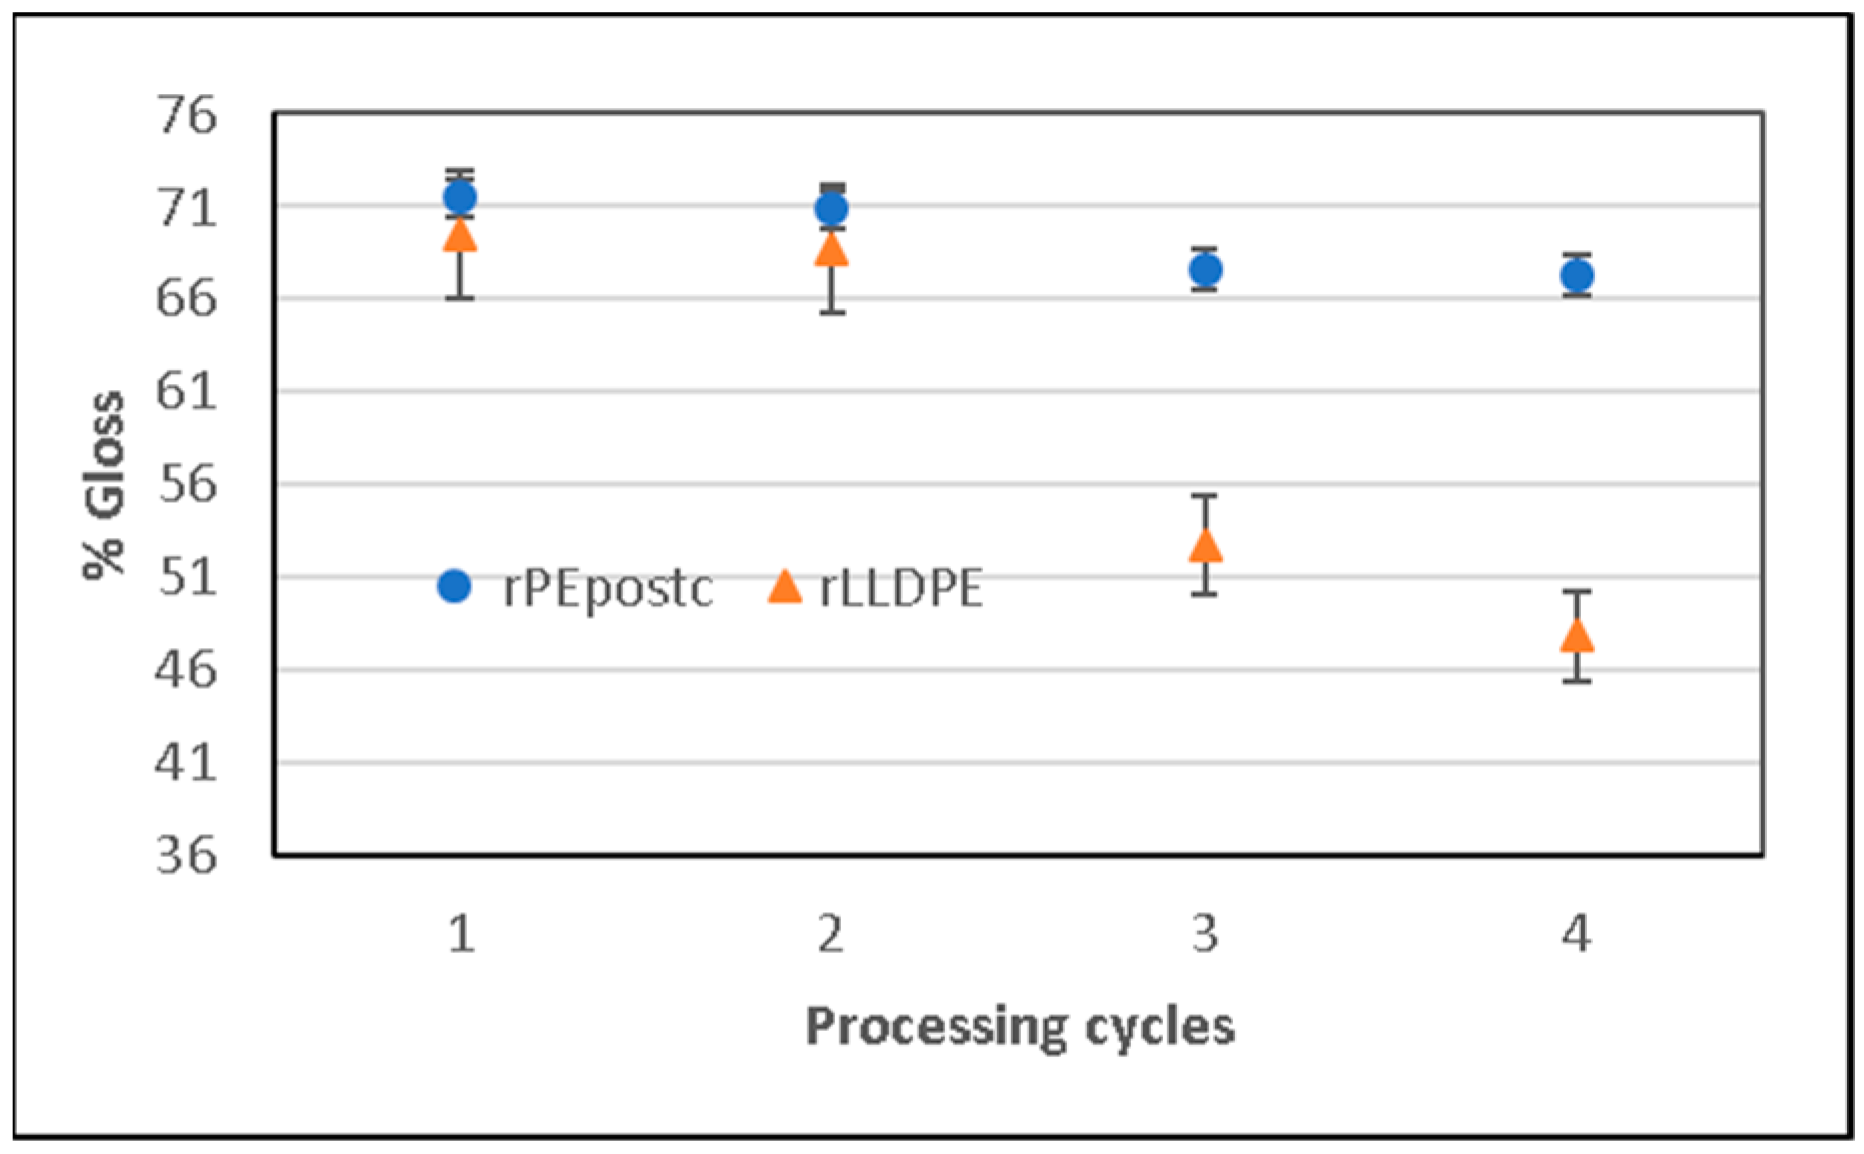
3.3.2. Gloss
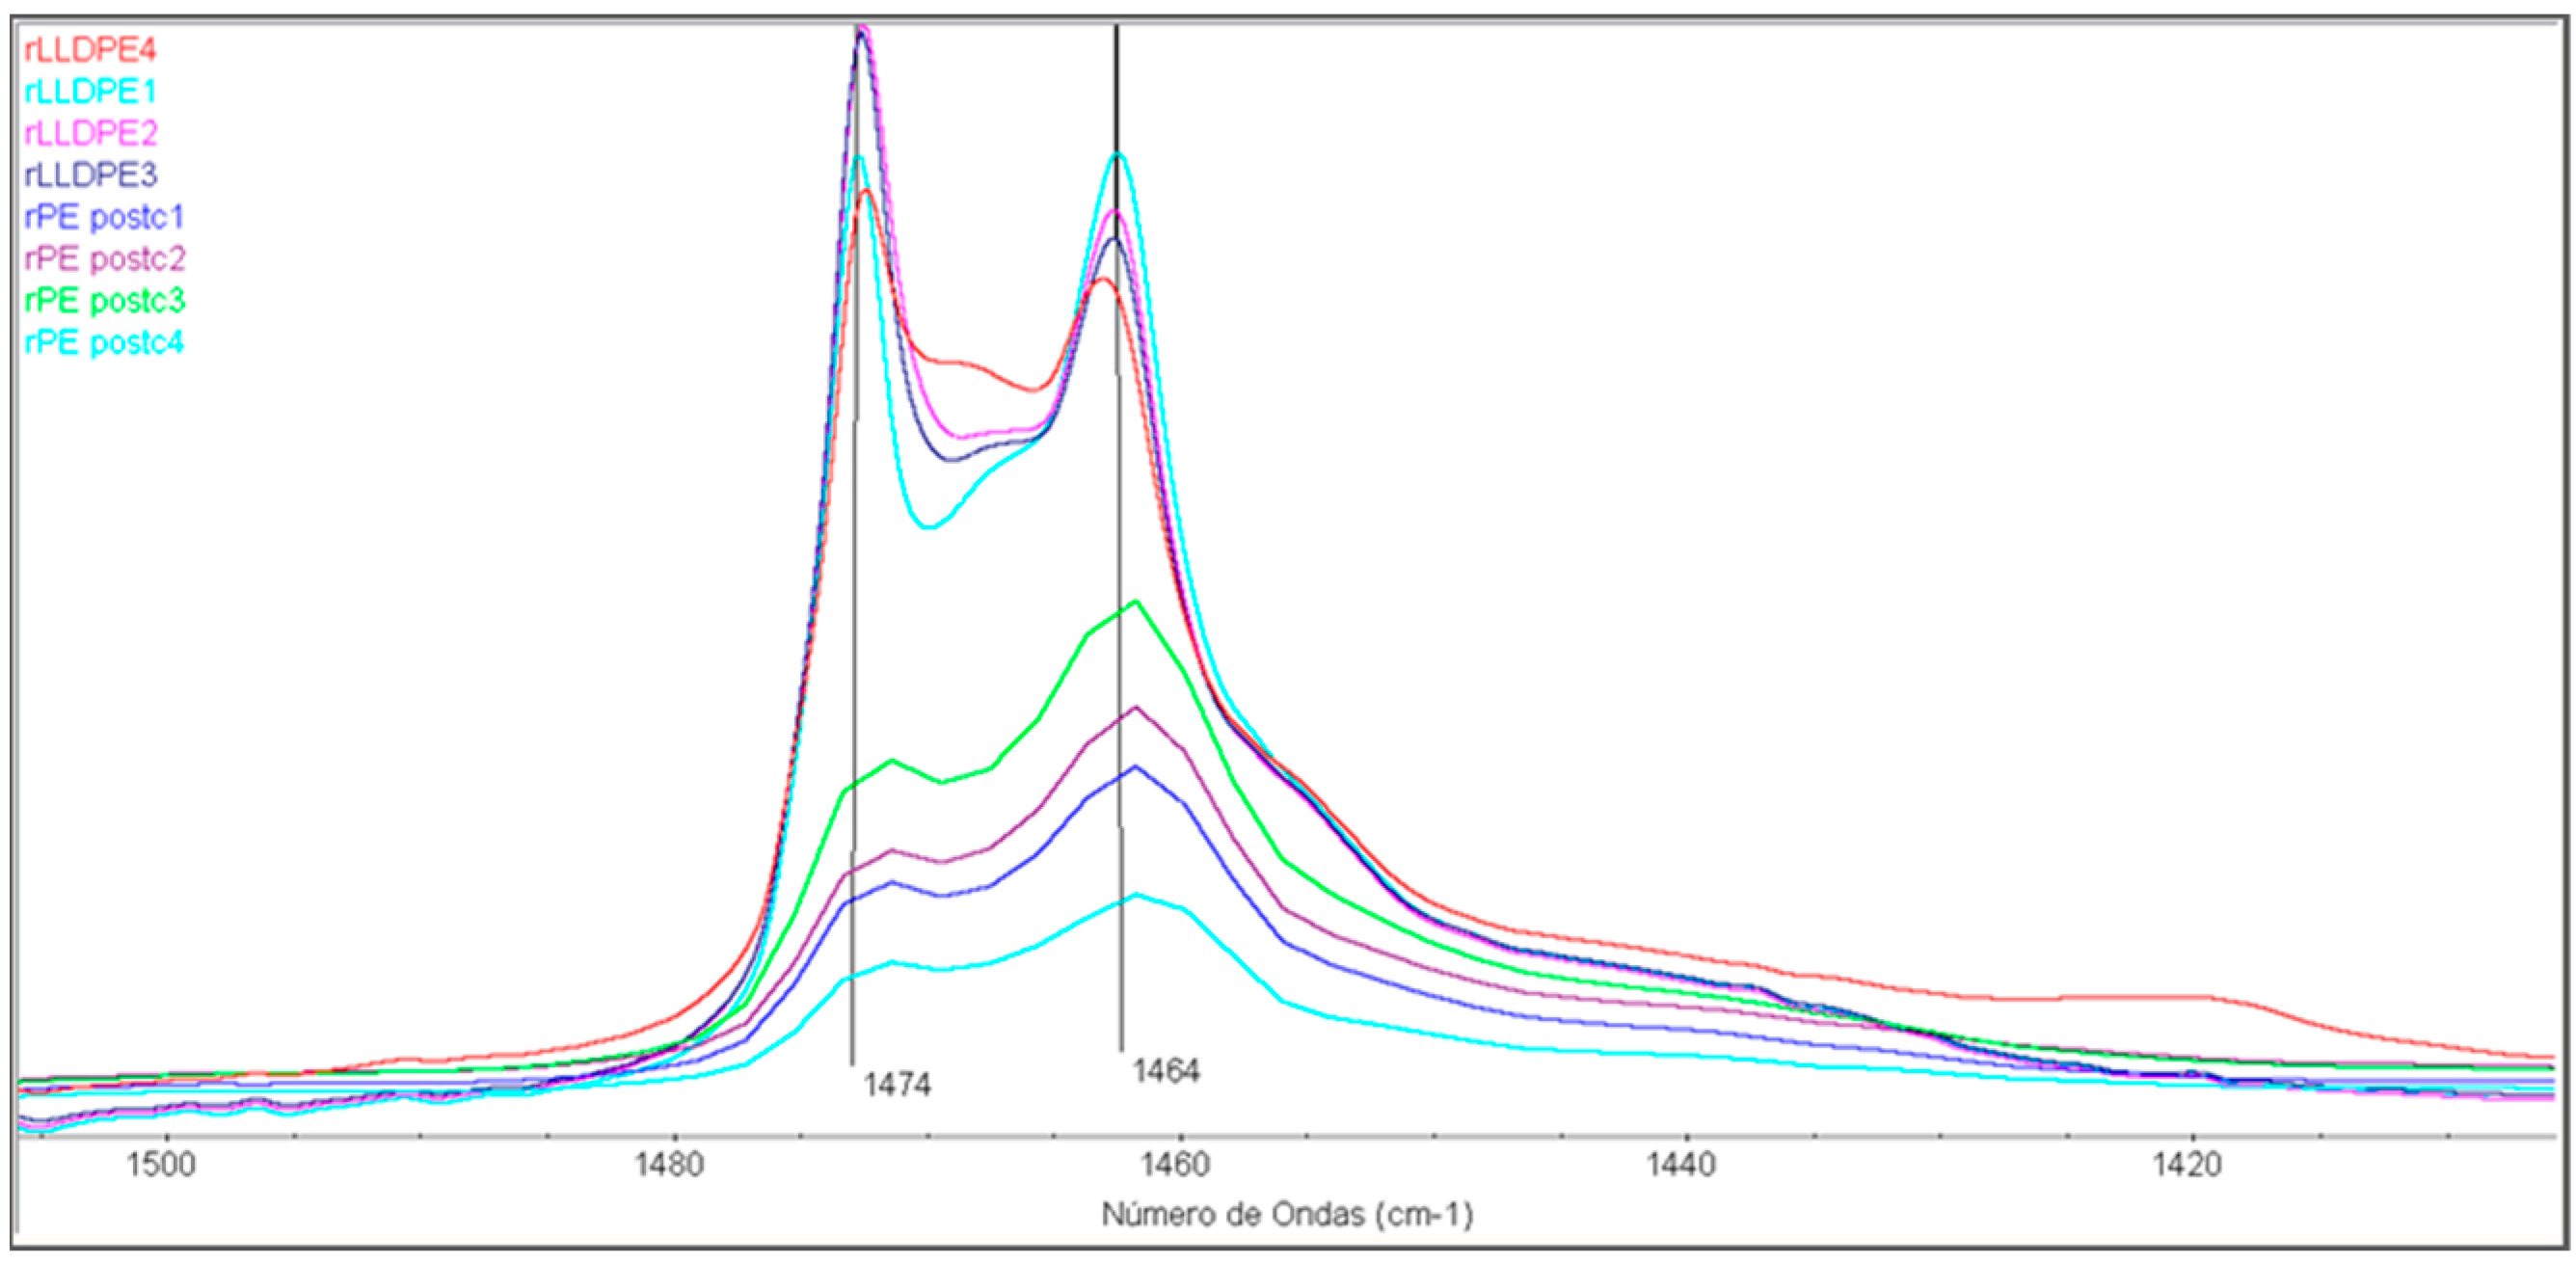
3.4. Infrared Spectroscopy Characterization
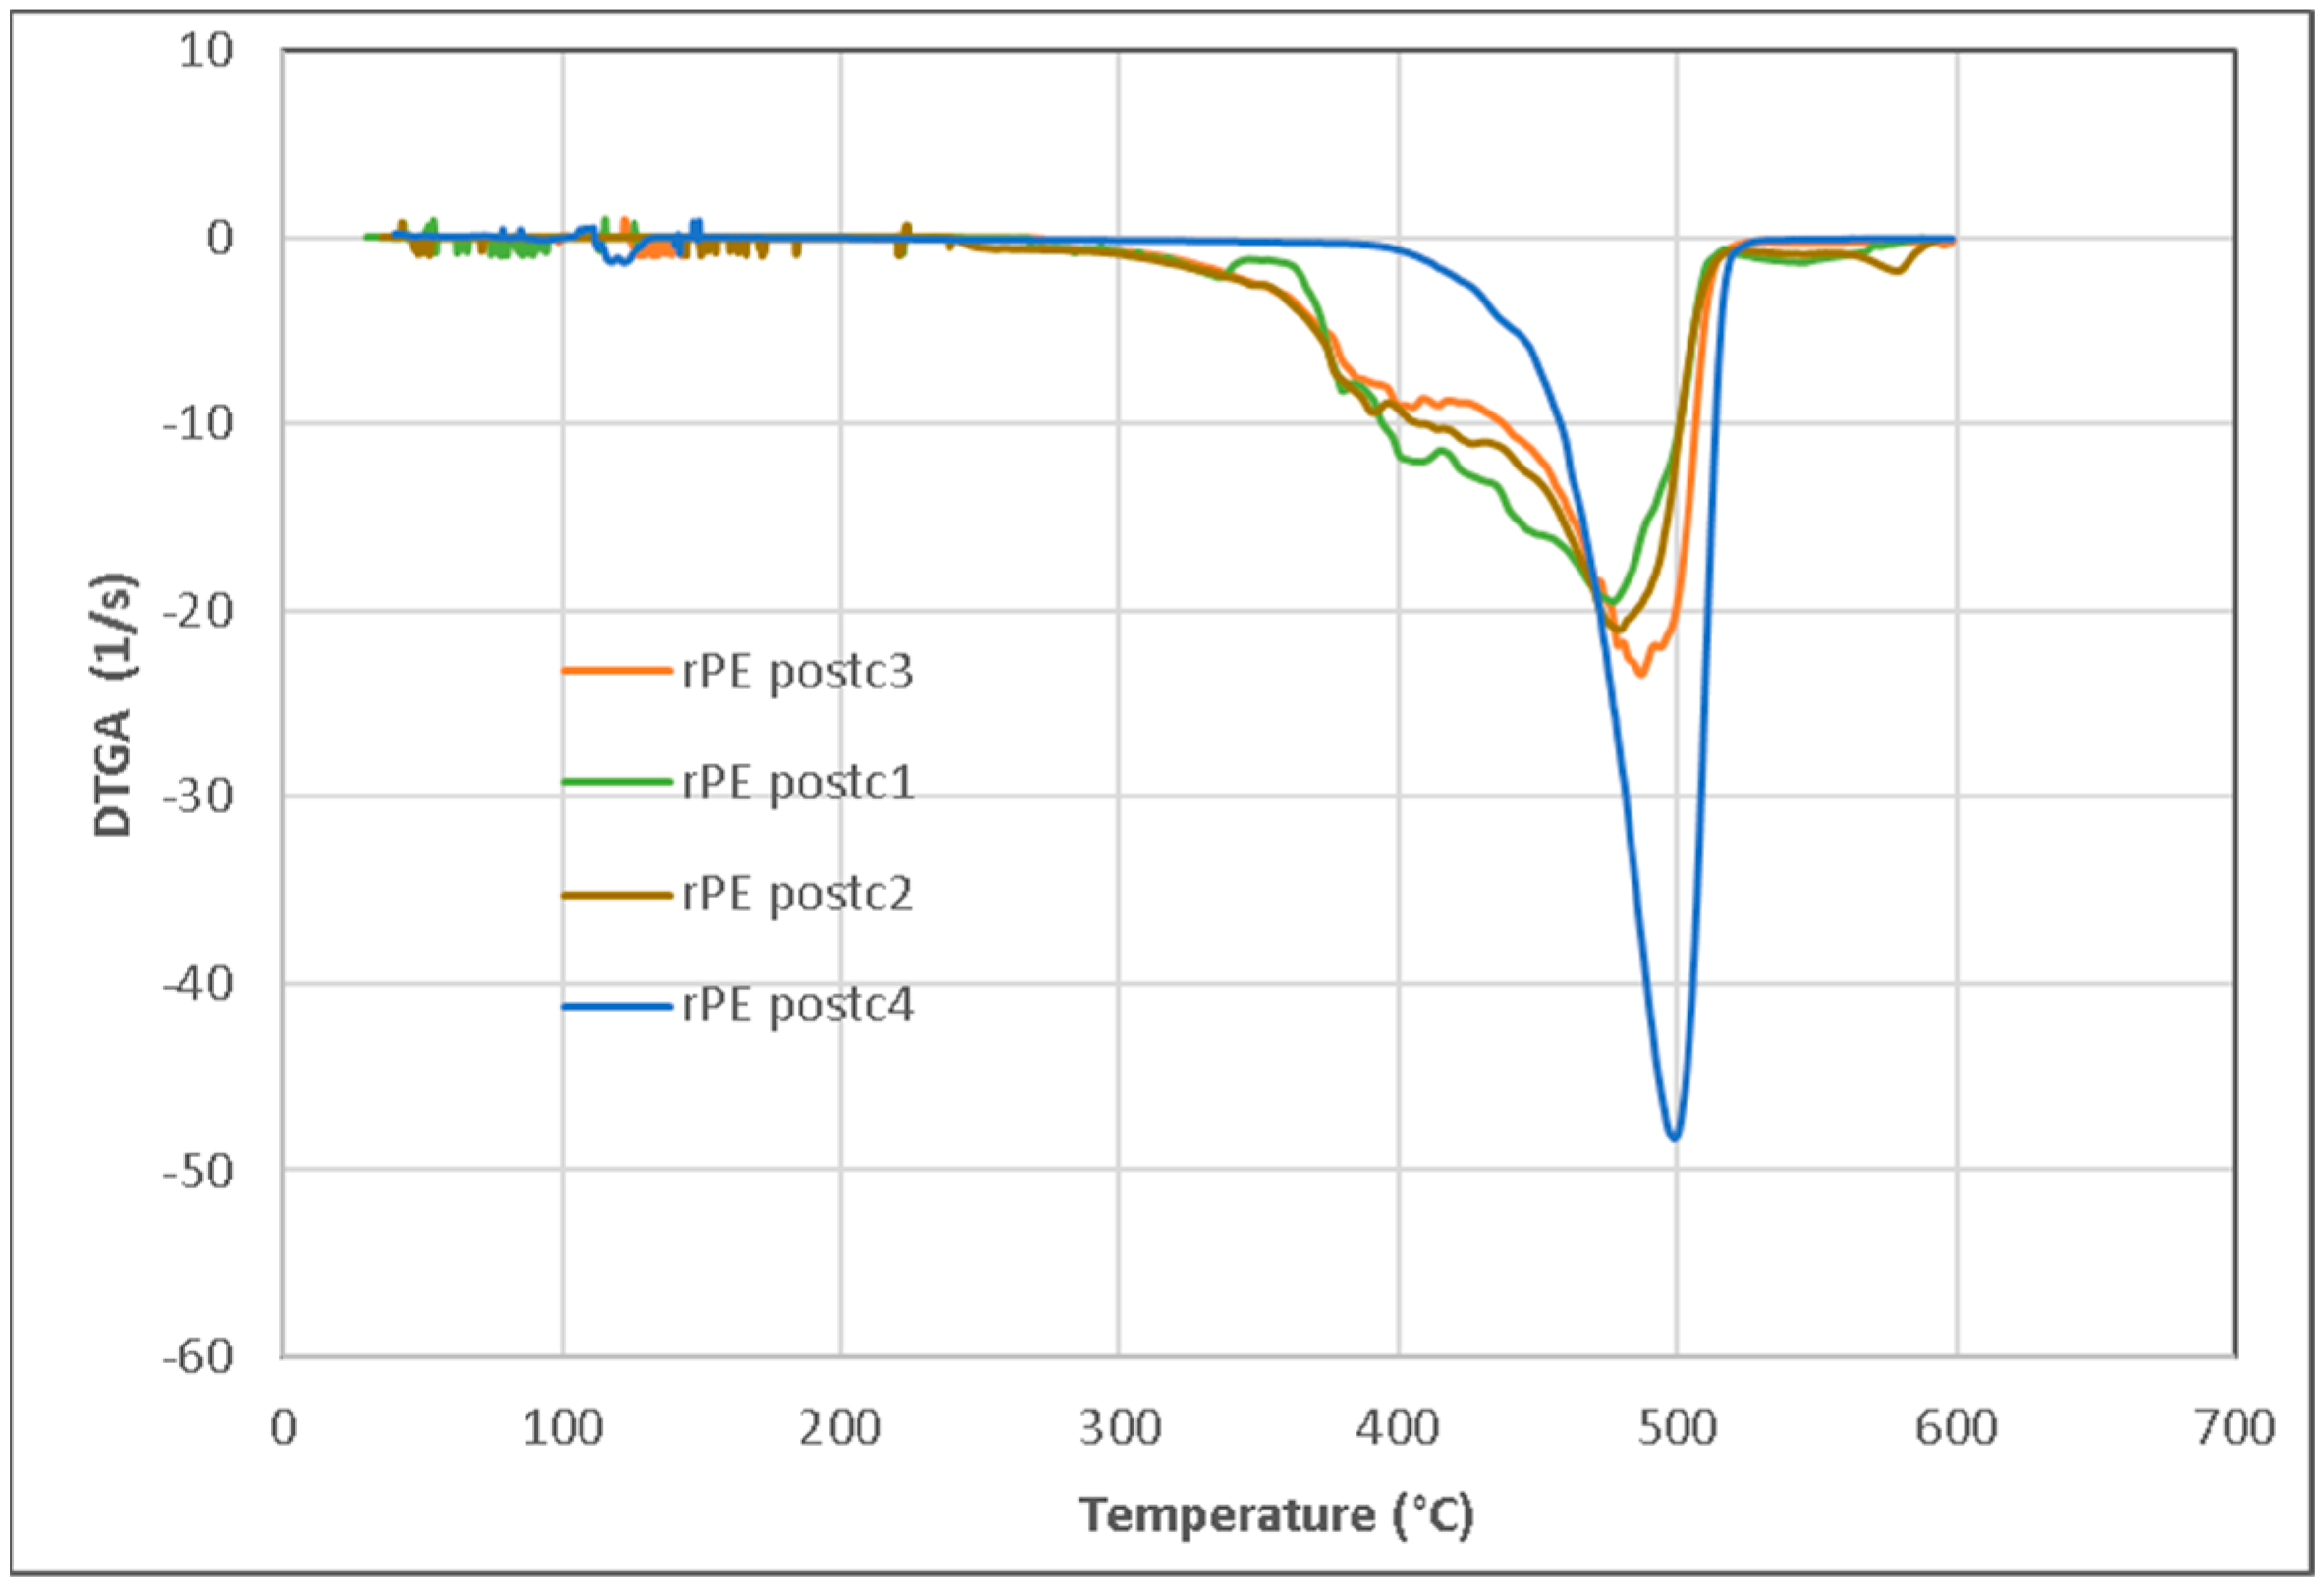
3.5. Thermogravimetric Analysis
4. Conclusions
Author Contributions
Funding
Data Availability Statement
Acknowledgments
Conflicts of Interest
References
- Available online: https://plasticseurope.org/es/wp-content/uploads/sites/4/2023/10/Plastics-the-fast-Facts-2023.pdf (accessed on 3 December 2023).
- Available online: https://ec.europa.eu/environment/strategy/circular-economy-action-plan_es (accessed on 26 December 2023).
- Directive (UE) 2019/904 EU Parliament and Council, 5 June 2019, Related to the Reduction of the Impact of Plastics in the ENVIRONMENT (DO L 155 12.6.2019, p.1.). Available online: https://eur-lex.europa.eu/eli/dir/2019/904/oj (accessed on 12 March 2024).
- Ballestar de las Heras, R.; Fernández Ayala, S.; Molina Salazar, E.; Carrillo, F.; Cañavate, J.; Colom, X. Circular Economy Insights on the Suitability of New Tri-Layer Compostable Packaging Films after Degradation in Storage Conditions. Polymer 2023, 15, 4154. [Google Scholar] [CrossRef]
- Mazur-Wierzbicka, E. Circular economy: Advancement of European Union countries. Environ. Sci. Eur. 2021, 33, 111. [Google Scholar] [CrossRef]
- Available online: https://ec.europa.eu/info/strategy/priorities-2019-2024/european-green-deal_en (accessed on 26 December 2023).
- Available online: https://www.boe.es/buscar/doc.php?id=BOE-A-2018-6651 (accessed on 29 February 2024).
- Soto, J.M.; Blázquez, G.; Calero, M.; Quesada, L.; Godoy, V.; Martín-Lara, M.Á. A real case study of mechanical recycling as an alternative for managing of polyethylene plastic film presented in mixed municipal solid waste. J. Clean. Prod. 2018, 203, 777–787. [Google Scholar] [CrossRef]
- Brouwer, M.T.; Thoden van Velzen, E.U.; Augustinus, A.; Soetnoudt, H.; De Meester, S.; Ragaert, K. Predictive model for the Dutch post-consumer Plastic packaging recycling system and implications for the circular economy. Waste Manag. 2018, 71, 62–85. [Google Scholar] [CrossRef]
- Colom, X.; Cañavate, J.; Suñol, J.J.; Pagès, P.; Saurina, J.; Carrasco, F. Natural and artificial aging of polypropylene–polyethylene copolymers. J. Appl. Polym. Sci. 2003, 87, 1685–1692. [Google Scholar] [CrossRef]
- Bertin, S.; Robin, J.J. Study and characterization of virgin and recycled LDPE/PP blends. Eur. Polym. J. 2002, 38, 2255–2264. [Google Scholar] [CrossRef]
- Elzubair, A.; Suarez, J.C.M. Mechanical behavior of recycled polyethylene/piassava fiber composites. Mater. Sci. Eng. A 2012, 557, 29–35. [Google Scholar] [CrossRef]
- Cabrera, G.; Li, J.; Maazouz, A.; Lamnawar, K. A Journey from Processing to Recycling of Multilayer Waste Films: A Review of Main Challenges and Prospects. Polymers 2022, 14, 2319. [Google Scholar] [CrossRef] [PubMed]
- O’Rourke, K.; Wurzer, C.; Murray, J.; Doyle, A.; Doyle, K.; Griffin, C.; Christensen, B.; Brádaigh, C.M.Ó.; Ray, D. Diverted from Landfill: Reuse of Single-Use Plastic Packaging Waste. Polymers 2022, 14, 5485. [Google Scholar] [CrossRef]
- Meert, J.; Izzo, A.; Atkinson, J.D. Impact of plastic bag bans on retail return polyethylene film recycling contamination rates and speciation. Waste Manag. 2021, 135, 234–242. [Google Scholar] [CrossRef]
- Dow Chemical. Dowlex 2645.01G Polyethylene Resin. Available online: https://www.dow.com/es-es/pdp.dowlex-264501g-polyethylene-resin.105779z.html (accessed on 12 March 2024).
- ASTM D792-20; Standard Test Methods for Density and Specific Gravity (Relative Density) of Plastics by Displacement. ASTM International: West Conshohocken, PA, USA, 2020.
- ASTM D1238-10; Standard Test Method for Melt Flow Rates of Thermoplastics by Extrusion Plastometer. ASTM International: West Conshohocken, PA, USA, 2013.
- UNE-EN ISO 7765-1:2005; Plastics Film and Sheeting—Determination of Impact Resistance by the Free-Falling Dart method—Part 1: Staircase Methods. Asociación Española de Normalización (UNE): Madrid, Spain, 2005.
- UNE-EN ISO 527-1:2020; Plastics—Determination of Tensile Properties—Part 1: General Principles. Asociación Española de Normalización (UNE): Madrid, Spain, 2020.
- UNE-EN ISO 6383-2:2005; Plastics—Film and Sheeting—Determination of Tear Resistance—Part 2: Elmendorf method. Asociación Española de Normalización (UNE): Madrid, Spain, 2005.
- Cortez, R.; Luna-Vital, D.A.; Margulis, D.; Gonzalez de Mejia, E. Natural pigments: Stabilization methods of anthocyanins for food applications. Compr. Rev. Food Sci. Food Saf. 2017, 16, 180–198. [Google Scholar] [CrossRef]
- UNE 53930-2:2023; Plastics. Reusable Plastic Bag with High Recycling Content for Transporting Products. Part 2: Polyethylene (PE) Bags. Asociación Española de Normalización (UNE): Madrid, Spain, 2023.
- Seier, M.; Archodoulaki, V.-M.; Koch, T.; Duscher, B.; Gahleitner, M. Prospects for Recyclable Multilayer Packaging: A Case Study. Polymers 2023, 15, 2966. [Google Scholar] [CrossRef] [PubMed]
- Saikrishnan, S.; Jubinville, D.; Tzoganakis, C.; Mekonnen, T.H. Thermo-mechanical degradation of polypropylene (PP) and low-density polyethylene (LDPE) blends exposed to simulated recycling. Polym. Degrad. Stab. 2020, 182, 109390. [Google Scholar] [CrossRef]
- Ballestar, R.; Pradas, C.; Puig Bosch, P.; Cañavate, F.J.; Colom, X. Physical-thermal characterization of the degradation process during the manufacturing of an LLDPE film to produce bags. AFINIDAD 2021, 58, 177. [Google Scholar]
- Ballestar, R.; Pradas, C.; Carrillo-Navarrete, F.; Cañavate, J.; Colom, X. Circular economy assessment in recycling of LLDPE bags according to European Resolution, thermal and structural characterization. Polymers 2022, 14, 754. [Google Scholar] [CrossRef] [PubMed]
- Singh, B.; Sharma, N. Mechanistic implications of plastic degradation. Polym. Degrad. Stab. 2008, 93, 561–584. [Google Scholar] [CrossRef]
- Al Salem, S.M.; Abraham, G.; Al-Qabandi, O.A.; Dashti, A.M. Investigating the effect of accelerated weathering on the mechanical and physical properties of high content plastic solid waste (PSW) blends with virgin linear low density polyethylene (LLDPE). Polym. Test. 2015, 46, 116–121. [Google Scholar] [CrossRef]
- Godshall, D.; Wilkes, G.; Krishnaswamy, R.K.; Sukhadia, A.M. Processing-structure-property investigation of blown HDPE films containing both machine and transverse direction oriented lamellar stacks. Polymer 2003, 44, 5397. [Google Scholar] [CrossRef]
- Bobotocitch, A.L.; Tkacch, R.; Ajji, A.; Elkoun, S.; Nir, Y.; Unigovski, Y.; Gutman, E.M. Mechanical properties, stress-relaxation, and orientation of doublé bubble biaxially oriented polyethylene films. J. Appl. Polym. Sci. 2006, 100, 3545–3553. [Google Scholar] [CrossRef]
- Doufas, A.K. A microstructural flow-induced crystallization model for film blowing: Validation with experimental data. Rheol. Acta 2014, 53, 269. [Google Scholar] [CrossRef]
- Chen, H.Y.; Bishop, M.T.; Landes, B.G.; Chum, S.P. Orientation and property correlations for LLDPE blown films. J. Appl. Polym. Sci. 2006, 101, 898–907. [Google Scholar] [CrossRef]
- Wang, R.; Ren, D.; Sun, X.; Liang, W.; Wang, K. Structure variation and puncture resistance of stretched crosslinked polyethylene film: Effects of stretching temperature. J. Appl. Polym. Sci. 2019, 136, 47542. [Google Scholar] [CrossRef]
- Available online: https://cie.co.at/ (accessed on 12 January 2024).
- Silvestre, C.; Cimmino, S.; Raimo, M.; Duraccio, D.; del Amo Fernandez, B.; Lafuente, P.; Sanz, V.L. Structure and morphology development in films of mLLDPE/LDPE blends during blowing. Macromol. Mater. Eng. 2006, 291, 1477–1485. [Google Scholar] [CrossRef]
- Cañavate, J.; Pagés, P.; Saurina, J.; Colom, X.; Carrasco, F. Determination of small interactions in polymer composites by means of FTIR and DSC. Polym. Builetin 2000, 44, 293–300. [Google Scholar] [CrossRef]
- Zerbi, G.; Galiano, G.; Fanti, N.D.; Baini, L. Structural depth profiling in polyethylene films by multiple internal reflection infra-red spectroscopy. Polymer 1989, 30, 2324. [Google Scholar] [CrossRef]
- Krimm, S.; Liang, C.Y.; Sutherland, G.B. Infrared Spectra of High Polymers. II. Polyethylene. J. Chem. Phys. 1956, 25, 549. [Google Scholar] [CrossRef]
- Pagès, P.; Carrasco, F.; Saurina, J.; Colom, X. FTIR and DSC Study of HDPE Structural Changes and Mechanical Properties Variation When Exposed to Weathering Aging during Canadian Winter. J. Appl. Polym. Sci. 1996, 60, 153–159. [Google Scholar] [CrossRef]
- Schnabel, W. Polymer Degradation Principles and Practical Applications; Hanser International: Munich, Germany, 1981. [Google Scholar]
- Colom, X.; Cañavate, J.; Pages, P.; Saurina, J.; Carrasco, F. Changes in Crystallinity of the HDPE Matrix in Composites with Cellulosic Fiber Using DSC and FTIR. J. Reinf. Plast. Compos. 2000, 19, 818. [Google Scholar] [CrossRef]


| Mechanical Property | Technical Specification—Minimum Value |
|---|---|
| Impact (g/µm) | 3.20 |
| Tensile Strength Longitudinal (MPa) | 22 |
| Tensile Strength Transversal (MPa) | 18.5 |
| Elongation Longitudinal (%) | 400 |
| Elongation Transversal (%) | 500 |
| Tearing Longitudinal (mN) | 1600 |
| Tearing Transversal (mN) | 6000 |
| Processing Cycles | L* | a* | b* |
|---|---|---|---|
| 1 | 80.05 | −1.74 | −2.52 |
| 2 | 81.16 | −2.20 | −1.49 |
| 3 | 79.51 | −1.97 | −1.04 |
| 4 | 79.52 | −1.82 | −0.36 |
| Processing Cycles | L* | a* | b* |
|---|---|---|---|
| 1 | 70.14 | 0.40 | 5.51 |
| 2 | 69.23 | 0.57 | 6.19 |
| 3 | 66.69 | 1.17 | 6.49 |
| 4 | 68.36 | 1.13 | 6.72 |
| Samples | A1474/A1464 | %Amorphous | %Crystallinity | A730/A720 | %Amorphous | %Crystallinity |
|---|---|---|---|---|---|---|
| rLLDPE1 | 1.22 | 28.6 | 71.4 | 0.59 | 71.5 | 28.5 |
| rLLDPE2 | 1.26 | 26.4 | 73.,6 | 0.82 | 52.2 | 47.8 |
| rLLDPE3 | 1.10 | 34.9 | 65.1 | 0.73 | 59.2 | 40.8 |
| rLLDPE4 | 1.00 | 40.6 | 59.4 | 0.78 | 55.3 | 44.7 |
| rPEpostc1 | 0.70 | 62.4 | 37.6 | 0.61 | 69.7 | 30.3 |
| rPEpostc2 | 0.69 | 62.7 | 37.3 | 0.54 | 76.9 | 23.1 |
| rPEpostc3 | 0.72 | 60.5 | 39.5 | 0.60 | 71.4 | 28.6 |
| rPEpostc4 | 0.73 | 59.3 | 40.7 | 0.61 | 69.7 | 30.3 |
Disclaimer/Publisher’s Note: The statements, opinions and data contained in all publications are solely those of the individual author(s) and contributor(s) and not of MDPI and/or the editor(s). MDPI and/or the editor(s) disclaim responsibility for any injury to people or property resulting from any ideas, methods, instructions or products referred to in the content. |
© 2024 by the authors. Licensee MDPI, Basel, Switzerland. This article is an open access article distributed under the terms and conditions of the Creative Commons Attribution (CC BY) license (https://creativecommons.org/licenses/by/4.0/).
Share and Cite
Ballestar de las Heras, R.; Colom, X.; Cañavate, J. Comparative Analysis of the Effects of Incorporating Post-Industrial Recycled LLDPE and Post-Consumer PE in Films: Macrostructural and Microstructural Perspectives in the Packaging Industry. Polymers 2024, 16, 916. https://doi.org/10.3390/polym16070916
Ballestar de las Heras R, Colom X, Cañavate J. Comparative Analysis of the Effects of Incorporating Post-Industrial Recycled LLDPE and Post-Consumer PE in Films: Macrostructural and Microstructural Perspectives in the Packaging Industry. Polymers. 2024; 16(7):916. https://doi.org/10.3390/polym16070916
Chicago/Turabian StyleBallestar de las Heras, Ricardo, Xavier Colom, and Javier Cañavate. 2024. "Comparative Analysis of the Effects of Incorporating Post-Industrial Recycled LLDPE and Post-Consumer PE in Films: Macrostructural and Microstructural Perspectives in the Packaging Industry" Polymers 16, no. 7: 916. https://doi.org/10.3390/polym16070916
APA StyleBallestar de las Heras, R., Colom, X., & Cañavate, J. (2024). Comparative Analysis of the Effects of Incorporating Post-Industrial Recycled LLDPE and Post-Consumer PE in Films: Macrostructural and Microstructural Perspectives in the Packaging Industry. Polymers, 16(7), 916. https://doi.org/10.3390/polym16070916