Article

Prospect of Gum Arabic–Cocoliposome Matrix to Encapsulate Curcumin for Oral Administration

1
Department of Chemistry, Faculty of Science and Mathematics, Diponegoro University, Prof. Jacob Rais Street, Semarang 50275, Central Java, Indonesia
2
Postgraduate Chemistry Program, Faculty of Science and Mathematics, Diponegoro University, Prof. Jacob Rais Street, Semarang 50275, Central Java, Indonesia
3
Department of Mathematics, Faculty of Science and Mathematics, Diponegoro University, Prof. Jacob Rais Street, Semarang 50275, Central Java, Indonesia
4
Chemistry Program, Faculty of Science and Mathematics, Diponegoro University, Prof. Jacob Rais Street, Semarang 50275, Central Java, Indonesia
*
Author to whom correspondence should be addressed.
Polymers 2024, 16(7), 944; https://doi.org/10.3390/polym16070944
Submission received: 25 January 2024 / Revised: 25 March 2024 / Accepted: 27 March 2024 / Published: 29 March 2024
(This article belongs to the Section Biomacromolecules, Biobased and Biodegradable Polymers)

Abstract

:
Curcumin is an antioxidant that can effectively eliminate free radicals. However, as its oral bioavailability is low, an effective delivery method is required. Phospholipid-based liposomes can encapsulate lipophilic drugs, such as curcumin, while liposome, cholesterol, and gum Arabic (GA) can enhance the internal and external stability of drug membranes. This present study used concentrations of cholesterol (Cchol) and GA (CGA), ranging from 0 to 10, 20, 30, and 40% as well as 0 to 5, 10, 15, 20, 30, and 40%, respectively, to encapsulate curcumin in a GA–cocoliposome (CCL/GA) matrix and test its efficacy in simulated intestinal fluid (SIF) and simulated gastric fluid (SGF). The absence of new characteristic peaks in the Fourier transform infrared (FTIR) spectra results indicate the presence of non-covalent interactions in the CCL/GA encapsulation. Furthermore, increasing the Cchol decreased the encapsulation efficiency (EE), loading capacity (LC), and antioxidant activity (IR) of the CCL/GA encapsulation but increased its release rate (RR). Conversely, increasing CGA increased its EE and IR but decreased its LC and RR. The two conditions applied confirmed this. Liposomal curcumin had the highest IR in SIF (84.081%) and the highest RR in SGF (0.657 ppm/day). Furthermore, liposomes loaded with 10% Cchol and 20% CGA performed best in SIF, while those loaded with 10% Cchol and 30% CGA performed best in SGF. Lastly, the CCL/GA performed better in SIF than SGF.

1. Introduction

Curcumin, a compound that is present in turmeric (Curcuma longa L.), possesses anti-inflammatory [1,2], anticancer [2], antibacterial [3], and antioxidant [2] properties. It is a significant antioxidant as it can directly capture and transform free radicals into more stable or non-radical molecules [4]. However, there are limitations of curcumin that diminish its efficacy, namely, (i) its varying solubility, for instance, low solubility (7.8 µg/mL) in water [5], moderate solubility (0.0004 mg/mL) in physiologic pH [6], and excellent solubility (10 mg/mL) in organic solvents, such as 96% ethanol [7]; (ii) the effect of pH on its degradation, for instance, its half-life is 1–9 min at pH 7.2–8.0 (alkaline) and 100–200 min at pH 3.0–6.5 (acidic) [8]; (iii) its low in vivo absorption; (iv) its limited in vivo bioavailability; and (v) its significant metabolism and excretion by the body [9,10]. As such, multiple studies have thoroughly examined overcoming issues in curcumin distribution, primarily by developing drug delivery systems (DDSs) to deliver curcumin to specific in vivo sites [9,11]. Various types of DDSs, such as micelles [12], emulsions [13], solid lipid nanoparticles [14,15,16], nanoparticles [10,17,18], and natural polymer-coated liposomes, such as gum Arabic (GA) [19,20], have been examined as potential curcumin encapsulation.
Multiple studies have approved the use of liposome-based DDSs to administer drugs in vivo [11,21]. Liposomes are hollow spherical vesicles with an aqueous compartment surrounded by multiple layers of phospholipids. The structure of a liposome makes it an ideal DDS as its aqueous compartment entraps hydrophilic or polar drugs while its bilayers entrap lipophilic or non-polar drugs. It is also a non-toxic, biodegradable, and biocompatible DDS that yields high levels of in vivo bioavailability. Furthermore, as liposomes can be engineered at a nanoscale to achieve targeted drug delivery, they can, therefore, be used to enhance the in vivo bioavailability, stability, and solubility of curcumin [6,22].
The components in a DDS must interact synergistically to maintain and enhance drug delivery. Phospholipids are the ideal primary component for liposomes as they can spontaneously create a self-assembled structure in an aqueous solution due to their amphiphilic nature. However, liposomes that solely contain phospholipids tend to leak and release their payload before reaching the target site. Cholesterol can be used to decrease leaks by sandwiching it between the phospholipid layers of the liposome’s membrane, which would affect how the phospholipids are arranged and increase the regularity and rigidity of the membrane, thereby stabilising the permeability of the liposome [23,24]. Apart from cholesterol, a polymer matrix, such as GA, can also be used to coat liposomes and decrease leakage. As GA is a biopolymer, it has excellent water solubility as well as dynamic and high surface activity, which enables it to not only readily interact with the outer surfaces of liposomes [25] but also to create a thin protective layer that increases its stability without increasing the internal density [26].
A comprehensive grasp of all pertinent elements is necessary when developing a liposome-based DDS with which to effectively address drug delivery challenges. One of the many obstacles that liposomes encounter while traversing the gastrointestinal tract is the significant difference in pH. More specifically, the pH of the stomach is 1.5–2.0 [27] while that of the intestine is 6.5–7.5. As such, multiple studies have used solutions that mimic the pH of the intestine (simulated intestinal fluid; SIF) and stomach (simulated gastric fluid; SGF) to examine the influence of changes in pH on liposomes composed of commercially available phospholipids [28,29]. This present study used cocoliposomes derived from coconut phospholipids (CocoPLs), cholesterol [28], and GA [19] to produce multiple encapsulation matrices. At certain cholesterol concentrations (Cchol), the cocoliposome/cholesterol matrix yielded a low encapsulation efficiency (EE), antioxidant activity (IR) of curcumin, and loading capacity (LC). Meanwhile, the GA/cholesterol matrix yielded high EE and curcumin IR but low LC. Therefore, the cocoliposome–GA/cholesterol matrix was integrated to determine if it would produce disparate or analogous outcomes. This study investigated the EE of a cocoliposome–GA/cholesterol-based curcumin DDS in two distinct oral delivery routes, namely, SIF (slightly alkaline) and SGF (acidic). Although the behaviour of the proposed DDS varied in the two delivery routes, it was a suitable curcumin DDS. Several instruments were used to support the findings of this present study, including a UV-Vis spectrophotometer, a Fourier transform infrared spectrophotometer, and a nanoparticle analyser.

2. Materials and Methods

2.1. Preparation of 0.1 M of Phosphate-Buffered Saline (PBS) Solution

Solution A (0.1 M) was prepared by dissolving 1.98 g of Na2HPO4·2H2O p.a. (Merck KGaA, Darmstadt, Germany) in 500 mL of demineralised water (Brataco, Semarang, Indonesia), while Solution B (0.1 M) was prepared by dissolving 1.56 g of NaH2PO4·2H2O p.a. (Merck KGaA, Darmstadt, Germany) in 500 mL of demineralised water (Brataco, Semarang, Indonesia). Solutions A (80.2 mL) and B (19.8 mL) were then homogenised before the pH was adjusted to 7.4 using diluted 0.1 M hydrochloric acid (HCl) p.a. or 0.1 M sodium hydroxide (NaOH) p.a.

2.2. Preparation of Simulated Intestinal Fluid (SIF) Solution

Solution C (0.05 M) was prepared by dissolving 7.5 g of Na2HPO4·2H2O p.a. (Merck KGaA, Darmstadt, Germany) in 500 mL of demineralised water (Brataco, Semarang, Indonesia), while Solution D (0.05 M) was prepared by dissolving 3.9 g of NaH2PO4·2H2O p.a. (Merck KGaA, Darmstadt, Germany) in 500 mL of demineralised water (Brataco, Semarang, Indonesia). The SIF was prepared by homogenising Solutions C (40.5 mL) and D (9.5 mL) and then diluting the mixture to 100 mL before adjusting the pH to 7.4 using diluted 0.1 M HCl p.a. or 0.1 M NaOH p.a.

2.3. Preparation of Simulated Gastric Fluid (SGF) Solution

Two grams (2 g) of sodium chloride (NaCl; HiMedia, Pennsylvania, PA, USA) p.a. was dissolved in 800 mL of demineralised water (Brataco, Semarang, Indonesia) before 4.5 mL of 37% (w/w) HCl (Merck KGaA, Darmstadt, Germany) p.a. was added drop-wise. The SGF was prepared by re-adding demineralised water (Brataco, Semarang, Indonesia) to a final volume of 1 L and then adjusting the pH to 1.2 using diluted 0.1 M HCl p.a. or 0.1 M NaOH p.a.

2.4. Encapsulation of Curcumin in Cocoliposomes with Gum Arabic Matrix

The CocoPLs were extracted in-house using the method outlined by Hudiyanti et al. (2018) [30,31]. In brief, the CocoPLs were extracted from ripe coconut meat using a chloroform (Merck KgaA, Darmstadt, Germany) p.a. and methanol (Merck KgaA, Darmstadt, Germany) p.a. concoction. It was then partitioned using technical n-hexane (Kimia Kalijaga, Demak, Indonesia) and technical 87% (v/v) ethanol (Kimia Kalijaga, Demak, Indonesia). Table 1 provides the formulations of curcumin encapsulated within cocoliposomes (CCLs), while Table 2 provides the formulations of CCL with GA matrix coating (CCL/GA). Varying concentrations of GA (CGA) (0%, 5%, 10%, 20%, 30%, and 40%) were added to each CCL formulation to produce the CCL/GA formulations. The CCL formulations in Table 1 comprised cholesterol p.a. (94%) and curcumin p.a. (≥75%), both from Sigma-Aldrich (Darmstadt, Germany).
The CCL was prepared by dissolving CocoPLs, cholesterol p.a. and curcumin p.a. in a 9:1 (v/v) ratio of chloroform p.a. (Merck KgaA, Darmstadt, Germany) and methanol p.a. (Merck KgaA, Darmstadt, Germany) solvent. The total volume of the final solution was 100 mL. Ten millilitres (10 mL) of the solution was placed in a test tube and flowed with nitrogen gas (N2) until a thin film remained at the bottom of the tube. Ten millilitres (10 mL) of the SIF was then added into the test tube sans agitation before undergoing the freeze–thaw cycle [19,28]. The freeze–thaw procedure involved three sequential steps: (i) heating the solution to 45 °C (thaw), (ii) cooling it to 4 °C (freeze), and then (iii) homogenising with a vortex mixer. The cycle was repeated until the thin film at the bottom of the test tube containing the SIF had completely dissolved. GA was then added to the CCL and homogenised using a vortex mixer until it had completely dissolved. Sonication (40 kHz, 27 °C, 30 min) was then performed to produce the CCL/GA dispersions. These steps were repeated using all the CCL/GA formulations in the SGF and SIF. Next, 1 mL of the CCL/GA dispersion was combined with 5 mL of 96% (v/v) ethanol p.a. (Merck KgaA, Darmstadt, Germany) and centrifuged at 3461× g for 40 min to segregate the upper liquid layer (supernatant containing unencapsulated curcumin) from the lower solid layer (residue containing CCL/GA). The supernatant can be analysed to determine the EE and the LC, while the residue can be analysed to determine the IR and release rate (RR) or stored at −18 °C. The sink temperature of each CCL/GA dispersion was maintained at 30 °C prior to analysis.

2.5. Determination of the Functional Groups

The functional groups present in each CCL/GA composition were determined (Table 1 and Table 2) by conducting three scans using a PerkinElmer® Frontier™ Fourier transform infrared (FTIR) spectrophotometer (Waltham, MA, USA) at a spectral range of 5500–435 cm−1 and a spectral resolution of 4.0 cm−1 to determine if any interactions that alter the chemical structure during encapsulation had occurred. The analysis primarily examined the GA and CCL/GA, as extant studies have already examined the other components, namely, CocoPLs, cholesterol p.a., curcumin p.a. and CCL [28].

2.6. Determination of the Encapsulation Efficiency (EE) of the Curcumin

Equation (1) was used to determine the EE of the curcumin p.a. using data on the initial curcumin p.a. concentration (C0 curcumin, 10 ppm) and the unencapsulated curcumin p.a. concentration (Ct, in ppm) present in the centrifuged supernatant. The Ct can be determined by quantifying the absorbance of the supernatant at a wavelength (λmax) = 426 nm using a Shimadzu® UV-1280 multipurpose ultraviolet–visible (UV-Vis) spectrophotometer (Kyoto, Japan) [19,32].
E E = 1 C t   c u r c u m i n C 0   c u r c u m i n × 100 %

2.7. Determination of the Loading Capacity (LC) of CocoPLs and GA Carriers

Similar to the method of determining the EE of the curcumin p.a., the LC of the CocoPLs and GA also required Ct data, which involved quantifying the absorbance of the supernatant at λmax = 426 nm via the UV-Vis specifications in Section 2.6. The obtained Ct was inserted into Equation (2) to calculate the LC of the CocoPLs [19], while Equation (3) was used to calculate the LC of the GA [33].
L C   C o c o P L s = C 0   c u r c u m i n C t   c u r c u m i n × m L   C C L / G A   d i s p e r s i o n g C o c o P L s
L C   G A = C 0   c u r c u m i n C t   c u r c u m i n × m L   C C L / G A   d i s p e r s i o n g G A
The CCL/GA dispersion (mL) indicates the volume of the dispersion used throughout the analysis (1 mL), while gCocoPLs indicates the mass of the CocoPLs used in the formulation (125 mg), and gGA indicates the mass of the GA used in the formulation (Table 1 and Table 2).

2.8. Determination of the Release Rate (RR) of Curcumin

Using the UV-Vis specifications in Section 2.6, the RR was determined by measuring the concentration of curcumin p.a. released by the CCL/GA during the observation period (12 days). Firstly, 1 mL of the CCL/GA dispersion was dispersed into 5 mL of the buffer solution (SGF or SIF) and then incubated at 4 °C and observed. Prior to the analysis, the CCL/GA dispersion was ultrasonically homogenised for 5 min to ensure homogeneity and then centrifuged at 4500 rpm for 15 min. The amount of curcumin p.a. released by the CCL/GA dispersion was determined by measuring the absorbance of the upper layer collected post-centrifugation at λmax = 426 nm.

2.9. Determination of the Particle Size (PS), Polydispersity Index (PDI), and Zeta Potential (ζ-Potential) of the Liposomes

A Horiba Scientific® nanoPartica SZ-100V2 Series nanoparticle analyser (Kyoto, Japan) was used to perform dynamic light scattering (DLS), at a scattering angle of 173° and a holder temperature of 25 °C, and determine the PS (z-average diameter), polydispersity index (PDI), and zeta potential (ζ-potential) of the liposomes in the SIF. The PS and PDI indicate the size and distribution of the particles within the liposomes, while the ζ-potential reveals the surface charges of the liposomes.

2.10. Determination of the Antioxidant Activity (IR) of Curcumin

Th antioxidant activity of the curcumin p.a. was determined by measuring the inhibition rate (IR) of 1-diphenyl-2-picrylhydrazyl (DPPH; ≥90%; Sigma-Aldrich) using the DPPH free radical scavenging assay method [32,34,35]. A total of 1 mL of the CCL/GA dispersion was mixed with 3 mL of the DPPH (40 µg/mL) and incubated in the dark at room temperature for 30 min. The absorbance data obtained using the UV-Vis specifications in Section 2.6 at λmax = 515 nm were input into Equation (4) to calculate the IR.
I R = A 0 A 1 A 0 × 100 %
A0 indicates the absorbance of the DPPH, while A1 indicates the absorbance of the DPPH when mixed with the CCL/GA dispersion.

2.11. Statistical Analyses

The data were collected in triplicate and evaluated using one-way analysis of variance (ANOVA). The significance level was set at p < 0.05. The results were expressed as the mean ± standard deviation and presented in graphical format.

3. Results and Discussion

DDSs offer formulations that can be arranged according to the nature of the drug being delivered and its intended use. They can also regulate the dosage of the drug to be delivered to the target site, thereby ensuring that the dosage is not excessive and optimal for the desired therapeutic effects. It is essential to evaluate various factors, such as the nature of the drug being delivered, the nature of the drug carrier, the composition of the formulation [36,37], and the structural integrity of the drug carrier [38], to develop an effective DDS. Curcumin, which is a lipophilic drug, has poor water solubility [5] and suffers from absorption-related issues. Therefore, its delivery method must address these issues. The present study proposed a modified DDS formulation that uses liposomes, comprising CocoPLs, cholesterol, and GA polymers, to effectively encapsulate curcumin. The modifications observed in the formulations of CCL/GA, the EE of curcumin, the LC of the CocoPLs, the LC of the GA, the IR of the curcumin, and the RR of the curcumin indicate that the endeavour was successful. The use of liposomes to encapsulate drugs offers various benefits, such as sustained drug release, specifically targeting colitis tissues by enhancing epithelial permeation and retention (eEPR), and high stability in gastric fluid due to its pseudo-pH-sensitivity properties [39,40,41]. As this present study aimed to investigate the effect of liposome-encapsulated curcumin on the gastrointestinal tract, its performance in two different conditions, namely, in the intestine, where the drug was dissolved in SIF at pH = 7.4, and in the stomach, where it was dissolved in SGF at pH = 1.2, was examined. Specific data, particularly, the mean and the optimum values of each parameter in the two different conditions, are presented in graphical format.

3.1. Functional Group Analyses

The functional group analyses were conducted using FTIR spectroscopy as it provides insights into the interactions between the functional groups of the encapsulated components and the encapsulating components throughout the encapsulation process. The CCL/GA matrix, which served as the curcumin DDS, was designed to prevent any interactions within itself that could alter the chemical structure of the curcumin. The primary purpose of using the DDS was to enhance curcumin transport and release at intended sites in vivo. Therefore, the infrared absorption spectra of the CCL/GA should not exhibit new characteristic peaks that differ from the infrared absorption spectrum of its components. Figure 1, Figure 2 and Figure 3 display the FTIR spectra of the GA, CCL, and CCL/GA, respectively. The present study only examined these three FTIR spectra, as extant studies have already examined the FTIR spectra of CocoPLs, cholesterol, curcumin, and CCL and their corresponding analysis [28].
Figure 1 depicts the characteristic peaks of the GA, which are located at wave numbers (ṽ) = 3410 cm−1 (O-H stretching vibration), 2931 cm−1 (CH3 symmetric stretching and CH2 asymmetric stretching vibrations, which indicate the presence of sugars, galactose, arabinose, and rhamnose), 1613 cm−1 (C=O symmetric stretching vibration), and 1424 cm−1 (specific vibration of the glucuronic acid monomer of GA).
Figure 2 depicts the characteristic peaks of CCL, which are located at ṽ = 3393 cm−1 (O-H stretching vibration), 2925 cm−1 and 2854 cm−1 (CH3 symmetric and CH2 asymmetric stretching vibrations), 1738 cm−1 (C=O symmetric stretching vibration), 1653 cm−1 (C=C symmetric stretching vibration), 1513 cm−1 (benzene ring bending vibration), 1369 cm−1 (CH3 and CH2 bending vibration of the cyclopentane framework of the cholesterol as well as the tertiary C-N stretching vibration of the phospholipids), 1216 cm−1 (PO2 asymmetric stretching vibration of the ester), and 1058 cm−1 (P-O-C asymmetric stretching vibration of the ester).
The characteristic peaks of CCL/GA can be observed in Figure 3. These peaks are located at ṽ = 3403 cm−1 (O-H stretching vibration), 2925 cm−1 and 2854 cm−1 (CH3 symmetric and CH2 asymmetric stretching vibrations), 1738 cm−1 (C=O symmetric stretching vibration), 1685 cm−1 (C=C symmetric stretching vibration), 1513 cm−1 (benzene ring bending vibration), 1464 cm−1 (specific vibration of the glucuronic acid monomer of the GA), 1369 cm−1 (CH3 and CH2 bending vibration of the cyclopentane framework of the cholesterol as well as the tertiary C-N stretching vibration of the phospholipids), 1216 cm−1 (PO2 asymmetric stretching vibration of the ester), and ~1058 cm−1 (P-O-C asymmetric stretching vibration of the ester). Some of the peaks did shift slightly when the GA matrix was added to the CCL dispersion. For instance, the specific vibration peak of the glucuronic acid monomer of the GA shifted from 1424 to 1464 cm−1, while the peak for the C=C symmetric stretching vibration shifts shifted 1653 to 1685 cm−1. The increase in ṽ occurred due to interactions between the polymer and liposomes. Nevertheless, more studies, such as computational studies, are required to validate the presence of this interaction.
The spectra of the CocoPLs [28], cholesterol [28], curcumin [28], GA, and CCL [28] indicate that the characteristic peaks of each component were identified and observed in the FTIR spectra of the CCL/GA, sans new characteristic peaks. Therefore, the interactions that occurred while encapsulating the curcumin in the CCL/GA matrix were non-covalent and did not alter the chemical structure.

3.2. Encapsulation Efficiency (EE) of Curcumin

In a DDS, the EE is the percentage of the drug that is successfully encapsulated within the carrier, enabling its targeted delivery to the intended site in vivo [37,42]. Therefore, the EE of the curcumin is the amount of curcumin that had been successfully encapsulated within the CCL. The higher the amount of curcumin successfully encapsulated within the liposomes, the higher the EE of the curcumin. Figure 4 depicts the EE of the curcumin at different CGA and Cchol in the SIF and SGF.
Cholesterol decreased the EE more significantly than GA increased it in all the CCL/GA formulations in both solutions. More specifically, when the CCL/GA formulations contained identical amounts of Cchol and CGA and were used in the SIF, Cchol decreased the EE by 5%, to 8%, while the CGA increased the EE by only 1%, to 5%. Similarly, when the CCL/GA formulations contained identical amounts of Cchol and CGA and were used in the SGF, the Cchol decreased the EE by 7% to 12%, while the CGA increased the EE by 4% to 7%, with the exception of the 0% Cchol variation, which decreased the EE. Hudiyanti et al. (2021) [28], similarly, found that the EE decreased when the Cchol increased, while Hudiyanti et al. (2022) [19] and Al Khafiz et al. (2019) [20] found that the EE increased when the CGA increased. The EE of lipophilic drugs decreased in both solutions when they were encapsulated into liposomes with high Cchol. This could be because both the molecules occupy the same space when encapsulated, specifically, between the liposome bilayers. Therefore, as the amount of space has decreased, the amount of curcumin encapsulated is lower [42]. It also indicates that the encapsulation of curcumin in the liposome membrane is anti-synergic in the presence of cholesterol and synergistic in the presence of GA as it promotes the encapsulation of curcumin. The 10%Cchol + 20%CGA-CCL/GA formulation yielded the optimum EE (93.245% ± 1.528) for curcumin in the SIF (Figure 4a), while the 10%Cchol + 30%CGA-CCL/GA formulation yielded the optimum EE (97.317% ± 1.261) in the SGF (Figure 4b). The insignificant difference in the EE in the SIF and SGF indicates that pH does not significantly alter the feasibility of encapsulating curcumin within liposomes.

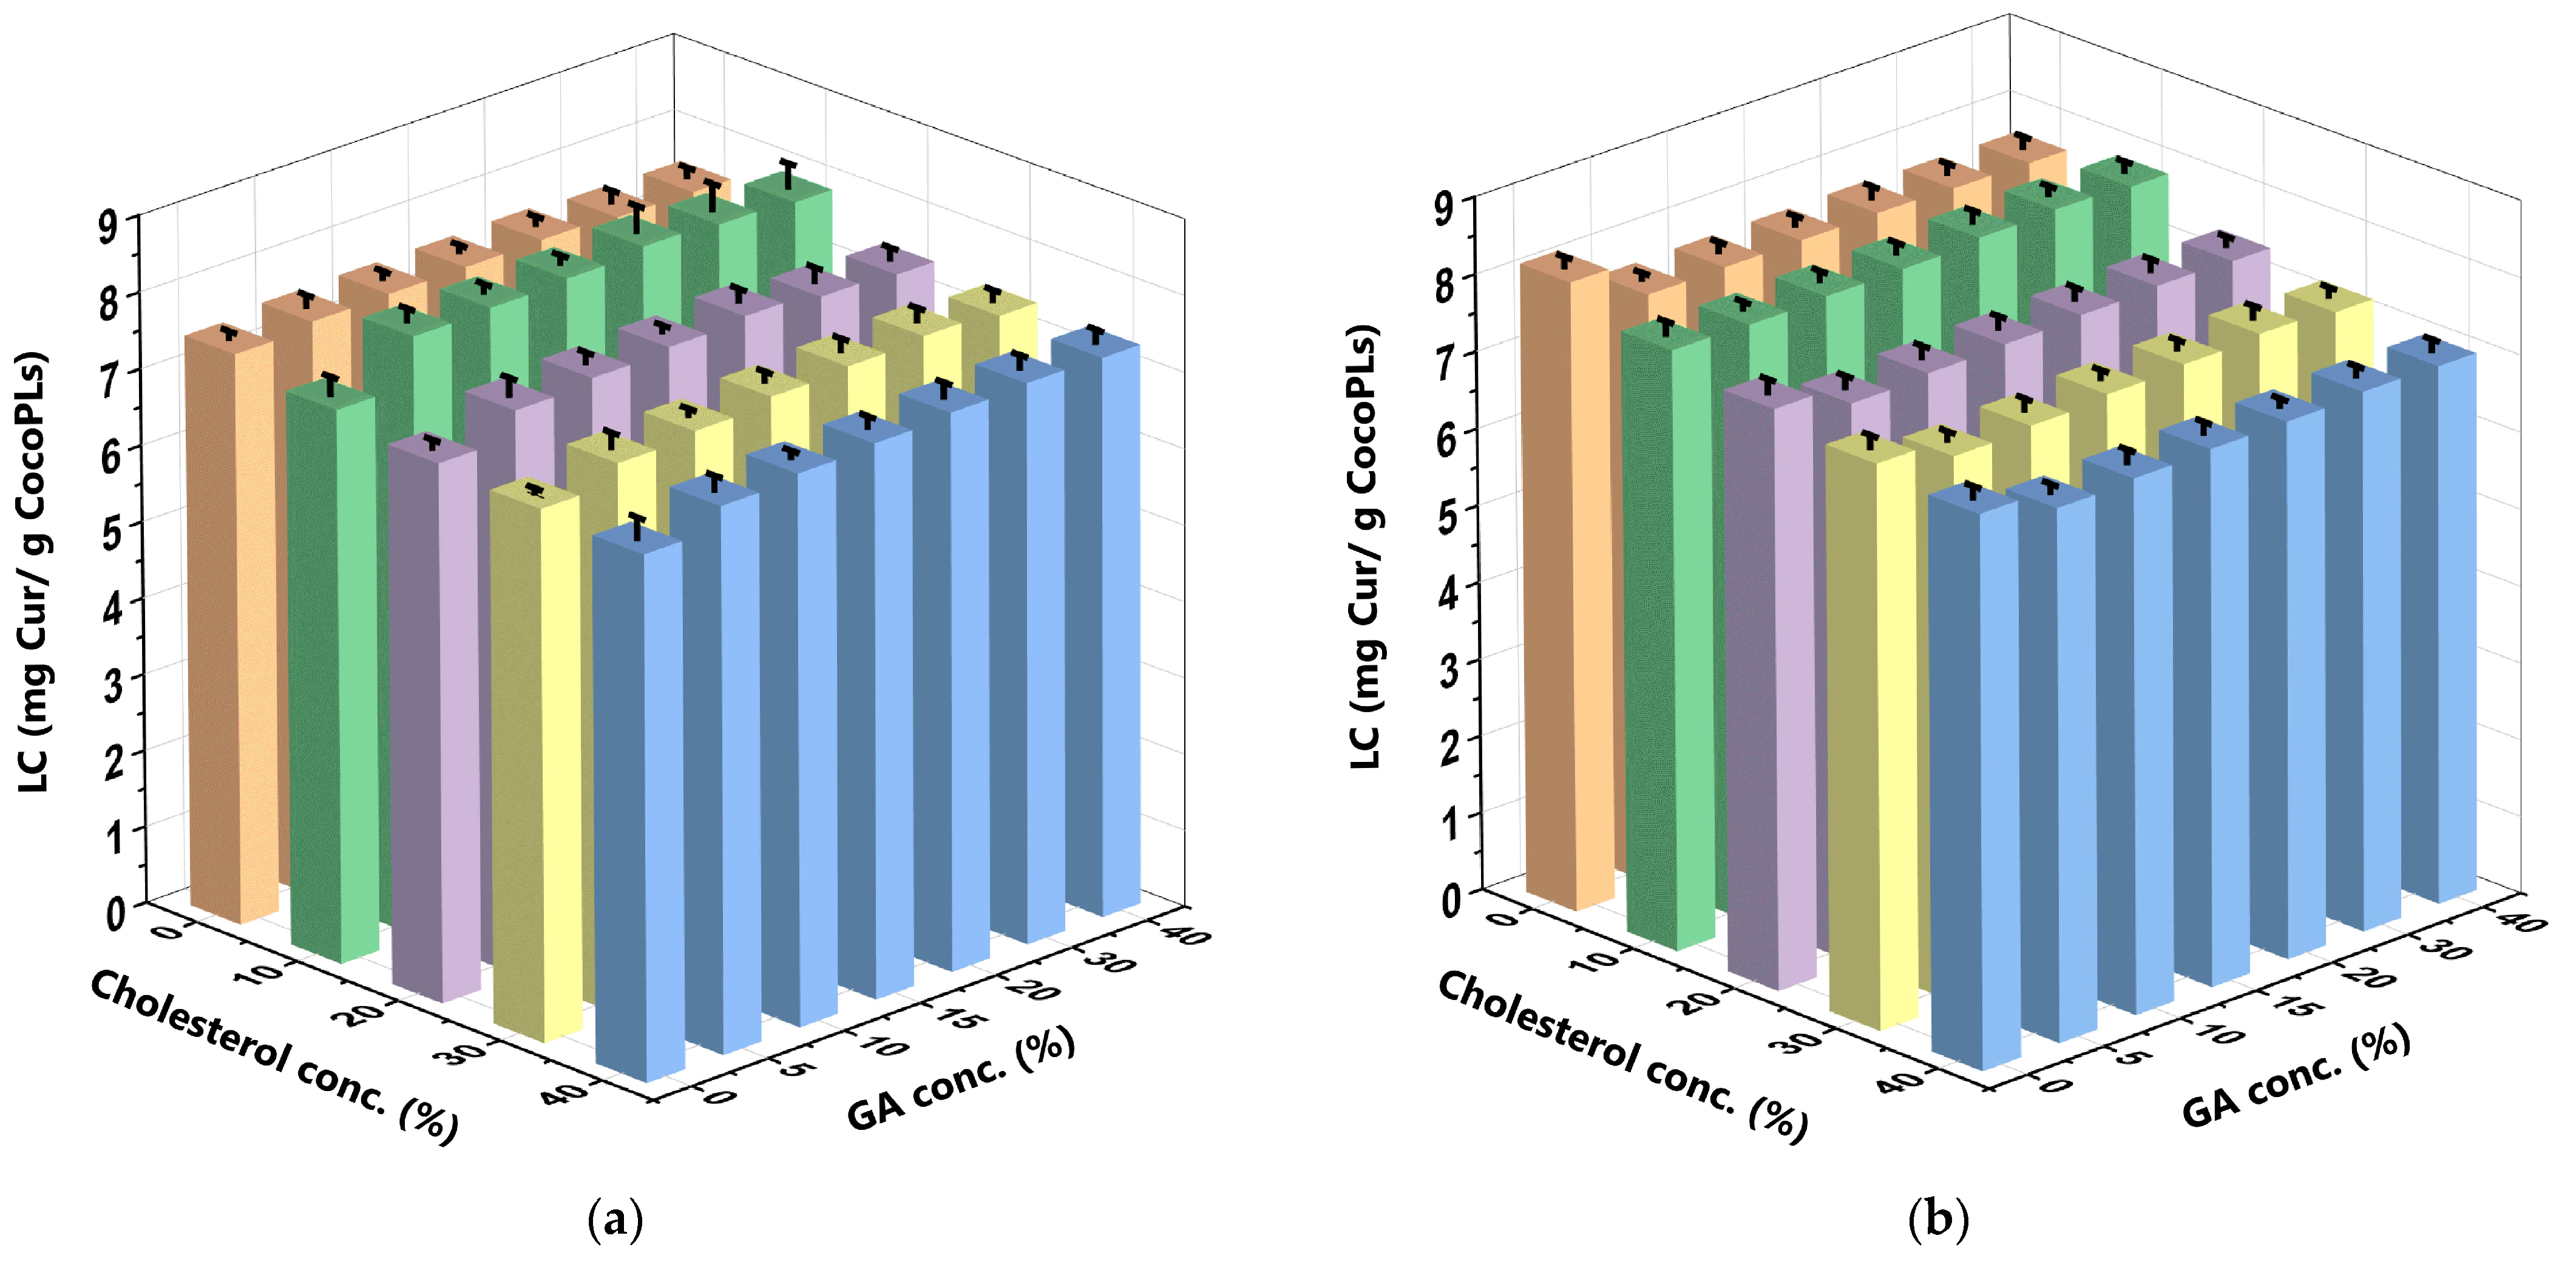
3.3. Curcumin Loading Capacity (LC) of the CocoPLs and GA Carriers

In a DDS, the LC is the ability of a carrier to encapsulate the drug in question. It is determined by dividing the mass of the encapsulated drug by the mass of the carrier [43]. The LC results of this present study indicate that the highest amount of curcumin that could be encapsulated within the liposomes was proportional to the mass of the carrier, specifically, CocoPLs and GA. The LC increased proportionally when the ability of the carrier to encapsulate the drug increased. Therefore, it reflects the potential and efficiency of the carrier used in the proposed DDS [44,45]. Figure 5 depicts the LC of the CocoPL carrier at different CGA and Cchol in the SIF and SGF, while Figure 6 depicts the same for the GA carrier.
The LC results of the CocoPLs in each CCL/GA formulation in the SIF indicate that GA increases the LC significantly more than cholesterol decreases it. More specifically, when the CCL/GA formulations contained identical amounts of Cchol and CGA and were used in the SIF, Cchol decreased the LC by 3%, to 8%, while the CGA increased the LC by 2%, to 10%. However, when the CCL/GA formulations contained identical amounts of Cchol and CGA and were used in the SGF, they both decreased the LC, cholesterol more so than GA. More specifically, Cchol decreased the LC by 9%, to 12%, while CGA only decreased it by 3%, to 6%, with the exception of 10% Cchol, which increased the LC. Much like the effect of high Cchol on the EE, liposomes containing high Cchol had limited space with which to encapsulate the curcumin [42]. The effect of cholesterol in both the SIF and SGF was similar to that of an extant study [28]. The CGA affected the LC of the CocoPLs differently in each CCL/GA formulation in the SIF and SGF. More specifically, higher CGA increased the LC of the CocoPLs in the SIF but decreased it in the SGF. This could be attributed to the presence of hydrolysed GA in the SGF, which decreased its LC and prevented the liposome from effectively guarding contents that are lipophilic, such as curcumin. The effect of CGA, particularly in the SGF, aligns with the results of a prior study [20]. The 10%Cchol + 20%CGA-CCL/GA formulation yielded the optimum LC of the CocoPLs (7.989 mg Cur/g CocoPLs ± 0.329) in the SIF (Figure 5a), while the 10%Cchol + 30% CGA CCL/GA formulation yielded the optimum LC of the CocoPLs (7.887 mg Cur/g CocoPLs ± 0.102) in the SGF (Figure 5b). The insignificant difference in the LC in the SIF and SGF indicates that pH does not significantly affect the ability of CocoPLs to act as a carrier. The only discernible distinction lies in the variations in the formulations.
Unlike the LC of the CocoPL carrier, the GA carrier was found to lower the LC more significantly than cholesterol in both solutions. When the CGA increased and the Cchol remained constant, the LC decreased by 0.9%. Conversely, when the Cchol increased and the CGA remained constant, the LC decreased by 0.1%. The effect of cholesterol on the LC of GA was similar to its impact on the LC of CocoPLs in the SIF and SGF. For the GA, the decrease in the LC could be attributed to steric resistance, which disrupts the interactions required to develop a protective coating on the liposomes [46].
Furthermore, high acidity (pH < 4), such as that of the SGF, may cause the GA to hydrolyse as it is polyelectrolytic in nature [47], which, subsequently, decreases its capacity to encapsulate drugs. On the other hand, high alkalinity, such as that of the SIF, may cause the carboxylic groups in the GA to ionise, which, subsequently, creates repulsive forces between the acid groups that destabilise the structure of the GA and decrease its LC. Extant studies have reported similar effects of GA in both solutions [19,20]. The 10%Cchol + 5%CGA-CCL/GA formulation yielded the optimum LC of the GA (0.196 mg Cur/g GA ± 0.004) in the SIF (Figure 6a), while the 10%Cchol + 5%CGA-CCL/GA formulation yielded the optimum LC of the GA (0.194 mg Cur/g GA ± 0.002) in the SGF (Figure 6b). The LC of the GA was slightly higher in the SIF than in the SGF. Extant studies have, similarly, reported that the conditions in the SIF are more favourable when encapsulating curcumin with GA [19].

3.4. Release Rate (RR) of the Curcumin

The drug RR in a DDS correlates with achieving a desired therapeutic effect at the intended site in vivo [48]. A DDS with a controlled RR releases a drug at the desired location and time while considering the therapeutic concentration and pharmacokinetic properties of the drug in question [49]. This ensures that the drug is released at the intended location without excessive dosage, thereby minimising side effects on other bodily tissues [42,50]. In this present study, the RR was determined by comparing the total amount of curcumin released over the observation period with the initial amount of curcumin in the liposome. Figure 7 depicts the curcumin RR at various CGA and Cchol in the SIF and SGF.
The GA more significantly decreased the RR of the CCL/GA formulation in both SIF and SGF than cholesterol increased it. More specifically, when the CGA increased and the Cchol remained constant in the SIF, the RR decreased by 25%, to 43%. However, the RR increased by 25%, to 48%, when the Cchol increased and the CGA remained constant in the SIF. Conversely, when the CGA increased and the Cchol remained constant in the SGF, the RR decreased by 12%, to 40%. However, the RR increased by 13%, to 32%, when the Cchol increased and the CGA remained constant in the SGF. Therefore, GA significantly affects the RR as it is a polymer that enhances the stability of liposomes. Furthermore, the presence of GA on the outside of the liposome creates a protective layer that may improve its stability without increasing its density [26,51]. The RR results of this present study were similar to that of the EE results, wherein GA has a synergistic effect on curcumin encapsulation while cholesterol has an anti-synergistic effect. Apart from minimising the risk of liposome leakage, GA also decreases the likelihood of easily releasing the encapsulated curcumin, as its bulky structure serves as a significant steric barrier for the curcumin to traverse, thereby decreasing its RR. Furthermore, the presence of cholesterol in the same encapsulation space as curcumin increases competition for encapsulation space, which causes the curcumin to be released and increases the RR [42,52]. This finding is in line with that of extant studies [28]. The 10%Cchol + 15%CGA-CCL/GA formulation yielded the lowest RR (0.450 ppm/day ± 0.029) in the SIF (Figure 7a), while the 10%Cchol + 30%CGA-CCL/GA formulation yielded the lowest RR (0.657 ppm/day ± 0.082) in the SGF (Figure 7b). The higher curcumin RR in the SGF implies that it released curcumin faster than the SIF. This release was accelerated by the hydrolysis of GA in the acidic environment. Hudiyanti et al. (2022) reported similar findings [19].

3.5. Particle Size (PS), Polydispersity Index (PDI), and Zeta Potential (ζ-Potential) of the Liposomes

When developing liposome formulations for nanoparticle-scale DDSs, it is essential to consider particle size (PS) and particle size distribution, as they directly affect how they release a drug throughout the body [53]. The PS affects the surface-to-volume ratio. More specifically, smaller-sized particles have a higher surface-to-volume ratio and more surface area for nanoliposomes. Therefore, the encapsulated drug is closer to the surface and released faster. Meanwhile, larger particles have a lower surface-to-volume ratio; therefore, the encapsulated drug is released slower. The PDI, which ranges from 0 to 1, indicates the extent of heterogeneity in PS distribution in a nanoparticle system. More specifically, a PDI < 0.1 indicates a mono-dispersed PS distribution, and a PDI > 0.1 indicates a polydispersed PS distribution, while a PDI = 0–1 indicates that the PS distribution is more uniform and more homogenous, while a PDI > 1 indicates an irregular PS distribution [54,55]. Zeta (ζ)-potential was used an additional parameter to assess the stability of the nanoliposome formulations for the DDS. The ζ-potential, which is the surface charge of a nanoparticle, may indicate the stability of the colloidal system, especially in the present study, as it involves a liposomal dispersion. Particles in a colloidal system do not aggregate or flocculate when the ζ-potential is high (>30 mV or <−30 mV) due to electrostatic repulsion between the individual particles, which enhances the long-term stability of the colloidal system during storage [26,56].
Table 3 presents the PS, PDI, and ζ-potential of CCL formulations containing curcumin and varying Cchol, while Table 4 presents the PS, PDI, and ζ-potential of the 10%Cchol-CCL formulations containing curcumin and coated with various CGA.
As seen in Table 3, the PSs (>100 nm) indicate that the liposome nanoparticles are large uni-lamellar vesicles (LUVs). The present study successfully developed LUV liposomes by using the thin-layer hydration method along with sonication throughout the manufacturing process. Thin-layer hydration forms giant uni-lamellar vesicle (GUV, >1000 nm) liposomes, but sonication can be used to decrease their size to the LUV category [57,58]. As seen in Table 3, the liposome dispersion was polydispersed, and the PS distribution was fairly stable, as the PDI was 0.1–1. However, the PS distributions of the LC20 and LC40 dispersions (>0.7) fluctuated slightly. The PDI must be low, as DDSs that use lipid-based carriers, such as liposomes, require a PDI < 0.3 [54,59]. During sonication, the vibration intensity and the sonication duration should be evaluated. As the ζ-potential was <−30 mV, the electrostatic stability of the liposome dispersion in all the formulations was excellent. Therefore, higher Cchol enhances the electrostatic stability of a liposome by increasing the negative charge of its surfaces, which ensures its long-term stability by effectively minimising the risk of flocculation during storage [56,60]. The ζ-potential of the LC0 dispersion was negative due to the ionisation of the phosphate groups present in the phospholipids, which negatively charged the membrane of the liposome [61]. As the ζ-potentials of the LC10 (−34.6 mV) and LC20 (−31.6 mV) dispersions were more negative than that of the LC0 (−30.9 mV) dispersion, Cchol affects the ζ-potentials of the liposomes. The ζ-potentials of the liposomes in this present study were significantly negative due to interactions between the cholesterol and the phospholipids. The hydroxyl group of cholesterol can create hydrogen (H) bonds with the phosphate group of phospholipids [62]. The hydroxyl group of cholesterol also tends to form H bonds with the choline group of the phosphatidylcholines. Therefore, the cholesterol causes interactions to occur between the hydroxyl and choline groups, which produces liposomes with significantly negatively charged surfaces. More specifically, the positively charged choline groups are drawn to the membrane, while the negatively charged hydroxyl groups are drawn to the surface of the membrane [61,63].
As seen in Table 4, the PSs of the liposome dispersions of each formulation indicate that the liposome nanoparticles are LUVs, and the PDI indicates that the liposome dispersion is polydispersed. Therefore, its homogeneity must be increased to achieve a more stable PS distribution. Meanwhile, the ζ-potentials indicate that the electrostatic stability of the LC10 formulation when combined with the GA matrix was poor (>−30 mV). Therefore, the long-term stability of formulations that have been coated with CGA is poor, and they are prone to flocculation during storage, unlike the formulation sans CGA (LC10G0). Nevertheless, the ζ-potentials of the LC10G10 (−20.6 mV) and LC10G20 (−19.9 mV) dispersions were better than that of the LC10G0 (−34.6 mV) dispersion. Therefore, the GA matrix affects the ζ-potential of the liposomes. Adding GA to the liposome formulation forms a thin protective layer as it can interact with the outer surface, or external lipid bilayer, of the liposomes. However, higher levels of CGA alter both the morphology and surface charge of liposomes, which increases the likelihood of liposome aggregation and decreases its short-term stability [26,64].

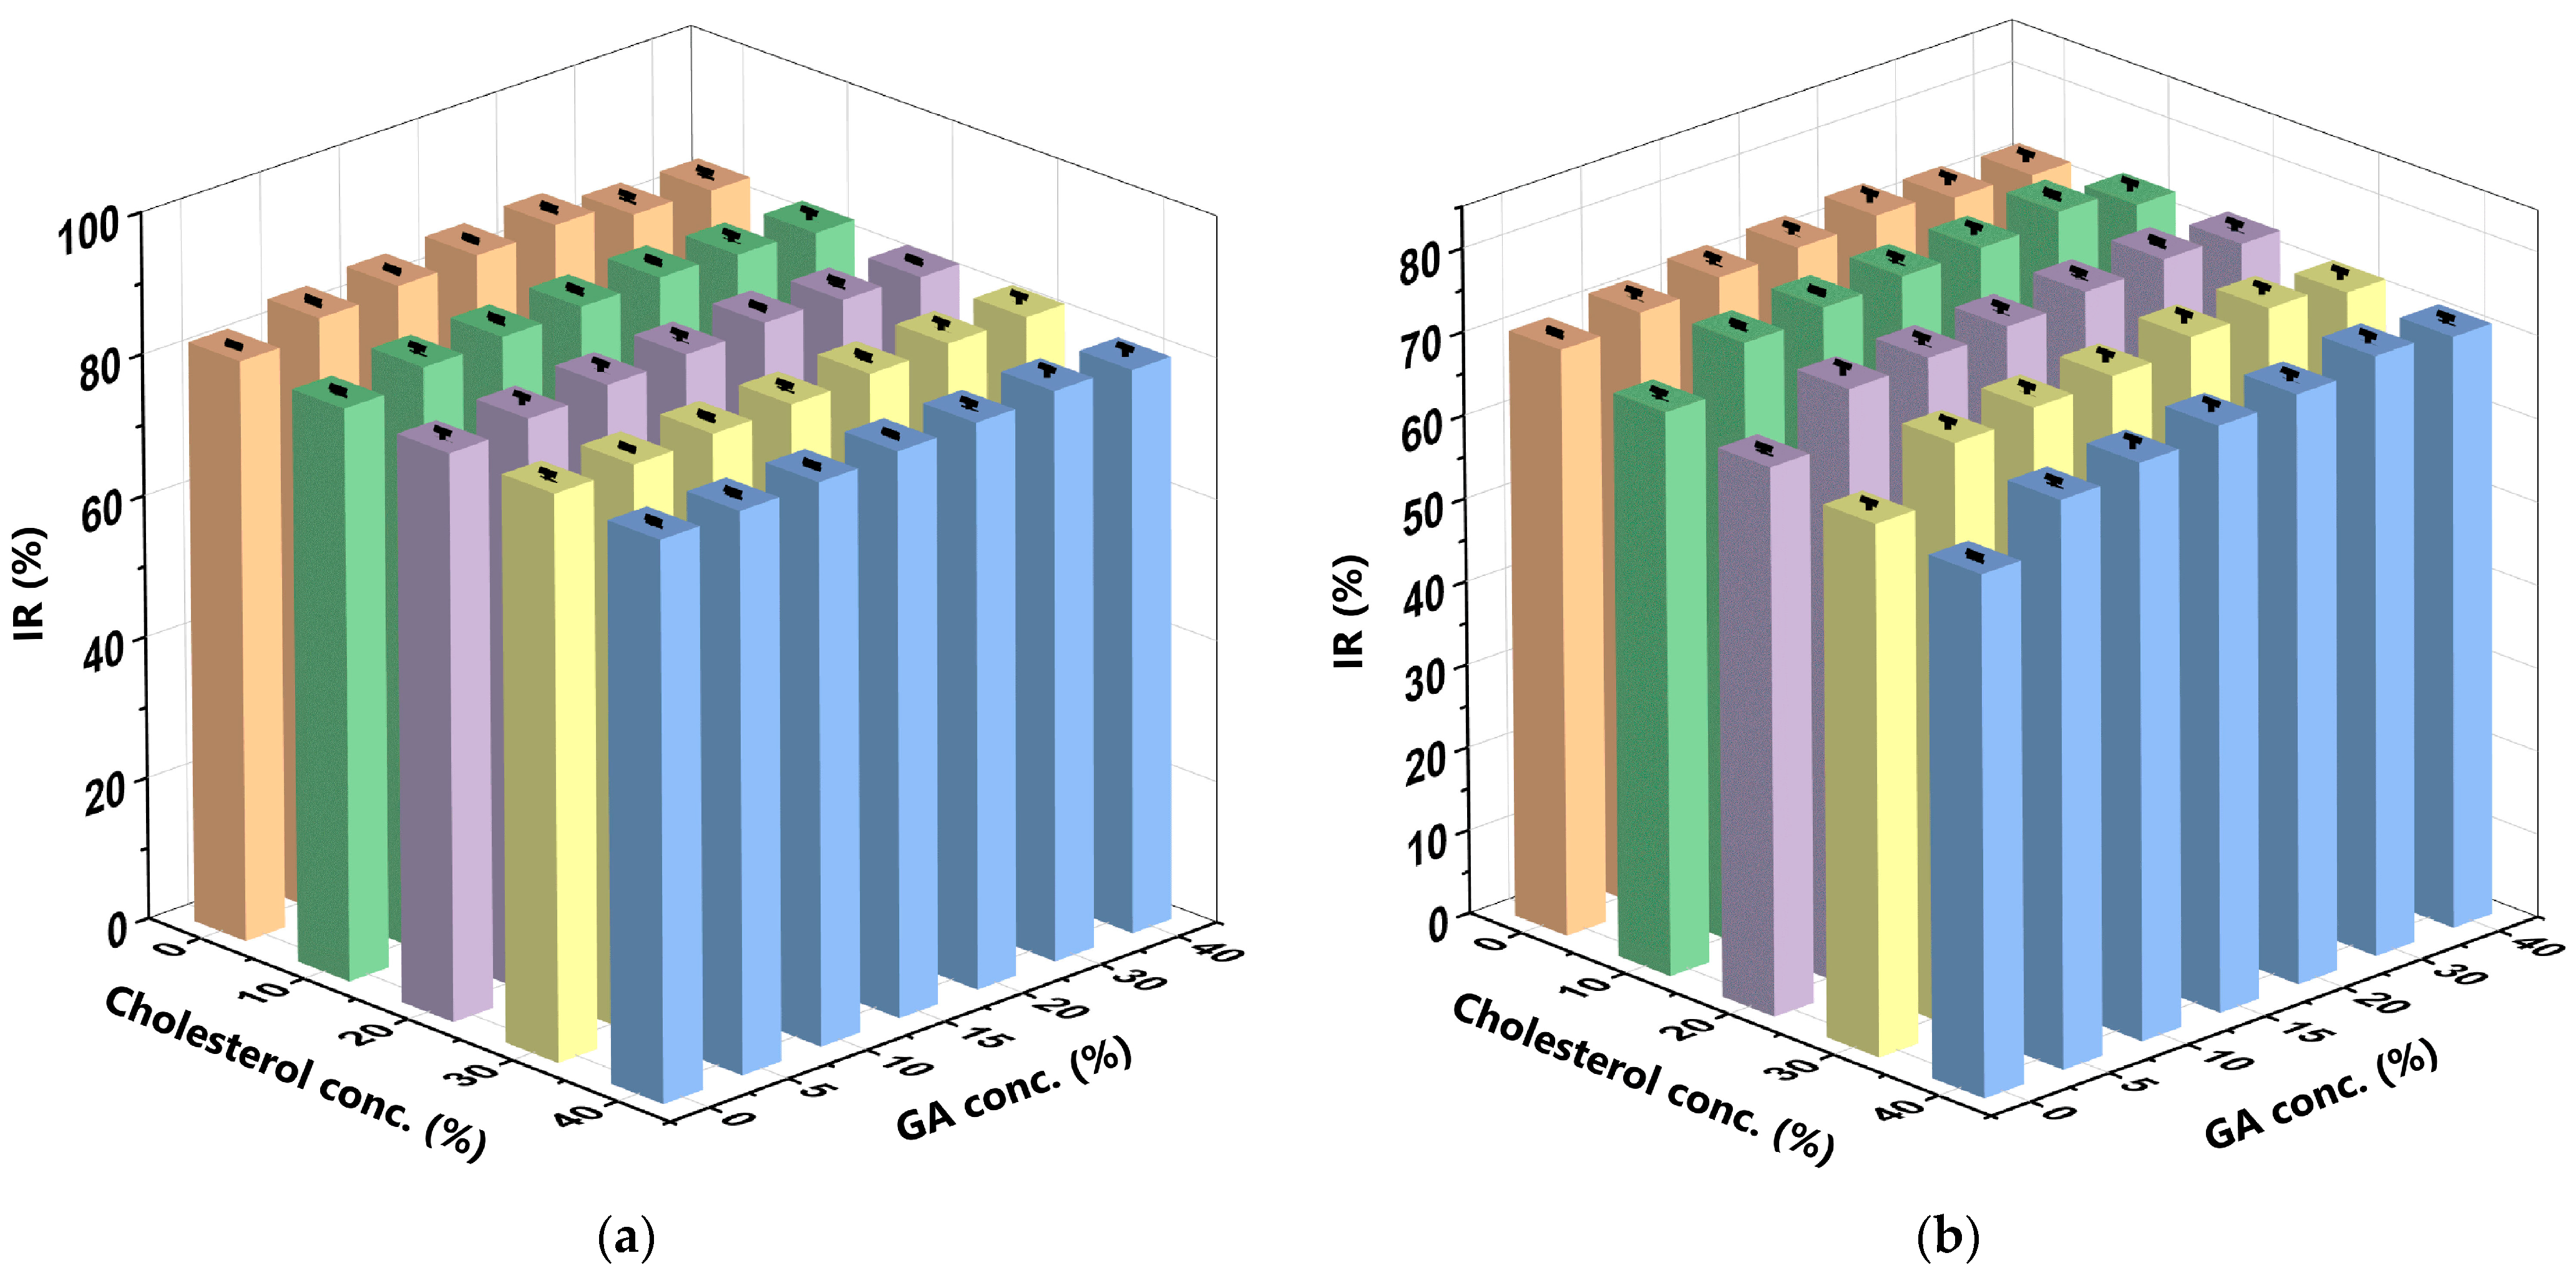
3.6. Antioxidant Activity (IR) of the Curcumin

The IR indicates the potential of an antioxidant compound, such as curcumin, to scavenge free radicals, inhibit the formation of reactive oxygen species (ROS), and prevent the oxidation of nutrients, especially lipids and proteins [65]. This present study used a DPPH scavenging activity assay to determine the IR of the curcumin encapsulated in the CCL/GA formulations [66,67]. DPPH is a stable free radical that exhibits its maximum absorption in ethanol at λ = 515–517 nm and appears dark purple in colour. When the H donor atoms of the antioxidant compound capture free radicals in the DPPH, it turns colourless or pale yellow [68,69]. The ability of curcumin to scavenge DPPH is proportional to the IR measured. Curcumin is a potent antioxidant as it can effectively scavenge DPPH free radicals, even at low Ccur [28,70]. Figure 8 depicts the IR of curcumin at various CGA and Cchol in the SIF and SGF.
The results of the CCL/GA formulation in the SIF indicate that cholesterol more significantly decreases IR than GA increases it. When the Cchol increased and the CGA remained constant, the IR decreased by 4%, to 7%, but it increased by only 2%, to 5%, when the CGA increased and the Cchol remained constant. Conversely, GA more significantly increases IR in the SGF than cholesterol decreases it. When the CGA increased and the Cchol remained constant, the IR increased by 4%, to 15%, but it decreased by only 1% to 11% when the Cchol increased and the CGA remained constant. Extant studies have reported similar effects of GA [19] and cholesterol [28] in SIF and SGF. As GA is a carrier and an antioxidant, it improves the IR of curcumin in direct proportion to the amount of GA used [71,72]. The 10%Cchol + 20%CGA-CCL/GA formulation yielded the optimum IR (84.081% ± 0.297) in the SIF (Figure 8a), while the 10%Cchol + 30%CGA-CCL/GA formulation yielded the optimum IR (75.439% ± 0.356) in the SGF (Figure 8b). The IR of curcumin was higher in the SIF than in the SGF due to the inherent properties of curcumin as it undergoes degradation more quickly in alkaline environments than in neutral and acidic environments. Therefore, the amount of non-degradable curcumin that reacts with the DPPH free radicals will differ. Curcumin exists as an enolate in the heptadienone chain (electron donor) in alkaline environments but in a protonated form (H donor) in neutral and acidic environments. It also exhibits low solubility in acidic environments. However, curcumin can only interact with DPPH free radical in its H donor form; therefore, curcumin has higher IR in the SIF [19,28].
Figure 8 depicts the IR as the antioxidant activity dominated by curcumin. Table 5 depicts the IR of the CocoPLs + cholesterol carrier sans curcumin, while Table 6 depicts that of the GA carrier sans curcumin.
As seen in Table 5, the highest IR of the CocoPLs + Cchol carriers sans curcumin was 3.549% in the SIF and 1.869% in the SGF. Meanwhile, that of the CGA carrier sans curcumin was 6.026% in the SIF and 4.896% in the SGF (Table 6). The IR of curcumin only was 85.311% in the SIF and 86.94% in the SGF. Therefore, the IR of both the CocoPLs and CGA carriers was significantly lower than that of curcumin (IR of curcumin in SIF ≤ 7% and in SGF ≤ 6%). As such, the IR when CocoPLs or CGA are used to encapsulate curcumin is the IR of the curcumin alone. Therefore, the IR of the CocoPLs and CGA carriers can be overlooked.

4. Conclusions

The present study successfully encapsulated curcumin in a liposome-based DDS comprising phospholipids, cholesterol, and GA polymer in SIF (neutral to slightly alkaline) and SGF (acidic). The liposomes were nanoparticles with comparable uniform PS distribution. The FTIR spectra of the CCL/GA formulation indicate the absence of new characteristic peaks that differ from those of its constituent components. Therefore, the interactions that occurred when encapsulating curcumin into the CCL/GA matrix were non-covalent. Increasing the Cchol decreased the EE, LC, and IR but increased the RR. Meanwhile, increasing the CGA increased both the EE and IR but decreased the LC and RR. These outcomes were observed in both the SIF and SGF. The IR of curcumin was higher in the SIF, but its RR was faster in the SGF. The 10%Cchol + 20%CGA CCL/GA formulation was the best for SIF as its EE = 93.245%, LC of CocoPLs = 7.989 mg Cur/g CocoPLs, LC of GA = 0.196 mg Cur/g GA (10%Cchol + 5%CGA), IR = 84.081%, and RR = 0.450 ppm/day (10%Cchol + 15%CGA). The 10%Cchol + 30%CGA CCL/GA formulation was the best for SGF as its EE = 97.317%, LC of CocoPLs = 7.887 mg Cur/g CocoPLs, LC of GA = 0.194 mg Cur/g GA (10%Cchol + 5%CGA), IR = 75.439%, and RR = 0.657 ppm/day. The CCL/GA formulations performed better in the SIF than in the SGF. As this present study only used PBS as a simulation solution, future studies should examine using bile salt in the simulation solution. Nevertheless, the findings of this present study may serve as a guideline for formulating liposomal curcumin formulations, especially for the gastrointestinal tract.

Supplementary Materials

The following supporting information can be downloaded at https://www.mdpi.com/article/10.3390/polym16070944/s1, Table S1: Tabulation of analysis results from CCL/GA formulations in SIF solution. Table S2: Tabulation of analysis results from CCL/GA formulations in SGF solution.

Author Contributions

Conceptualisation, D.H.; funding acquisition, D.H., P.S. and L.S.; methodology, D.H., K.A. and M.F.A.K.; investigation and data analysis, M.F.A.K., K.A. and S.S.; supervision, D.H., K.A. and P.S.; writing—original draft, D.H., M.F.A.K., K.A. and S.M.C.; writing—review and editing, D.H. and S.M.C.; resources, P.S. and L.S.; project administration, S.M.C. All authors have read and agreed to the published version of the manuscript.

Funding

This research was supported by The Minister of Research and Technology/BRIN Republic Indonesia through the PDUPT Research Scheme 2021; Grant No. 257-49/UN7.6.1/PP/2021.

Institutional Review Board Statement

Not applicable.

Data Availability Statement

All data generated or analysed during this study are included in this published article.

Acknowledgments

D.H., P.S. and L.S. thank LPPM UNDIP for administrative and technical support.

Conflicts of Interest

The authors declare that there are no conflicts of interest regarding the publication of this paper.

References

  1. Fang, L.; Gou, S.; Liu, X.; Cao, F.; Cheng, L. Design, synthesis and anti-Alzheimer properties of dimethylaminomethyl-substituted curcumin Derivatives. Bioorg. Med. Chem. Lett. 2014, 24, 40–43. [Google Scholar] [CrossRef] [PubMed]
  2. Liu, W.; Zhai, Y.; Heng, X.; Che, F.Y.; Chen, W.; Sun, D.; Zhai, G. Oral bioavailability of curcumin: Problems and advancements. J. Drug Target. 2016, 24, 694–702. [Google Scholar] [CrossRef] [PubMed]
  3. El Khoury, E.; Abiad, M.; Kassaify, Z.G.; Patra, D. Green synthesis of curcumin conjugated nanosilver for the applications in nucleic acid sensing and anti-bacterial activity. Colloids Surf. B Biointerfaces 2015, 127, 274–280. [Google Scholar] [CrossRef]
  4. Peter, K.V.; Shylaja, M.R. Introduction to herbs and spices: Definitions, trade and applications. In Handbook of Herbs and Spices, 2nd ed.; Peter, K.V., Ed.; Woodhead Publishing: Cambridge, UK, 2012; pp. 1–24. [Google Scholar] [CrossRef]
  5. Suresh, K.; Nangia, A. Curcumin: Pharmaceutical solids as a platform to improve solubility and bioavailability. CrystEngComm 2018, 20, 3277–3296. [Google Scholar] [CrossRef]
  6. Mohanty, C.; Das, M.; Sahoo, S.K. Emerging role of nanocarriers to increase the solubility and bioavailability of curcumin. Expert Opin. Drug Deliv. 2012, 9, 1347–1364. [Google Scholar] [CrossRef]
  7. Farooqui, T.; Farooqui, A.A. Curcumin: Historical background, chemistry, pharmacological action, and potential therapeutic value. Curcumin Neurol. Psychiatr. Disord. 2019, 23–44. [Google Scholar] [CrossRef]
  8. Sanidad, K.Z.; Sukamtoh, E.; Xiao, H.; McClements, D.J.; Zhang, G. Curcumin: Recent advances in the development of strategies to improve oral bioavailability. Annu. Rev. Food Sci. Technol. 2019, 10, 597–617. [Google Scholar] [CrossRef] [PubMed]
  9. Nguyen, T.A.; Tang, Q.D.; Doan, D.C.T.; Dang, M.C. Micro and nano liposome vesicles containing curcumin for a drug delivery system. Adv. Nat. Sci. 2016, 7, 035003. [Google Scholar] [CrossRef]
  10. Feng, T.; Wei, Y.; Lee, R.J.; Zhao, L. Liposomal curcumin and its application in cancer. Int. J. Nanomed. 2017, 12, 6027–6044. [Google Scholar] [CrossRef]
  11. Pattni, B.S.; Chupin, V.V.; Torchilin, V.P. New Developments in Liposomal Drug Delivery. Chem. Rev. 2015, 115, 10938–10966. [Google Scholar] [CrossRef]
  12. Dantas Lopes dos Santos, D.; Besegato, J.F.; de Melo, P.B.G.; Oshiro Junior, J.A.; Chorilli, M.; Deng, D.; Bagnato, V.S.; Rastelli, A.N.d.S. Curcumin-loaded Pluronic® F-127 Micelles as a Drug Delivery System for Curcumin-mediated Photodynamic Therapy for Oral Application. Photochem. Photobiol. 2021, 97, 1072–1088. [Google Scholar] [CrossRef]
  13. Nayakula, M.; Jeengar, M.K.; Naidu, V.G.M.; Chella, N. Enhanced Pharmacokinetics and Anti-inflammatory Activity of Curcumin Using Dry Emulsion as Drug Delivery Vehicle. Eur. J. Drug Metab. Pharmacokinet. 2023, 48, 189–199. [Google Scholar] [CrossRef] [PubMed]
  14. Rahman, M.A.; Ali, A.; Rahamathulla, M.; Salam, S.; Hani, U.; Wahab, S.; Warsi, M.H.; Yusuf, M.; Ali, A.; Mittal, V.; et al. Fabrication of Sustained Release Curcumin-Loaded Solid Lipid Nanoparticles (Cur-SLNs) as a Potential Drug Delivery System for the Treatment of Lung Cancer: Optimization of Formulation and In Vitro Biological Evaluation. Polymers 2023, 15, 542. [Google Scholar] [CrossRef] [PubMed]
  15. Santonocito, D.; Sarpietro, M.G.; Carbone, C.; Panico, A.; Campisi, A.; Siciliano, E.A.; Sposito, G.; Castelli, F.; Puglia, C. Curcumin containing PEGylated solid lipid nanoparticles for systemic administration: A preliminary study. Molecules 2020, 25, 2991. [Google Scholar] [CrossRef] [PubMed]
  16. Ban, C.; Jo, M.; Park, Y.H.; Kim, J.H.; Han, J.Y.; Lee, K.W.; Kweon, D.-H.; Choi, Y.J. Enhancing the oral bioavailability of curcumin using solid lipid nanoparticles. Food Chem. 2020, 302, 125328. [Google Scholar] [CrossRef] [PubMed]
  17. De Piano, R.; Caccavo, D.; Lamberti, G.; Remaut, K.; Seynaeve, H.; Barba, A.A. A New Productive Approach and Formulative Optimization for Curcumin Nanoliposomal Delivery Systems. Pharmaceutics 2023, 15, 959. [Google Scholar] [CrossRef] [PubMed]
  18. Gao, S.; Zong, L.; Zhang, Y.; Zhang, Y.; Guo, X.; Guo, G.; Zhao, L.; Ye, F.; Fu, Y. Antifungal pentachloronitrobenzene/hydroxypropyl-beta-cyclodextrin inclusion complex nanofibers by electrospun with no polymer: Fabrication and characterization. J. Clean. Prod. 2023, 413, 137499. [Google Scholar] [CrossRef]
  19. Hudiyanti, D.; Al Khafiz, M.F.; Anam, K.; Siahaan, P.; Christa, S.M. In Vitro Evaluation of Curcumin Encapsulation in Gum Arabic Dispersions under Different Environments. Molecules 2022, 27, 3855. [Google Scholar] [CrossRef] [PubMed]
  20. Al Khafiz, M.F.; Hikmahwati, Y.; Anam, K.; Hudiyanti, D. Key conditions of alpha-tocopherol encapsulation in gum Arabic dispersions. Int. J. Res. Pharm. Sci. 2019, 10, 2622–2627. [Google Scholar] [CrossRef]
  21. Çağdaş, M.; Sezer, A.D.; Bucak, S. Liposomes as potential drug carrier systems for drug delivery. Appl. Nanotechnol. Drug Deliv. 2014, 1, 1–50. [Google Scholar]
  22. De Leo, V.; Milano, F.; Mancini, E.; Comparelli, R.; Giotta, L.; Nacci, A.; Longobardi, F.; Garbetta, A.; Agostiano, A.; Catucci, L. Encapsulation of Curcumin-Loaded Liposomes for Colonic Drug Delivery in a pH-Responsive Polymer Cluster Using a pH-Driven and Organic Solvent-Free Process. Molecules 2018, 23, 739. [Google Scholar] [CrossRef] [PubMed]
  23. Briuglia, M.-L.; Rotella, C.; McFarlane, A.; Lamprou, D.A. Influence of cholesterol on liposome stability and on in vitro drug release. Drug Deliv. Transl. Res. 2015, 5, 231–242. [Google Scholar] [CrossRef] [PubMed]
  24. Zhang, Y.; Lervik, A.; Seddon, J.; Bresme, F. A coarse-grained molecular dynamics investigation of the phase behavior of DPPC/cholesterol mixtures. Chem. Phys. Lipids 2015, 185, 88–98. [Google Scholar] [CrossRef] [PubMed]
  25. Han, L.; Hu, B.; Ma, R.; Gao, Z.; Nishinari, K.; Phillips, G.O.; Yang, J.; Fang, Y. Effect of arabinogalactan protein complex content on emulsification performance of gum arabic. Carbohydr. Polym. 2019, 224, 115170. [Google Scholar] [CrossRef] [PubMed]
  26. Li, J.; Zhai, J.; Dyett, B.; Yang, Y.; Drummond, C.J.; Conn, C.E. Effect of gum arabic or sodium alginate incorporation on the physicochemical and curcumin retention properties of liposomes. LWT 2021, 139, 110571. [Google Scholar] [CrossRef]
  27. Fujimori, S. Gastric acid level of humans must decrease in the future. World J. Gastroenterol. 2020, 26, 6706–6709. [Google Scholar] [CrossRef] [PubMed]
  28. Hudiyanti, D.; Al Khafiz, M.F.; Anam, K.; Siahaan, P.; Suyati, L. Assessing encapsulation of curcumin in cocoliposome: In vitro study. Open Chem. 2021, 19, 358–366. [Google Scholar] [CrossRef]
  29. Tiwari, A.; Jain, S.K. Formulation, Optimization, and in vitro Characterization of Curcumin Loaded Liposomes for Colonic Delivery. Int. J. Pharm. Investig. 2021, 11, 408–413. [Google Scholar] [CrossRef]
  30. Hudiyanti, D.; Jayanti, M.; Al-Khafiz, M.F.; Anam, K. A study of coconut (Cocos nucifera L.) phosphatidylcholine species. Orient. J. Chem. 2018, 34, 2963. [Google Scholar] [CrossRef]
  31. Hudiyanti, D.; Al Khafiz, M.F.; Anam, K. Coconut (Cocos nucifera L.) lipids: Extraction and characterization. Orient. J. Chem. 2018, 34, 1136. [Google Scholar] [CrossRef]
  32. Hudiyanti, D.; Sari, R.I.; Arya, A.P.; Siahaan, P. Liposomes from jack beans phospholipid extract for delivering vitamin C. AIP Conf. Proc. 2020, 2237, 020064. [Google Scholar] [CrossRef]
  33. Taqui, S.N.; Mohan, C.S.; Goodarzi, M.S.; Elkotb, M.A.; Khatoon, B.A.; Soudagar, M.E.M.; Koki, I.B.; Elfasakhany, A.; Khalifa, A.S.; Ali, M.A.; et al. Sustainable Adsorption Method for the Remediation of Crystal Violet Dye Using Nutraceutical Industrial Fenugreek Seed Spent. Appl. Sci. 2021, 11, 7635. [Google Scholar] [CrossRef]
  34. Ma, Q.; Ren, Y.; Wang, L. Investigation of antioxidant activity and release kinetics of curcumin from tara gum/polyvinyl alcohol active film. Food Hydrocoll. 2017, 70, 286–292. [Google Scholar] [CrossRef]
  35. Wang, H.; Gong, X.; Guo, X.; Liu, C.; Fan, Y.-Y.; Zhang, J.; Niu, B.; Li, W. Characterization, release, and antioxidant activity of curcumin-loaded sodium alginate/ZnO hydrogel beads. Int. J. Biol. Macromol. 2019, 121, 1118–1125. [Google Scholar] [CrossRef] [PubMed]
  36. Olusanya, T.O.B.; Haj Ahmad, R.R.; Ibegbu, D.M.; Smith, J.R.; Elkordy, A.A. Liposomal Drug Delivery Systems and Anticancer Drugs. Molecules 2018, 23, 907. [Google Scholar] [CrossRef] [PubMed]
  37. Cheng, C.; Wu, Z.; McClements, D.J.; Zou, L.; Peng, S.; Zhou, W.; Liu, W. Improvement on stability, loading capacity and sustained release of rhamnolipids modified curcumin liposomes. Colloids Surf. B 2019, 183, 110460. [Google Scholar] [CrossRef] [PubMed]
  38. Liu, W.; Ye, A.; Liu, C.; Liu, W.; Singh, H. Structure and integrity of liposomes prepared from milk- or soybean-derived phospholipids during in vitro digestion. Food Res. Int. 2012, 48, 499–506. [Google Scholar] [CrossRef]
  39. Taylor, T.M.; Weiss, J.; Davidson, P.M.; Bruce, B.D. Liposomal Nanocapsules in Food Science and Agriculture. Crit. Rev. Food Sci. Nutr. 2005, 45, 587–605. [Google Scholar] [CrossRef] [PubMed]
  40. Feng, C.; Sun, G.; Wang, Z.; Cheng, X.; Park, H.; Cha, D.; Kong, M.; Chen, X. Transport mechanism of doxorubicin loaded chitosan based nanogels across intestinal epithelium. Eur. J. Pharm. Biopharm. 2014, 87, 197–207. [Google Scholar] [CrossRef]
  41. Wang, C.; Han, Z.; Wu, Y.; Lu, X.; Tang, X.; Xiao, J.; Li, N. Enhancing stability and anti-inflammatory properties of curcumin in ulcerative colitis therapy using liposomes mediated colon-specific drug delivery system. Food Chem. Toxicol. 2021, 151, 112123. [Google Scholar] [CrossRef]
  42. Maritim, S.; Boulas, P.; Lin, Y. Comprehensive analysis of liposome formulation parameters and their influence on encapsulation, stability and drug release in glibenclamide liposomes. Int. J. Pharm. 2021, 592, 120051. [Google Scholar] [CrossRef] [PubMed]
  43. Zatorska, M.; Łazarski, G.; Maziarz, U.; Wilkosz, N.; Honda, T.; Yusa, S.-I.; Bednar, J.; Jamróz, D.; Kepczynski, M. Drug-loading capacity of polylactide-based micro- and nanoparticles—Experimental and molecular modeling study. Int. J. Pharm. 2020, 591, 120031. [Google Scholar] [CrossRef] [PubMed]
  44. Wilkosz, N.; Łazarski, G.; Kovacik, L.; Gargas, P.; Nowakowska, M.; Jamróz, D.; Kepczynski, M. Molecular insight into drug-loading capacity of PEG–PLGA nanoparticles for itraconazole. J. Phys. Chem. B 2018, 122, 7080–7090. [Google Scholar] [CrossRef]
  45. Li, Y.; Yang, L. Driving forces for drug loading in drug carriers. J. Microencapsul. 2015, 32, 255–272. [Google Scholar] [CrossRef]
  46. Dragostin, I.; Dragostin, O.; Pelin, A.-M.; Grigore, C.; Lăcrămioara Zamfir, C. The importance of polymers for encapsulation process and for enhanced cellular functions. J. Macromol. Sci. Part A 2017, 54, 489–493. [Google Scholar] [CrossRef]
  47. Li, J.; Xiong, S.; Wang, F.; Regenstein, J.M.; Liu, R. Optimization of Microencapsulation of Fish Oil with Gum Arabic/Casein/Beta-Cyclodextrin Mixtures by Spray Drying. J. Food Sci. 2015, 80, C1445–C1452. [Google Scholar] [CrossRef]
  48. Gébleux, R.; Wulhfard, S.; Casi, G.; Neri, D. Antibody format and drug release rate determine the therapeutic activity of noninternalizing antibody–drug conjugates. Mol. Cancer Ther. 2015, 14, 2606–2612. [Google Scholar] [CrossRef] [PubMed]
  49. Bhowmik, D.; Gopinath, H.; Kumar, B.P.; Duraivel, S.; Kumar, K.P.S. Controlled release drug delivery systems. Pharma Innov. 2012, 1, 24–32. [Google Scholar]
  50. Johnston, M.J.W.; Semple, S.C.; Klimuk, S.K.; Edwards, K.; Eisenhardt, M.L.; Leng, E.C.; Karlsson, G.; Yanko, D.; Cullis, P.R. Therapeutically optimized rates of drug release can be achieved by varying the drug-to-lipid ratio in liposomal vincristine formulations. Biochim. Biophys. Acta (BBA) 2006, 1758, 55–64. [Google Scholar] [CrossRef]
  51. Xiang, S.; Yao, X.; Zhang, W.; Zhang, K.; Fang, Y.; Nishinari, K.; Phillips, G.O.; Jiang, F. Gum Arabic-stabilized conjugated linoleic acid emulsions: Emulsion properties in relation to interfacial adsorption behaviors. Food Hydrocoll. 2015, 48, 110–116. [Google Scholar] [CrossRef]
  52. Deniz, A.; Sade, A.; Severcan, F.; Keskin, D.; Tezcaner, A.; Banerjee, S. Celecoxib-loaded liposomes: Effect of cholesterol on encapsulation and in vitro release characteristics. Biosci. Rep. 2010, 30, 365–373. [Google Scholar] [CrossRef]
  53. Peretz Damari, S.; Shamrakov, D.; Varenik, M.; Koren, E.; Nativ-Roth, E.; Barenholz, Y.; Regev, O. Practical aspects in size and morphology characterization of drug-loaded nano-liposomes. Int. J. Pharm. 2018, 547, 648–655. [Google Scholar] [CrossRef] [PubMed]
  54. Danaei, M.; Dehghankhold, M.; Ataei, S.; Hasanzadeh Davarani, F.; Javanmard, R.; Dokhani, A.; Khorasani, S.; Mozafari, M.R. Impact of Particle Size and Polydispersity Index on the Clinical Applications of Lipidic Nanocarrier Systems. Pharmaceutics 2018, 10, 57. [Google Scholar] [CrossRef] [PubMed]
  55. Raval, N.; Maheshwari, R.; Kalyane, D.; Youngren-Ortiz, S.R.; Chougule, M.B.; Tekade, R.K. Chapter 10—Importance of Physicochemical Characterization of Nanoparticles in Pharmaceutical Product Development. In Basic Fundamentals of Drug Delivery; Tekade, R.K., Ed.; Academic Press: New York, NY, USA, 2019; pp. 369–400. [Google Scholar] [CrossRef]
  56. Németh, Z.; Csóka, I.; Semnani Jazani, R.; Sipos, B.; Haspel, H.; Kozma, G.; Kónya, Z.; Dobó, D.G. Quality by Design-Driven Zeta Potential Optimisation Study of Liposomes with Charge Imparting Membrane Additives. Pharmaceutics 2022, 14, 1798. [Google Scholar] [CrossRef] [PubMed]
  57. Guimarães, D.; Cavaco-Paulo, A.; Nogueira, E. Design of liposomes as drug delivery system for therapeutic applications. Int. J. Pharm. 2021, 601, 120571. [Google Scholar] [CrossRef]
  58. Fan, Y.; Marioli, M.; Zhang, K. Analytical characterization of liposomes and other lipid nanoparticles for drug delivery. J. Pharm. Biomed. Anal. 2021, 192, 113642. [Google Scholar] [CrossRef] [PubMed]
  59. Duong, V.A.; Nguyen, T.T.; Maeng, H.J. Recent Advances in Intranasal Liposomes for Drug, Gene, and Vaccine Delivery. Pharmaceutics 2023, 15, 207. [Google Scholar] [CrossRef]
  60. Okafor, N.I.; Nkanga, C.I.; Walker, R.B.; Noundou, X.S.; Krause, R.W.M. Encapsulation and physicochemical evaluation of efavirenz in liposomes. J. Pharm. Investig. 2020, 50, 201–208. [Google Scholar] [CrossRef]
  61. Najaf Najafi, M.; Arianmehr, A.; Sani, A.M. Preparation of Barije (Ferula gummosa) Essential Oil–Loaded Liposomes and Evaluation of Physical and Antibacterial Effect on Escherichia coli O157:H7. J. Food Prot. 2020, 83, 511–517. [Google Scholar] [CrossRef]
  62. Hudiyanti, D.; Putri, V.N.R.; Hikmahwati, Y.; Christa, S.M.; Siahaan, P.; Anugrah, D.S.B. Interaction of Phospholipid, Cholesterol, Beta-Carotene, and Vitamin C Molecules in Liposome-Based Drug Delivery Systems: An In Silico Study. Adv. Pharmacol. Pharm. Sci. 2023, 2023, 4301310. [Google Scholar] [CrossRef]
  63. Tripathy, S.; Srivastav, P.P. Encapsulation of Centella asiatica leaf extract in liposome: Study on structural stability, degradation kinetics and fate of bioactive compounds during storage. Food Chem. Adv. 2023, 2, 100202. [Google Scholar] [CrossRef]
  64. Bains, A.; Najda, A.; Chawla, P.; Klepacka, J.; Dhull, S.B.; Sadh, P.K.; Khan, M.A.; Kaushik, R. Formulation and Characterization of Gum Arabic Stabilized Red Rice Extract Nanoemulsion. Polymers 2022, 14, 1938. [Google Scholar] [CrossRef] [PubMed]
  65. Ivanova, A.V.; Gerasimova, E.L.; Brainina, K.Z. Potentiometric Study of Antioxidant Activity: Development and Prospects. Crit. Rev. Anal. Chem. 2015, 45, 311–322. [Google Scholar] [CrossRef]
  66. Annisa, R.; Jati Dharma, T.; Mutiah, R.; Nurjannah, S. Antioxidants Activity of Self-Nanoemulsifying Drug Delivery System on Dayak Onions Extract (Eleutherine palmifolia) using DPPH (2,2 difenil-1- picrylhydrazyl) Method. J. Trop. Pharm. Chem. 2021, 5, 396–405. [Google Scholar] [CrossRef]
  67. Kedare, S.B.; Singh, R.P. Genesis and development of DPPH method of antioxidant assay. J. Food Sci. Technol. 2011, 48, 412–422. [Google Scholar] [CrossRef]
  68. Warsi, W.; Sardjiman, S.; Riyanto, S. Synthesis and Antioxidant Activity of Curcumin Analogues. J. Chem. Pharm. Res. 2018, 10, 1–9. [Google Scholar]
  69. Zhao, Z.; Cui, X.; Ma, X.; Wang, Z. Preparation, characterization, and evaluation of antioxidant activity and bioavailability of a self-nanoemulsifying drug delivery system (SNEDDS) for buckwheat flavonoids. Acta Biochim. Biophys. Sin. 2020, 52, 1265–1274. [Google Scholar] [CrossRef]
  70. Sukati, S.; Khobjai, W. Total Phenolic Content and DPPH Free Radical Scavenging Activity of Young Turmeric Grown in Southern Thailand. Appl. Mech. Mater. 2019, 886, 61–69. [Google Scholar] [CrossRef]
  71. Mirghani, M.E.S.; Elnour, A.A.M.; Kabbashi, N.A.; Alam, M.Z.; Musa, K.H.; Abdullah, A. Determination of antioxidant activity of gum arabic: An exudation from two different locations. Sci. Asia 2018, 44, 177–186. [Google Scholar] [CrossRef]
  72. Suhag, Y.; Nayik, G.A.; Nanda, V. Effect of gum arabic concentration and inlet temperature during spray drying on physical and antioxidant properties of honey powder. J. Food Meas. Charact. 2016, 10, 350–356. [Google Scholar] [CrossRef]
Figure 1. FTIR spectra of the GA.
Polymers 16 00944 g001
Figure 2. FTIR spectra of the CCL [28].
Polymers 16 00944 g002
Figure 3. FTIR spectra of the CCL/GA.
Polymers 16 00944 g003
Figure 4. EE of the curcumin at varying CGA and Cchol in the (a) SIF and (b) SGF. The bar graph highlights five distinct colours that represent varying Cchol in liposome formulations. These colours are as follows: orange for liposomes with 0% cholesterol (LC0), green for liposomes with 10% cholesterol (LC10), purple for liposomes with 20% cholesterol (LC20), yellow for liposomes with 30% cholesterol (LC30), and blue for liposomes with 40% cholesterol (LC40). The 10%Cchol + 20%CGA-CCL/GA formulation yielded the optimum EE (93.245% ± 1.528) for curcumin in the SIF (a), while the 10%Cchol + 30%CGA-CCL/GA formulation yielded the optimum EE (97.317% ± 1.261) in the SGF (b). The data were collected in triplicate and evaluated using ANOVA at a significance level of p < 0.05. Comprehensive data are available in the Supplementary Materials.
Polymers 16 00944 g004
Figure 5. LC of the CocoPL carrier at varying CGA and Cchol in the (a) SIF and (b) SGF. The bar graph highlights five distinct colours that represent varying Cchol in liposome formulations. These colours are as follows: orange for liposomes with 0% cholesterol (LC0), green for liposomes with 10% cholesterol (LC10), purple for liposomes with 20% cholesterol (LC20), yellow for liposomes with 30% cholesterol (LC30), and blue for liposomes with 40% cholesterol (LC40). The 10%Cchol + 20%CGA-CCL/GA formulation yielded the optimum LC of the CocoPLs (7.989 mg Cur/g CocoPLs ± 0.329) in the SIF (a), while the 10%Cchol + 30% CGA CCL/GA formulation yielded the optimum LC of the CocoPLs (7.887 mg Cur/g CocoPLs ± 0.102) in the SGF (b). The data were collected in triplicate and evaluated using ANOVA at a significance level of p < 0.05. Comprehensive data are available in the Supplementary Materials.
Polymers 16 00944 g005
Figure 6. LC of the GA carrier at varying CGA and Cchol in the (a) SIF and (b) SGF. The bar graph highlights five distinct colours that represent varying Cchol in liposome formulations. These colours are as follows: orange for liposomes with 0% cholesterol (LC0), green for liposomes with 10% cholesterol (LC10), purple for liposomes with 20% cholesterol (LC20), yellow for liposomes with 30% cholesterol (LC30), and blue for liposomes with 40% cholesterol (LC40). The 10%Cchol + 5%CGA-CCL/GA formulation yielded the optimum LC of the GA (0.196 mg Cur/g GA ± 0.004) in the SIF (a), while the 10%Cchol + 5%CGA-CCL/GA formulation yielded the optimum LC of the GA (0.194 mg Cur/g GA ± 0.002) in the SGF (b). The data were collected in triplicate and evaluated using ANOVA at a significance level of p < 0.05. Comprehensive data are available in the Supplementary Materials.
Polymers 16 00944 g006
Figure 7. Curcumin RR at varying CGA and Cchol in the (a) SIF and (b) SGF. The bar graph highlights five distinct colours that represent varying Cchol in liposome formulations. These colours are as follows: orange for liposomes with 0% cholesterol (LC0), green for liposomes with 10% cholesterol (LC10), purple for liposomes with 20% cholesterol (LC20), yellow for liposomes with 30% cholesterol (LC30), and blue for liposomes with 40% cholesterol (LC40). The 10%Cchol + 15%CGA-CCL/GA formulation yielded the lowest RR (0.450 ppm/day ± 0.029) in the SIF (a), while the 10%Cchol + 30%CGA-CCL/GA formulation yielded the lowest RR (0.657 ppm/day ± 0.082) in the SGF (b). The data were collected in triplicate and evaluated using ANOVA at a significance level of p < 0.05. Comprehensive data are available in the Supplementary Materials.
Polymers 16 00944 g007
Figure 8. IR of curcumin at various CGA and Cchol in the (a) SIF and (b) SGF. The bar graph highlights five distinct colours that represent varying Cchol in liposome formulations. These colours are as follows: orange for liposomes with 0% cholesterol (LC0), green for liposomes with 10% cholesterol (LC10), purple for liposomes with 20% cholesterol (LC20), yellow for liposomes with 30% cholesterol (LC30), and blue for liposomes with 40% cholesterol (LC40). The 10%Cchol + 20%CGA-CCL/GA formulation yielded the optimum IR (84.081% ± 0.297) in the SIF (a), while the 10%Cchol + 30%CGA-CCL/GA formulation yielded the optimum IR (75.439% ± 0.356) in the SGF (b). The data were collected in triplicate and evaluated using ANOVA at a significance level of p < 0.05. Comprehensive data are available in the Supplementary Materials.
Polymers 16 00944 g008
Table 1. Curcumin encapsulated within cocoliposome (CCL) formulations.
CCL FormulationComposition (w/w/w; mg)
CocoPLsCholesterol p.a. (Chol)* Curcumin p.a. (Cur)
LC012501
LC1012512.51
LC20125251
LC3012537.51
LC40125501
* Curcumin p.a. in this table will be referred to as C0 curcumin or the initial curcumin p.a. concentration.
Table 2. Curcumin encapsulated within cocoliposomes with GA matrix coating (CCL/GA) formulations.
CCL FormulationCGA
0%5%10%15%20%30%40%
LC01 LC0G03 LC0G5LC0G10LC0G15LC0G20LC0G30LC0G40
LC10LC10G0LC10G5LC10G10LC10G15LC10G20LC10G30LC10G40
LC20LC20G0LC20G5LC20G10LC20G15LC20G20LC20G30LC20G40
LC30LC30G0LC30G5LC30G10LC30G15LC30G20LC30G30LC30G40
LC40LC40G0LC40G5LC40G10LC40G15LC40G20LC40G302 LC40G40
1 LC0G0 means that the CCL formulation contained 0% Cchol and was coated with a 0% CGA. 2 LC40G40 means that the CCL formulation contained 40% Cchol and was coated with 40% CGA. The codes from the other formulations can be adjusted to match the provided examples. 3 To produce the LC0G5 formulation, 6.3 mg GA (5%) was required based on the total mass of the LC0 composition (125 mg CocoPLs + 0 mg cholesterol p.a. + 1 mg curcumin p.a.) in the CCL formulation (Table 1).
Table 3. PS, PDI, and ζ-potential of CCL containing curcumin and various Cchol in the SIF.
LC0LC10LC20LC30LC40
PS (nm)305.6704.3366.8272.9602.9
PDI0.5460.5880.8470.4640.720
ζ-potential (mV)−30.9−34.6−31.6−31.2−34.1
Table 4. PS, PDI, and ζ-potential of 10%Cchol-CCL formulations containing curcumin and coated with various CGA in the SIF.
LC10G0LC10G5LC10G10LC10G15LC10G20LC10G30LC10G40
PS (nm)704.3838.1991.4591.4606.9852.5898.4
PDI0.5880.5740.6400.6470.4940.4040.571
ζ-potential (mV)−34.6−20.6−19.9−14.4−12.7−9.1−7.4
Table 5. IR of the CocoPLs + Cchol carrier sans curcumin.
LC0LC10LC20LC30LC40
SIF2.788%3.042%3.169%3.549%3.549%
SGF0.932%1.242%1.398%1.863%1.863%
Table 6. IR of the CGA carrier sans curcumin.
G5G10G15G20G30
SIF1.695%2.245%3.013%3.766%4.520%
SGF1.305%1.794%2.447%2.936%3.589%
Disclaimer/Publisher’s Note: The statements, opinions and data contained in all publications are solely those of the individual author(s) and contributor(s) and not of MDPI and/or the editor(s). MDPI and/or the editor(s) disclaim responsibility for any injury to people or property resulting from any ideas, methods, instructions or products referred to in the content.

