Abstract
Prior studies into fatigue crack growth (FCG) in fibre-reinforced polymer composites have shown that the two methodologies of Simple-Scaling and the Hartman–Schijve crack growth equation, which is based on relating the FCG rate to the Schwalbe crack driving force, Δκ, were able to account for differences observed in the measured delamination growth curves. The present paper reveals that these two approaches are also able to account for differences seen in plots of the rate of crack growth, da/dt, versus the range of the imposed stress intensity factor, ΔK, associated with fatigue tests on different grades of high-density polyethylene (HDPE) polymers, before and after electron-beam irradiation, and for tests conducted at different R ratios. Also, these studies are successfully extended to consider FCG in an acrylonitrile butadiene styrene (ABS) polymer that is processed using both conventional injection moulding and additive-manufactured (AM) 3D printing.
1. Introduction
For demanding applications, such as aerospace, automotive and pipelines, the service lifetime of HDPE is highly dependent on its resistance to the growth of small, naturally occurring cracks [1,2]. This aspect of its performance is of special significance, due to the possibility of internal and/or surface-breaking porosity or possibly the lack of fusion if the parts are produced using an AM process. As a result, United States Air Force Structures Bulletin EZ-SB-19-01 [3] states that all AM parts require a linear elastic fracture mechanics (LEFM) based durability and damage tolerance (DADT) assessment that is consistent with USAF MIL-STD-1530D [4]. Indeed, United States Air Force Structures Bulletin EZ-SB-19-01 [3] also states that the assessment and prediction of the durability and damage tolerance are perhaps the hardest challenges facing the structural integrity assessment of an AM part.
The Engineering Mechanics associated with fatigue crack growth in polymers and polymer blends, both conventionally and additively manufactured, has been active since the late 1960s [1,2,5,6,7,8,9,10,11,12,13,14,15,16,17,18,19,20,21,22,23,24,25,26], when it was first noted [5,9] that the rate of crack growth in a cycle, da/dN, could be related to ΔK, and the subsequent observation [6] that this may be the case for frequencies up to 100 Hz. An explanation of this phenomenon is given in [23], where it is also shown that the S-N curve, i.e., the stress–life curve, associated with polymers can be determined using linear elastic fracture mechanics (LEFM). (Here, a is the crack length, N is the cycle number, S is the applied stress amplitude, da/dN is the rate of crack growth per cycle, K is the crack tip stress intensity factor and ΔK is equal to Kmax − Kmin, where Kmax and Kmin are the maximum and the minimum values of the stress intensity factors in a load cycle, respectively). However, as can be seen from the recent reviews into slow crack growth in polymers [1,20], the equations used to model crack growth in polymers have not significantly changed from those reviewed by Radon in 1980 [12] and, as a result, are very similar to those used to assess crack growth in metals. It should also be noted that, as stated in ASTM test standard D7791 [27] and in [28], whilst a test frequency of between 1 and 25 Hz is allowable, a frequency of less than 5 Hz is recommended. This recommended lower test frequency of about 5 Hz is to reduce/minimise any possible effects due to heat generation.
The Nasgro crack growth equation [29]:
da/dN = DΔKeff(m−p) (ΔKeff − ΔKeff, thr)p/(1 − Kmax/A)q
This is perhaps the most commonly used crack growth equation that is commercially available in a software code. Here D, m, p and q are material constants, and A is the cyclic fracture toughness [29]. The term ΔKeff is the crack closure corrected value of ΔK, which for polymers is best expressed as originally suggested by Elber [30,31], that is:
ΔKeff = U(R) ΔK
Here the R ratio is defined as R = Kmin/Kmax and the function U(R) is chosen such that, for long cracks that experience plastic wake-induced crack closure, the resultant da/dN versus ΔKeff curves, associated with each individual R ratio-dependent da/dN versus ΔK curve, all fell onto a single curve regardless of the R ratio. The term ΔKeff.thr in Equation (1) is the effective fatigue threshold, by this, we mean the value of ΔKeff at which da/dN = 0. Whilst, for metals, numerous closed-form expressions for U(R) have been suggested [32,33,34,35,36], it is unclear if any of these formulae hold for polymers [21]. As such, for polymers, it may be necessary to determine the function U(R) empirically from the measured da/dN versus ΔK data.
The studies and analyses into LEFM approaches to modelling crack growth in polymers discussed above have several shortcomings. For example, although it has long been known [37] that the da/dN versus ΔK curves associated with the growth of long cracks in metals can have a large variability, there is no comparable study into the variability of the da/dN versus ΔK curves associated with crack growth in polymers. The importance of accounting for this variability in design is highlighted in the NASA Fracture Control Handbook NASA-HDBK-5010 [38] that mandates the use of the worst case (i.e., mean-3σ) da/dN versus ΔK curve, where σ is the standard deviation. Furthermore, to date, fatigue tests on polymers have focused on the use of specimen geometries that are either as outlined in the main body of the fatigue test standard ASTM E647-15el [39] and have notch lengths of the order of 10 mm, or the crack round-bar test (CRB) specimen geometry [2,26] that have notch lengths of the order of 1 mm or greater. However, Section 5.1.5 and Appendix X3 in the ASTM fatigue test standard, ASTM E647-15el, explain that such tests do not reflect the da/dN versus ΔK curves seen in an operational structure, and as a result, designs based on these curves can be non-conservative. Appendix X3 also states that the analysis methods outlined in the main body of ASTM E647-15el are inappropriate. Overcoming these shortcomings requires tests on small naturally occurring cracks in polymers that enable the worst case (mean-3σ) small-crack da/dN versus ΔK curves to be determined. (Indeed, the practical need to determine the da/dN versus ΔK curves associated with small naturally occurring cracks is highlighted in [40,41,42,43], albeit for metallic structures). For metals, one approach to achieving this goal is to etch the surface [43] or to create a regular array of small etch notches [44]. In this context, it should be noted that Appendix X3 of ASTM E647-15el also notes that it is unclear if a fatigue threshold exists for naturally occurring small cracks in metals. As a result, the crack growth history associated with small naturally occurring cracks often tends to be exponential [45,46,47,48,49]. It is unclear if this phenomenon, i.e., the exponential growth, will hold for small naturally occurring cracks in polymers.
Recognising the need to be able to model and predict crack growth in HDPE, the present paper focuses on two novel approaches that have recently been successfully employed for assessing delamination growth in fibre-reinforced polymer composites and crack growth in metals. The first approach is the Hartman–Schijve variant of the Nasgro crack growth equation [45] that has been widely used to study the growth of small (naturally occurring) cracks in a range of both conventionally and AM metals [43,44,45,46,49,50,51,52,53,54,55,56,57,58,59,60,61,62,63]. as well as delamination growth in fibre-reinforced polymer composites [64,65,66,67,68,69], and crack growth in epoxy polymeric adhesives [70,71], nano-composites [72], polymers [73] and plasma-sprayed refractory metals [74]. As first explained in [45], the Hartman–Schijve equation is a special form of Equation (1) and is obtained by setting m = p and q = p/2. The Hartman–Schijve equation is available for use in the commercially available finite-element computer programs ABAQUS®, ANSYS® and NASTRAN® via the Zencrack software add-in version 9.3-1 [75]. An example of its use to study crack growth in an adhesively bonded doubler under representative multi-axial flight loads is given in [76]. The second approach studied is a Simple-Scaling methodology that was first proposed for metals in [77]. This approach was subsequently extended to delamination growth in fibre-reinforced polymer composites in [68,69]. The Engineering Mechanics behind this approach is explained in [78], where it is suggested that there should be a link between the Hartman–Schijve equation and the Simple-Scaling approach.
The examples studied in this paper reveal that the Hartman–Schijve crack growth equation is also able to account for the differences in the crack growth rate, da/dt, versus ΔK curves seen in R = 0.1 fatigue tests on three different HDPE polymers, before and after electron-beam irradiation, and to also account for the R ratio effects seen in fatigue tests on a commercially available HDPE polymer. In the latter instance, it is also shown that the Hartman–Schijve equation is able to collapse the test data obtained by using two different test specimen geometries onto a single master curve. We also show that, in all of the examples studied, a Simple-Scaling methodology is also successful in analysing the FCG rate in the HDPE polymers.
2. Materials and Methods
2.1. The HDPE Polymers
The first data set examined was the da/dt versus ΔK curves for R = 0.1, as given by Cerpentier et al. [79,80], which is for three different HDPE polymers as a function of varying degrees of electron-beam irradiation, i.e., 50, 100 and 150 kGy. These cyclic fatigue tests were performed at room temperature, i.e., 23 °C, and at a frequency of 5 Hz. The notation used in [79,80] to characterise these various specimen tests is given in Table 1, where Mn, Mw and Mz are the molecular-weight distributions and χv is the crystalline volume fraction.

Table 1.
HDPE polymer descriptors from Cerpentier et al. [79,80].
The second data set analysed was the da/dt versus ΔK curves given by Pinter et al. [2] for a commercially available HDPE polymer tested at R ratios of 0.1, 0.3 and 0.5. The fatigue tests were conducted at 80 °C and a frequency of 10 Hz. (Here it should be noted that [2] stated, for commercial-in-confidence reasons, details of this particular material could not be given).
2.2. The ABS Polymer
The da/dt versus ΔK FCG curves at R = 0.1 given in [81] for an acrylonitrile butadiene styrene (ABS) (Terluran® GP-35 from Ineos, London, UK) polymer, processed using conventional injection moulding or additive manufacturing, i.e., via 3D printing [82], were also examined.
2.3. Methods of Data Analysis
As previously mentioned, the various da/dt versus ΔK curves given in [2,79,80] for tests on conventionally HDPE polymer manufactured and the da/dt versus ΔK curves given in [81] for ABS polymers processed using injection moulding or 3D printing were analysed using both the Hartman–Schijve [45] and the Simple-Scaling methodologies discussed in [68,69].
2.3.1. The Hartman–Schijve Methodology
As previously noted, the Hartman–Schijve crack growth equation [45], which as shown in [45], is a special case of the Nasgro crack growth equation and has been shown [43,44,45,46,49,50,51,52,53,54,55,56,57,58,59,60,61,62,63,64,65,66,67,68,69,70,71,72,73,74] to be able to accurately capture and model:
- (i)
- the growth of both small and long cracks in a range of both conventionally and AM metals;
- (ii)
- the growth of both small and long cracks in structural adhesives;
- (iii)
- the effect of temperature on crack growth in structural adhesives;
- (iv)
- the effect of adhesive thickness on crack growth in structural adhesives;
- (v)
- crack growth in nano-composites;
- (vi)
- crack growth in plasma sprayed metals;
- (vii)
- delamination growth in fibre-reinforced polymer composites.
This is available in the commercial finite-element programs ABAQUS, NASTRAN and ANSYS via the Zencrack computer software [75]. Furthermore, this approach can also be used to model the growth of complex-shaped 3D cracks in structural adhesives [76]. Therefore, the Hartman–Schijve approach was also used to study crack growth in the present fatigue tests on the HDPE and ABS polymers.
The form of the Hartman–Schijve used in this study is as given in [45], that is:
where a is the crack length, t is time, D and p are material constants and ∆κ [83] is the Schwalbe crack driving force, that is:
da/dt = D (∆κ)p
∆κ = (∆K − ∆Kthr)/√(1 − Kmax/A)
The term ∆Kthr is the fatigue threshold, by this, we mean the value of ∆K at which da/dt = 0 m/s. That said, a range of other non-LEFM-based models such as those described in [84,85,86] have also been recently suggested.
2.3.2. The Simple-Scaling Methodology
The paper by Schönbauer et al. [77] was the first to reveal that for conventionally manufactured metals, the R ratio effect vanished if the term da/dN was expressed as a function of ∆K/∆Kth, where ∆Kth is the value of ∆K at which da/dN= 10−10 m/cycle. This concept was subsequently validated in [69], where it was also extended to the statement that for conventionally manufactured metals, the R ratio effect vanished if the term da/dN was expressed as a function of ∆K/∆Kda/dN, where ∆Kda/dN is the value of ∆K at a low value of da/dN. References [68,69] extended this concept to delamination FCG in composites.
The explanation for this observation was recently given in [78], where it was shown that, for those problems for which Elber’s crack closure formulation held true, the function U(R) could be written as follows:
where ΔKeff,th is the fatigue threshold associated with the effective stress intensity factor ΔKeff.
U(R) = ΔKeff,th/ΔKth(R)
Consequently, although the studies presented in [68,69,77,78] only dealt with metals and fibre-reinforced polymer composites, in the present paper, we also examine if expressing da/dt as a function of ∆K/∆Kda/dt will:
- (i)
- collapse the R = 0.1 da/dt versus ΔK curves associated with the tests on these various HDPE polymers that have been irradiated;
- (ii)
- collapse the da/dt versus ΔK curves at values of R = 0.1, 0.3 and 0.5 given in [2] for a commercially available HDPE;
- (iii)
- collapse the R = 0.1 da/dt versus ΔK curves associated with the tests on the ABS polymer.
2.3.3. The Relationship between ∆K/∆Kda/dt and ∆κ
Since [78] suggested, but did not show, that there should exist a correlation between ∆K/∆Kda/dt and ∆κ, in the present study, particular attention will be given to plotting ∆K/∆Kda/dt as a function of ∆κ.
3. Results and Discussion
3.1. Crack Growth in a Range of HDPE Polymers
The paper by Cerpentier et al. [79] presented the results for three different HDPE polymers, as a function of the degree of irradiation, at a fixed value of R = 0.1. The test frequency was 5 Hz so that, as noted in the ASTM test standard D7791 [27], heating effects should be minimal. The radiation levels to which these polymers were exposed were either 50, 100 or 150 kGy. The resultant da/dt versus ΔK curves associated with these 12 tests are shown in Figure 1. (Note that Figure 1 and all the subsequent fatigue plots use logarithmic axes). The data associated with tests on (non-irradiated) HPE-12-75-350 are augmented by additional data given in [80] for R = 0.1 tests on non-irradiated HPE-12-75-350. Figure 1 reveals that the different polymers have different da/dt versus ΔK curves and that exposure to radiation resulted in noticeable changes in the da/dt versus ΔK curves.
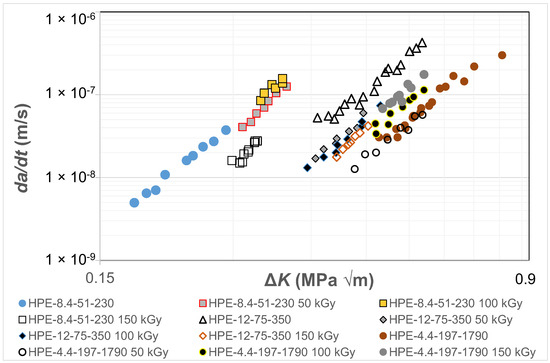
Figure 1.
The effect of exposure to radiation on the da/dt versus ΔK curves for the HDPE polymers for fatigue tests at 23 °C and a frequency of 5 Hz.
Cerpentier et al. [79,80] pointed out that HDPE is a semi-crystalline thermoplastic polymer, and electron-beam irradiation causes cross-linking of the polymer chains. The bulk of the cross-linking caused by the irradiation takes place in the amorphous phase, as opposed to the crystalline phase. Furthermore, although HDPE predominantly tends to cross-link upon irradiation, chain scission also occurs to a certain extent; again this tends to occur mainly in the amorphous phase. The results shown in Figure 1 reveal that the data can be described by an expression of the form of Equation (3) with an exponent that is independent of the degree of irradiation. This implies that the irradiation solely influences the pre-factor, D. Indeed, Cerpentier et al. [79,80] correlated the values of the pre-factor with various molecular structural parameters, i.e., Mn, Mw and Mz and χv, given in Table 1. The reader is referred to references [79,80] for further details, which are beyond the scope of the present paper.
Figure 2 and Figure 3 present the data shown in Figure 1 replotted with (a) da/dt expressed as a function of ΔK/ΔKda/dt, where the value of was chosen to correspond to a crack growth rate of 1.5 × 10⁻⁸ m/cycle, and (b) with da/dt expressed as a function of Δκ. Figure 2 reveals that when da/dt is expressed as a function of ΔK/ΔKda/dt, the curves collapse onto what is essentially a single curve. Similarly, Figure 3 reveals that when da/dt is expressed as a function of Δκ, the curves collapse onto what is essentially a single, albeit different, curve. In other words, the differences in the da/dt versus ΔK curves seen in Figure 1 vanish when account is made for the different values of the fatigue thresholds and the (cyclic) fracture toughness. Furthermore, Figure 4 reveals that, in these examples, there is a near-unique, strong correlation, with a coefficient of determination, R2, of 0.98 between ΔK/ΔKda/dt and Δκ.
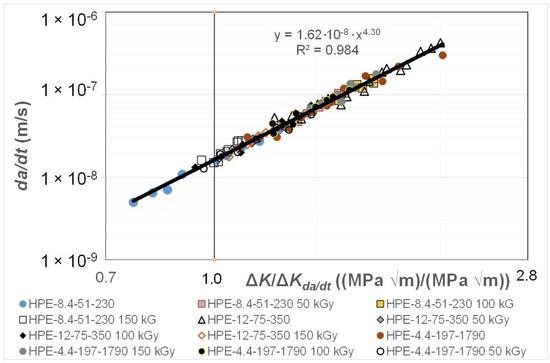
Figure 2.
The fatigue crack growth curve for the HDPE polymers with da/dt expressed as a function of ΔK/ΔKda/dt.
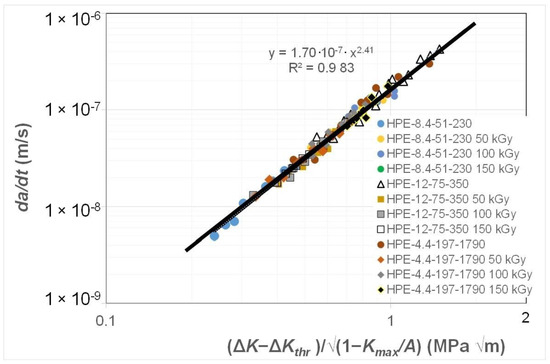
Figure 3.
The fatigue crack growth curve for the HDPE polymers with da/dt expressed as a function of Δκ.
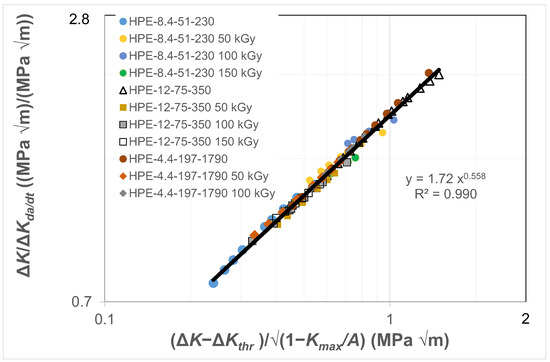
Figure 4.
The relationship between ΔK/ΔKda/dt and Δκ for the HDPE polymers.
This observation suggests that the engineering mechanics underpinning the growth of cracks in polymers mirrors those explained in [78] for crack growth in metals in that, from a mechanics perspective, fatigue crack growth is largely controlled by the term ΔKda/dt. This is an interesting observation and further confirms that both the Hartman–Schijve [45] and the Simple-Scaling [68,69] methodologies would appear to be equally valid approaches that one can adopt to analyse the FCG rate data.
3.2. Crack Growth in an HDPE Tested at a Range of R Ratios
The above discussion has been confined to a single R ratio. However, for certification and quality control purposes, we also need to know how to characterise and model the R ratio dependency of the da/dt versus ΔK curves. Therefore, to continue the present study, let us examine the da/dt versus ΔK curves at R = 0.1, 0.3 and 0.5, as given in [2] for a commercially available HDPE polymer that was tested at 80 °C and a frequency of 10 Hz. (As per ASTM test standard D7791 [27] this means that heating effects are minimal). This study gave da/dt versus ΔK curves that were obtained using two different specimen test geometries. One of the specimen geometries used was the ASTM E647 compact tension (CT) specimen. The other test specimen geometry used was a circumferentially cracked round bar (CRB) specimen, see [2,26] for more details of the geometry of this particular test specimen. As can be seen in Figure 5, these two test configurations provided different da/dt versus ΔK curves, although it is unclear why these two different test geometries provided such different curves.
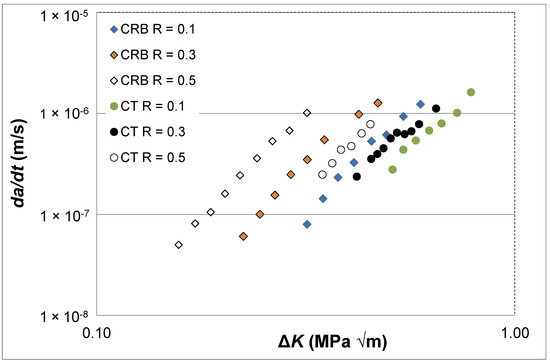
Figure 5.
The R ratio and specimen dependency of the da/dt versus ΔK curves for fatigue tests using the commercially available HDPE polymer tested at 80 °C and a frequency of 10 Hz.
As in the prior study, we first replotted these curves with da/dt expressed as a function of ΔK/ΔKda/dt. The resultant curves are shown in Figure 6. In this instance, the value of ΔKda/dt was chosen to correspond to a crack growth rate of approximately 2.3 × 10⁻⁷ m/s, see Figure 5. This value was chosen since it represented the lowest value of da/dt where all of the curves, shown in Figure 5, had a (near) common data point. Figure 6 also contains the prior curve predicted on the basis of the relationship between da/dt and ΔK/ΔKda/dt shown in Figure 2, i.e., the line of best fit shown in Figure 2, for the HDPE polymers studied in [79,80], that is:
da/dt = 1.62 × 10⁻⁸ (ΔK/ΔKda/dt)4.3
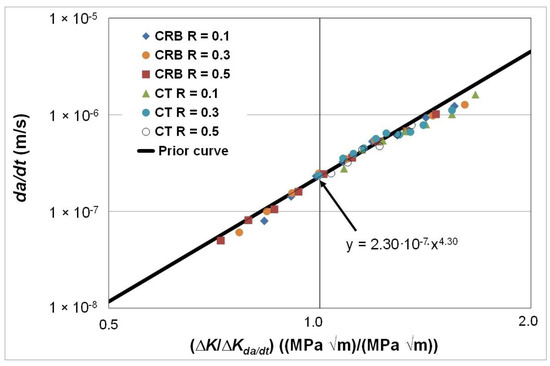
Figure 6.
The R ratio and specimen dependency of the da/dt versus ΔK/ΔKda/dt curves for fatigue tests using the commercially available HDPE polymer tested at 80 °C and a frequency of 10 Hz.
This was carried out by rescaling Equation (5) so that, when ΔK/ΔKda/dt = 1, the value of da/dt was equal to 2.3 × 10⁻⁷ m/s, see Figure 6. The resultant rescaled equation is as follows:
da/dt = 2.3 × 10⁻⁷ (ΔK/ΔKda/dt)4.3
The results shown in Figure 6 reveal that:
- (i)
- Both the R ratio and the specimen test geometry dependency essentially vanish, i.e., the results fall onto a single curve, when da/dt is expressed as a function of ΔK/ΔKda/dt. As a result, the engineering mechanics behind this observation would appear to be as delineated in [78] for metals.
- (ii)
- There is good agreement between this curve and the predicted curve that is based on tests discussed in Section 3.1 and shown in Figure 2.
In other words, for the various HDPE polymers studied, the relationship between da/dt and ΔK/ΔKda/dt is relatively independent of the nature of the polymer, the test geometry, the R ratio and the test temperature. As such this observation extends the engineering science given in [78] for conventional and additively manufactured metals to this class of problems.
The fatigue crack growth curves were next replotted with da/dt expressed as a function of Δκ, and the resultant da/dt versus Δκ curves are shown in Figure 7.
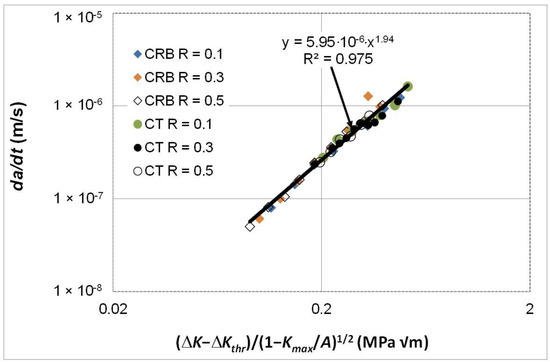
Figure 7.
The R ratio and specimen dependency of the da/dt versus Δκ curves for fatigue tests using the commercially available HDPE polymer tested at 80 °C and a frequency of 10 Hz.
Figure 7 reveals that when da/dt is expressed as a function of Δκ then both the R ratio and the specimen test geometry dependency disappear. In other words, the differences seen in the da/dt versus ΔK curves vanish when account is made for the different values of the fatigue thresholds and (cyclic) fracture toughness. Furthermore, as can be seen in Figure 8, it would appear that there is, again, a near-unique and strong correlation between ΔK/ΔKda/dt and Δκ. Indeed, this relationship has a coefficient of determination, R2, of approximately 0.98. As previously noted, this finding reinforces the prior observation that the engineering mechanics underpinning the growth of cracks in polymers mirrors those explained in [78] for crack growth in metals. Thus, again, this interesting observation further confirms that both the Hartman–Schijve [45] and the Simple-Scaling [68,69] methodologies are equally valid approaches that one can adopt to analyse the FCG rate data.
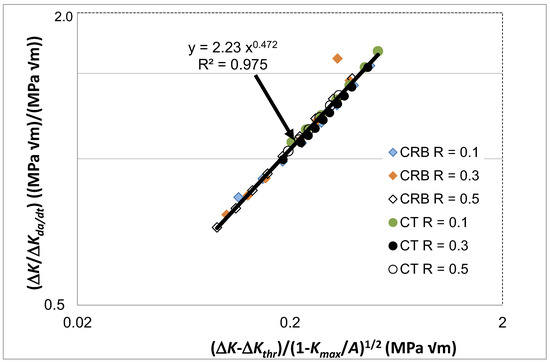
Figure 8.
The relationship between ΔK/ΔKda/dt and Δκ for fatigue tests using the commercially available HDPE polymer tested at 80 °C and a frequency of 10 Hz.
3.3. Comparison of Results for the HDPE Polymers from [2,79,80]
Let us next compare the results from the three HDPE polymers, both non-irradiated and irradiated, reported in [79,80] to the one HDPE polymer reported in [2]. By examining Figure 2 and Figure 3 we understand that the FCG rate results for the three HDPE polymers, and for both the non-irradiated and irradiated materials, would (to a first approximation) appear to lie on a single, unique linear plot when the data are plotted on logarithmic scales as analysed using the Simple-Scaling, see Figure 2, or the Hartman–Schijve, see Figure 3, methodologies, respectively. This reflects the fact that, as commented in [79,80], relatively small differences were observed in the FCG kinetics as a function of irradiation dose, which is quite remarkable, since the molecular-weight distribution changes drastically with irradiation dose. Currently, the results for the FCG rate for the one HDPE polymer reported in [2], where the tests were undertaken as a function of the R ratio and the type of test specimen employed, are internally consistent. By this, we mean that, as shown in Figure 6, the test data lie on a single, unique linear plot when the data are plotted on logarithmic scales using the Simple-Scaling. Similarly, Figure 7 reveals that when the data are plotted as per the Hartman–Schijve formulation the data also lie on a single, unique linear plot. However, comparing Figure 4 and Figure 8, we find that the relationships between ΔK/ΔKda/dt and Δκ differ. Unfortunately, since no details of the HDPE polymer used in the tests reported in [2] are given due to commercial confidentiality, no comments on the reasons for this observation are possible.
3.4. Crack Growth in Injection-Moulded and 3D-Printed ABS Polymer
As previously noted there are currently only a few studies that present fatigue crack growth curves associated with AM polymers and even fewer that present the FCG curves associated with the growth of small naturally occurring cracks in either AM or conventionally manufactured polymers. Consequently, to continue this study, we chose to examine the R = 0.1 da/dt versus ΔK curves given in [81] for an ABS (Terluran® GP-35) polymer where the test specimens were manufactured using a conventional injection moulding or an AM 3D-printing process, more specifically by what is termed an “Arburg plastic free-forming (APF)” process and for more details see [81,82]. As can be seen in Figure 9, these two different manufacturing processes provided somewhat different da/dt versus ΔK curves. As in the prior studies, Figure 10 and Figure 11 present these curves replotted with da/dt expressed as a function of ΔK/ΔKda/dt and Δκ, respectively. Figure 10 and Figure 11 both reveal that, when da/dt is expressed as a function of ΔK/ΔKda/dt or Δκ, the experimental results associated with the injection-moulded and the 3D-printed specimens essentially collapse onto one unique relationship previously noted and the 3D-printed specimens essentially collapse onto one unique relationship. This observation further supports the belief that the engineering mechanics underpinning the growth of cracks in polymers mirrors those explained in [78] for crack growth in metals.
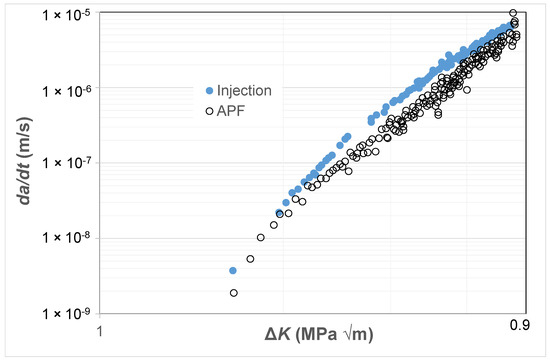
Figure 9.
The da/dt versus ΔK curves for fatigue tests on the ABS test specimens manufactured via a conventional injection-moulding process or by an AM 3D-printing (i.e., the APF) process.
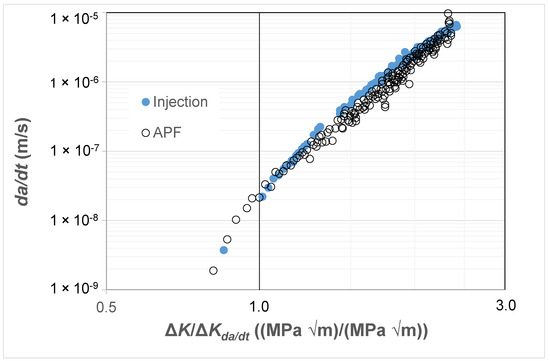
Figure 10.
The da/dt versus ΔK/ΔKda/dt curves for tests on the ABS test specimens manufactured via a conventional injection-moulding process or by an AM 3D-printing (i.e., the APF) process.
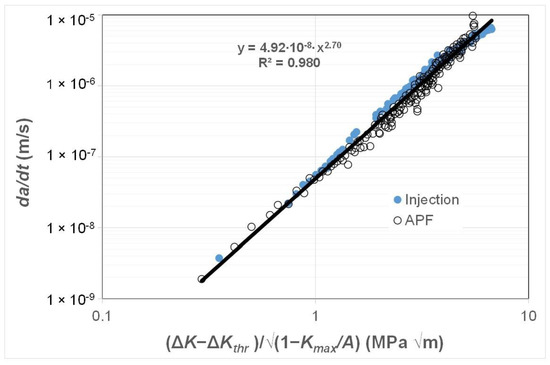
Figure 11.
The da/dt versus Δκ curves for fatigue tests on the ABS test specimens manufactured via a conventional injection-moulding process or by an AM 3D-printing (i.e., the APF) process.
Finally, as can be seen in Figure 12, it would appear that there is, again, a near-unique correlation between ΔK/ΔKda/dt and Δκ. Thus, again, this interesting observation further reveals that the engineering science developed in [78] for crack growth in conventionally and additively manufactured metals appears to hold for crack growth in these polymers. Indeed, it should also be noted that [68,69] have shown that both the Hartman–Schijve and the Simple-Scaling methodologies are equally valid approaches that can be used to analyse fatigue crack growth in a range of fibre-reinforced polymer composites.
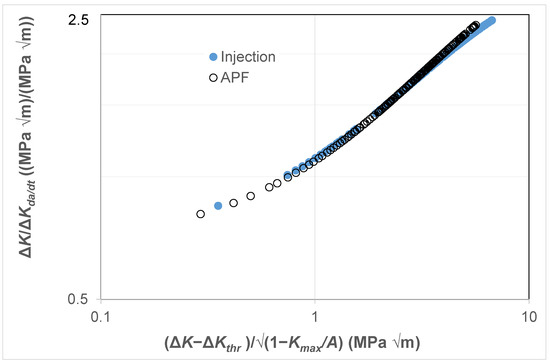
Figure 12.
The relationship between ΔK/ΔKda/dt and Δκ for fatigue tests on the ABS test specimens manufactured via a conventional injection-moulding process or by an AM 3D-printing (i.e., the APF) process.
4. Conclusions
This paper has shown that the Engineering Mechanics that links the Simple-Scaling and the Hartman–Schijve crack growth equation for metals also holds for crack growth in tests on a range of HDPE polymers as well as in the two ABS polymers studied. As a result, as first suggested in [78] for conventionally and additively manufactured materials as well as for a medium entropy alloy, the function U(R) used to relate ΔK to ΔKeff for these various polymers would appear to be inversely proportional to ΔKda/dt. Furthermore, from a fracture mechanics perspective, for the various HDPE polymers studied, the relationship between da/dt and ΔK/ΔKda/dt would appear to be relatively independent of the nature of the polymer, as well as the degree of irradiation, the test geometry and the R ratio. This observation suggests that, from a fracture mechanics perspective, fatigue crack growth in these tests would appear to be largely controlled by the term ΔKda/dt. We also have shown that, for the polymers studied, there is a strong correlation between the ratio ΔK/ΔKda/dt and the Schwalbe crack driving force, Δκ.
Author Contributions
Analysis and methodology, A.J.K. and R.J.; original draft preparation, A.S.M.A.; proofreading and correction, A.J.K. All authors have read and agreed to the published version of the manuscript.
Funding
R.J. and A.S.M.A. would like to acknowledge funding provided by the US Army International Technology Center, Indo-Pacific (ITC-IPAC), Tokyo, Contract No. FA520923C0010.
Institutional Review Board Statement
Not applicable.
Data Availability Statement
The data will be made available at the completion of the project.
Acknowledgments
The findings and conclusions or recommendations expressed in this paper are those of the authors and do not necessarily reflect the views of the ITC-IPAC.
Conflicts of Interest
The authors declare no conflicts of interest.
Nomenclature
| a | total crack length, measured from the loading line |
| A | constant in the Hartman–Schijve equation |
| ABS | acrylonitrile butadiene styrene |
| AM | additive-manufactured |
| da/dt | rate of fatigue crack growth |
| CRB | cracked round-bar test |
| CT | compact tension test |
| D | a constant in the Hartman–Schijve and Nasgro crack growth equations |
| DADT | durability and damage tolerance |
| m and q | constants in the Nasgro crack growth equation |
| FCG | fatigue crack growth |
| HDPE | high-density polyethylene |
| stress intensity factor | |
| maximum value of the applied stress intensity factor in the fatigue cycle | |
| minimum value of the applied stress intensity factor in the fatigue cycle | |
| range of the applied stress intensity factor in the fatigue cycle, as defined below | |
| ΔKda/dt | the value of ΔK at a low value of da/dt |
| Δκ | the Schwalbe crack driving force |
| LEFM | linear elastic fracture mechanics |
| NASA | North American Space Administration |
| NIST | National Institute of Standards and Technology |
| p | exponent in the Hartman–Schijve and Nasgro crack growth equations |
| Pmax | maximum load applied during the fatigue test |
| Pmin | minimum load applied during the fatigue test |
| load ratio (=Pmin/Pmax) | |
| RAAF | Royal Australian Air Force |
| R2 | coefficient of determination |
| t | time |
| S | applied stress amplitude |
| USAF | United States Air Force |
References
- Almomani, A.; Mourad, A.H.; Deveci, S.; Wee, J.W.; Choi, B.H. Recent advances in slow crack growth modelling of polyethylene materials. Mater. Des. 2023, 227, 111720. [Google Scholar] [CrossRef]
- Pinter, G.; Arbeiter, F.; Berger, I.J.; Frank, A. Correlation of fracture mechanics based lifetime prediction and internal pipe pressure tests. In Proceedings of the 17 Plastic Pipes Conference, PPXVII, Chicago, IL, USA, 22–24 September 2014. [Google Scholar]
- United States Air Force Structures Bulletin EZ-SB-19-01, Durability and Damage Tolerance Certification for Additive Manufacturing of Aircraft Structural Metallic Parts, Wright Patterson Air Force Base, OH, USA, 10 June 2019. Available online: https://daytonaero.com/usaf-structures-bulletins-library/ (accessed on 2 March 2024).
- MIL-STD-1530D. Department of Defense Standard Practice Aircraft Structural Integrity Program (ASIP), 13 October 2016. Available online: http://everyspec.com/MIL-STD/MIL-STD-1500-1599/download.php?spec=MIL-STD-1530D (accessed on 2 March 2024).
- Hertzberg, R.W.; Nordberg, H.; Manson, J.A. Fatigue crack propagation in polymeric materials. J. Mater. Sci. 1970, 5, 521–526. [Google Scholar] [CrossRef]
- Hertzberg, R.W.; Manson, J.A.; Skibo, M. Frequency sensitivity of fatigue processes in polymeric solids. Polym. Eng. Sci. 1975, 15, 252–260. [Google Scholar] [CrossRef]
- Arad, S.; Radon, J.C.; Culver, L.E. Growth of fatigue cracks in polycarbonate. Polym. Eng. Sci. 1972, 12, 193–198. [Google Scholar] [CrossRef]
- Suzuki, M.; Yamashita, T.; Nishimura, Y. A study on the transition of fracture mode during fatigue crack propagation in polycarbonate plate. J. Jpn. Soc. Mater. Sci. 1974, 23, 52–57. [Google Scholar] [CrossRef]
- Williams, J.G. Fracture Mechanics of Polymers; Ellis Horwood: Chichester, UK, 1984. [Google Scholar]
- Williams, J.G. A model of fatigue crack growth in polymers. J. Mater. Sci. 1977, 12, 2525–2533. [Google Scholar] [CrossRef]
- El-Hakeem, E.A.; Culver, L.E. Environmental dynamic fatigue crack propagation in Nylon 66. Int. J. Fatigue 1979, 1, 133–140. [Google Scholar] [CrossRef]
- Radon, J. Fatigue crack growth in polymers. Int. J. Fract. 1980, 16, 533–552. [Google Scholar] [CrossRef]
- Hertzberg, R.W.; Manson, J.A. Fatigue of Engineering Plastics; Academic Press: Cambridge, MA, USA, 1980; pp. 74–145. [Google Scholar]
- El-Hakeem, E.A.; Culver, L.E. Environmental dynamic fatigue crack propagation in high density polyethylene: An empirical modelling approach. Int. J. Fatigue 1981, 1, 3–8. [Google Scholar] [CrossRef]
- Pruitt, L.; Hermann, R.; Suresh, S. Fatigue crack growth in polymers subjected to fully compressive cyclic loads. J. Mater. Sci. 1992, 27, 1608–1616. [Google Scholar] [CrossRef]
- Tam, E.P.; Martin, G.C. Fatigue models for glassy polymers. J. Macromol. Sci. Part B 1984, 23, 415–433. [Google Scholar] [CrossRef]
- Bureau, M.N.; Dickson, J.L.; Denault, J. Fatigue propagation behaviour of polystyrene/polyethylene blends. J. Mater. Sci. 1998, 33, 405–419. [Google Scholar]
- Bureau, M.N.; Dickson, J.L.; Denault, J. Comparison of the fatigue propagation behaviour of polystyrene and 95/5 polystyrene/polyethylene blends. J. Mater. Sci. 1998, 33, 1591–1606. [Google Scholar] [CrossRef]
- Gan, Y.; El-Hadik, M.; Aglan, H.; Faughnan, P.; Bryan, C. Fatigue crack growth analysis of poly(monochlorotrifluoroethylene) (CTFE). J. Elastomers Plast. 1999, 31, 84–179. [Google Scholar] [CrossRef]
- Pruitt, L.; Wat, A.; Malit, L. Fatigue and Fracture Mechanisms in Polymers, Chapter 22.1. In ASM Handbook; Volume 11B, Characterization and Failure Analysis of Plastics; Mennal, T.J., Ed. ASM International, Materials Park, OH, USA. Available online: https://dl.asminternational.org/handbooks/edited-volume/171/chapter-abstract/3730789/Fatigue-and-Fracture-Mechanisms-in-Polymers?redirectedFrom=fulltext (accessed on 20 March 2024).
- Sadananda, K.; Vasudevan, A.K. Analysis of fatigue crack growth behaviour in polymers using the unified approach. Mater. Sci. Eng. A 2004, 387–389, 536–541. [Google Scholar] [CrossRef]
- Ramsteiner, F.; Armbrust, T. Fatigue crack growth in polymers. Polym. Test. 2001, 20, 321–327. [Google Scholar] [CrossRef]
- Ravi Chandran, K.S. Mechanical fatigue of polymers: A new approach to characterize the S-N behaviour on the basis of macroscopic crack growth mechanism. Polymer 2016, 91, 222–238. [Google Scholar] [CrossRef]
- Messiha, M.; Frank, A.; Arbeiter, F.; Pinter, G. On the slow crack growth process and associated structure—Property relationships in polyamide12 grades. J. Appl. Polym. Sci. 2022, 139, 52–57. [Google Scholar] [CrossRef]
- Cano, A.J.; Salazar, A.; Rodríguez, J. Effect of the orientation on the fatigue crack growth of polyamide 12 manufactured by selective laser sintering. Rapid Prototyp. J. 2019, 25, 820–829. [Google Scholar] [CrossRef]
- Wee, J.W.; Kim, I.; Choi, B.H. Development of mechanochemical degradation induced slow crack growth model for high density polyethylene in cracked round bar specimen. J. Mech. Sci. Technol. 2023, 37, 719–726. [Google Scholar] [CrossRef]
- ASTM D7791-12; Standard Test Method for Uniaxial Fatigue Properties of Plastics, D20.10. ASTM International: West Conshohocken, PA, USA, 2015.
- Forster, A.M. Materials Testing Standards for Additive Manufacturing of Polymer Materials: State of the Art and Standards Applicability, National Institute of Standards and Technology, US Department of Commerce, Interagency Report, NISTR 8059, May 2015. Available online: https://nvlpubs.nist.gov/nistpubs/ir/2015/NIST.IR.8059.pdf (accessed on 25 March 2024).
- Forman, R.G.; Mettu, S.R. Behavior of Surface and Corner Cracks Subjected to Tensile and Bending Loads in Ti-6Al-4V Alloy. Fracture Mechanics 22nd Symposium; ASTM STP 1131; Ernst, H.A., Saxena, A., McDowell, D.L., Eds.; American Society for Testing and Materials: Philadelphia, PA, USA, 1992; Volume 1. [Google Scholar]
- Elber, W. Fatigue crack cyclic closure tension under cyclic tension. Eng. Fract. Mech. 1970, 2, 37–45. [Google Scholar]
- Elber, W. The Significance of Crack Closure; ASTM International: West Conshohocken, PA, USA, 1971; Volume 486, pp. 230–242. [Google Scholar]
- Newman, J.C., Jr. A Crack-Closure Model for Predicting Fatigue Crack Growth under Aircraft Spectrum Loading; ASTM International: West Conshohocken, PA, USA, 1981; pp. 53–84. [Google Scholar]
- Paris, P.C.; Lados, D.; Tada, H. Reflections on identifying the real ΔK effective in the threshold region and beyond. Eng. Fract. Mech. 2008, 75, 299–305. [Google Scholar] [CrossRef]
- Kujawski, D. Enhanced model of partial crack closure for correlation of R-ratio effects in aluminium alloys. Int. J. Fatigue 2001, 23, 95–102. [Google Scholar] [CrossRef]
- Ribeiro, V.; Correia, J.; Lesiuk, G.; Gonçalves, A.; De Jesus, A.; Berto, F. Application and discussion of various crack closure models to predict fatigue crack growth in 6061-T651 aluminium alloy. Int. J. Fatigue 2021, 153, 106472. [Google Scholar] [CrossRef]
- Schijve, J. Some formulas for the crack opening stress level. Eng. Fract. Mech. 1981, 14, 461–465. [Google Scholar] [CrossRef]
- Virkler, D.A.; Hillberry, B.M.; Goel, P.K. The statistical nature of fatigue crack propagation. Trans. ASME 1979, 101, 148–153. [Google Scholar] [CrossRef]
- NASA-HDBK-5010. Fracture Control Handbook For Payloads, Experiments, And Similar Hardware, May 2005, Revalidated 2012. Available online: https://standards.nasa.gov/standard/nasa/nasa-hdbk-5010 (accessed on 8 April 2024).
- ASTM E647-15e1; Standard Test Method for Measurement of Fatigue Crack Growth Rates. ASTM International: West Conshohocken, PA, USA, 2015.
- Main, B.; Jones, M.; Barter, S. The practical need for short fatigue crack growth rate models. Int. J. Fatigue 2021, 142, 105980. [Google Scholar] [CrossRef]
- Molent, L.; Dixon, B. Air frame metal fatigue revisited. Int. J. Fatigue 2020, 131, 105323. [Google Scholar] [CrossRef]
- Manning, S.D.; Garver, W.R.; Henslee, S.P.; Norris, J.W.; Pendley, B.J.; Speaker, S.M.; Smith, V.D.; Yee, B.G.W.; Shinozuka, M.; Yang, Y.N. Durability Methods Development, Volume I—Phase I, AFFDL-TR-79.-3118. 1979. Available online: http://www.dtic.mil/dtic/tr/fulltext/u2/a087301.pdf (accessed on 8 April 2024).
- Jones, R.; Huang, P.; Peng, D. Crack growth from naturally occurring material discontinuities under constant amplitude and operational load. Int. J. Fatigue 2016, 91, 434–444. [Google Scholar] [CrossRef]
- Peng, D.; Champagne, V.K.; Ang, A.S.M.; Birt, A.; Michelson, A.; Pinches, S.; Jones, R. Computing the durability of WAAM 18Ni-250 maraging steel specimens with surface breaking porosity. Crystals 2023, 13, 443. [Google Scholar] [CrossRef]
- Jones, R. Fatigue crack growth and damage tolerance. Fatigue Fract. Eng. Mater. Struct. 2014, 37, 463–483. [Google Scholar] [CrossRef]
- Molent, L. Aircraft Fatigue Management; Springer Briefs in Applied Sciences and Technology; Springer Nature Singapore Pte Ltd.: Singapore, 2023; ISBN 978-981-99-7467-2, ISBN 978-981-99-7468-9 (eBook). [Google Scholar] [CrossRef]
- Wanhill, R.; Barter, S.; Molent, L. Fatigue Crack Growth Failure and Lifing Analyses for Metallic Aircraft Structures and Components; Springer Briefs in Applied Sciences and Technology; Springer Nature Singapore Pte Ltd.: Singapore, 2019; ISBN 978-94-024-1673-2I, ISBN 978-94-024-1675-6 (eBook). [Google Scholar] [CrossRef]
- Berens, A.P.; Hovey, P.W.; Skinn, D.A. Risk Analysis for Aging Aircraft Fleets-Volume 1: Analysis, WL-TR-91-3066, Flight Dynamics Directorate, Wright Laboratory, Air Force Systems Command, Wright-Patterson Air Force Base. October 1991. Available online: https://apps.dtic.mil/sti/pdfs/ADA252000.pdf (accessed on 2 April 2024).
- Main, B.; Molent, L.; Singh, R.; Barter, S. Fatigue crack growth lessons from thirty-five years of the Royal Australian Air Force F/A-18A/B Hornet Aircraft Structural Integrity Program. Int. J. Fatigue 2020, 133, 105426. [Google Scholar] [CrossRef]
- Peng, D.; Jones, R.; Ang, A.S.M.; Michelson, A.; Champagne, V.; Birt, A.; Pinches, S.; Kundu, S.; Alankar, A.; Singh Raman, R.K. Computing the durability of WAAM 18Ni 250 Maraging steel specimens. Fatigue Fract. Eng. Mater. Struct. 2022, 45, 3535–3545. [Google Scholar] [CrossRef]
- Ye, J.; Syed, A.K.; Zhang, X.; Eimer, E.; Williams, S. Fatigue crack growth behaviour in an aluminium alloy Al-Mg-0.3Sc produced by wire based directed energy deposition process. Fatigue Fract. Eng. Mater. Struct. 2023, 46, 3927–3938. [Google Scholar]
- Jones, R.; Singh Raman, R.K.; McMillan, A.J. Crack growth: Does microstructure play a role? Eng. Fract. Mech. 2015, 187, 190–210. [Google Scholar] [CrossRef]
- Wanhill, R.J.H.; Stanzl-Tschegg, S.E. Short/small fatigue crack growth, thresholds and environmental effects: A tale of two engineering paradigms. Corros. Rev. 2021, 39, 165–175. [Google Scholar] [CrossRef]
- Main, B.; Evans, R.; Walker, K.; Yu, X.; Molent, L. Lessons from a fatigue prediction challenge for an aircraft wing shear tie post. Int. J. Fatigue 2019, 123, 53–65. [Google Scholar] [CrossRef]
- Tan, J.L.; Chen, B.K. Prediction of fatigue life in aluminum alloy (AA7050-T7451) structures in the presence of multiple artificial short cracks. Theor. Appl. Fract. Mech. 2015, 78, 1–7. [Google Scholar] [CrossRef]
- Tan, J.L.; Chen, B.K. A new fracture area method for predicting the growth of a newly coalesced crack in AA7050-T7451 aluminium alloy. Theor. Appl. Fract. Mech. 2015, 75, 146–150. [Google Scholar] [CrossRef]
- Godefroid, L.B.; Moreira, L.P.; Vilela, T.C.G.; Faria, G.L.; Candido, L.C.; Pinto, E.S. Effect of chemical composition and microstructure on the fatigue crack growth resistance of pearlitic steels for railroad application. Int. J. Fatigue 2019, 120, 241–253. [Google Scholar] [CrossRef]
- Han, S.; Dung Dinh, T.; De Baere, I.; Boone, M.; Josipovic, I.; Van Paepegem, W. Study of the effect of defects on fatigue life prediction of additive manufactured Ti-6Al-4V by combined use of micro-computed tomography and fracture-mechanics-based simulation. Int. J. Fatigue 2024, 180, 108110. [Google Scholar] [CrossRef]
- Shamir, M.; Zhang, X.; Syed, A.K. Characterising and representing small crack growth in an additive manufactured titanium alloy. Eng. Fract. Mech. 2021, 253, 107876. [Google Scholar] [CrossRef]
- Markham, M.J.; Fatemi, A.; Phan, N. Mixed-mode small fatigue crack growth rates and modeling in additively manufactured metals. Int. J. Fatigue 2024, 183, 108258. [Google Scholar] [CrossRef]
- Sanaei, N.; Fatemi, A. Defects in additive manufactured metals and their effect on fatigue performance: A state-of-the-art review. Prog. Mater. Sci. 2021, 117, 100724. [Google Scholar] [CrossRef]
- Dastgerdi, J.N.; Jaberi, O.; Remes, H.; Lehto, P.; Toudeshky, H.H.; Kuva, J. Fatigue damage process of additively manufactured 316 L steel using X-ray computed tomography imaging. Addit. Manuf. 2023, 70, 103559. [Google Scholar] [CrossRef]
- Jones, R.; Cizek, J.; Kovarik, O.; Ang, A.; Champagne, V. Observations on comparable aluminium alloy crack growth curves: Additively manufactured Scalmalloy® as an alternative to AA5754 and AA6061-T6 alloys. Addit. Manuf. Lett. 2022, 2, 100026. [Google Scholar] [CrossRef]
- Khudiakova, A.; Brunner, A.J.; Wolfahrt, M.; Pinter, G. Quantification approaches for fatigue crack resistance of thermoplastic tape layered composites with multiple delaminations. Materials 2021, 14, 1476. [Google Scholar] [CrossRef] [PubMed]
- Riedl, G.; Pugstaller, R.; Wallner, G.M. Development and implementation of a simultaneous fatigue crack growth test setup for polymeric hybrid laminates. Eng. Fract. Mech. 2022, 267, 108468. [Google Scholar] [CrossRef]
- Simon, I.; Banks-Sills, L.; Fourman, V. Mode I delamination propagation and R-ratio effects in woven DCB specimens for a multi-directional layup. Int. J. Fatigue 2017, 96, 237–251. [Google Scholar] [CrossRef]
- Arhant, M.; Lolive, E.; Bonnemains, T.; Davies, P. Effect of aging on the fatigue crack growth properties of carbon-polyamide 6 thermoplastic composites using the multi ΔG-control method. Compos. Part A Appl. Sci. Manuf. 2022, 161, 107105. [Google Scholar] [CrossRef]
- Michel, S.; Murphy, N.; Kinloch, A.J.; Jones, R. On cyclic-fatigue crack growth in carbon-fibre-reinforced epoxy-polymer composites. Polymers 2024, 16, 435. [Google Scholar] [CrossRef] [PubMed]
- Jones, R.; Peng, D.; Sing Raman, R.K.; Kinloch, A.J.; Michopoulos, J. Thoughts on two approaches for accounting for the scatter in fatigue delamination growth curves. Compos. Struct. 2021, 258, 113175. [Google Scholar] [CrossRef]
- Jones, R.; Kinloch, A.J.; Michopoulos, J.; Iliopoulos, A.P. Crack growth in adhesives: Similitude and the Hartman-Schijve equation. Compos. Struct. 2021, 273, 114260. [Google Scholar] [CrossRef]
- Jones, R.; Hu, W.; Kinloch, A.J. A convenient way to represent fatigue crack growth in structural adhesives. Fatigue Fract. Eng. Mater. Struct. 2015, 38, 379–391. [Google Scholar] [CrossRef]
- Kinloch, A.J.; Jones, R.; Michopoulos, J.G. Fatigue crack growth in epoxy polymer nanocomposites. Philos. Trans. A R. Soc. 2020, A379, 20200436. [Google Scholar] [CrossRef] [PubMed]
- Cano, A.J.; Salazar, A.; Rodríguez, J. Evaluation of different crack driving forces for describing the fatigue crack growth behaviour of PET-G. Int. J. Fatigue 2018, 107, 27–32. [Google Scholar] [CrossRef]
- Kovarik, O.; Cizek, J.; Klecka, J. Fatigue crack growth rate description of rf-plasma-sprayed refractory metals and alloys. Materials 2023, 16, 1713. [Google Scholar] [CrossRef]
- Available online: https://zentech.co.uk/ (accessed on 8 February 2024).
- Jones, R.; Chandwani, R.; Timbrell, C.; Kinloch, A.J.; Peng, D. Thoughts on the importance of similitude and multi-axial loads when assessing the durability and damage tolerance of adhesively-bonded doublers and repairs. Aerospace 2023, 10, 946. [Google Scholar] [CrossRef]
- Schönbauer, B.M.; Stanzl-Tschegg, S.E.; Perlega, A.; Salzman, R.N.; Rieger, N.F.; Turnbull, A.; Zhou, S.; Lukaszewicz, M.; Gandy, D. The influence of corrosion pits on the fatigue life of 17-4PH steam turbine blade steel. Eng. Fract. Mech. 2015, 147, 158–175. [Google Scholar] [CrossRef]
- Jones, R.; Ang, A.; Phan, N.D.; Nicholas, M. On the link between plastic wake induced crack closure and the fatigue threshold. Metals 2024, 14, 523. [Google Scholar] [CrossRef]
- Cerpentier, R.R.J.; Martin van Drongelen, M.; Boerakker, M.J.; Govaert, L.E. Influence of electron-beam irradiation on plasticity-controlled and crack-growth-controlled failure in high-density polyethylene. J. Polym. Sci. 2022, 60, 701–714. [Google Scholar] [CrossRef]
- Cerpentier, R.R.J.; van Vliet, T.; Pastukhov, L.V.; van Drongelen, M.; Boerakker, M.J.; Tervoort, T.A.; Govaert, L.E. Fatigue crack propagation of High-Density Polyethylene homopolymers: Influence of molecular weight distribution and temperature. Macromolecules 2021, 54, 11508–11521. [Google Scholar] [CrossRef]
- Knöchel, J.; Kropka, M.; Neumeyer, T.; Altstädt, V. Resistance of 3D printed polymer structures against fatigue crack growth, Proceedings IRF2018: 6th International Conference Integrity-Reliability-Failure, Lisbon/Portugal 22–26 July 2018. Editors J.F. Silva Gomes and S.A. Meguid, 949-950. Publ. INEGI/FEUP, 2018; ISBN: 978-989-20-8313-1. Available online: https://fe.up.pt/irf/Proceedings_IRF2018/data/Papers.htm (accessed on 20 March 2024).
- Available online: https://www.youtube.com/watch?v=eqlrM86uCdM&ab_channel=ARBURGofficial (accessed on 8 April 2024).
- Schwalbe, K.H. On the beauty of analytical models for fatigue crack propagation and fracture. A personal historical review. J. ASTM Int. 2010, 7, 3–73. [Google Scholar] [CrossRef]
- Naderi, M.; Amiri, M.; Khonsari, M.M. On the thermodynamic entropy of fatigue fracture. Proc. R. Soc. A 2010, 466, 423–438. [Google Scholar] [CrossRef]
- Basaran, C. Entropy based fatigue, fracture, failure prediction and structural health monitoring. Entropy 2020, 22, 1178. [Google Scholar] [CrossRef]
- Mozafari, F.; Thamburaja, P.; Moslemi, N.; Srinivasa, A. Finite-element simulation of multi-axial fatigue loading in metals based on a novel experimentally-validated microplastic hysteresis-tracking method. Finite Elem. Anal. Des. 2021, 187, 103481. [Google Scholar] [CrossRef]
Disclaimer/Publisher’s Note: The statements, opinions and data contained in all publications are solely those of the individual author(s) and contributor(s) and not of MDPI and/or the editor(s). MDPI and/or the editor(s) disclaim responsibility for any injury to people or property resulting from any ideas, methods, instructions or products referred to in the content. |
© 2024 by the authors. Licensee MDPI, Basel, Switzerland. This article is an open access article distributed under the terms and conditions of the Creative Commons Attribution (CC BY) license (https://creativecommons.org/licenses/by/4.0/).