
Waste-Derived High-Density Polyethylene-Glass Composites: A Pathway to Sustainable Structural Materials

 ,
, 
Abstract
1. Introduction
2. Materials and Methods
2.1. Materials
2.2. Manufacturing Method Optimisation
2.3. Mix Design Optimisation
2.4. Composite Preparation
2.5. Testing Methods
3. Results
3.1. Optimising Manufacturing Method
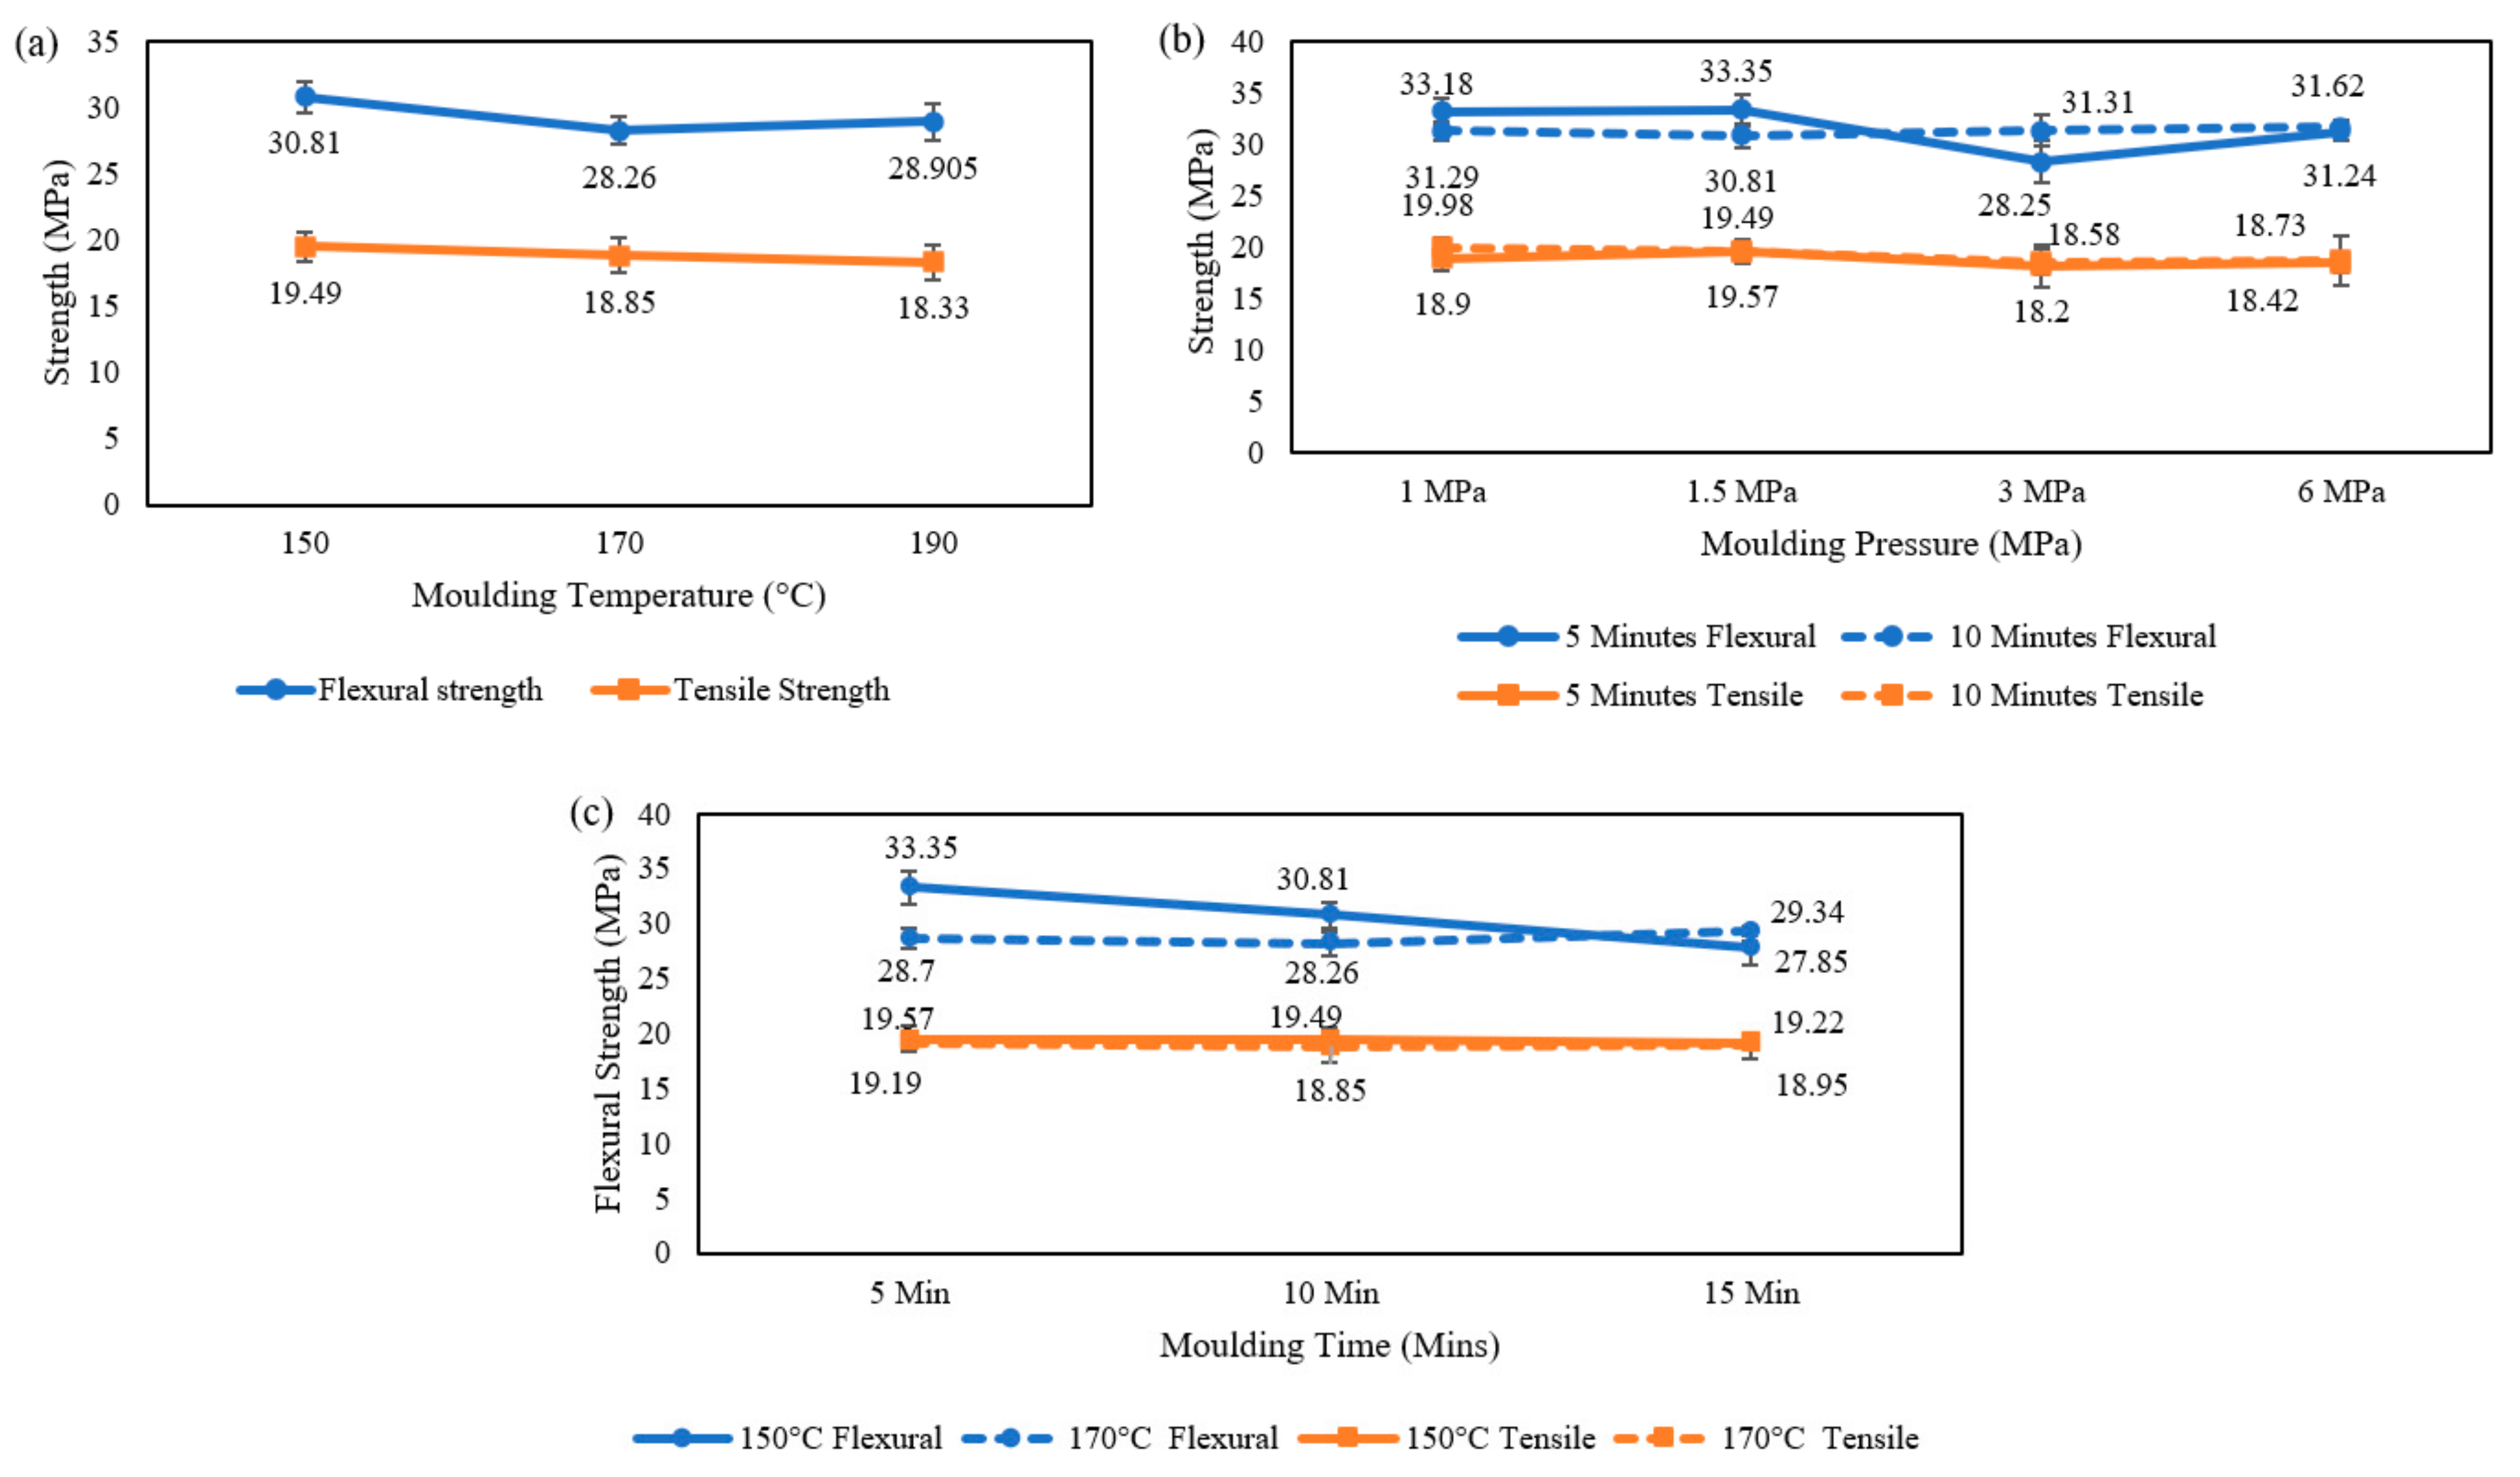
3.1.1. Moulding Temperature
3.1.2. Moulding Pressure
3.1.3. Moulding Time
3.2. Optimising Mix Proportions
3.2.1. Glass Percentage
3.2.2. Glass Particle Size
3.2.3. Compatibiliser
3.3. Statistical Analysis
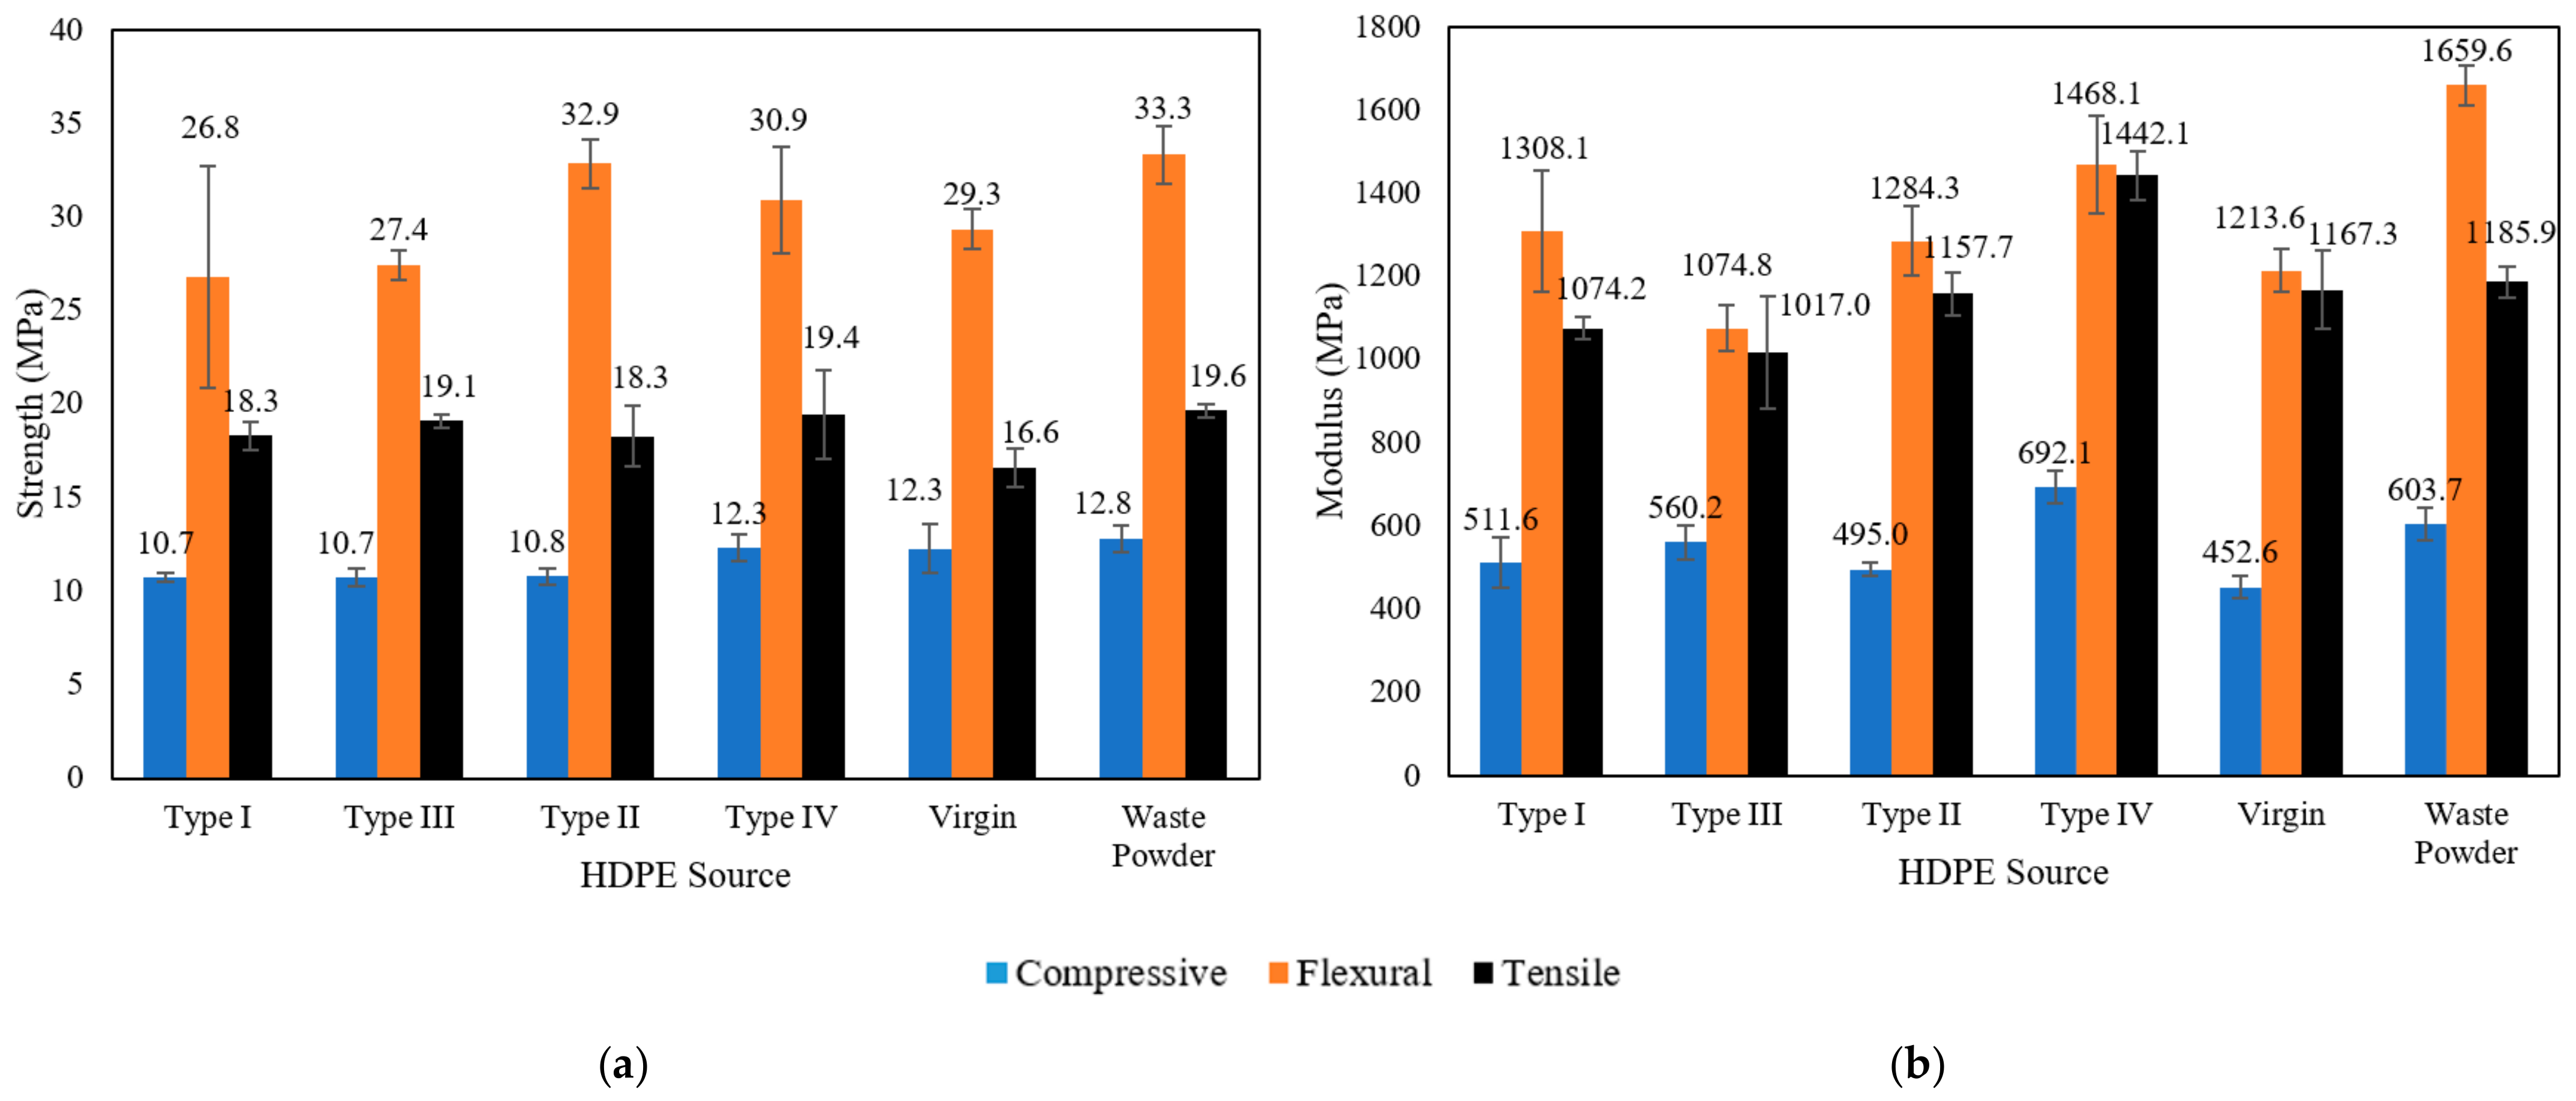
3.4. Waste Source Feasibility Assessment
4. Discussion
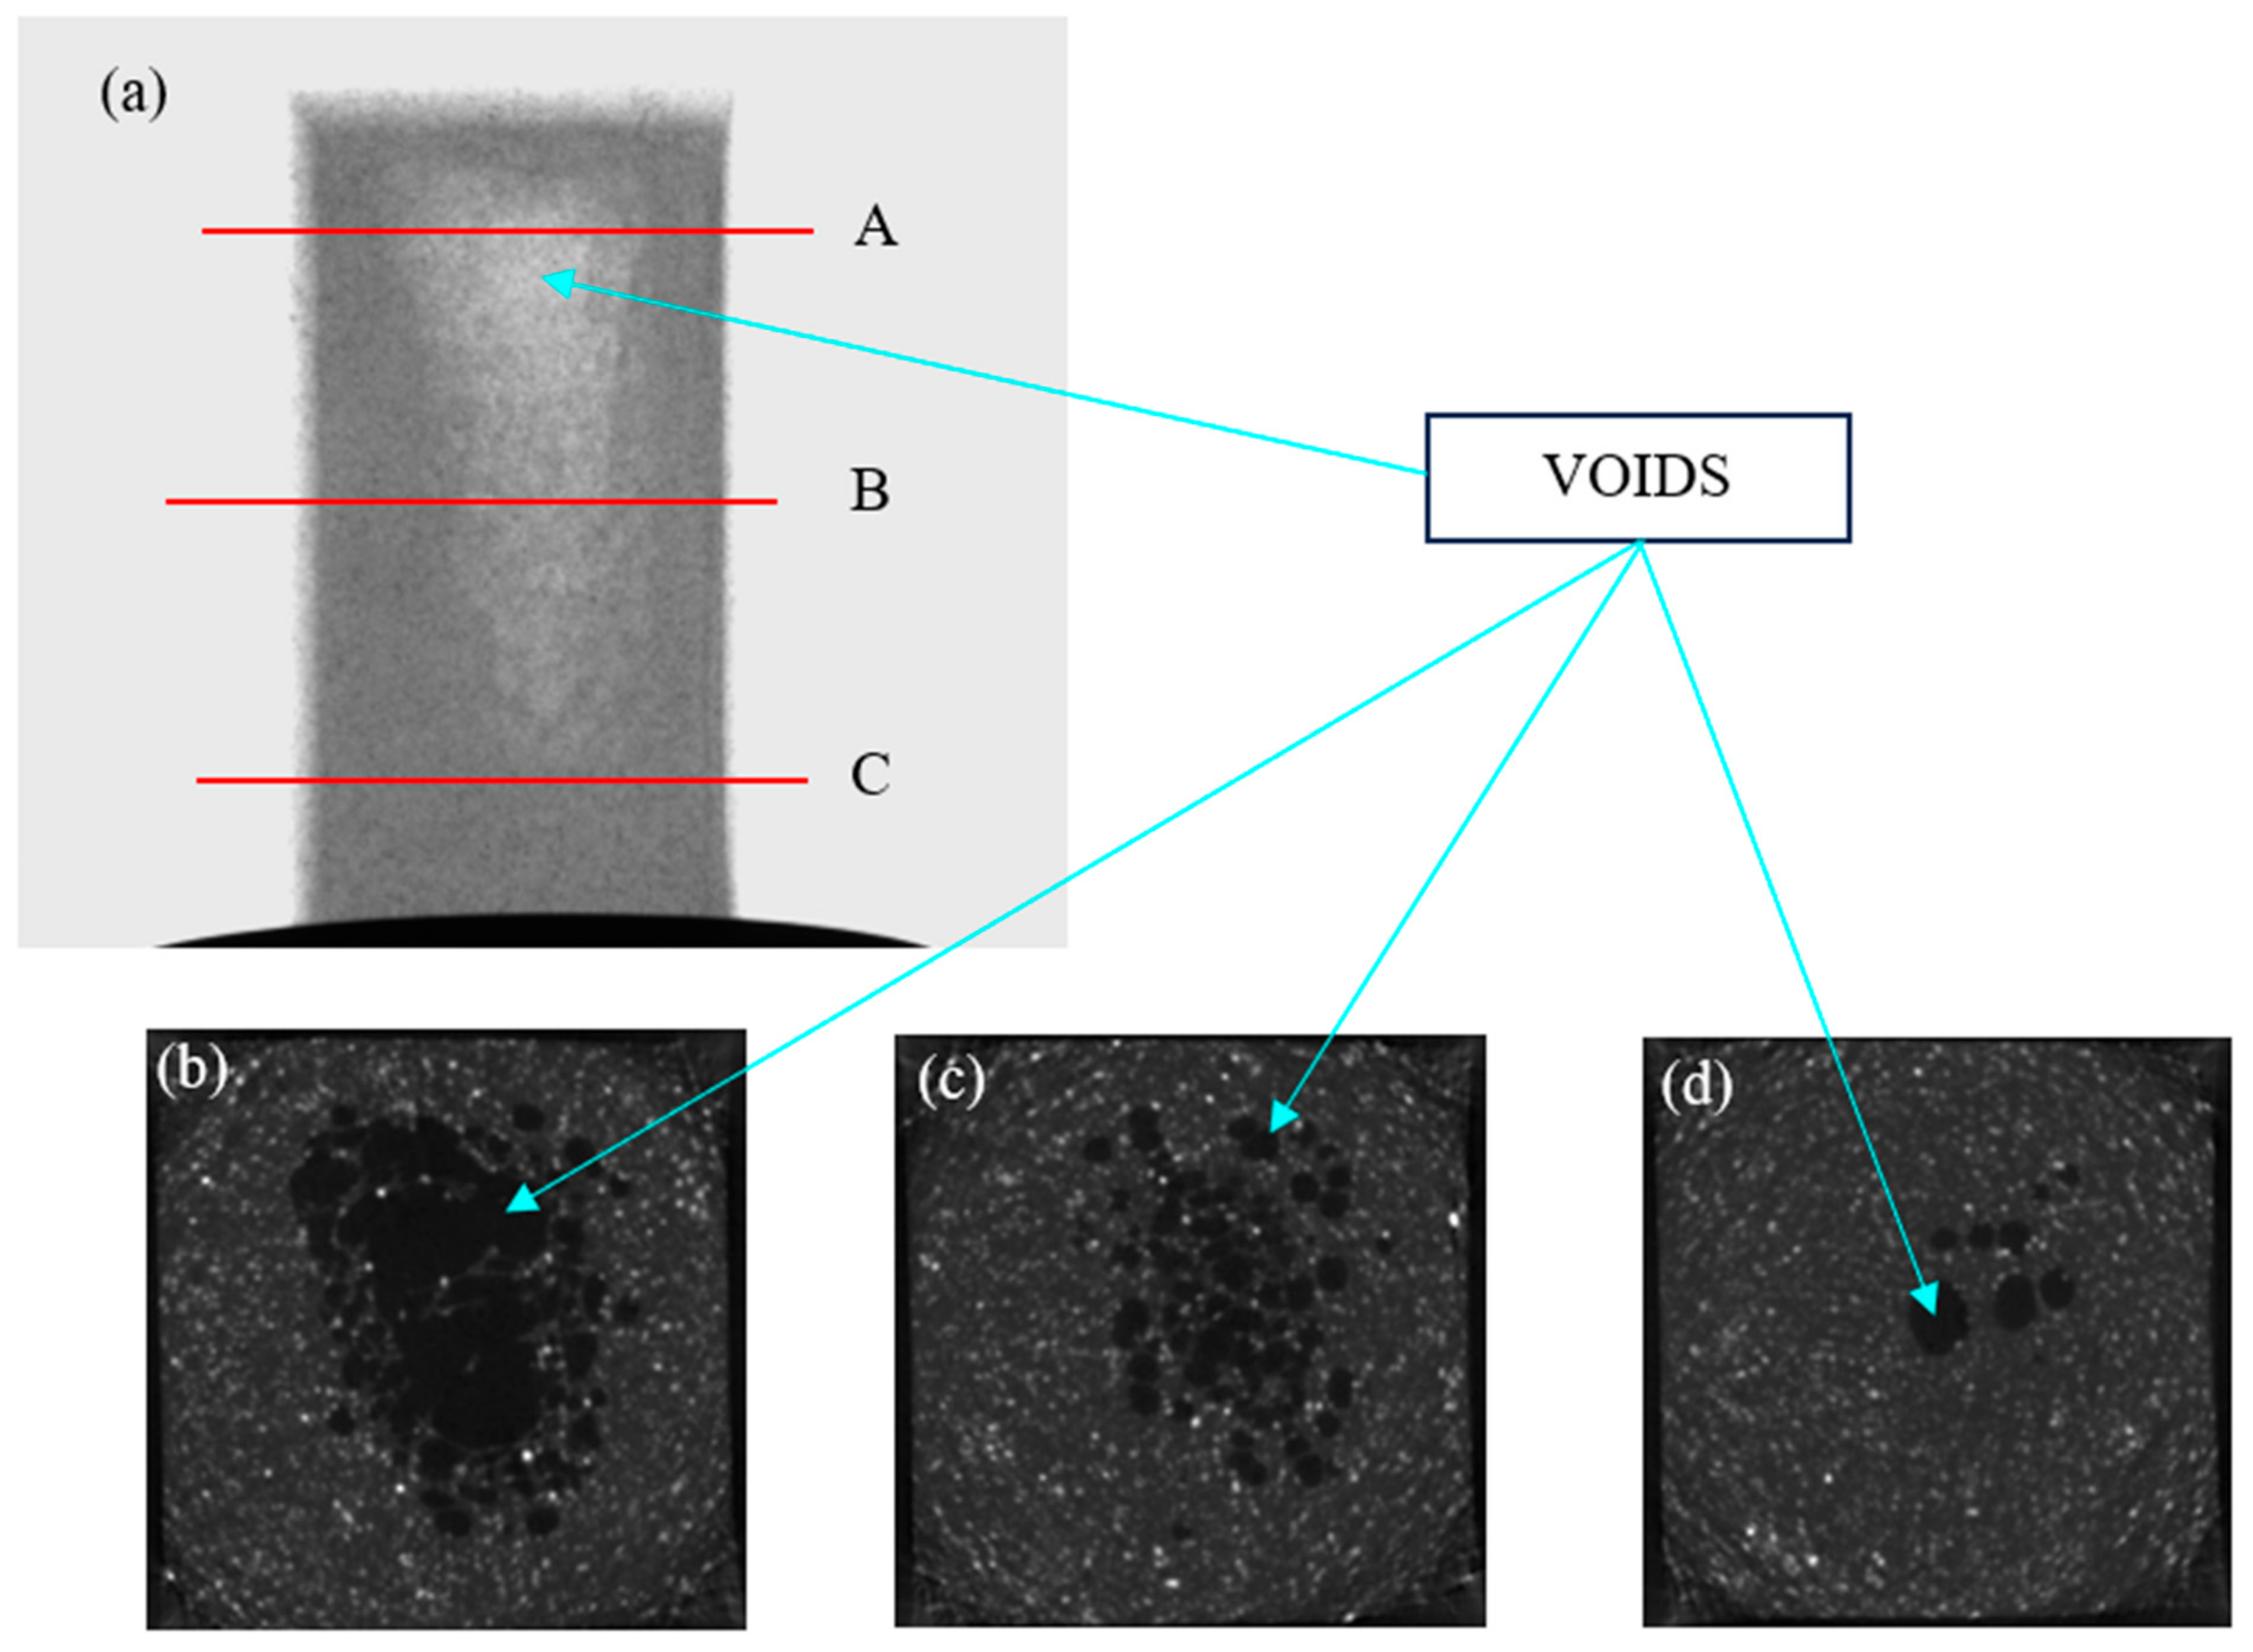
4.1. Microstructure and Pore Structure
4.2. Chemistry Analysis
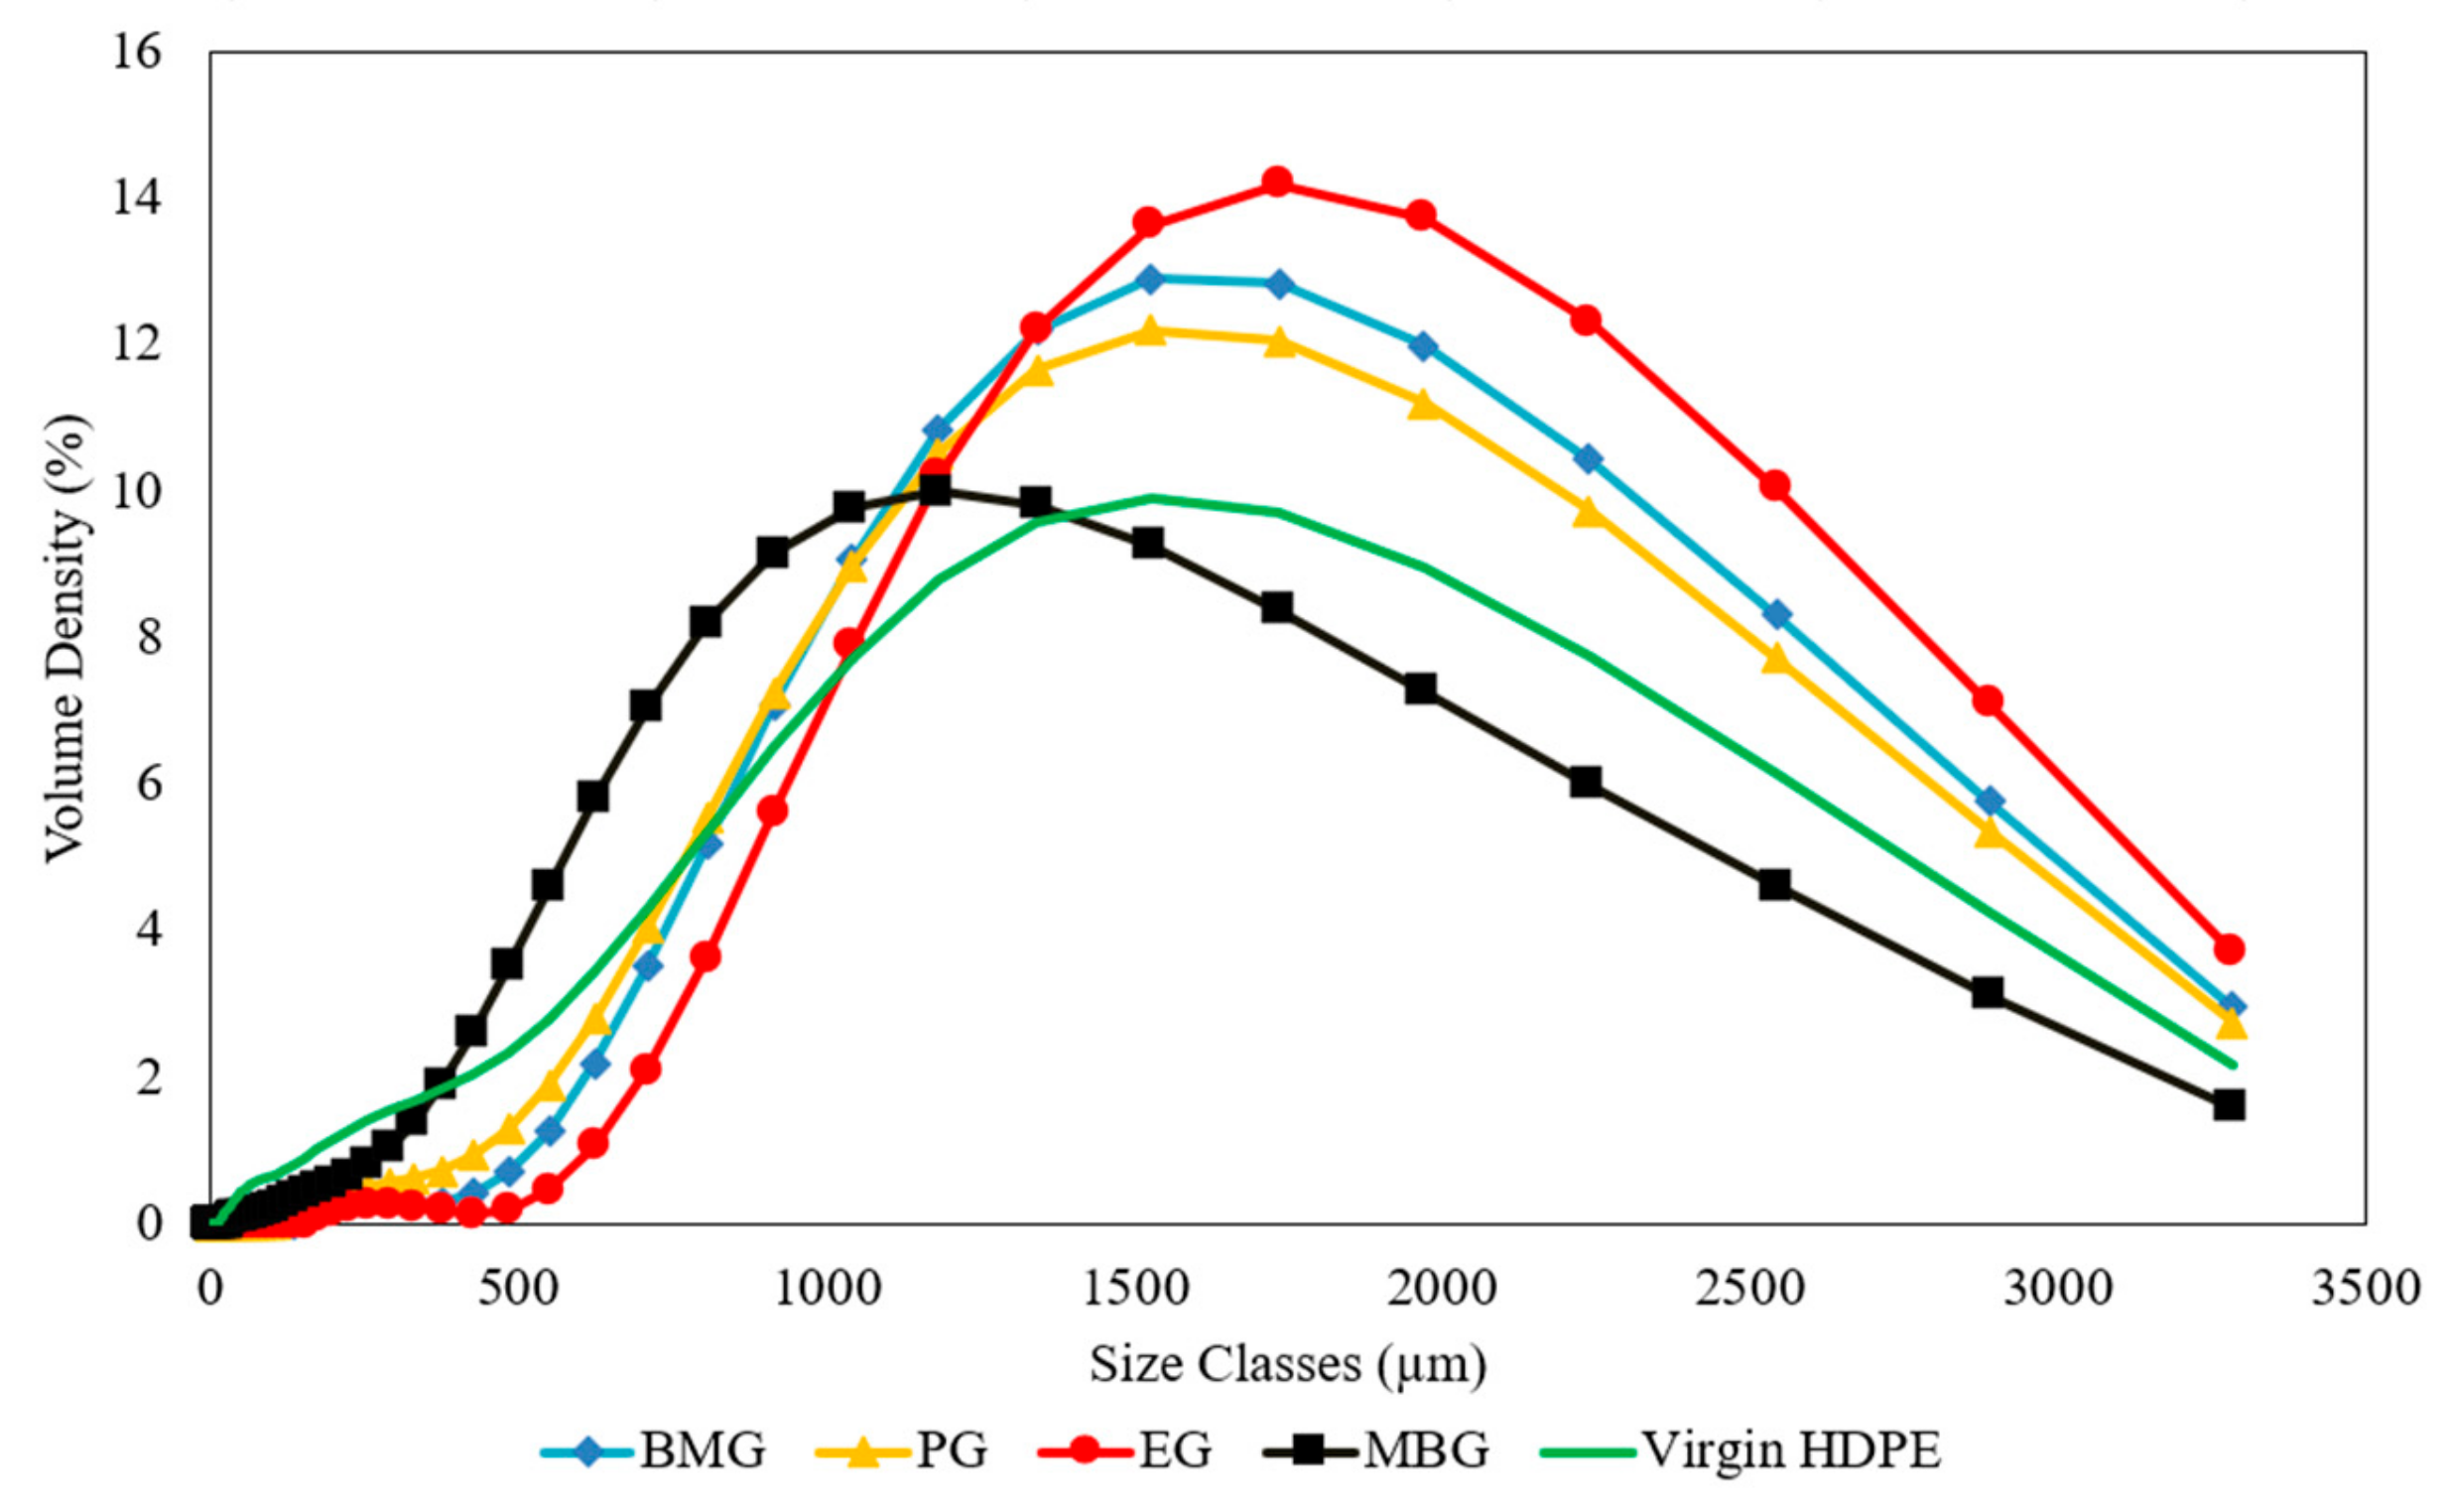
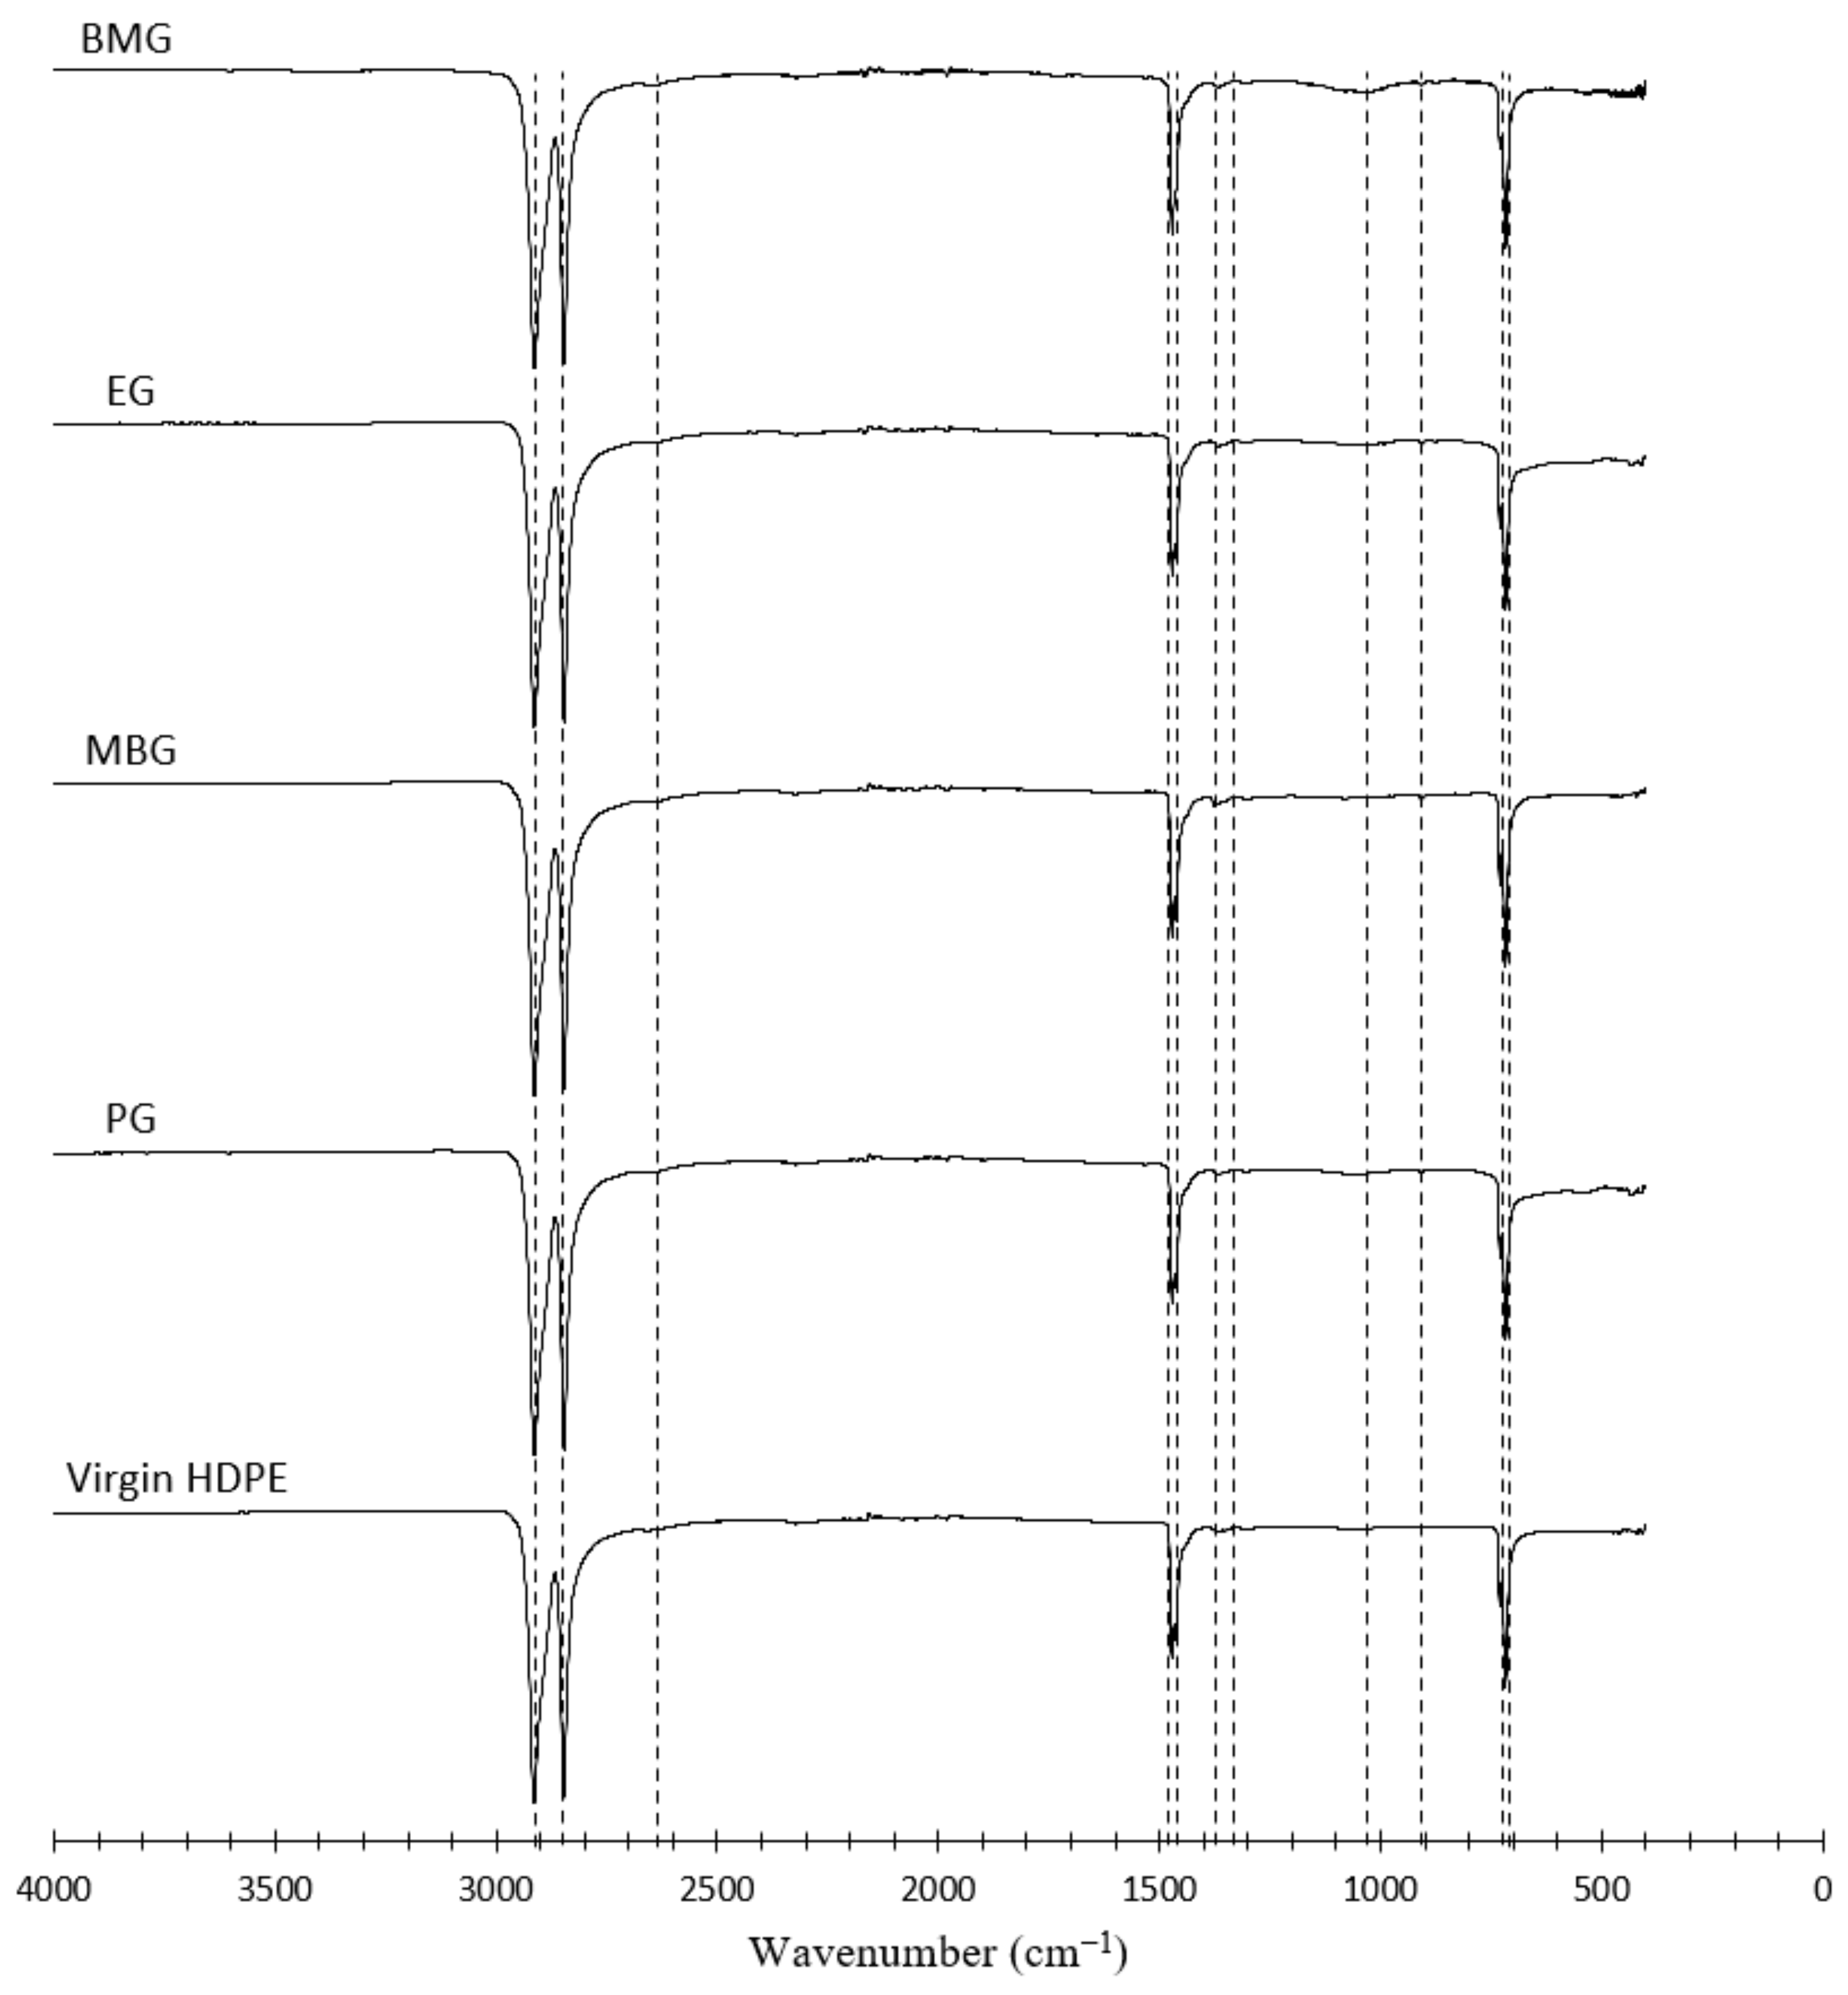
4.2.1. Waste HDPE Sources
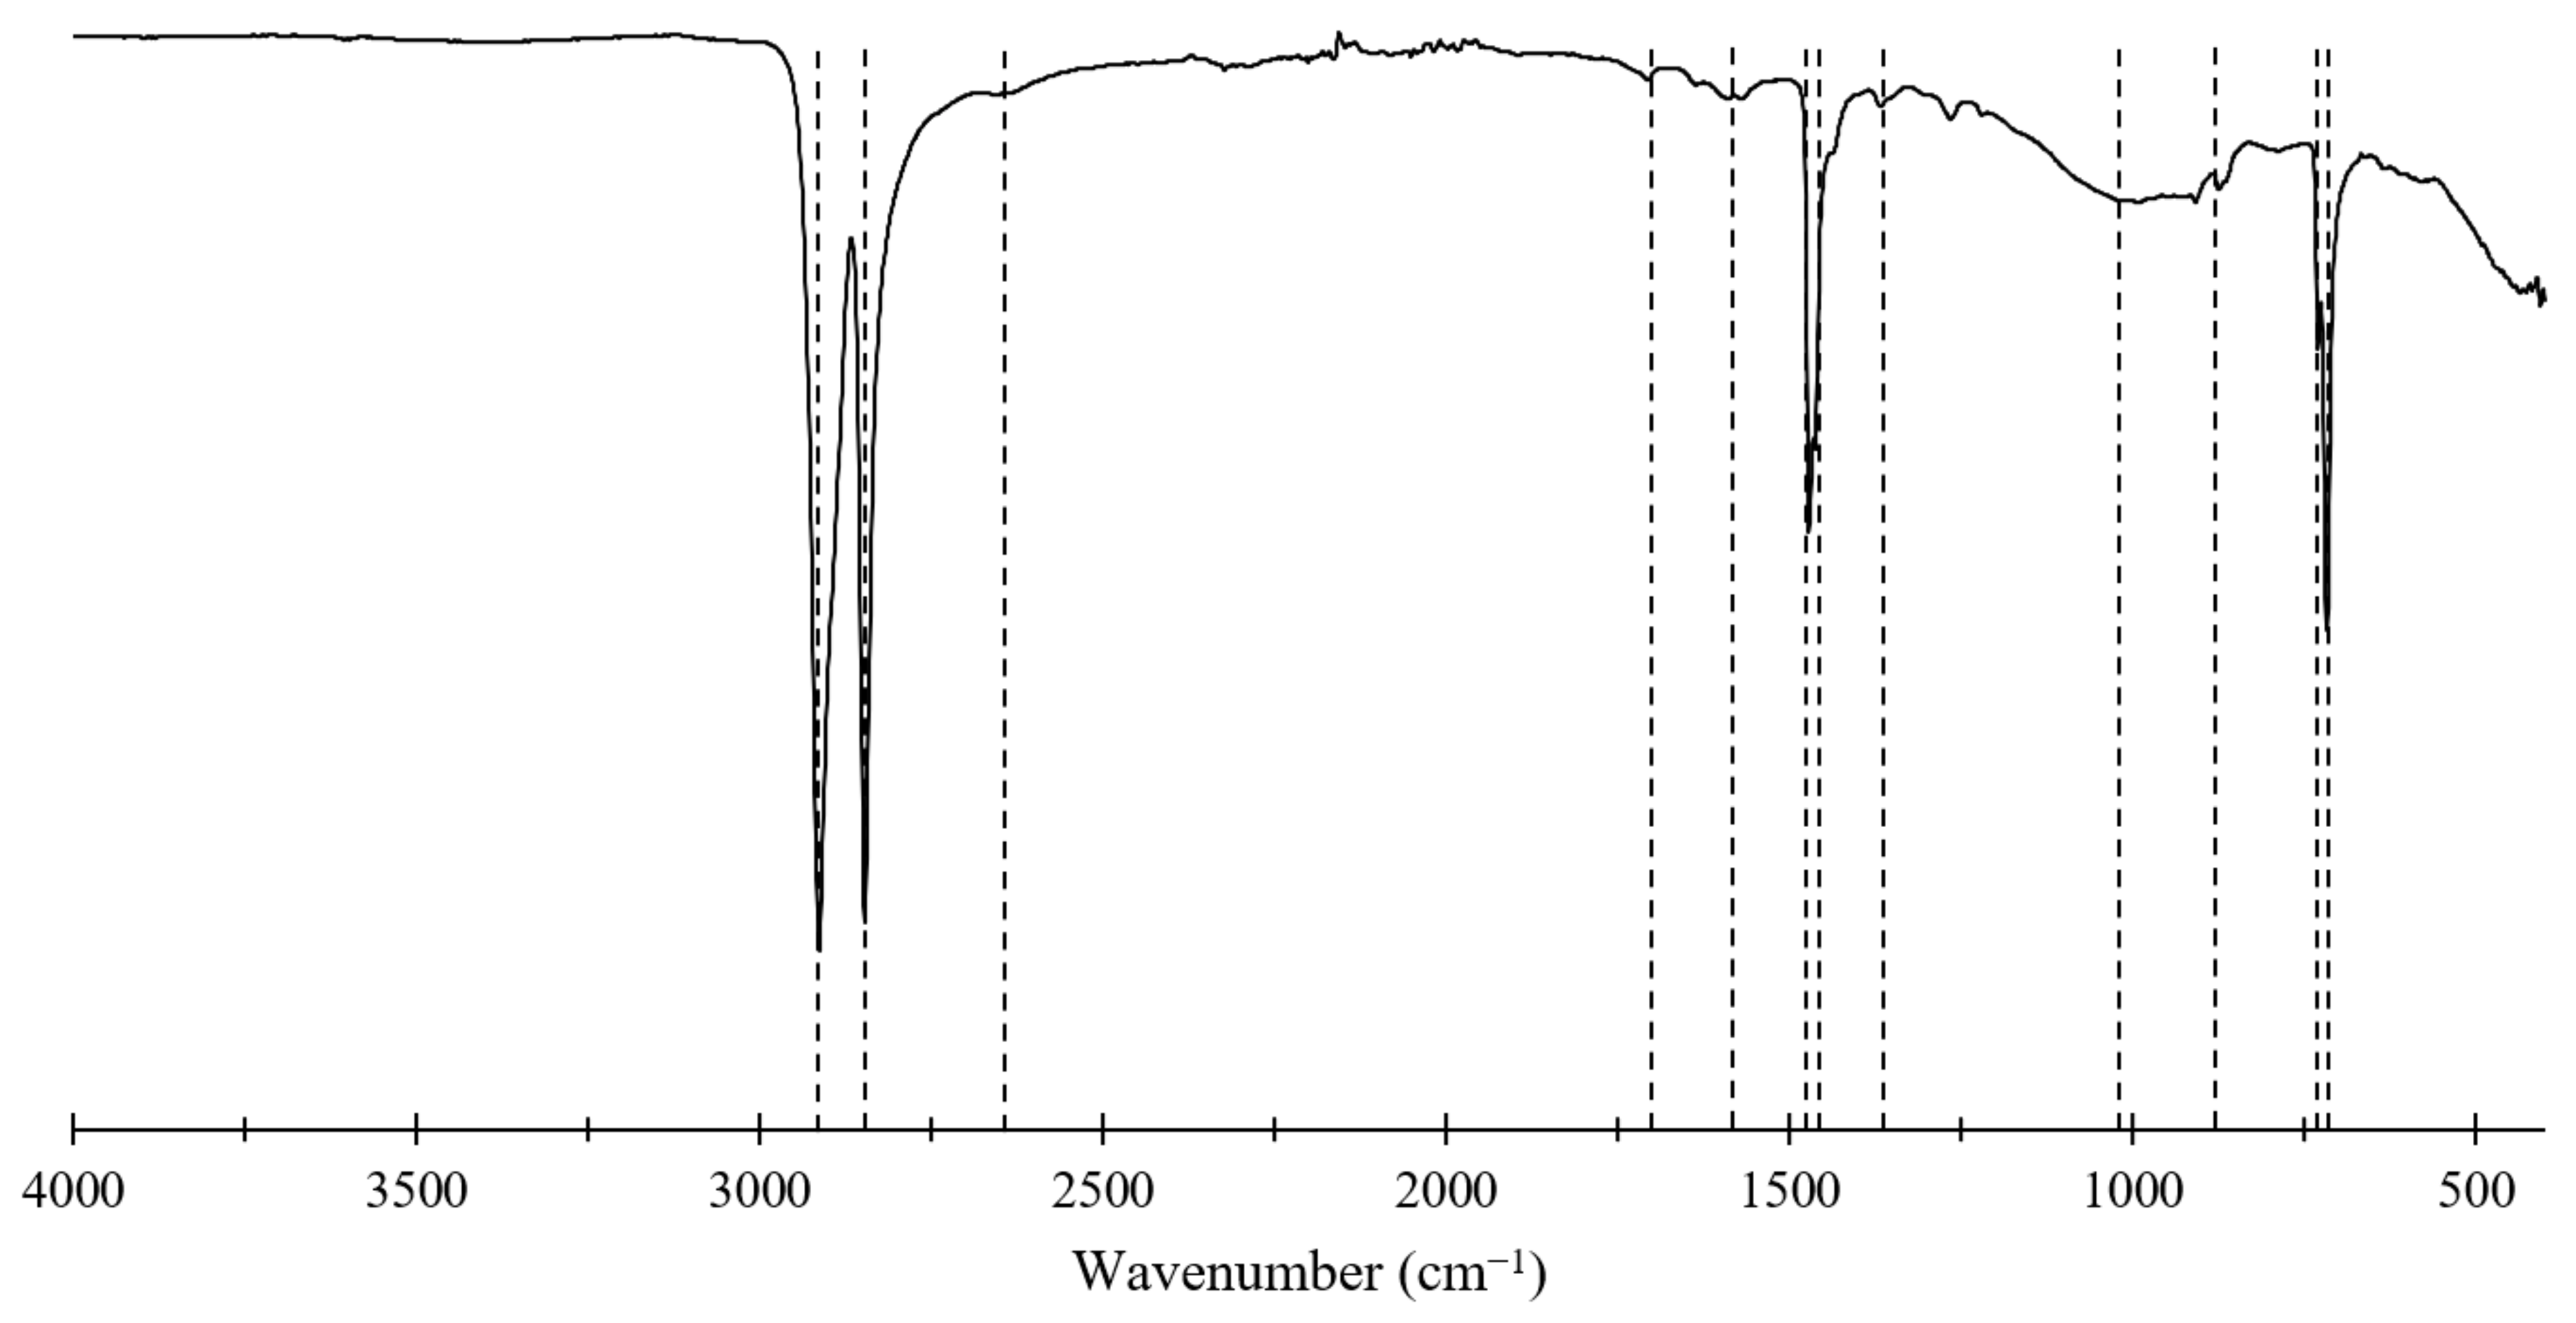
4.2.2. HDPE–Glass Composites
5. Conclusions
Author Contributions
Funding
Institutional Review Board Statement
Data Availability Statement
Acknowledgments
Conflicts of Interest
References
- Geyer, R.; Jambeck, J.R.; Law, K.L. Production, use, and fate of all plastics ever made. Sci. Adv. 2017, 3, e1700782. [Google Scholar] [CrossRef] [PubMed]
- Plastics Europe. Plastics—The Facts 2022. Available online: https://plasticseurope.org/knowledge-hub/plastics-the-facts-2022/ (accessed on 7 September 2024).
- UNEP. Single-Use Plastics—A Roadmap for Sustainability; UNEP: Nairobi, Kenya, 2018; Available online: https://wedocs.unep.org/bitstream/handle/20.500.11822/25496/singleUsePlastic_sustainability.pdf?sequence=1&isAllowed=y (accessed on 28 July 2024).
- Heredia-Guerrero, J.A.; Benítez, J.J.; Porras-Vázquez, J.M.; Tedeschi, G.; Morales, Y.; Fernández-Ortuño, D.; Athanassiou, A.; Guzman-Puyol, S. Plasticized, greaseproof chitin bioplastics with high transparency and biodegradability. Food Hydrocoll. 2023, 145, 109072. [Google Scholar] [CrossRef]
- Ninan, N.; Pidhatika, B.; Bright, R.; Kartika, B.M.; Rudianto, R.P.; Swasono, Y.A.; Ardhani, R.; Vasilev, K. Advancing sustainable technologies: Plasma-engineered bioplastics with silver nanoparticle integration. J. Mater. Sci. 2024, 59, 9003–9020. [Google Scholar] [CrossRef]
- Loukodimou, A.; Lovell, C.; Li, T.; Theodosopoulos, G.; Maniam, K.K.; Paul, S. Formulation and Characterization of Deep Eutectic Solvents and Potential Application in Recycling Packaging Laminates. Polymers 2024, 16, 2781. [Google Scholar] [CrossRef]
- Pickin, J.; Wardle, C.; O’Farrell, K.; Stovell, L.; Nyunt, P.; Guazzo, S.; Lin, Y.; Caggiati-Shortell, G.; Chakma, P.; Edwards, C.; et al. National Waste Report 2022; The Department of Climate Change, Energy, the Environment and Water: Canbera, Australia, 2022. Available online: https://www.dcceew.gov.au/sites/default/files/documents/national-waste-report-2022.pdf (accessed on 12 June 2024).
- O’Farrell, K.; Harney, F.; Stovell, L. Australian Plastics Flows and Fates Study 2020-21—National Report; The Department of Climate Change, Energy, the Environment and Water: Canbera, Australia, 2022. Available online: https://www.dcceew.gov.au/sites/default/files/documents/apff-national-report-2020-21.pdf (accessed on 11 March 2024).
- Ferdous, W.; Manalo, A.; Siddique, R.; Mendis, P.; Zhuge, Y.; Wong, H.S.; Lokuge, W.; Aravinthan, T.; Schubel, P. Recycling of landfill wastes (tyres, plastics and glass) in construction—A review on global waste generation, performance, application and future opportunities. Resour. Conserv. Recycl. 2021, 173, 105745. [Google Scholar] [CrossRef]
- Allan, P. Assessment of Australian Recycling Infrastructure—Glass Packaging; The Department of Climate Change, Energy, the Environment and Water: Canberra, Australia, 2019. Available online: https://www.dcceew.gov.au/sites/default/files/documents/assessment-australian-recycling-infrastructure-glass-packaging.pdf (accessed on 15 May 2024).
- Robert, D.; Baez, E.; Setunge, S. A new technology of transforming recycled glass waste to construction components. Constr. Build. Mater. 2021, 313, 125539. [Google Scholar] [CrossRef]
- Wang, T.; Nicolas, R.S.; Kashani, A.; Ngo, T. Sustainable utilisation of low-grade and contaminated waste glass fines as a partial sand replacement in structural concrete. Case Stud. Constr. Mater. 2022, 16, e00794. [Google Scholar] [CrossRef]
- Lingappa, J.M. Mechanical characterization of glass microballoon filled HDPE syntactic foams. AIP Conf. Proc. 2020, 2236, 040020. [Google Scholar] [CrossRef]
- Singh, A.K.; Deptula, A.J.; Anawal, R.; Doddamani, M.; Gupta, N. Additive Manufacturing of Three-Phase Syntactic Foams Containing Glass Microballoons and Air Pores. JOM 2019, 71, 1520–1527. [Google Scholar] [CrossRef]
- Bharath Kumar, B.R.; Doddamani, M.; Zeltmann, S.E.; Gupta, N.; Uzma; Gurupadu, S.; Sailaja, R.R.N. Effect of particle surface treatment and blending method on flexural properties of injection-molded cenosphere/HDPE syntactic foams. J. Mater. Sci. 2016, 51, 3793–3805. [Google Scholar] [CrossRef]
- Taşdemir, M.; Ersoy, S. Mechanical, morphological and thermal properties of HDPE polymer composites filled with talc, calcium carbonate and glass spheres. Rev. Rom. Mater. 2015, 45, 147–154. [Google Scholar]
- Saeed, U.; Hussain, K.; Rizvi, G. HDPE reinforced with glass fibers: Rheology, tensile properties, stress relaxation, and orientation of fibers. Polym. Compos. 2014, 35, 2159–2169. [Google Scholar] [CrossRef]
- Somnuk, U.; Yanumet, N.; Ellis, J.W.; Grady, B.P.; O’Rear, E.A. Adhesion improvement in glass fiber reinforced polyethylene composite via admicellar polymerization. Polym. Compos. 2003, 24, 171–180. [Google Scholar] [CrossRef]
- Ayadi, A.; Kraiem, D.; Bradai, C.; Pimbert, S. Recycling effect on mechanical behavior of HDPE/glass fibers at low concentrations. J. Thermoplast. Compos. Mater. 2012, 25, 523–536. [Google Scholar] [CrossRef]
- AlMaadeed, M.A.; Ouederni, M.; Noorunnisa Khanam, P. Effect of chain structure on the properties of Glass fibre/polyethylene composites. Mater. Des. 2013, 47, 725–730. [Google Scholar] [CrossRef]
- Sormunen, P.; Kärki, T. Compression molded thermoplastic composites entirely made of recycled materials. Sustainability 2019, 11, 631. [Google Scholar] [CrossRef]
- Patankar, S.N.; Das, A.; Kranov, Y.A. Interface engineering via compatibilization in HDPE composite reinforced with sodium borosilicate hollow glass microspheres. Compos. Part A Appl. Sci. Manuf. 2009, 40, 897–903. [Google Scholar] [CrossRef]
- Patankar, S.N.; Kranov, Y.A. Hollow glass microsphere HDPE composites for low energy sustainability. Mater. Sci. Eng. A 2010, 527, 1361–1366. [Google Scholar] [CrossRef]
- Jayavardhan, M.L.; Bharath Kumar, B.R.; Doddamani, M.; Singh, A.K.; Zeltmann, S.E.; Gupta, N. Development of glass microballoon/HDPE syntactic foams by compression molding. Compos. Part B Eng. 2017, 130, 119–131. [Google Scholar] [CrossRef]
- Alkan, U.; Özcanlı, Y.; Alekberov, V. Effect of temperature and time on mechanical and electrical properties of HDPE/glass fiber composites. Fibers Polym. 2013, 14, 115–120. [Google Scholar] [CrossRef]
- Jeyachandran, P.; Bontha, S.; Bodhak, S.; Balla, V.K.; Kundu, B.; Doddamani, M. Mechanical behaviour of additively manufactured bioactive glass/high density polyethylene composites. J. Mech. Behav. Biomed. Mater. 2020, 108, 103830. [Google Scholar] [CrossRef] [PubMed]
- Jeyachandran, P.; Bontha, S.; Bodhak, S.; Krishna Balla, V.; Doddamani, M. Quasi-static compressive behavior of bioactive glass reinforced high density polyethylene composites. Mater. Lett. 2022, 311, 131557. [Google Scholar] [CrossRef]
- Sadik, W.A.; El-Demerdash, A.-G.M.; Abokhateeb, A.E.A.; Elessawy, N.A. Innovative high-density polyethylene/waste glass powder composite with remarkable mechanical, thermal and recyclable properties for technical applications. Heliyon 2021, 7, e06627. [Google Scholar] [CrossRef] [PubMed]
- Yuan, Q.; Jiang, W.; An, L.; Li, R.K.Y.; Jiang, Z. Mechanical and thermal properties of high-density polyethylene toughened with glass beads. J. Appl. Polym. Sci. 2003, 89, 2102–2107. [Google Scholar] [CrossRef]
- Yuan, Q.; Jiang, W.; Zhang, H.; Yin, J.; An, L.; Li, R.K.Y. Brittle-ductile transition in high-density polyethylene/glass-bead blends: Effects of interparticle distance and temperature. J. Polym. Sci. Part B Polym. Phys. 2001, 39, 1855–1859. [Google Scholar] [CrossRef]
- Bai, S.-L.; Chen, J.; Huang, Z.; Yu, Z. The role of the interfacial strength in glass bead filled HDPE. J. Mater. Sci. Lett. 2000, 19, 1587–1589. [Google Scholar] [CrossRef]
- Bongiorno, A.; Pagano, C.; Agnelli, S.; Baldi, F.; Fassi, I. Mechanical properties of micro-injected HDPE composites. AIP Conf. Proc. 2016, 1713, 1–5. [Google Scholar]
- Burgos Pintos, P.; Maturi, M.; Sanz de León, A.; Molina, S.I. Development of Polymer Composites Using Surface-Modified Olive Pit Powder for Fused Granular Fabrication. Polymers 2024, 16, 2981. [Google Scholar] [CrossRef]
- Leite-Barbosa, O.; Oliveira, M.F.L.D.; Braga, F.C.F.; Monteiro, S.N.; Oliveira, M.G.D.; Veiga-Junior, V.F. Impact of Buriti Oil from Mauritia flexuosa Palm Tree on the Rheological, Thermal, and Mechanical Properties of Linear Low-Density Polyethylene for Improved Sustainability. Polymers 2024, 16, 3037. [Google Scholar] [CrossRef]
- Ayana, K.D.; Ali, A.Y.; Ha, C.S. Wood Polymer Composites Based on the Recycled Polyethylene Blends from Municipal Waste and Ethiopian Indigenous Bamboo (Oxytenanthera abyssinica) Fibrous Particles Through Chemical Coupling Crosslinking. Polymers 2024, 16, 2982. [Google Scholar] [CrossRef]
- Amornsakchai, T.; Duangsuwan, S. Upcycling of HDPE Milk Bottles into High-Stiffness, High-HDT Composites with Pineapple Leaf Waste Materials. Polymers 2023, 15, 4697. [Google Scholar] [CrossRef] [PubMed]
- Hassan, T.; Jamshaid, H.; Mishra, R.; Khan, M.Q.; Petru, M.; Novak, J.; Choteborsky, R.; Hromasova, M. Acoustic, mechanical and thermal properties of green composites reinforced with natural fiberswaste. Polymers 2020, 12, 654. [Google Scholar] [CrossRef] [PubMed]
- Zolfaghari, E.; Infurna, G.; Alessi, S.; Dispenza, C.; Dintcheva, N.T. Sustainable Composites from Waste Polypropylene Added with Thermoset Composite Waste or Recovered Carbon Fibres. Polymers 2024, 16, 2922. [Google Scholar] [CrossRef] [PubMed]
- ASTM D695-15; Standard Test Method for Compressive Properties of Rigid Plastics. ASTM International: West Conshohocken, PA, USA, 2015.
- ASTM D790-17; Standard Test Methods for Flexural Properties of Unreinforced and Reinforced Plastics and Electrical Insulating Materials. ASTM International: West Conshohocken, PA, USA, 2017.
- ASTM D638-22; Standard Test Method for Tensile Properties of Plastics. ASTM International: West Conshohocken, PA, USA, 2022.
- Jozić, S.; Bajić, D.; Celent, L. Application of compressed cold air cooling: Achieving multiple performance characteristics in end milling process. J. Clean. Prod. 2015, 100, 325–332. [Google Scholar] [CrossRef]
- Canbolat, A.S.; Bademlioglu, A.H.; Arslanoglu, N.; Kaynakli, O. Performance optimization of absorption refrigeration systems using Taguchi, ANOVA and Grey Relational Analysis methods. J. Clean. Prod. 2019, 229, 874–885. [Google Scholar] [CrossRef]
- Chen, Y.; Gao, J.; Tang, L.; Shen, D. Performance of concrete subjected to severe multiple actions of composite salts solution under wet-dry cycles and flexural loading in lab. J. Wuhan Univ. Technol. Mater. Sci. Ed. 2017, 32, 830–837. [Google Scholar] [CrossRef]
- Morshedi Dehaghi, F.; Aberoumand, M.; Sundararaj, U. A Promising Recycling Strategy via Processing Polypropylene/Recycled Poly(ethylene terephthalate): Reactive Extrusion Using Dual Compatibilizers. Polymers 2024, 16, 2439. [Google Scholar] [CrossRef]
- Koffi, A.; Mijiyawa, F.; Koffi, D.; Erchiqui, F.; Toubal, L. Mechanical properties, wettability and thermal degradation of HDPE/birch fiber composite. Polymers 2021, 13, 1459. [Google Scholar] [CrossRef]
- Sauli, Z.; Retnasamy, V.; Taniselass, S.; Wan Norhaimi, W.M.; Kamarudin, H.; Aziz, M.H.A. Contact Angle Analysis on Glass Based Surface. Appl. Mech. Mater. 2014, 680, 93–96. [Google Scholar] [CrossRef]
- Rawat, M.K.; Kukreja, N.; Gupta, S.K. Effect of reinforcing micro sized aluminium oxide particles on mechanical properties of polymer based composite. Mater. Today Proc. 2020, 26, 1306–1309. [Google Scholar] [CrossRef]
- Wallace, C.A.; Saha, G.C.; Afzal, M.T.; Lloyd, A. Experimental and computational modeling of effective flexural/tensile properties of microwave pyrolysis biochar reinforced GFRP biocomposites. Compos. Part B Eng. 2019, 175, 107180. [Google Scholar] [CrossRef]
- Gad, S.I.; Attia, M.A.; Hassan, M.A.; El-Shafei, A.G. A random microstructure-based model to study the effect of the shape of reinforcement particles on the damage of elastoplastic particulate metal matrix composites. Ceram. Int. 2021, 47, 3444–3461. [Google Scholar] [CrossRef]
- Wang, J.; Li, L.; Lin, P.; Wang, J. Effect of TiC particle size on the microstructure and tensile properties of TiCp/Ti6Al4V composites fabricated by laser melting deposition. Opt. Laser Technol. 2018, 105, 195–206. [Google Scholar] [CrossRef]
- Gomes, V.R.; Babisk, M.P.; Vieira, C.M.F.; Sampaio, J.A.; Vidal, F.W.H.; Gadioli, M.C.B. Ornamental stone wastes as an alternate raw material for soda-lime glass manufacturing. Mater. Lett. 2020, 269, 127579. [Google Scholar] [CrossRef]
- Wu, Y.; Wang, J.Y.; Monteiro, P.J.M.; Zhang, M.H. Development of ultra-lightweight cement composites with low thermal conductivity and high specific strength for energy efficient buildings. Constr. Build. Mater. 2015, 87, 100–112. [Google Scholar] [CrossRef]
- Guo, T.F.; Cheng, L. Thermal and vapor pressure effects on cavitation and void growth. J. Mater. Sci. 2001, 36, 5871–5876. [Google Scholar] [CrossRef]
- Lundström, T.S.; Gebart, B.R. Influence from process parameters on void formation in resin transfer molding. Polym. Compos. 1994, 15, 25–33. [Google Scholar] [CrossRef]
- Li, Y.; Li, Q.; Ma, H. The voids formation mechanisms and their effects on the mechanical properties of flax fiber reinforced epoxy composites. Compos. Part A Appl. Sci. Manuf. 2015, 72, 40–48. [Google Scholar] [CrossRef]
- Koushyar, H.; Alavi-Soltani, S.; Minaie, B.; Violette, M. Effects of variation in autoclave pressure, temperature, and vacuum-application time on porosity and mechanical properties of a carbon fiber/epoxy composite. J. Compos. Mater. 2012, 46, 1985–2004. [Google Scholar] [CrossRef]
- Chaudhary, A.K.; Chitriv, S.P.; Chaitanya, K.; Vijayakumar, R.P. Influence of ultraviolet and chemical treatment on the biodegradation of low-density polyethylene and high-density polyethylene by Cephalosporium strain. Environ. Monit. Assess. 2023, 195, 395. [Google Scholar] [CrossRef]
- Soni, R.; Kapri, A.; Zaidi, M.G.H.; Goel, R. Comparative Biodegradation Studies of Non-poronized and Poronized LDPE Using Indigenous Microbial Consortium. J. Polym. Environ. 2009, 17, 233–239. [Google Scholar] [CrossRef]
- Zaldivar, R.J.; Ferrelli, G.L.; Kim, H.I. Hydrolysis susceptibility and carbamate formation for a low moisture-absorbing, siloxane-modified cyanate ester resin matrix (TC410) material used for composite space applications. J. Compos. Mater. 2022, 56, 1349–1362. [Google Scholar] [CrossRef]
- Pelto, J.; Verho, T.; Ronkainen, H.; Kaunisto, K.; Metsäjoki, J.; Seitsonen, J.; Karttunen, M. Matrix morphology and the particle dispersion in HDPE nanocomposites with enhanced wear resistance. Polym. Test. 2019, 77, 105897. [Google Scholar] [CrossRef]
- Da Silveira, P.H.P.M.; da Conceição, M.D.N.; de Pina, D.N.; de Moraes Paes, P.A.; Monteiro, S.N.; Tapanes, N.D.L.C.O.; da Conceição Ribeiro, R.C.; Bastos, D.C. Impact of Different Mineral Reinforcements on HDPE Composites: Effects of Melt Flow Index and Particle Size on Physical and Mechanical Properties. Polymers 2024, 16, 2063. [Google Scholar] [CrossRef]
- Olesik, P.; Godzierz, M.; Kozioł, M.; Jała, J.; Szeluga, U.; Myalski, J. Structure and Mechanical Properties of High-Density Polyethylene Composites Reinforced with Glassy Carbon. Materials 2021, 14, 4024. [Google Scholar] [CrossRef]
- Hoang, T.; Chinh, N.T.; Trang, N.T.T.; Hang, T.T.X.; Thanh, D.T.M.; Hung, D.V.; Ha, C.-S.; Aufray, M. Effects of maleic anhydride grafted ethylene/vinyl acetate copolymer (EVA) on the properties of EVA/silica nanocomposites. Macromol. Res. 2013, 21, 1210–1217. [Google Scholar] [CrossRef]
- Samsudin, D.; Ismail, H.; Othman, N.; Abdul Hamid, Z.A. Comparative study of glut palmitate salt and polyethylene grafted maleic anhydride compatibilizer on the properties of silica filled high-density polyethylene composites. Polym. Test. 2016, 52, 104–110. [Google Scholar] [CrossRef]
- Um, H.J.; Hwang, Y.T.; Choi, K.H.; Kim, H.S. Effect of crystallinity on the mechanical behavior of carbon fiber reinforced polyethylene-terephthalate (CF/PET) composites considering temperature conditions. Compos. Sci. Technol. 2021, 207, 108745. [Google Scholar] [CrossRef]
- Frone, A.N.; Panaitescu, D.M.; Chiulan, I.; Nicolae, C.A.; Vuluga, Z.; Vitelaru, C.; Damian, C.M. The effect of cellulose nanofibers on the crystallinity and nanostructure of poly(lactic acid) composites. J. Mater. Sci. 2016, 51, 9771–9791. [Google Scholar] [CrossRef]
- Akiyama, K.; Koda, T.; Nishioka, A.; Matsumura, Y.; Ochiai, B. Cellulose acetate synthesized from cold-sheared cellulose shows improved ability to toughen poly(lactic acid). J. Polym. Sci. 2024, 62, 4632–4641. [Google Scholar] [CrossRef]
- Sheng, Z.; Shen, Y.; Dai, H.; Pan, S.; Ai, B.; Zheng, L.; Zheng, X.; Xu, Z. Physicochemical characterization of raw and modified banana pseudostem fibers and their adsorption capacities for heavy metal Pb2+ and Cd2+ in water. Polym. Compos. 2018, 39, 1869–1877. [Google Scholar] [CrossRef]
- Grimaut, D.A.; da Silva, J.B.A.; Lemos, P.V.F.; Correia, P.R.C.; Santana, J.S.; Pessôa, L.C.; Estevez-Areco, S.; Famá, L.M.; Goyanes, S.N.; Marcelino, H.R.; et al. Effect of Addition of Cross-Linked Starch on the Properties of Degraded PBAT Poly(butylene adipate-co-terephthalate) Films. Polymers 2023, 15, 3106. [Google Scholar] [CrossRef]


| Moulding Temperature (°C) | Moulding Time (min) | Moulding Pressure (MPa) |
|---|---|---|
| 150 | 5 | 1 |
| 150 | 5 | 1.5 |
| 150 | 5 | 3 |
| 150 | 5 | 6 |
| 150 | 10 | 1 |
| 150 | 10 | 1.5 |
| 150 | 10 | 3 |
| 150 | 10 | 6 |
| 150 | 15 | 1.5 |
| 170 | 5 | 1.5 |
| 170 | 10 | 1.5 |
| 170 | 10 | 6 |
| 170 | 15 | 1.5 |
| 190 | 10 | 1.5 |
| 190 | 10 | 3 |
| Mix Design Designation | HDPE (wt. %) | Glass (wt. %) | Compatibiliser (wt. %) | Glass Particle Size |
|---|---|---|---|---|
| Effect of Variable Amounts of Glass Reinforcement | ||||
| G0 | 100 | 0 | 0 | <200 µm |
| G5 | 93.5 | 5 | 1.5 | <200 µm |
| G10 | 88.5 | 10 | 1.5 | <200 µm |
| G15 | 83.5 | 15 | 1.5 | <200 µm |
| G20 | 78.5 | 20 | 1.5 | <200 µm |
| G25 | 73.5 | 25 | 1.5 | <200 µm |
| G30 | 68.5 | 30 | 1.5 | <200 µm |
| Effect of Variable Amounts of Maleic Anhydride | ||||
| M0 | 80 | 20 | 0 | <200 µm |
| M1 | 79 | 20 | 1 | <200 µm |
| M1.5 | 78.5 | 20 | 1.5 | <200 µm |
| M2 | 78 | 20 | 2 | <200 µm |
| M3 | 77 | 20 | 3 | <200 µm |
| Effect of Variable Amounts of Polyethylene-altered-Maleic Anhydride (PE-alt-MAH) | ||||
| - | 79 | 20 | 1 | <200 µm |
| - | 78.5 | 20 | 1.5 | <200 µm |
| - | 78 | 20 | 2 | <200 µm |
| - | 77 | 20 | 3 | <200 µm |
| Effect of Variable Glass Particle Size | ||||
| P200 | 78.5 | 20 | 1.5 | <200 µm |
| P100 | 78.5 | 20 | 1.5 | <100 µm |
| P50 | 78.5 | 20 | 1.5 | <50 µm |
| Label | Strength Results [MPa] | Normalisation | Deviation Sequences | Grey Relational Coefficient | Grade | Rank | ||||||||
|---|---|---|---|---|---|---|---|---|---|---|---|---|---|---|
| Comp | Flex | Ten | Comp | Flex | Ten | Comp | Flex | Ten | Comp | Flex | Ten | |||
| G0 | 11.5 | 31.4 | 22.5 | 0.629 | 0.612 | 1.000 | 0.371 | 0.388 | 0.000 | 0.574 | 0.563 | 1.000 | 0.712 | 2 |
| G5 | 11.8 | 29.5 | 21.8 | 0.714 | 0.224 | 0.857 | 0.286 | 0.776 | 0.143 | 0.636 | 0.392 | 0.778 | 0.602 | 4 |
| G10 | 11.8 | 31.5 | 20.3 | 0.714 | 0.633 | 0.551 | 0.286 | 0.367 | 0.449 | 0.636 | 0.576 | 0.527 | 0.580 | 5 |
| G15 | 11.2 | 30.8 | 20.2 | 0.543 | 0.490 | 0.531 | 0.457 | 0.510 | 0.469 | 0.522 | 0.495 | 0.516 | 0.511 | 7 |
| G20 | 12.8 | 33.3 | 19.6 | 1.000 | 1.000 | 0.408 | 0.000 | 0.000 | 0.592 | 1.000 | 1.000 | 0.458 | 0.819 | 1 |
| G25 | 10.6 | 31.5 | 19.4 | 0.371 | 0.633 | 0.367 | 0.629 | 0.367 | 0.633 | 0.443 | 0.576 | 0.441 | 0.487 | 9 |
| G30 | 10.6 | 31.35 | 17.6 | 0.371 | 0.602 | 0.000 | 0.629 | 0.398 | 1.000 | 0.443 | 0.557 | 0.333 | 0.444 | 11 |
| M0 | 9.3 | 30.7 | 20.1 | 0.000 | 0.469 | 0.510 | 1.000 | 0.531 | 0.490 | 0.333 | 0.485 | 0.505 | 0.441 | 12 |
| M1 | 12.2 | 30.1 | 19.6 | 0.829 | 0.347 | 0.408 | 0.171 | 0.653 | 0.592 | 0.745 | 0.434 | 0.458 | 0.545 | 6 |
| M2 | 11.8 | 29.1 | 20.1 | 0.714 | 0.143 | 0.510 | 0.286 | 0.857 | 0.490 | 0.636 | 0.368 | 0.505 | 0.503 | 8 |
| M3 | 10.5 | 29.5 | 19.1 | 0.343 | 0.224 | 0.306 | 0.657 | 0.776 | 0.694 | 0.432 | 0.392 | 0.419 | 0.414 | 13 |
| P100 | 11.9 | 32.2 | 20 | 0.743 | 0.776 | 0.490 | 0.257 | 0.224 | 0.510 | 0.660 | 0.690 | 0.495 | 0.615 | 3 |
| P50 | 11.8 | 28.4 | 19.4 | 0.714 | 0.000 | 0.367 | 0.286 | 1.000 | 0.633 | 0.636 | 0.333 | 0.441 | 0.470 | 10 |
| Wavelength (cm−1) | Assignment |
|---|---|
| 2914 | C-H asymmetric stretching |
| 2847 | C-H Symmetric Stretching Vibration |
| 1471 | -CH2 Bending Vibrations |
| 1464 | -CH3 Symmetric Vibration |
| 730 | -CH2 Rocking Vibrations |
| 717 | -CH2 Rocking Vibrations |
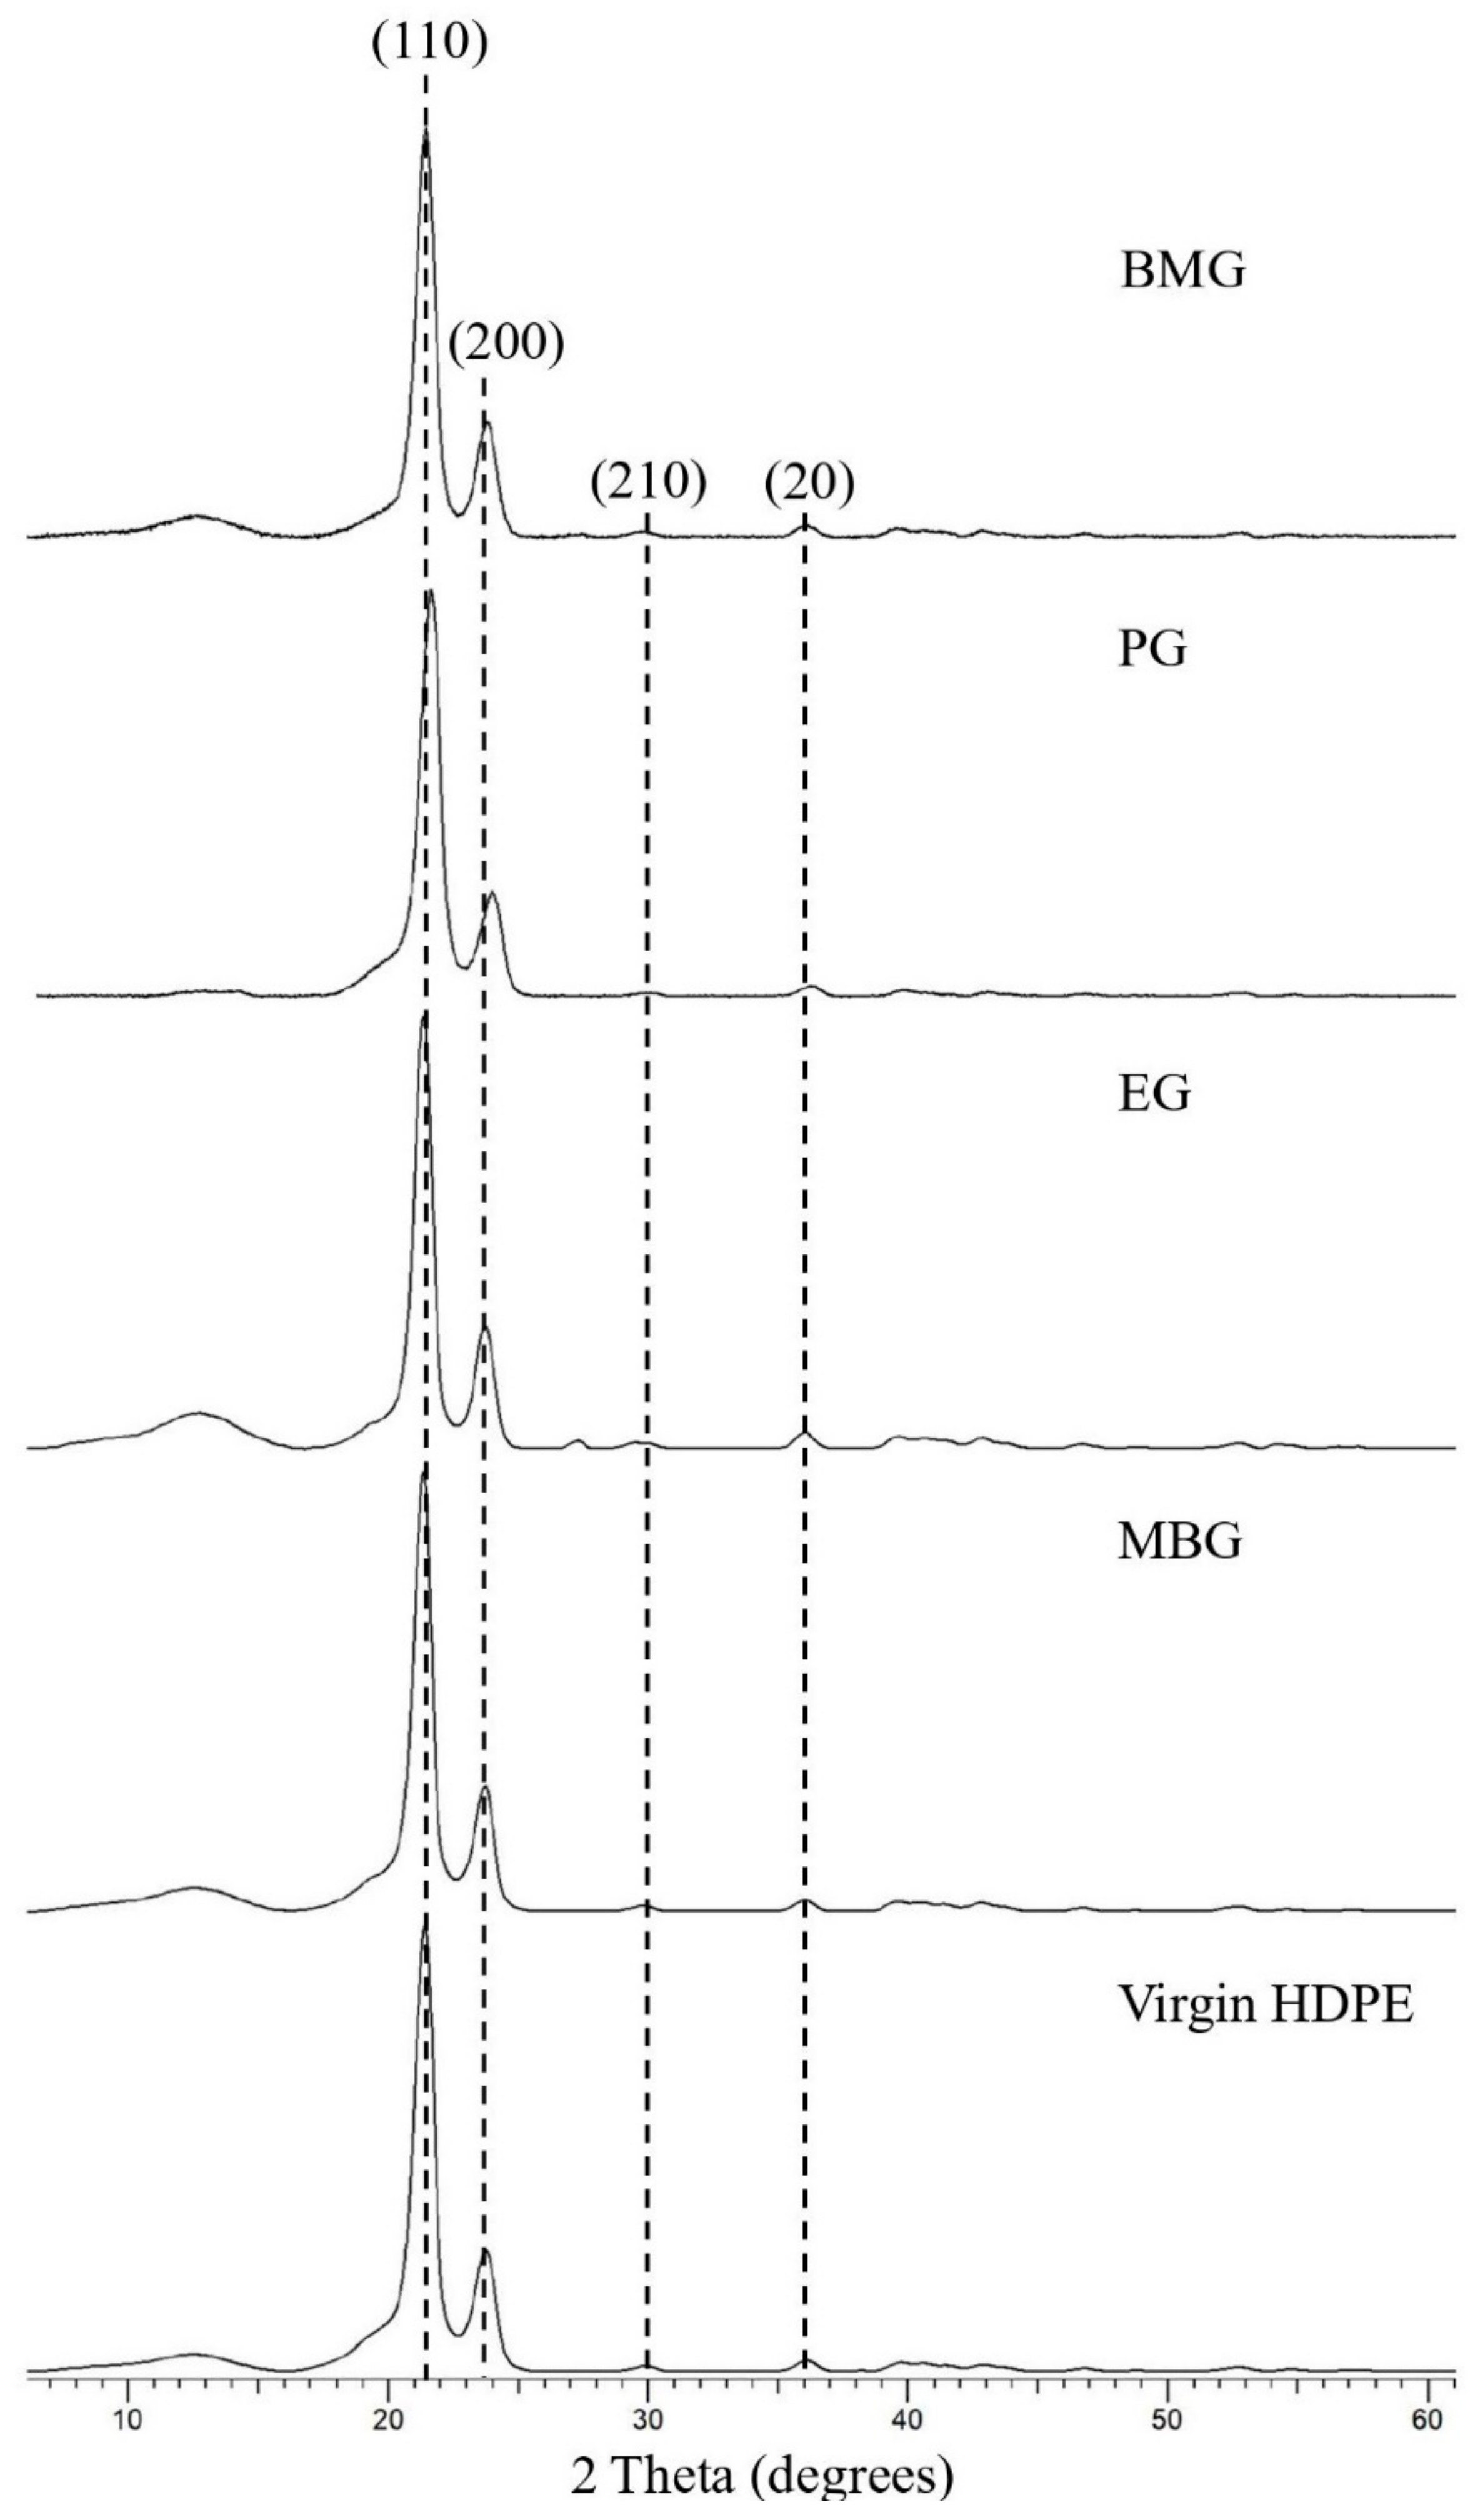
| Source of HDPE | BMG | EG | MBG | PG | Virgin HDPE |
|---|---|---|---|---|---|
| Crystallinity Percentage (%) | 39.4 | 37.3 | 40.5 | 42.1 | 41.1 |
| Crystallite Size, Ӑ (nm) | 112.8 | 103.0 | 120.4 | 107.7 | 111.5 |
Disclaimer/Publisher’s Note: The statements, opinions and data contained in all publications are solely those of the individual author(s) and contributor(s) and not of MDPI and/or the editor(s). MDPI and/or the editor(s) disclaim responsibility for any injury to people or property resulting from any ideas, methods, instructions or products referred to in the content. |
© 2024 by the authors. Licensee MDPI, Basel, Switzerland. This article is an open access article distributed under the terms and conditions of the Creative Commons Attribution (CC BY) license (https://creativecommons.org/licenses/by/4.0/).
Share and Cite
Wimalasuriya, L.; Gunasekara, C.; Robert, D.; Setunge, S.; O’Donnell, B. Waste-Derived High-Density Polyethylene-Glass Composites: A Pathway to Sustainable Structural Materials. Polymers 2025, 17, 35. https://doi.org/10.3390/polym17010035
Wimalasuriya L, Gunasekara C, Robert D, Setunge S, O’Donnell B. Waste-Derived High-Density Polyethylene-Glass Composites: A Pathway to Sustainable Structural Materials. Polymers. 2025; 17(1):35. https://doi.org/10.3390/polym17010035
Chicago/Turabian StyleWimalasuriya, Lasan, Chamila Gunasekara, Dilan Robert, Sujeeva Setunge, and Brian O’Donnell. 2025. "Waste-Derived High-Density Polyethylene-Glass Composites: A Pathway to Sustainable Structural Materials" Polymers 17, no. 1: 35. https://doi.org/10.3390/polym17010035
APA StyleWimalasuriya, L., Gunasekara, C., Robert, D., Setunge, S., & O’Donnell, B. (2025). Waste-Derived High-Density Polyethylene-Glass Composites: A Pathway to Sustainable Structural Materials. Polymers, 17(1), 35. https://doi.org/10.3390/polym17010035