
Bridging Experimentation and Computation: OMSP for Advanced Acrylate Characterization and Digital Photoresin Design in Vat Photopolymerization


Abstract
1. Introduction
2. Materials and Methods
2.1. Rheology
2.2. Ultraviolet Light (UV) Exposure
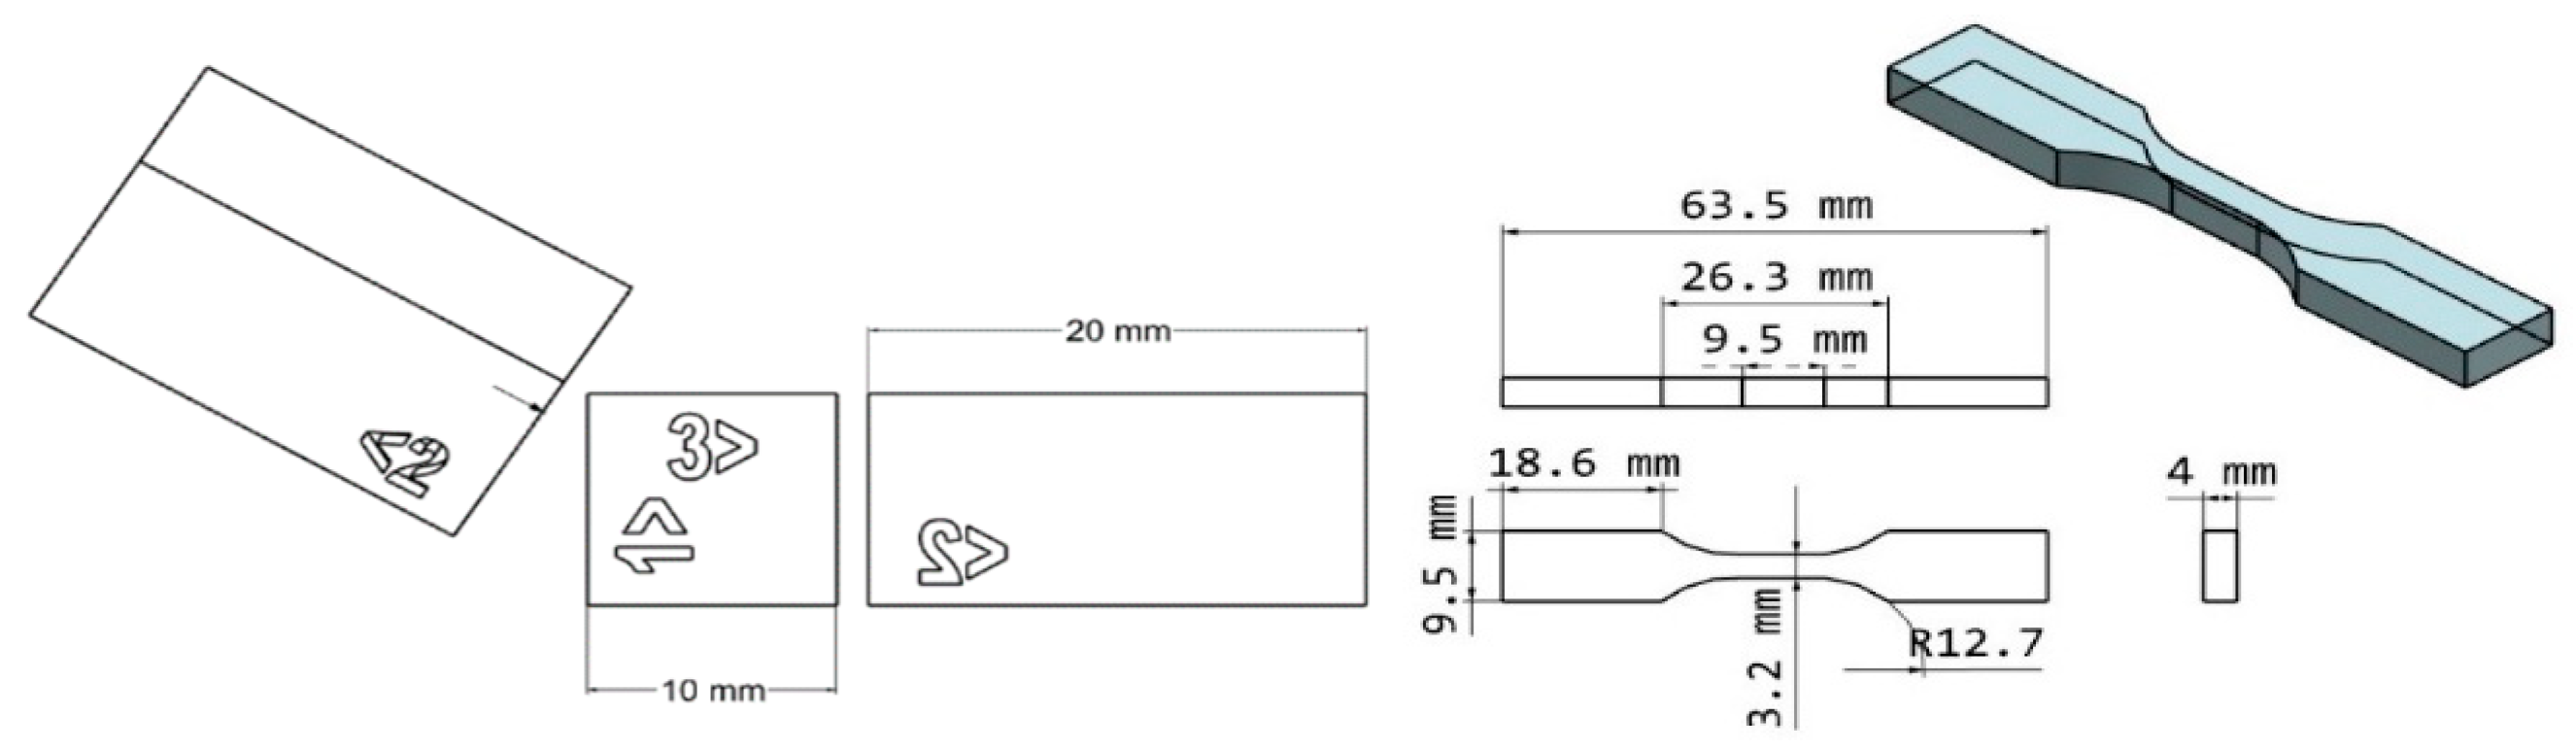
2.3. Mechanical Testing
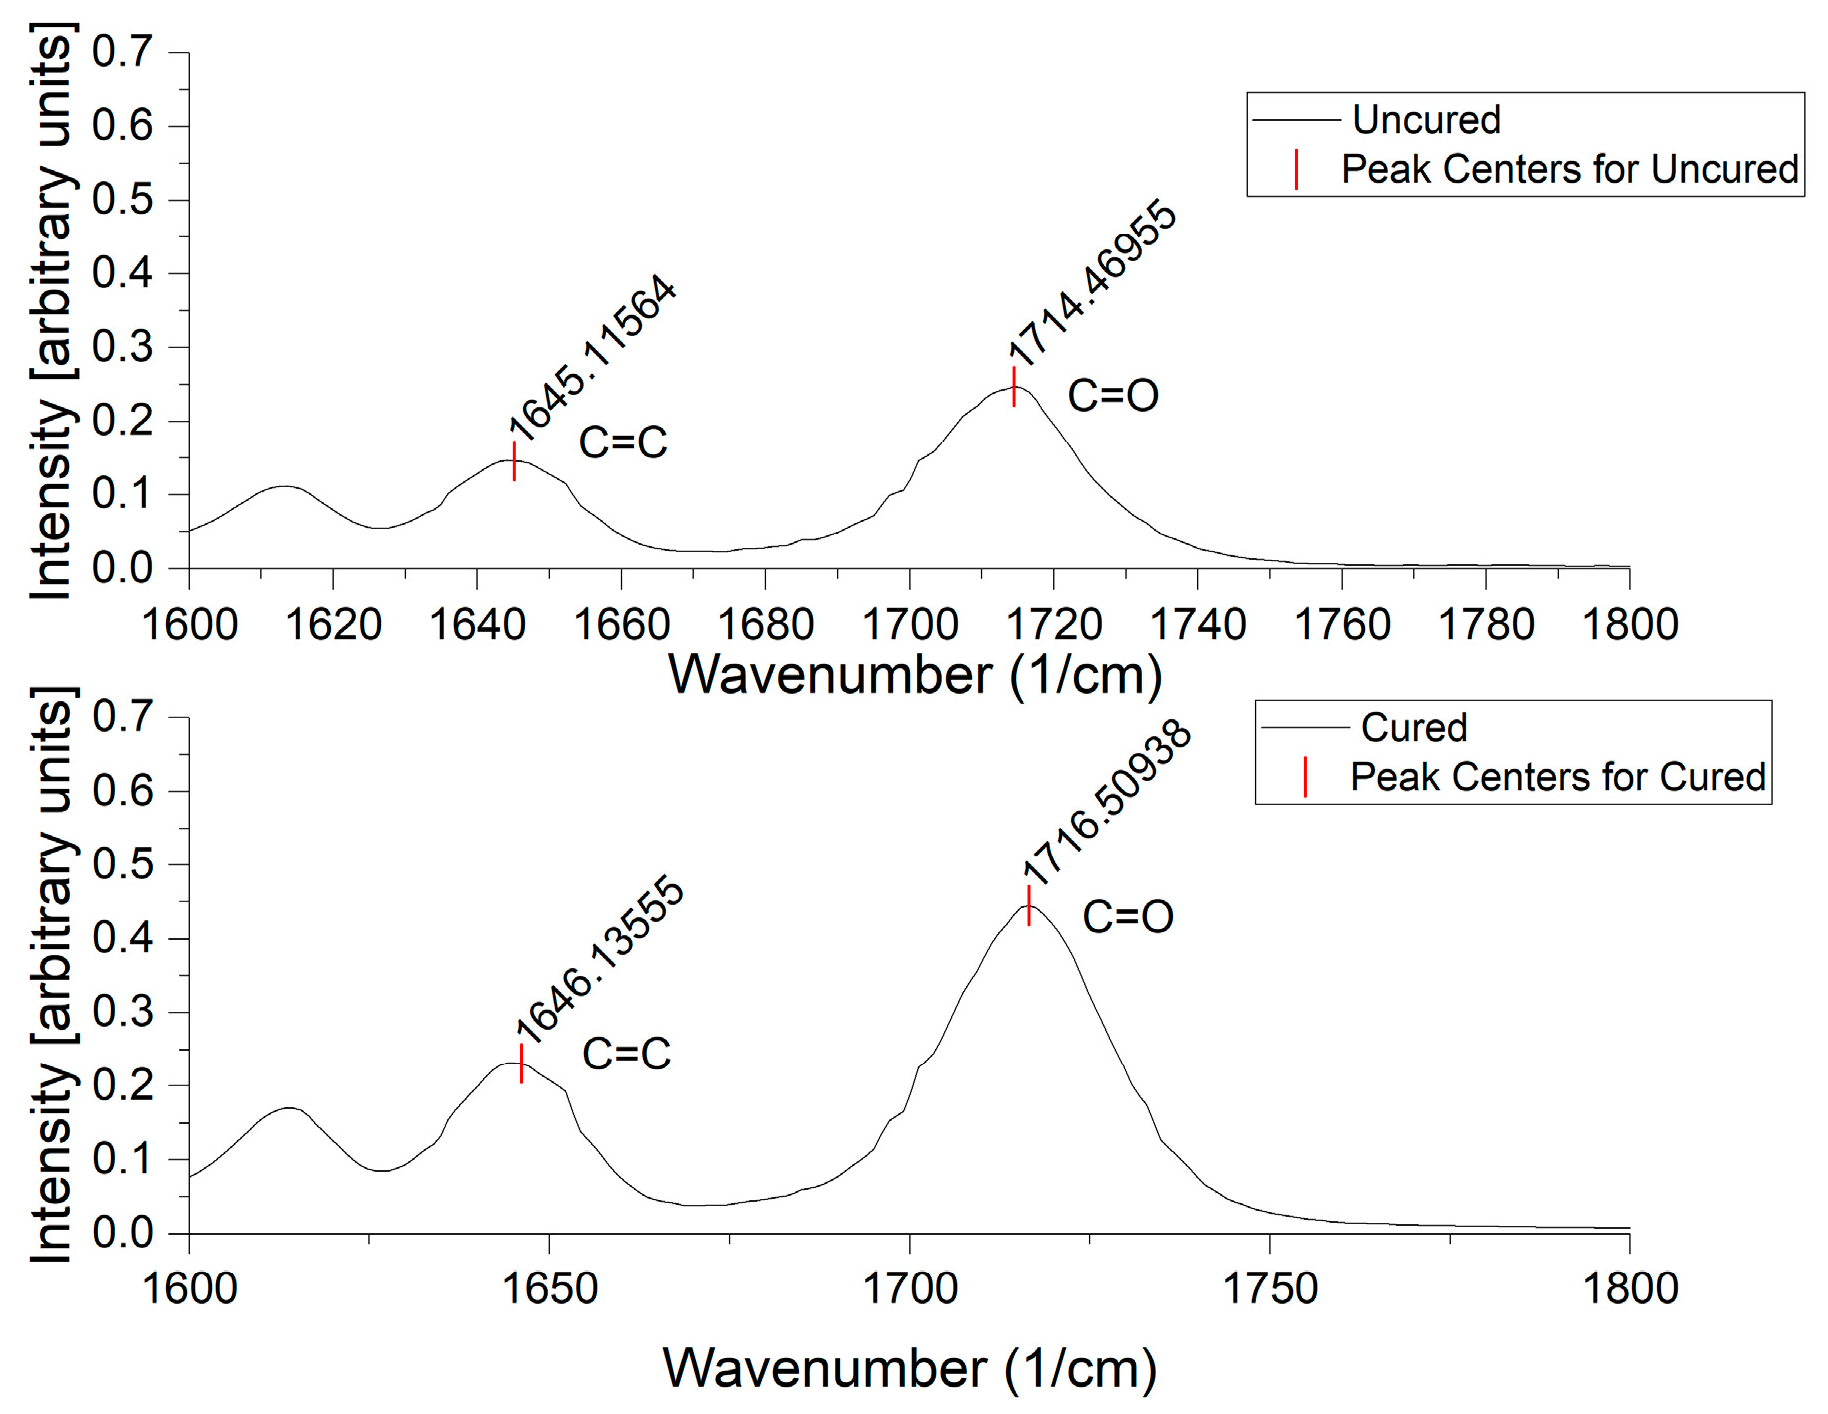
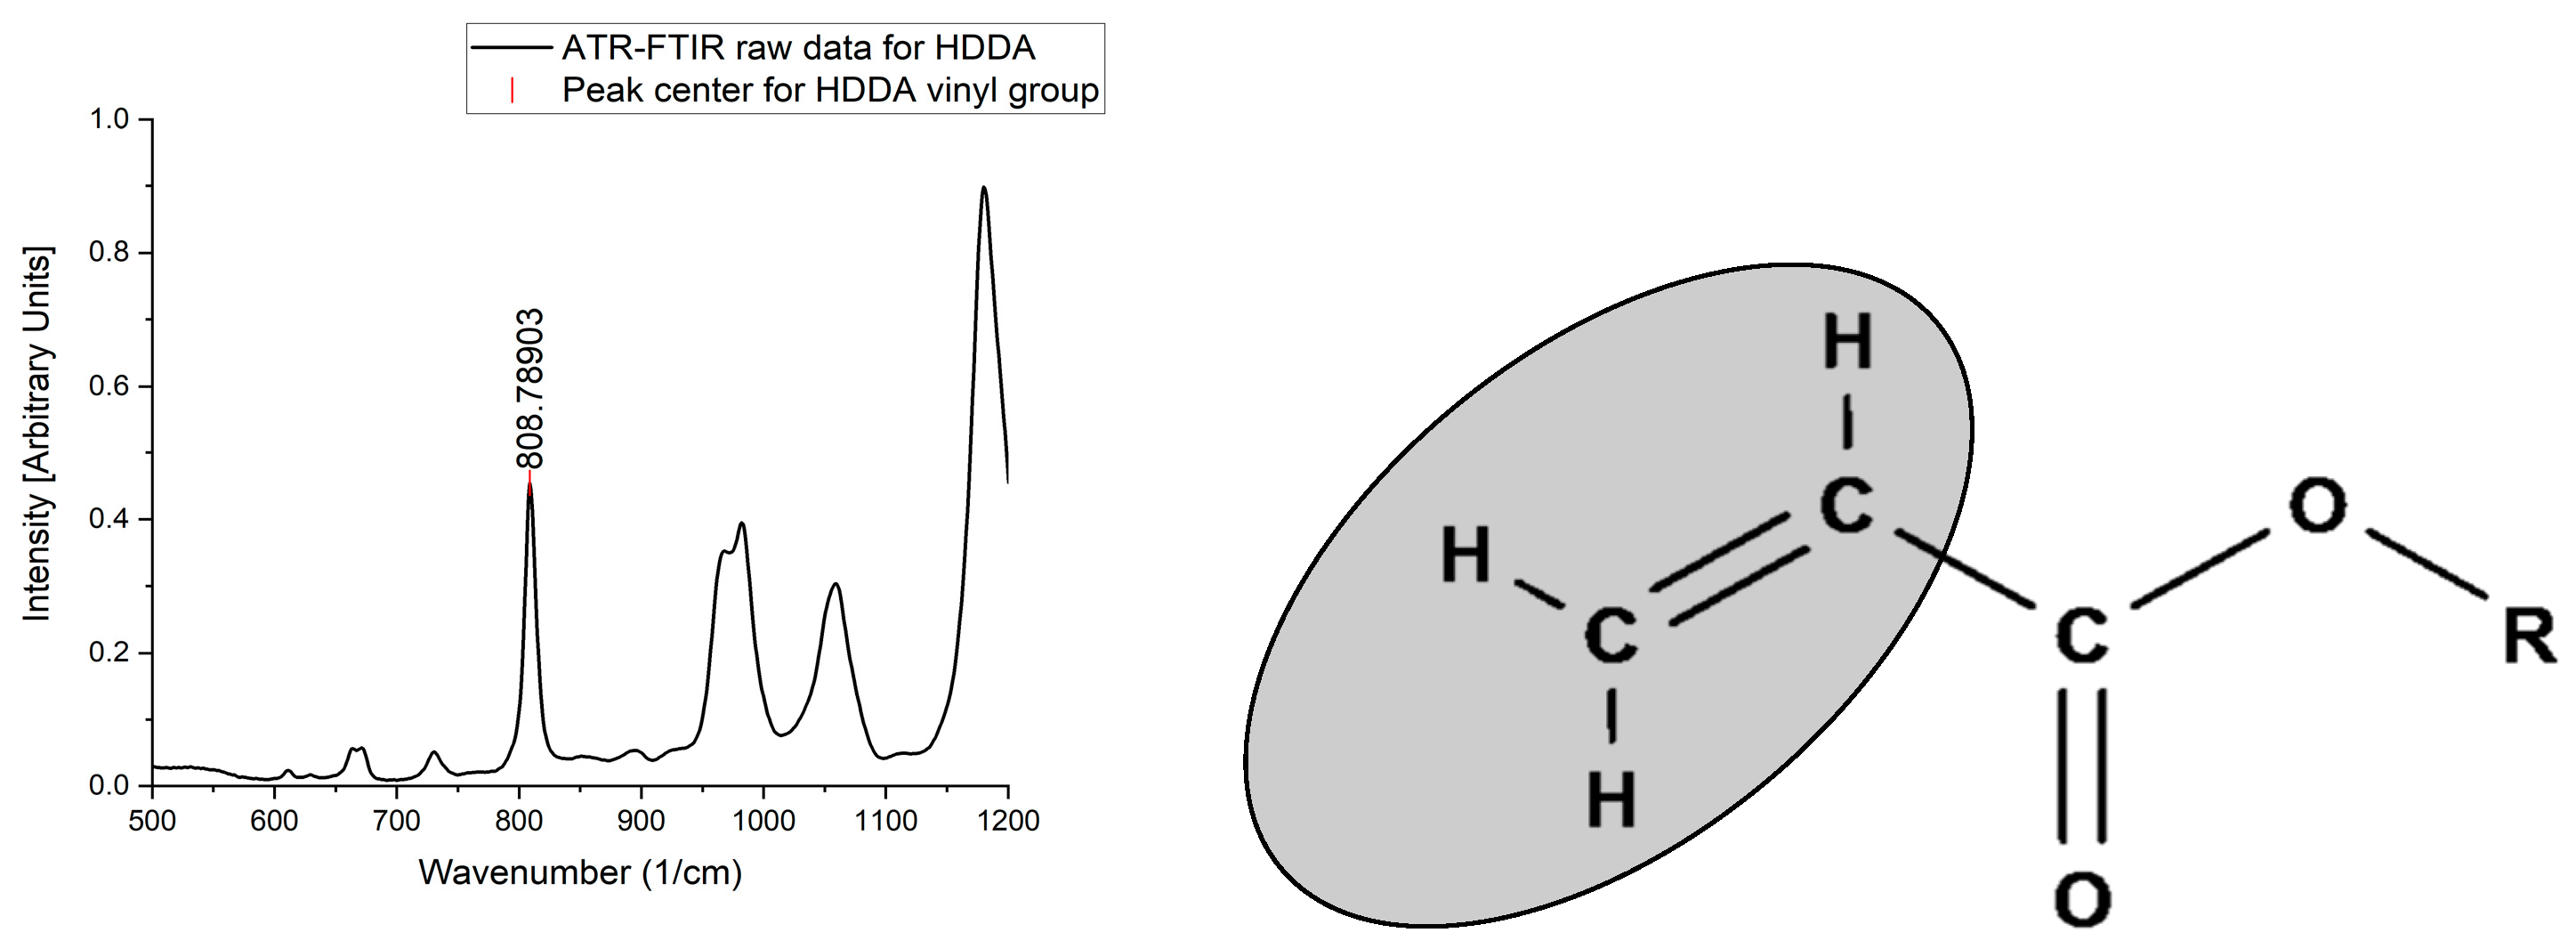
2.4. ATR-FTIR
2.5. OMSP Code Development
3. Results and Discussion
3.1. Boundaries of Operation for OMSP
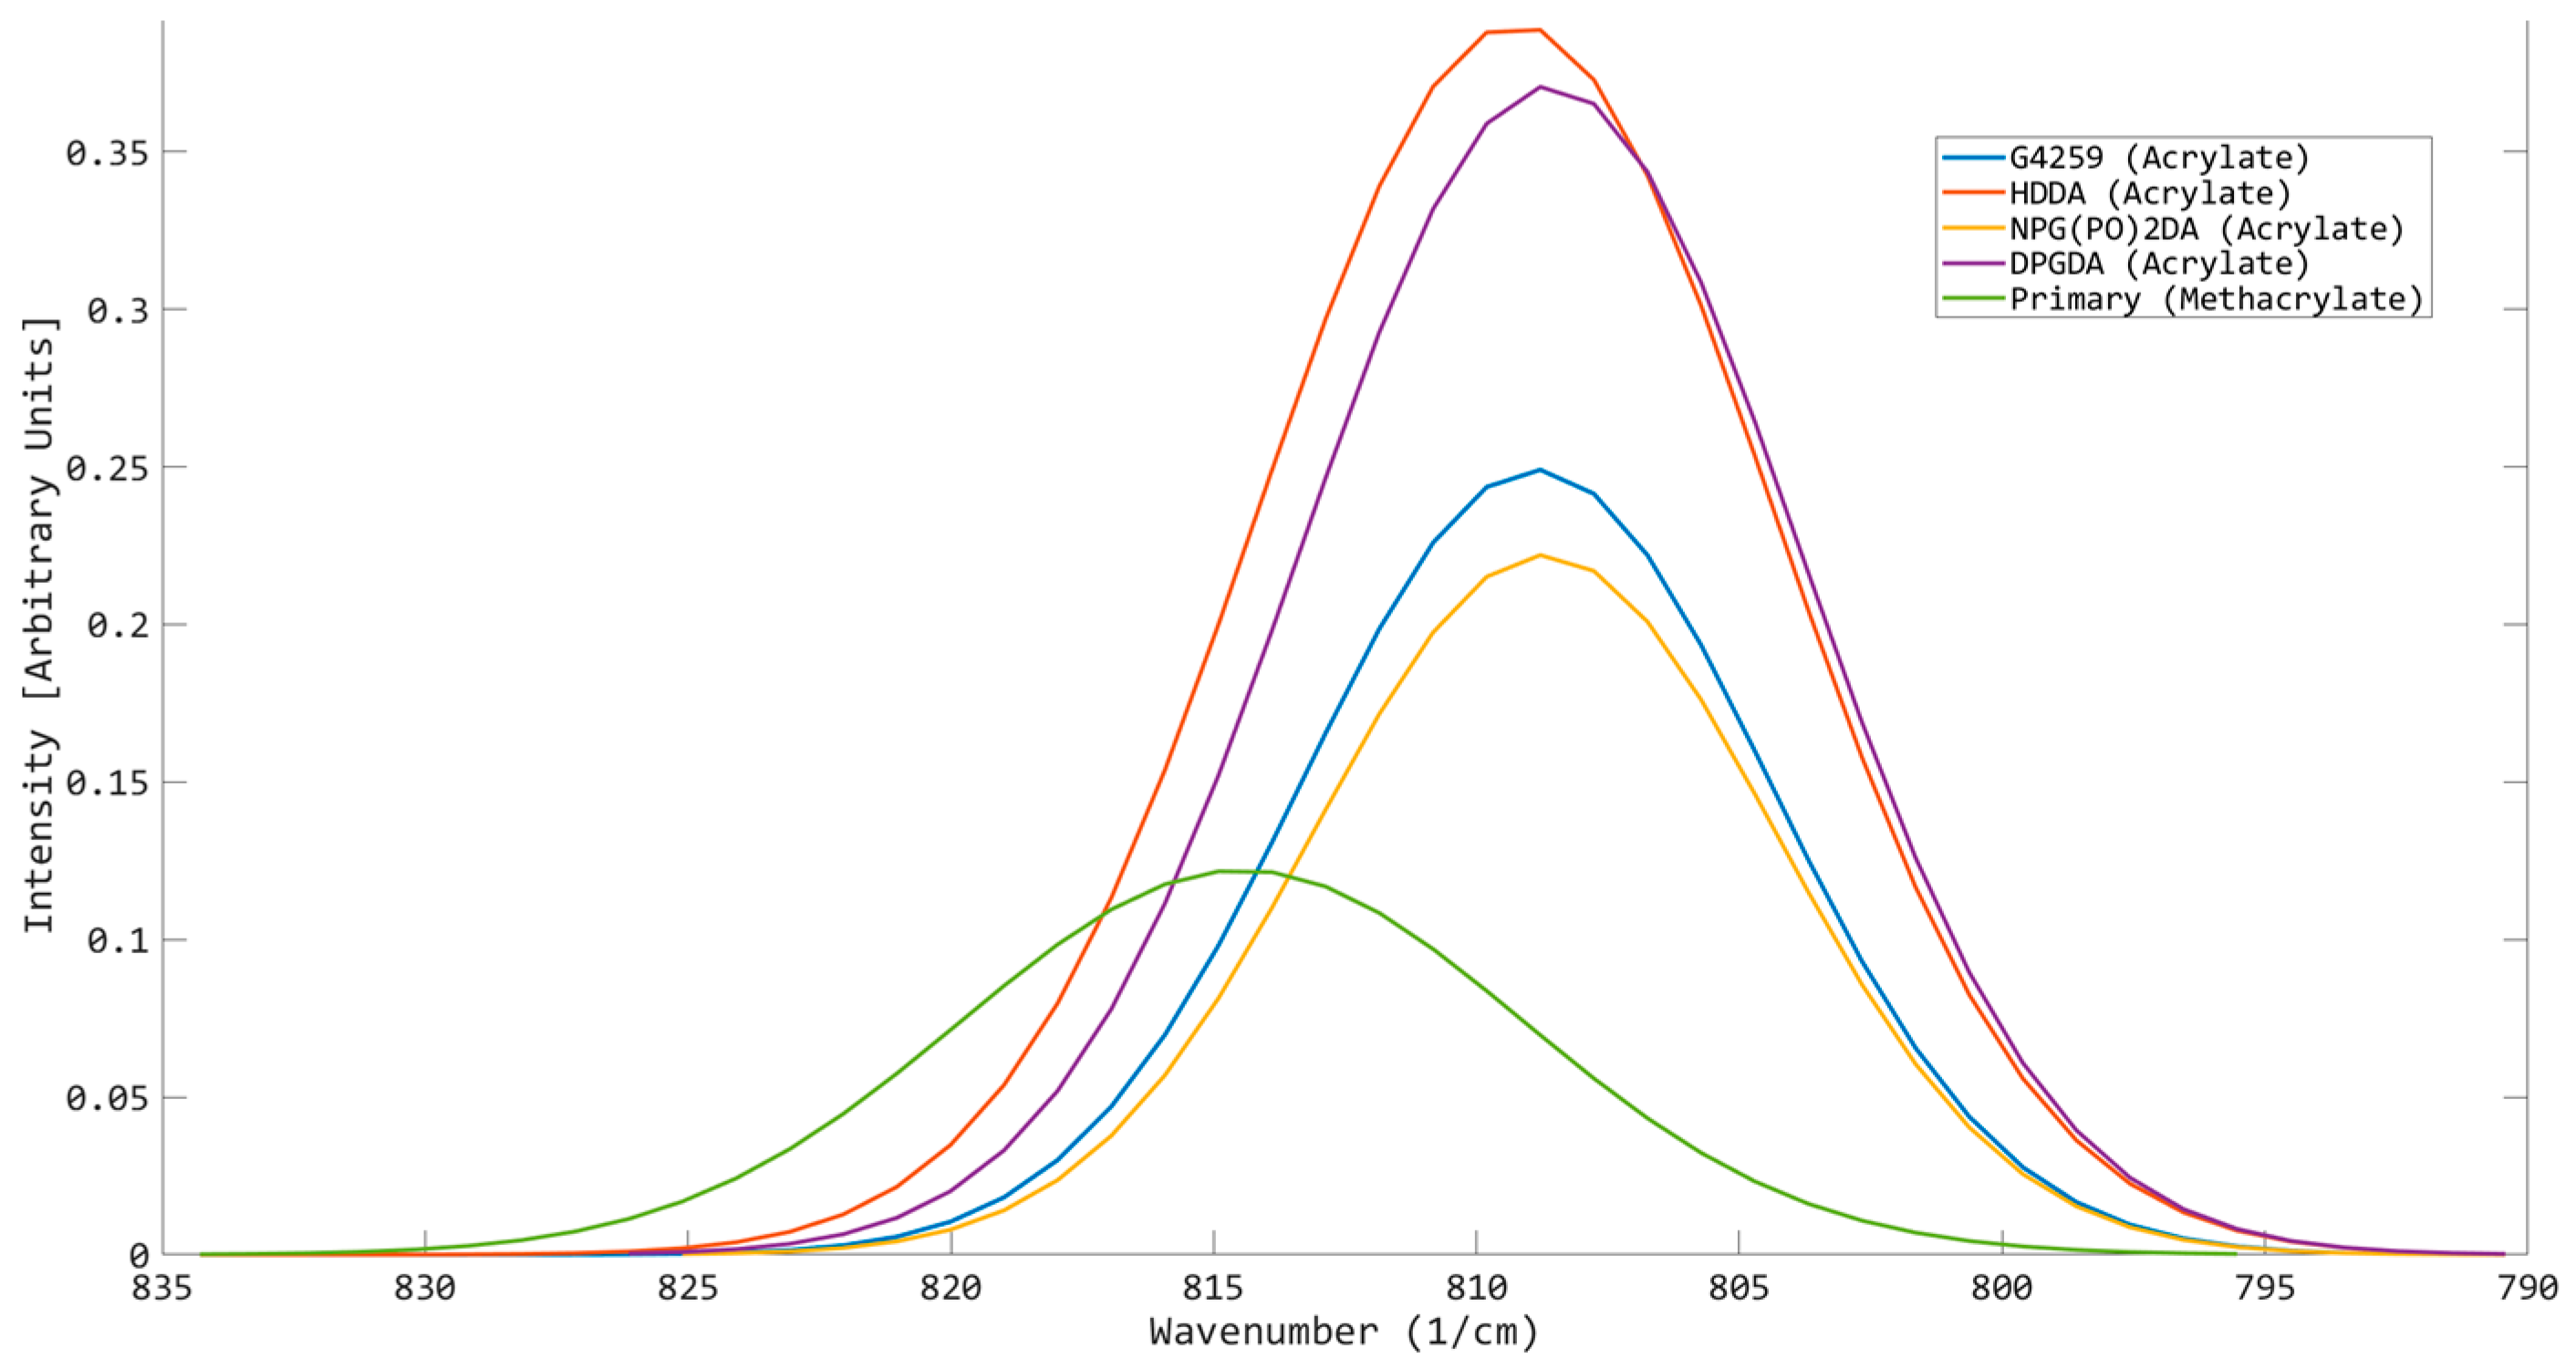
3.2. Determination of Functionality Home
Trends in Peak Positions When Different Functionalities Are Mixed
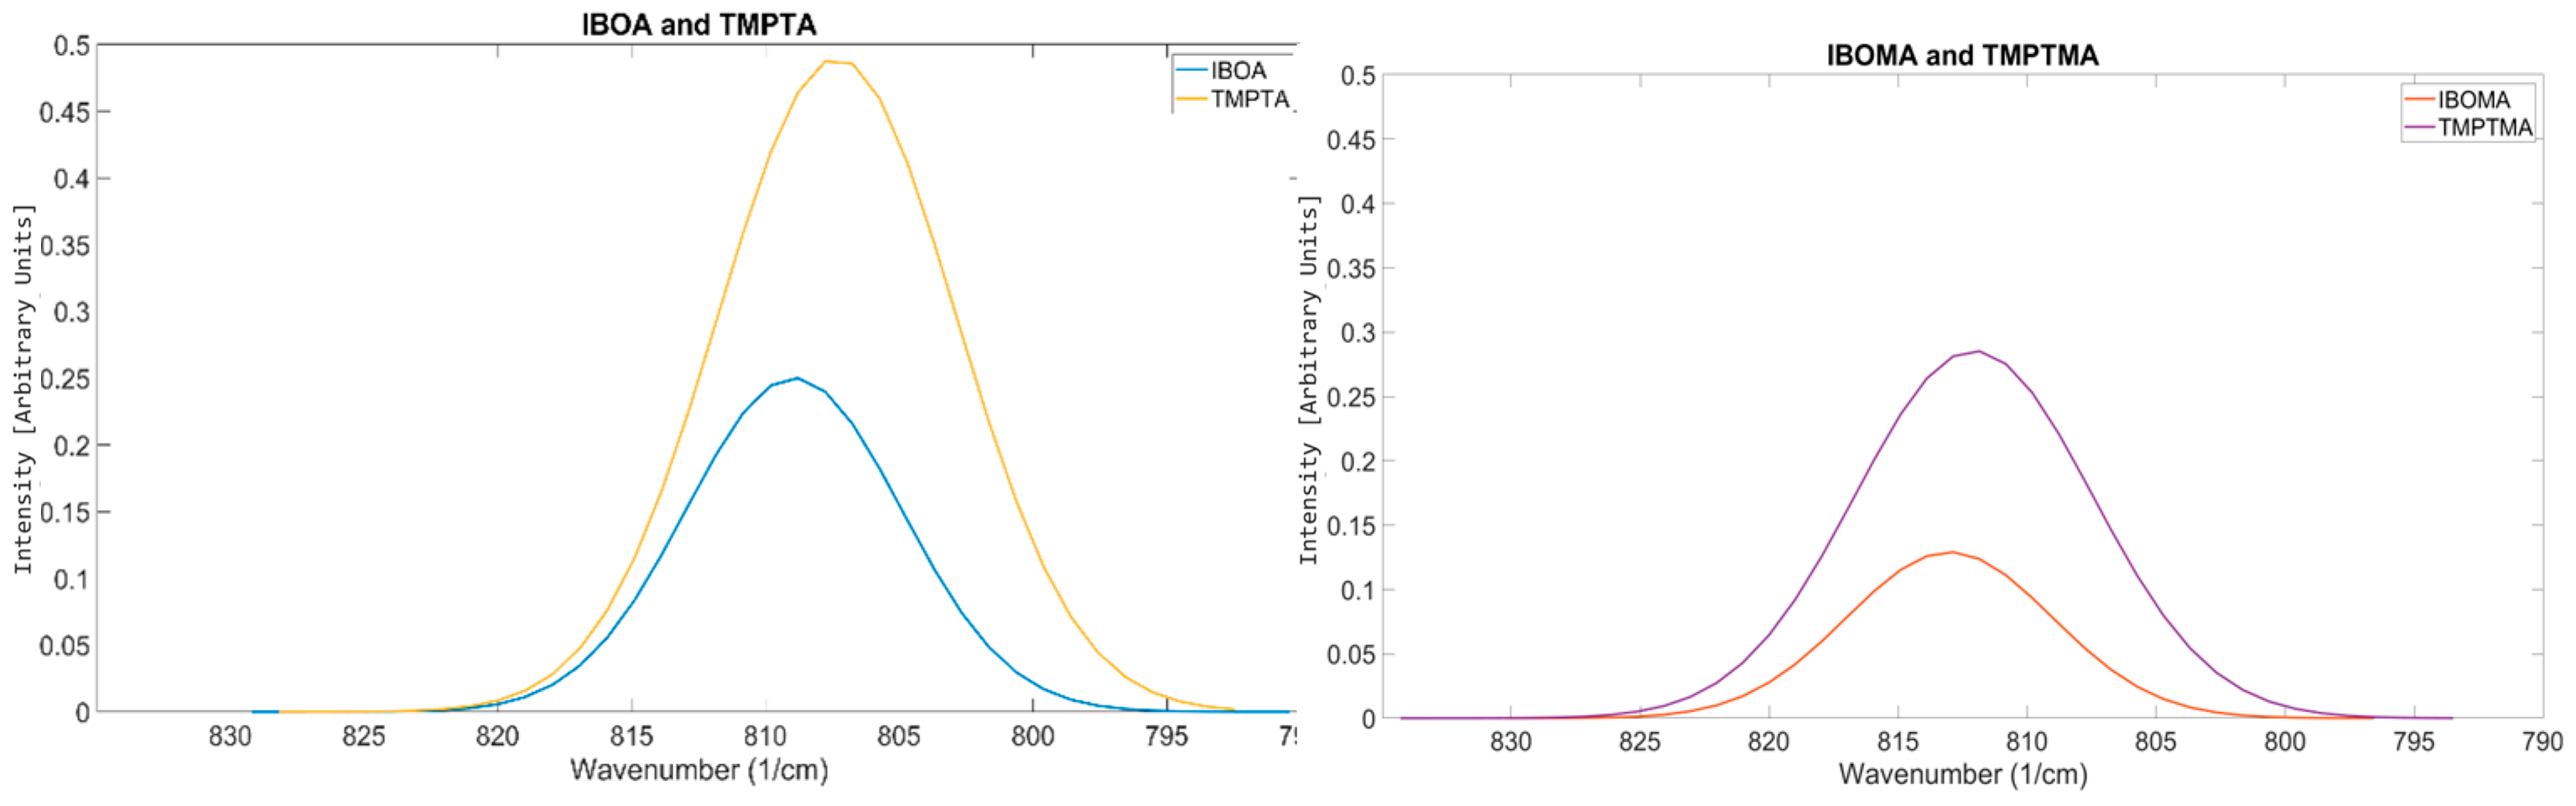
3.3. Comparison Between Acrylates and Methacrylates
3.4. Detection of Non-Acrylates
3.5. Application of OMSP on Acrylate Systems
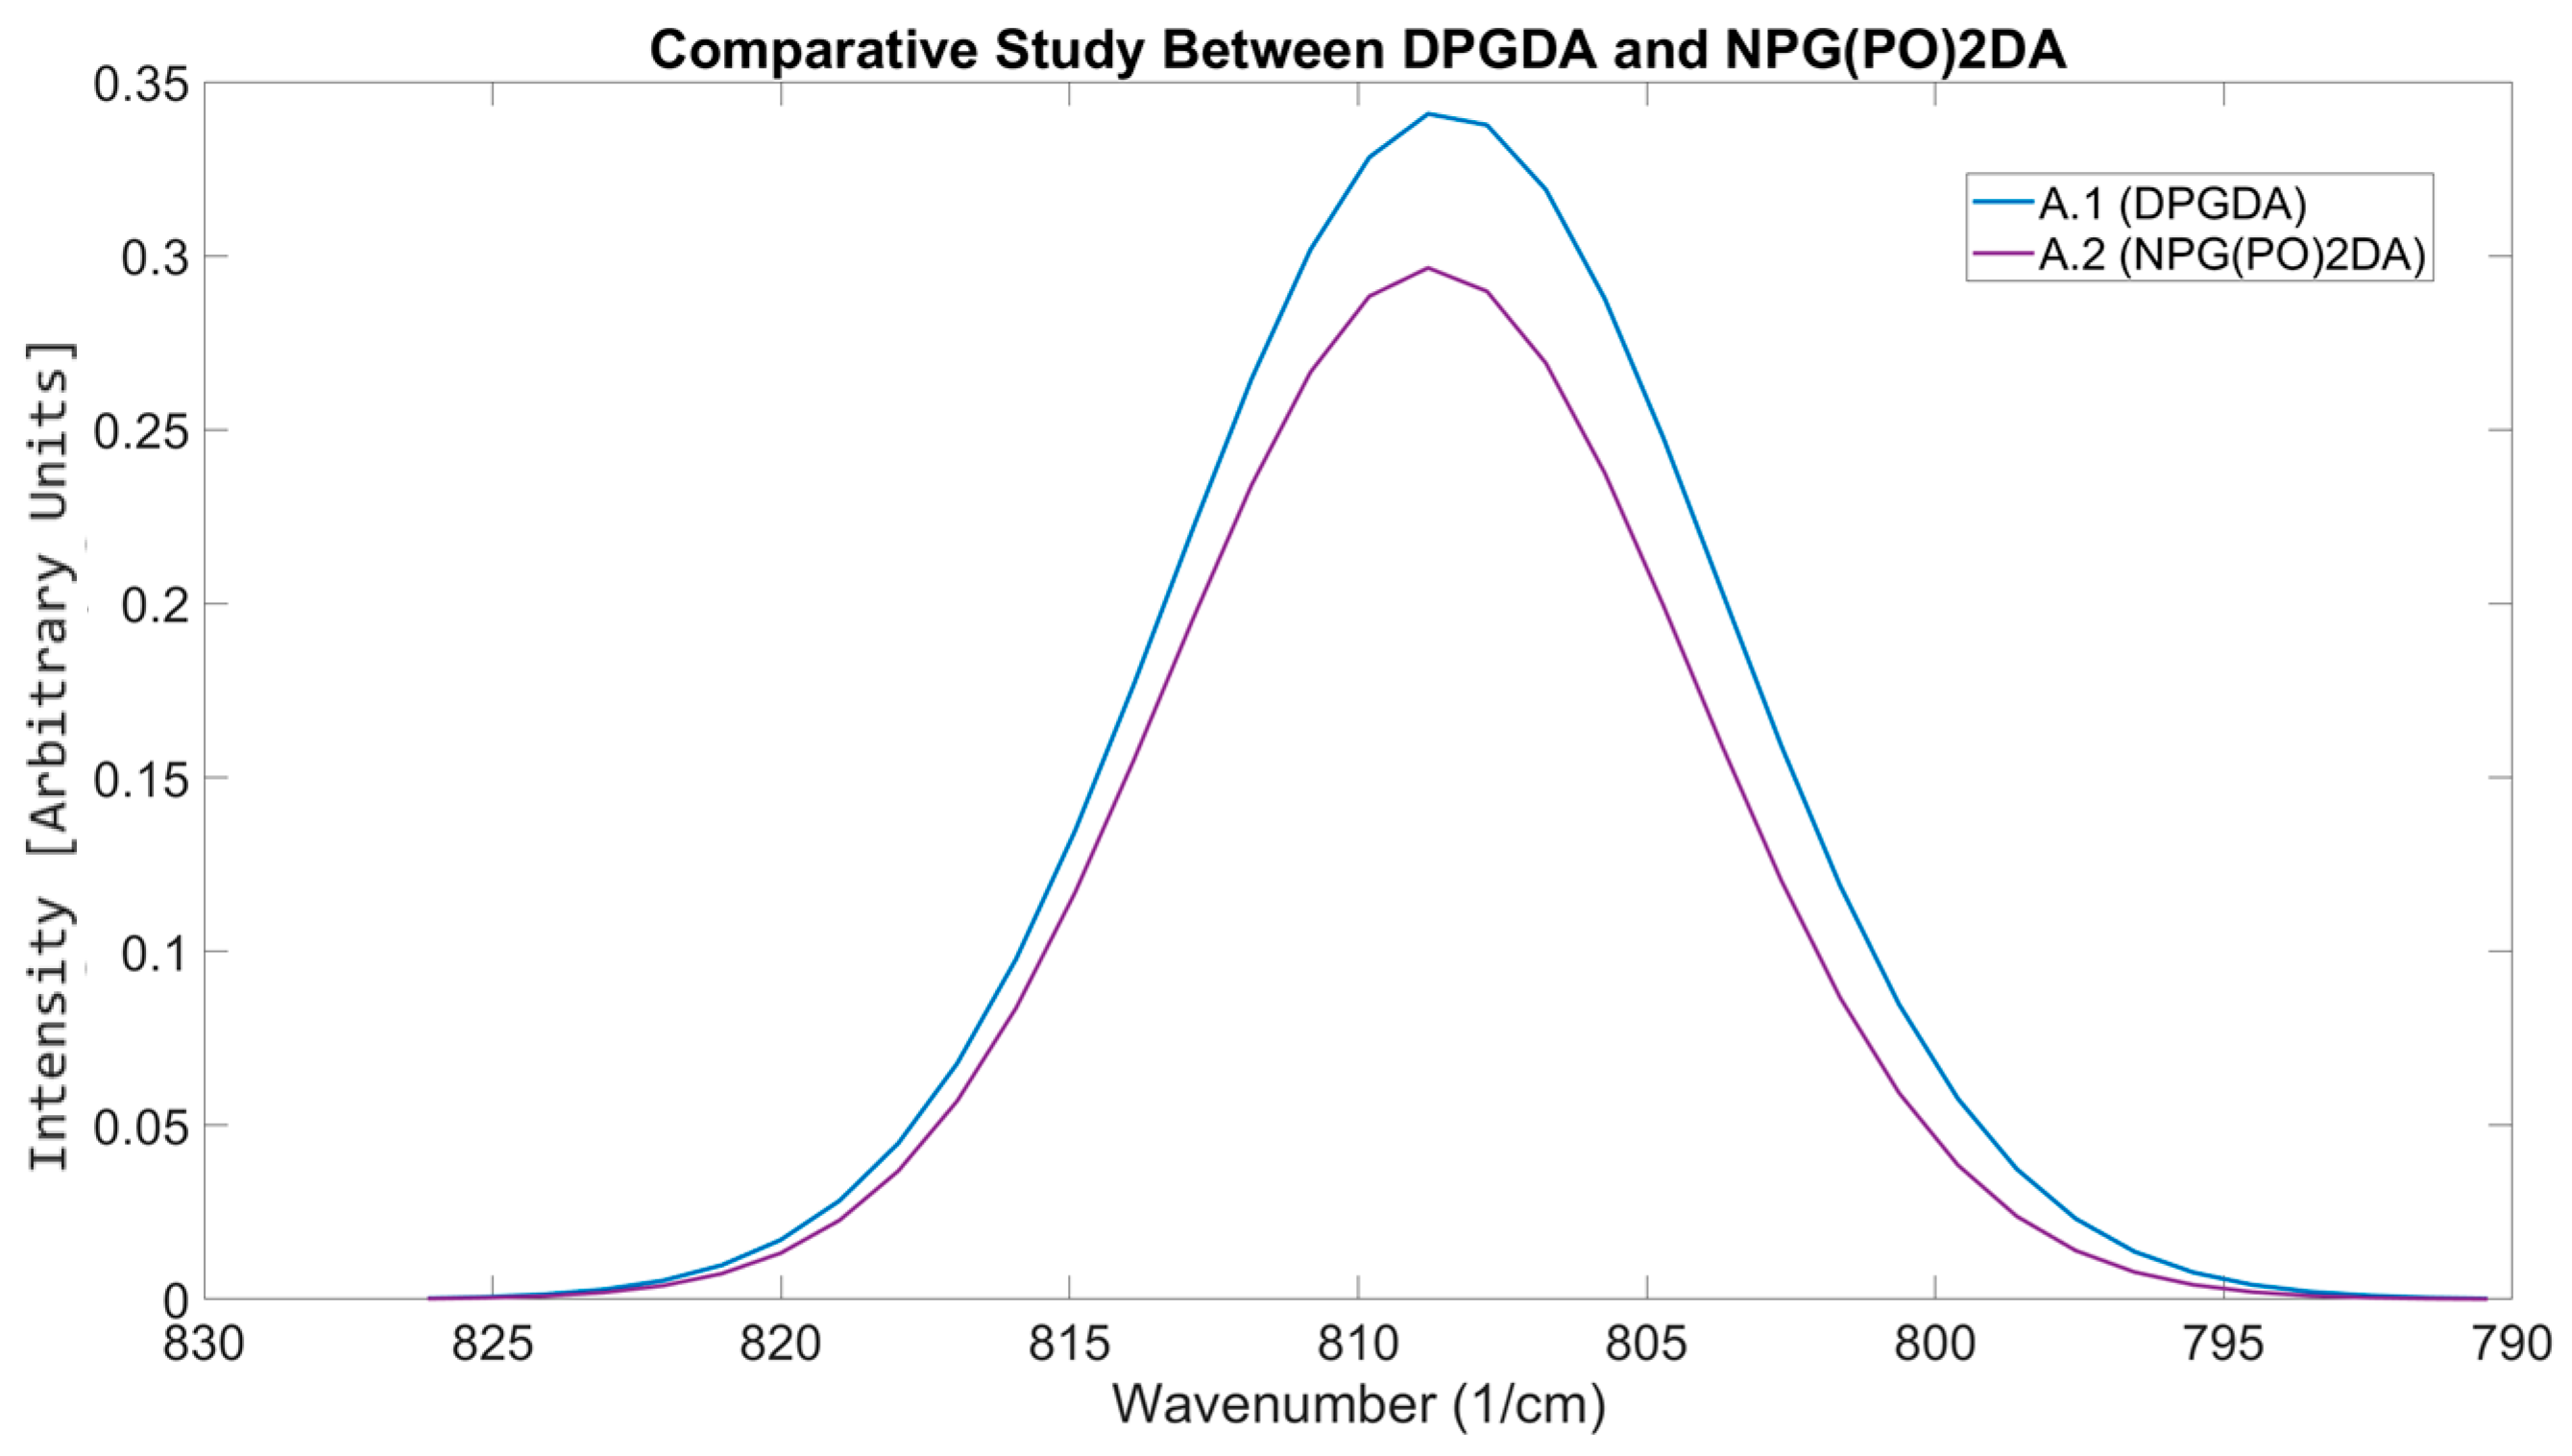
3.5.1. Differentiating Between Similar Reactive Diluents
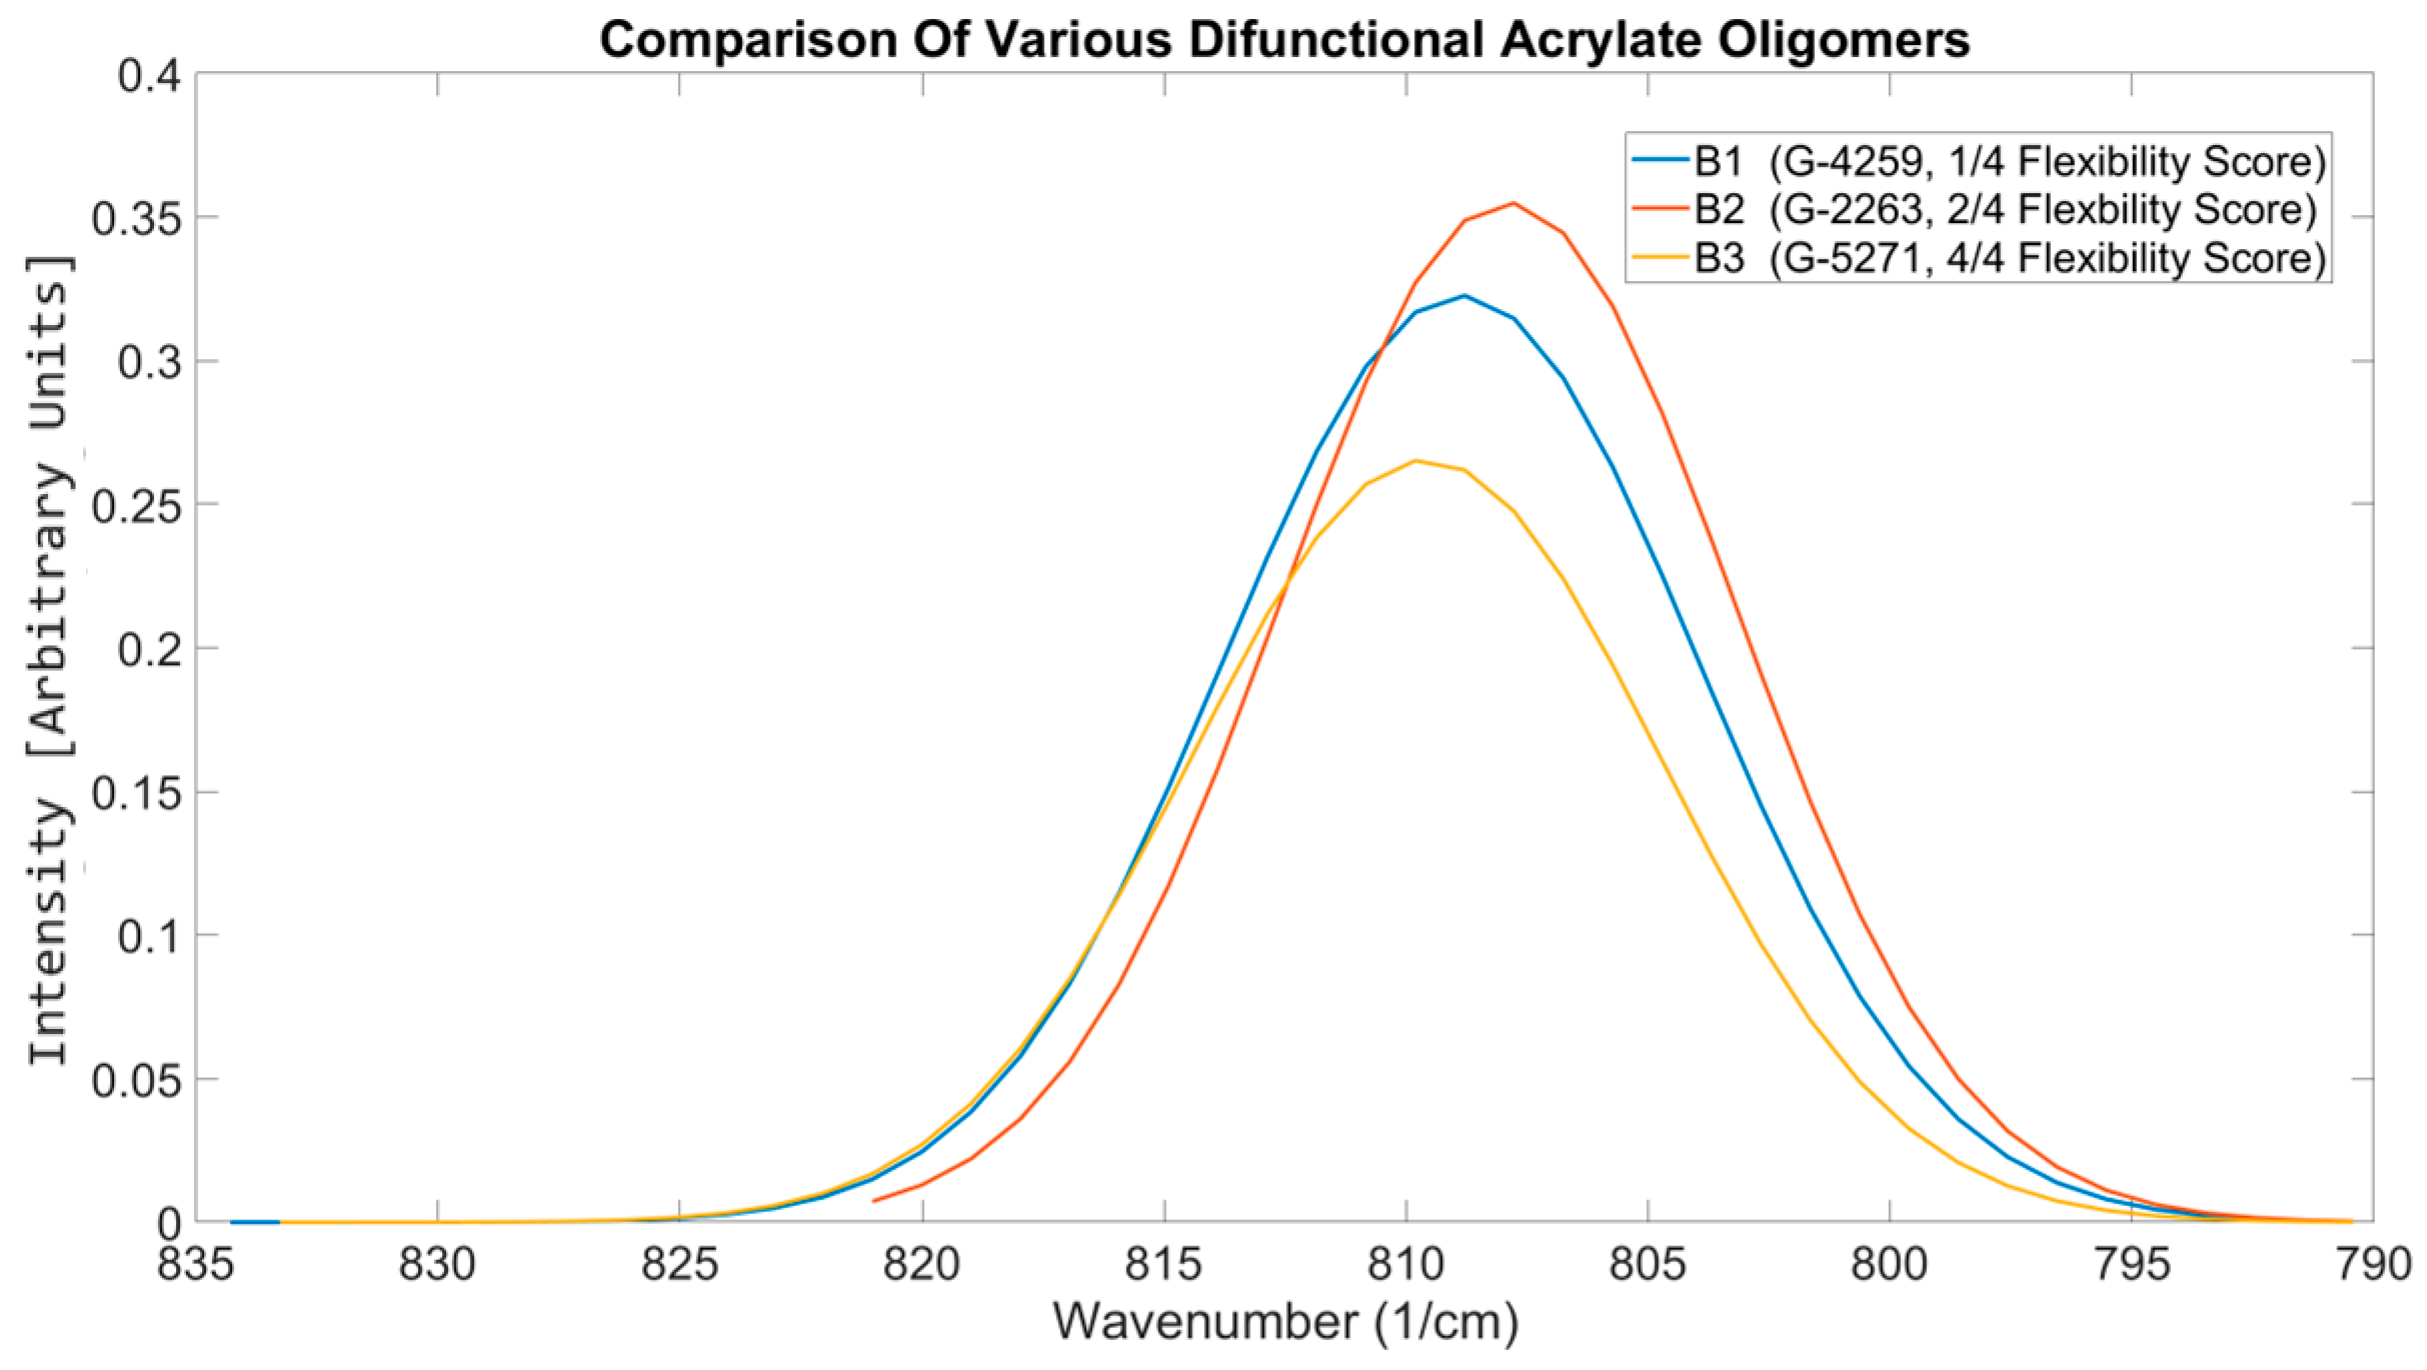
3.5.2. Differentiation Between Oligomer Types
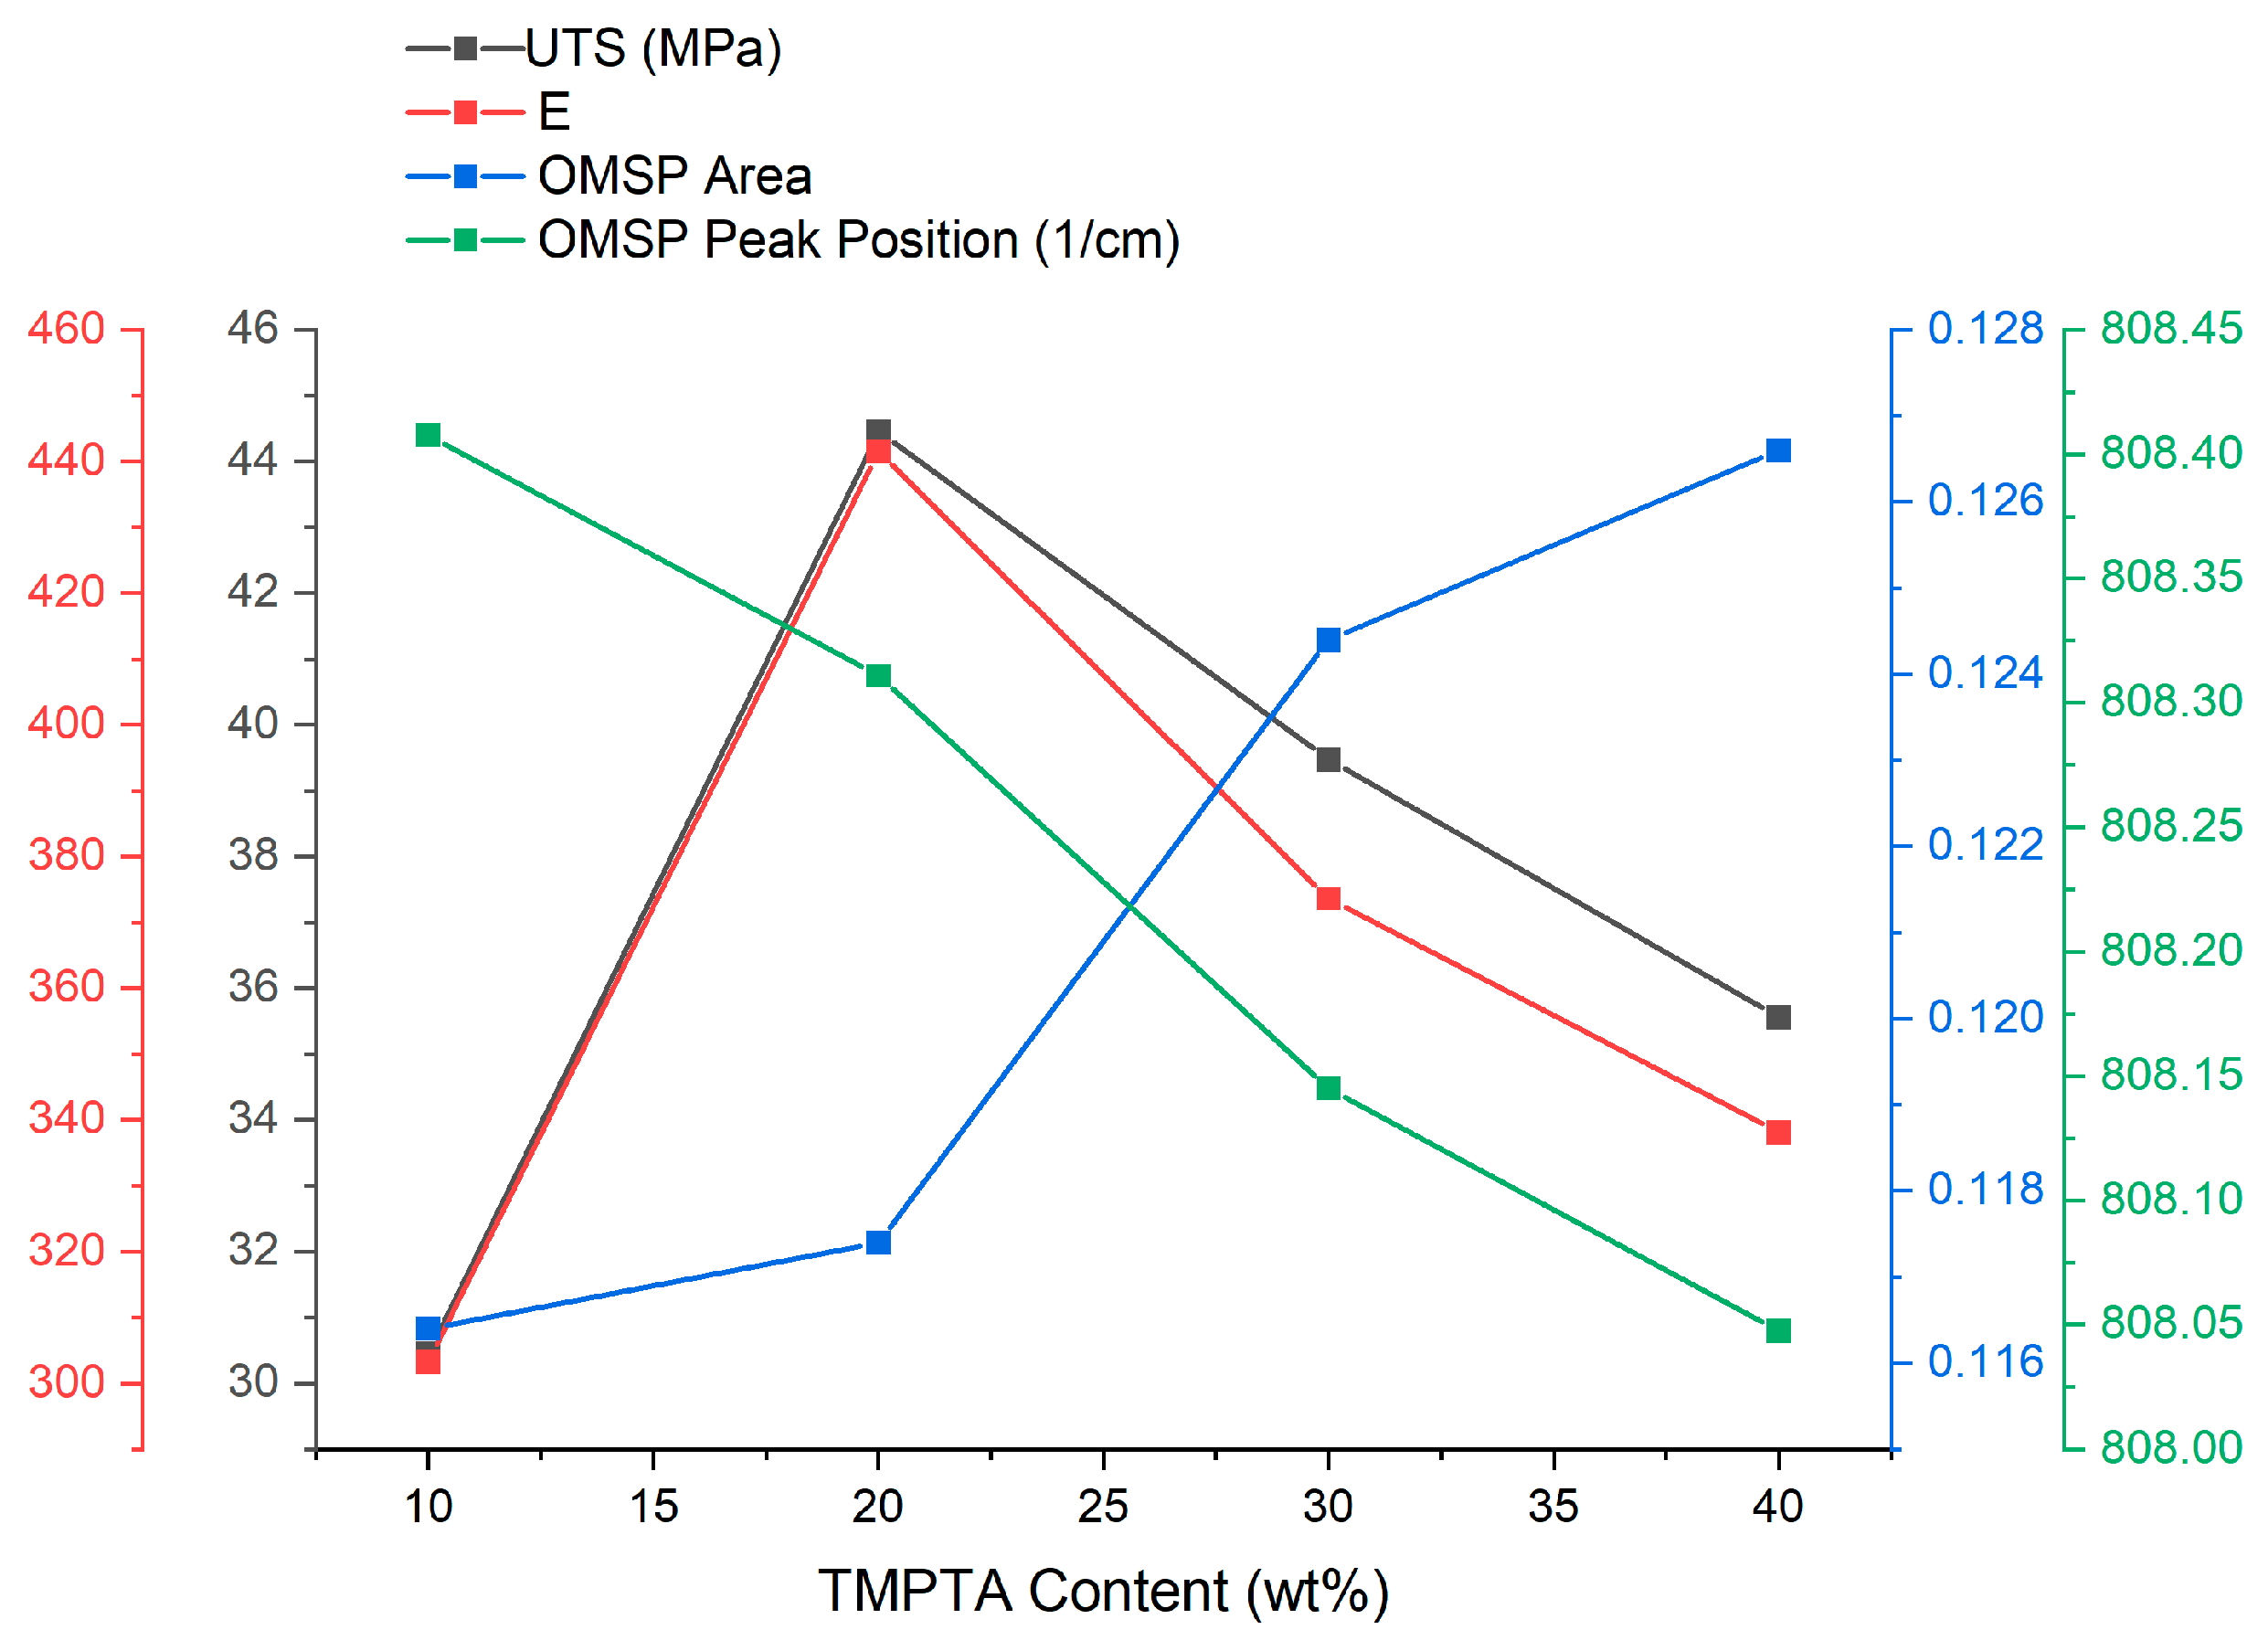
3.5.3. Detection of Excess Diluent
3.5.4. Detection of Non-Reactive Additives
3.6. Simulation of Photoresin Formulations
3.7. Summary of OMSP’s Capabilities
3.8. Future Developments
4. Conclusions
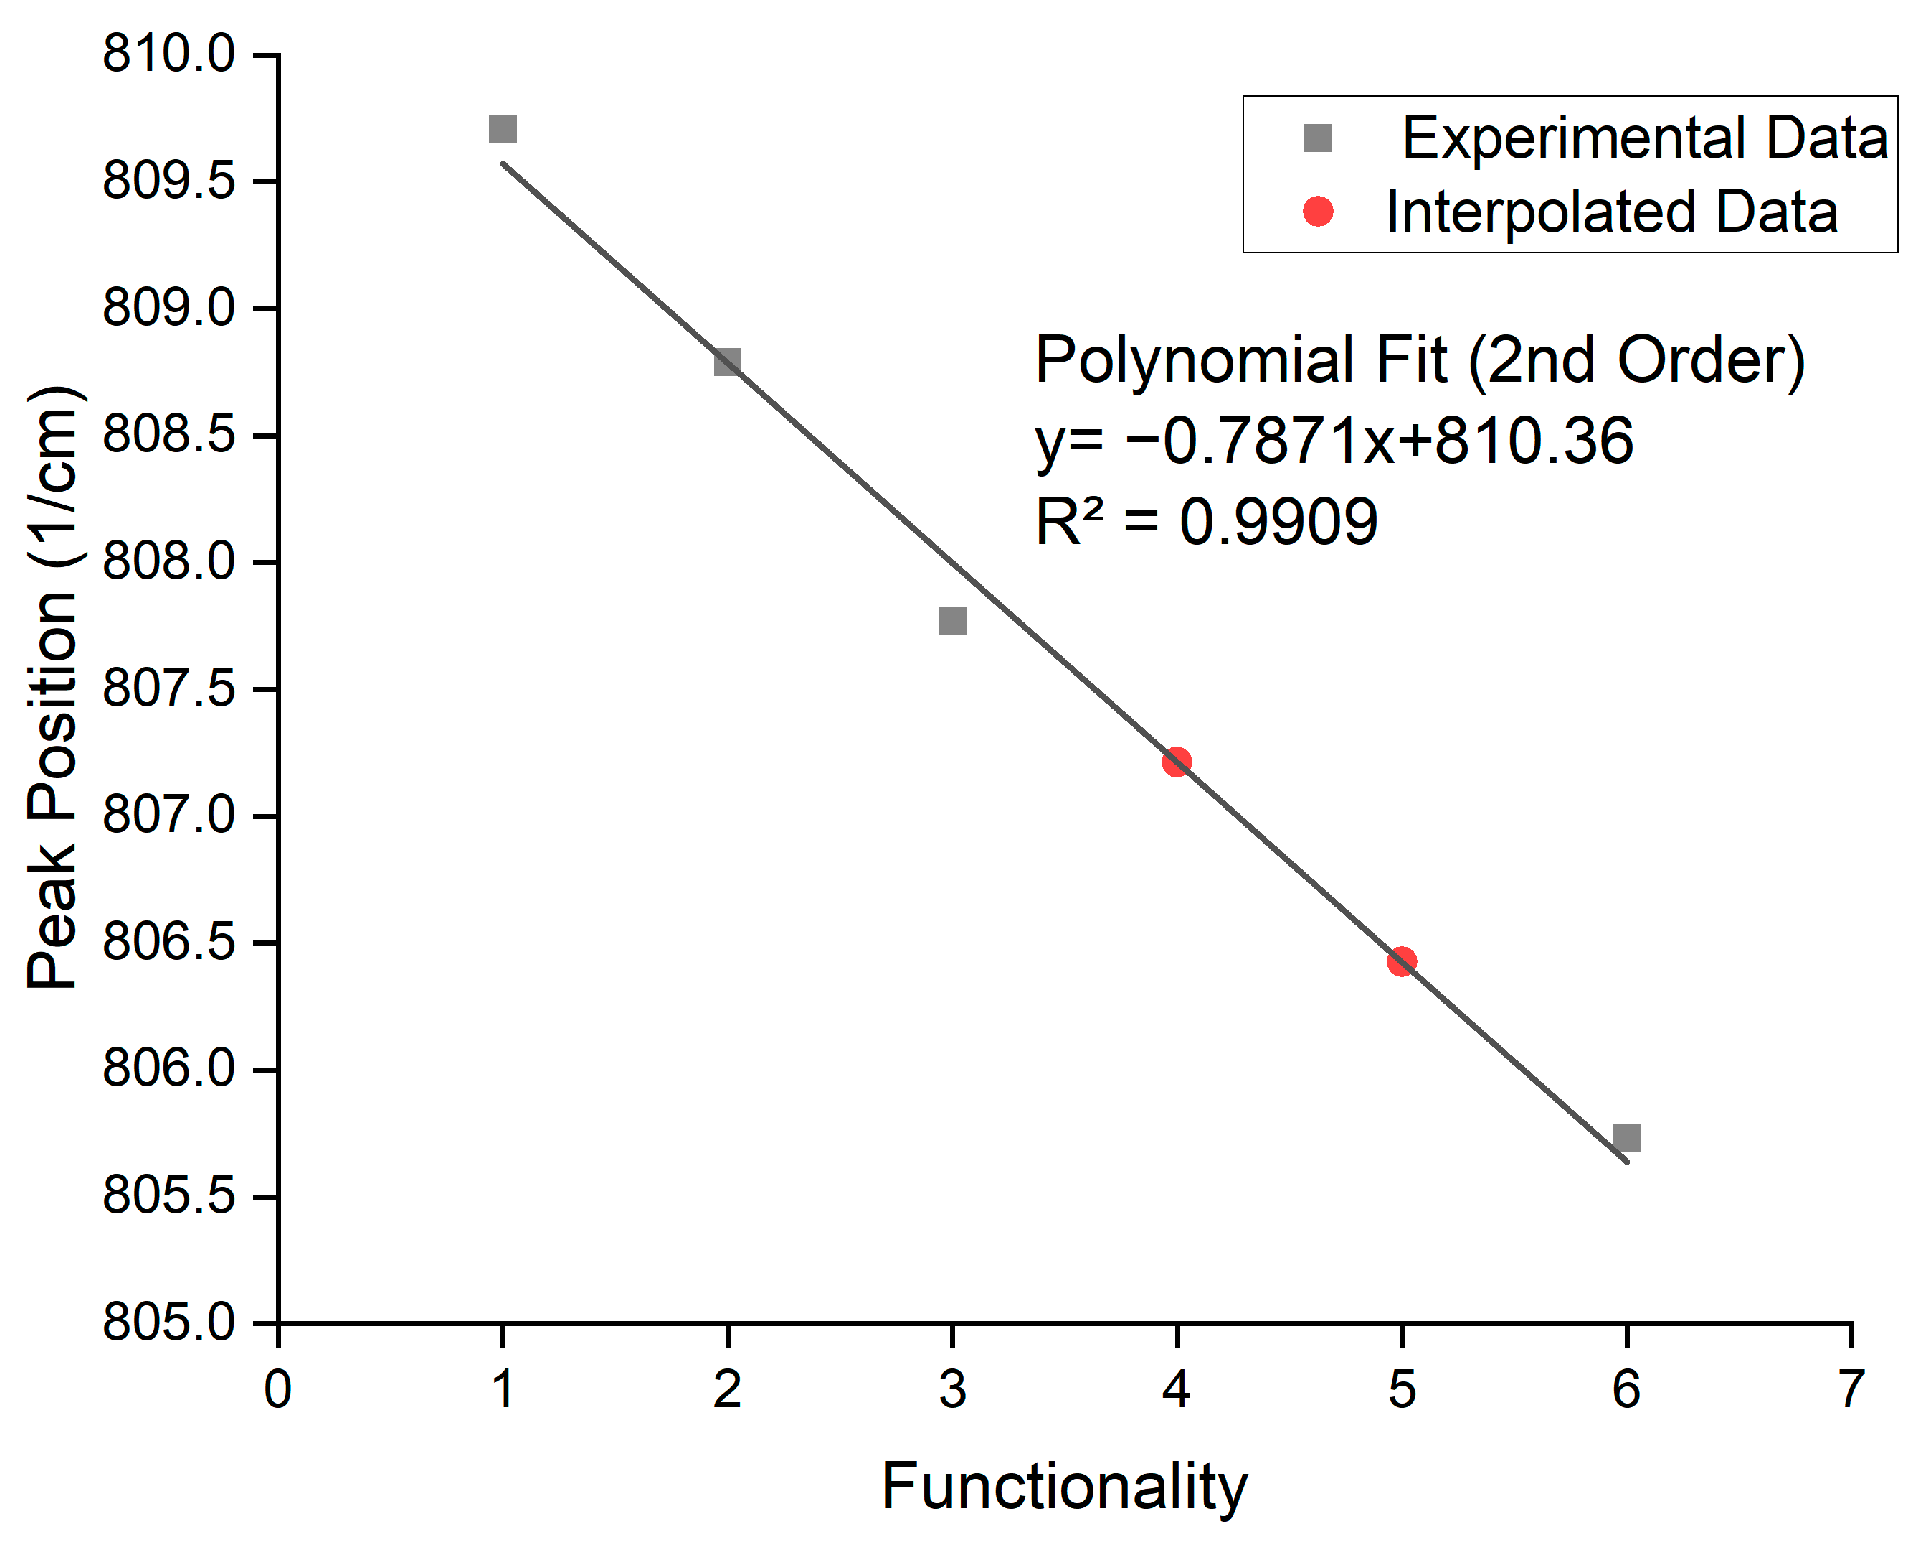
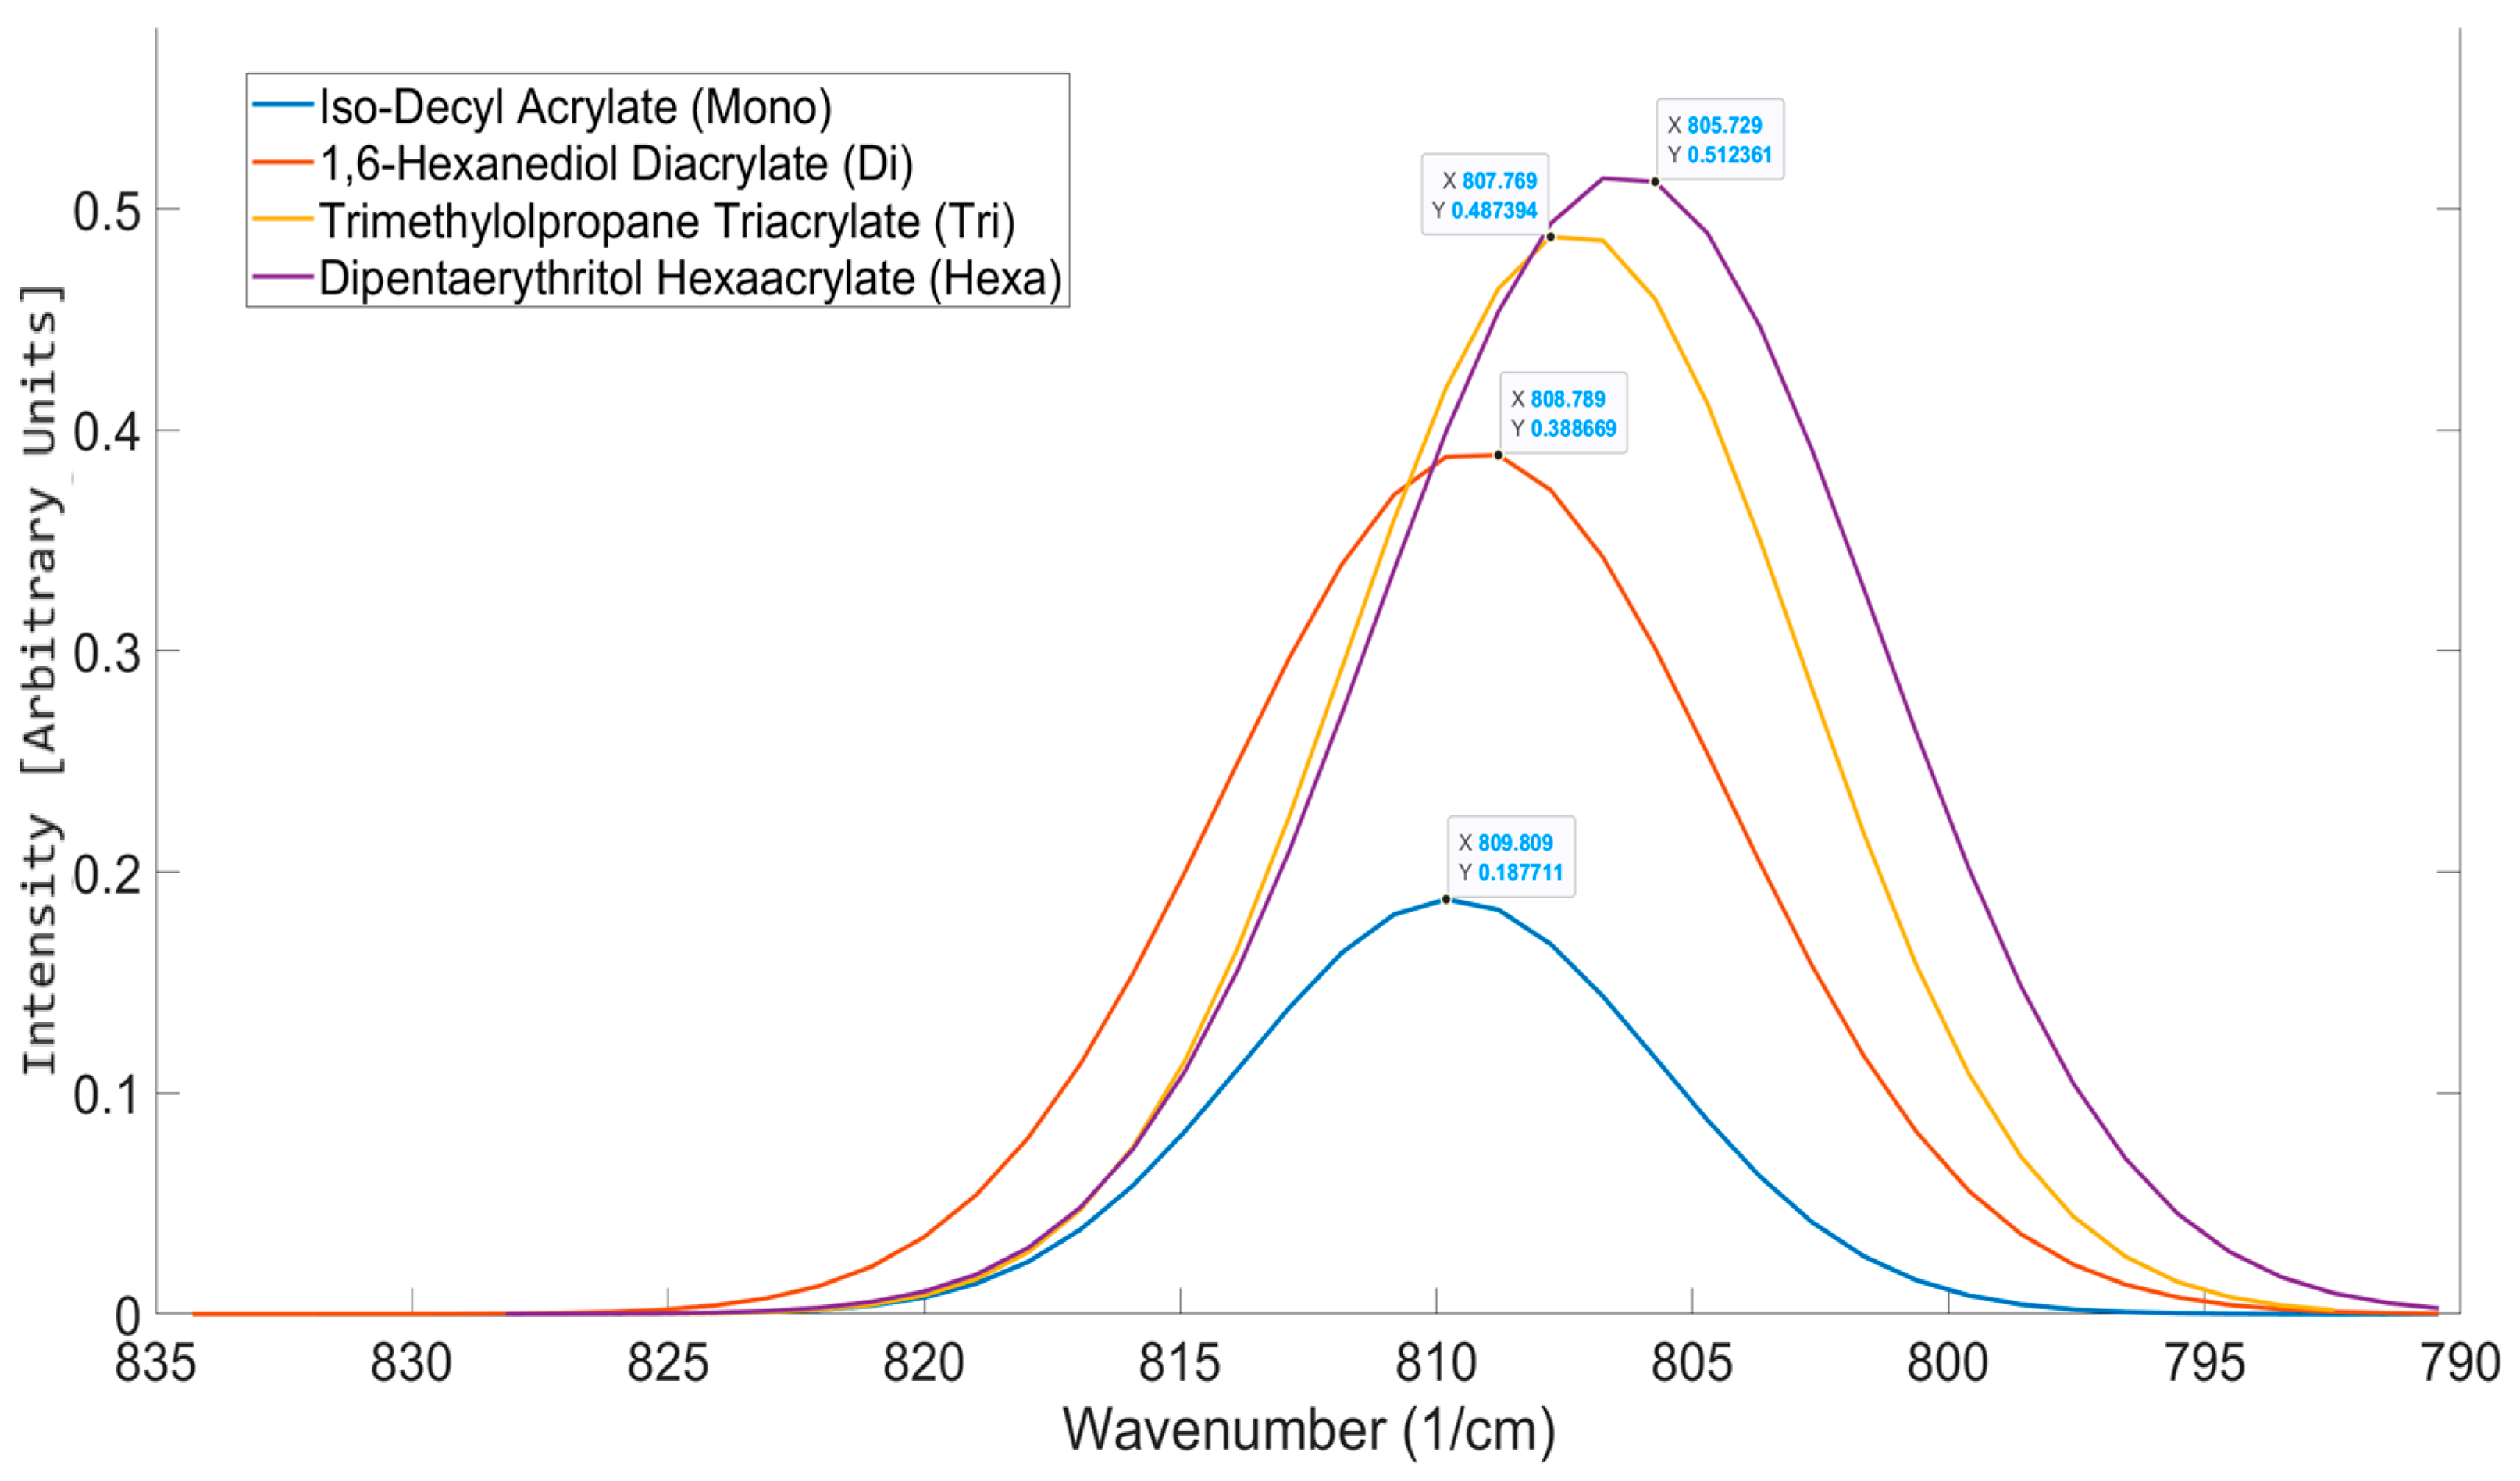
- Acrylate functionality can be linked to unique wavenumbers: The study of various functionality monomers showed that not all acrylates have the same reactivity. The higher the functionality of the acrylates, the lower the vibrational energy attributed to π bond delocalization. In doing so, a peak position could be assigned to different functionalities, making it possible for photoresin formulations to be assigned a pseudo-functionality.
- The abundance of alkenes for polymerization: Through the assessment of the peak area under the spectral peak used to identify alkene bonds specific to acrylate functional groups, the concentration of alkene bonds available for polymerization could be identified. The method could detect the impact of molecular complexity and voids caused by non-acrylate components, giving insight when studying the impact of filler on the conversion capabilities of a mixture.
- Shift in reactivity: The study was able to show how the addition of additives, such as dispersants of high acid value, impacted the reactivity of the photoresin through the shift in peak position and the subsequent increase in polymerization, validated through a conversion study.
- Computerized Mixing: The application of Gaussian mixing to this area of study was successful, allowing for the computerized mixing of acrylate formulations, showing a good likeness to experimentally mixed formulations with an average R2 of 0.9673 standard deviations of 0.04342), for all formulations, including ones containing methacrylates and non-acrylate reactive monomers.
Author Contributions
Funding
Institutional Review Board Statement
Data Availability Statement
Acknowledgments
Conflicts of Interest
References
- Lakkala, P.; Munnangi, S.R.; Bandari, S.; Repka, M. Additive manufacturing technologies with emphasis on stereolithography 3D printing in pharmaceutical and medical applications: A review. Int. J. Pharm. X 2023, 5, 100159. [Google Scholar] [CrossRef] [PubMed]
- Melentiev, R.; Melentieva, M.; Yu, N. Top 10 directions in lithography 3D printing. Bioprinting 2024, 40, e00343. [Google Scholar] [CrossRef]
- Konov, G.A.; Mazeeva, A.K.; Masaylo, D.V.; Razumov, N.G.; Popovich, A.A. Exploring 3D printing with magnetic materials:Types, applications, progress, and challenges. Izvestiya Vuzov. Poroshkovaya Metall. I Funktsional’nye Pokrytiya 2024, 18, 6–19. [Google Scholar] [CrossRef]
- Ozkan, B.; Sameni, F.; Bianchi, F.; Zarezadeh, H.; Karmel, S.; Engstrøm, D.S.; Sabet, E. 3D printing ceramic cores for investment casting of turbine blades, using LCD screen printers: The mixture design and characterization. J. Eur. Ceram. Soc. 2022, 42, 658–671. [Google Scholar] [CrossRef]
- Zhang, K.; Xie, C.; Wang, G.; He, R.; Ding, G.; Wang, M.; Dai, D.; Fang, D. High solid loading, low viscosity photosensitive Al2O3 slurry for stereolithography based additive manufacturing. Ceram. Int. 2019, 45, 203–208. [Google Scholar] [CrossRef]
- Qian, C.; Hu, K.; Lu, Z.; Li, P. Volume shrinkage and conversion rate of Al2O3 ceramic stereolithography suspension polymerized by ultraviolet light. Mater. Chem. Phys. 2021, 267, 124661. [Google Scholar] [CrossRef]
- Basar, O.; Veliyath, V.P.; Tarak, F.; Sabet, E. A Systematic Study on Impact of Binder Formulation on Green Body Strength of Vat-Photopolymerisation 3D Printed Silica Ceramics Used in Investment Casting. Polymers 2023, 15, 3141. [Google Scholar] [CrossRef]
- Okoruwa, L.; Sameni, F.; Borisov, P.; Sabet, E. 3D Printing Soft Magnet: Binder Study for Vat Photopolymerization of Ferrosilicon Magnetic Composites. Polymers 2023, 15, 3482. [Google Scholar] [CrossRef] [PubMed]
- Kim, H.J.; Czech, Z.; Bartkowiak, M.; Shim, G.S.; Kabatc, J.; Licbarski, A. Study of UV-initiated polymerization and UV crosslinking of acrylic monomers mixture for the production of solvent-free pressure-sensitive adhesive films. Polym. Test. 2022, 105, 107424. [Google Scholar] [CrossRef]
- Pathania, A.; Arya, R.K.; Ahuja, S. Crosslinked polymeric coatings: Preparation, characterization, and diffusion studies. Prog. Org. Coat. 2017, 105, 149–162. [Google Scholar] [CrossRef]
- Hasa, E.; Stansbury, J.W.; Guymon, C.A. Manipulation of crosslinking in photo-induced phase separated polymers to control morphology and thermo-mechanical properties. Polymer 2020, 202, 122699. [Google Scholar] [CrossRef]
- Choi, W.C.; Lee, W.K.; Ha, C.S. Low-viscosity UV-curable polyurethane acrylates containing dendritic acrylates for coating metal sheets. J. Coat. Technol. Res. 2019, 16, 377–385. [Google Scholar] [CrossRef]
- Feng, X.; Zhang, R.; Ren, G.; Yang, X.; Cui, X.; Liu, W.; Wang, D.; Hou, Y.; Wen, G.; Zhang, L.; et al. Vat photopolymerization-engaged fabrication of high-performance, complex Si3N4 implants under rapid debinding efficiency. Ceram. Int. 2024, 50, 17646–17656. [Google Scholar] [CrossRef]
- Pirman, T.; Ocepek, M.; Likozar, B. Radical Polymerization of Acrylates, Methacrylates, and Styrene: Biobased Approaches, Mechanism, Kinetics, Secondary Reactions, and Modeling. Ind. Eng. Chem. Res. 2021, 60, 9347–9367. [Google Scholar] [CrossRef]
- Vidakis, N.; Petousis, M.; Michailidis, N.; Kechagias, J.D.; Mountakis, N.; Argyros, A.; Boura, O.; Grammatikos, S. High-performance medical-grade resin radically reinforced with cellulose nanofibers for 3D printing. J. Mech. Behav. Biomed. Mater. 2022, 134, 105408. [Google Scholar] [CrossRef] [PubMed]
- Kaewpirom, S.; Kunwong, D. Curing behavior and cured film performance of easy-to-clean UV-curable coatings based on hybrid urethane acrylate oligomers. J. Polym. Res. 2012, 19, 9995. [Google Scholar] [CrossRef]
- Daéid, N.N. FORENSIC SCIENCES|Systematic Drug Identification. In Encyclopedia of Analytical Science, 2nd ed.; Elsevier: Amsterdam, The Netherlands, 2005; pp. 471–480. [Google Scholar] [CrossRef]
- Binish, M.B.; Binu, P.; Gopikrishna, V.G.; Mohan, M. Potential of anaerobic bacteria in bioremediation of metal-contaminated marine and estuarine environment. In Microbial Biodegradation and Bioremediation: Techniques and Case Studies for Environmental Pollution; Elsevier: Amsterdam, The Netherlands, 2022; pp. 305–326. [Google Scholar] [CrossRef]
- Chen, Y.; Zou, C.; Mastalerz, M.; Hu, S.; Gasaway, C.; Tao, X. Applications of Micro-Fourier Transform Infrared Spectroscopy (FTIR) in the Geological Sciences—A Review. Int. J. Mol. Sci. 2015, 16, 30223–30250. [Google Scholar] [CrossRef]
- De Aragão, B.J.G.; Messaddeq, Y. Peak separation by derivative spectroscopy applied to ftir analysis of hydrolized silica. J. Braz. Chem. Soc. 2008, 19, 1582–1594. [Google Scholar] [CrossRef]
- Sadat, A.; Joye, I.J. Peak Fitting Applied to Fourier Transform Infrared and Raman Spectroscopic Analysis of Proteins. Appl. Sci. 2020, 10, 5918. [Google Scholar] [CrossRef]
- Pereira, S.V.; Colombo, F.B.; de Freitas, L.A.P. Ultrasound influence on the solubility of solid dispersions prepared for a poorly soluble drug. Ultrason. Sonochem 2016, 29, 461–469. [Google Scholar] [CrossRef] [PubMed]
- ASTM D638-22; Standard Test Method for Tensile Properties of Plastics 1. ASTM: West Conshohocken, PA, USA, 2022.
- ASTM D2240-21; Standard Test Method for Rubber Property-Durometer Hardness 1. ASTM: West Conshohocken, PA, USA, 2021.
- Sameni, F.; Ozkan, B.; Zarezadeh, H.; Karmel, S.; Engstrøm, D.S.; Sabet, E. Hot Lithography Vat Photopolymerization 3D Printing: Vat Temperature vs. Mixture Design. Polymers 2022, 14, 2988. [Google Scholar] [CrossRef] [PubMed]
- Jain, V.; Biesinger, M.C.; Linford, M.R. The Gaussian-Lorentzian Sum, Product, and Convolution (Voigt) functions in the context of peak fitting X-ray photoelectron spectroscopy (XPS) narrow scans. Appl. Surf. Sci. 2018, 447, 548–553. [Google Scholar] [CrossRef]
- Ciris, P. Information theoretic evaluation of Lorentzian, Gaussian, Voigt, and symmetric alpha-stable models of reversible transverse relaxation in cervical cancer in vivo at 3 T. Magn. Reson. Mater. Phys. Biol. Med. 2023, 36, 119–133. [Google Scholar] [CrossRef]
- Chai, T.; Draxler, R.R. Root mean square error (RMSE) or mean absolute error (MAE)?—Arguments against avoiding RMSE in the literature. Geosci. Model. Dev. 2014, 7, 1247–1250. [Google Scholar] [CrossRef]
- Farooq, M.T.; Jiarasuksakun, T.; Kaemawichanurat, P. Entropy analysis of nickel(II) porphyrins network via curve fitting techniques. Sci. Rep. 2023, 13, 17317. [Google Scholar] [CrossRef] [PubMed]
- Delgadoi, A.N.H.S.; Young, A.M. Methacrylate peak determination and selection recommendations using ATR-FTIR to investigate polymerization of dental methacrylate mixtures. PLoS ONE 2021, 16, e0252999. [Google Scholar] [CrossRef]
- Noor, P.; Khanmohammadi, M.; Roozbehani, B.; Bagheri Garmarudi, A. Evaluation of ATR-FTIR spectrometry in the fingerprint region combined with chemometrics for simultaneous determination of benzene, toluene, and xylenes in complex hydrocarbon mixtures. Monatshefte Für Chem.-Chem. Mon. 2018, 149, 1341–1347. [Google Scholar] [CrossRef]
- Ibnaouf, K.H.; Elzupir, A.O.; AlSalhi, M.S.; Alaamer, A.S. Influence of functional groups on the photophysical properties of dimethylamino chalcones as laser dyes. Opt. Mater. 2018, 76, 216–221. [Google Scholar] [CrossRef]
- Kannan, P.P.; Karthick, N.K.; Mahendraprabu, A.; Shanmugam, R.; Elangovan, A.; Arivazhagan, G. Red/blue shifting hydrogen bonds in acetonitrile-dimethyl sulphoxide solutions: FTIR and theoretical studies. J. Mol. Struct. 2017, 1139, 196–201. [Google Scholar] [CrossRef]
- Edwards, H.G.M.; Vandenabeele, P.; Colomban, P. Theory of Raman Spectroscopy and Raman Instrumentation; Springer International Publishing: Cham, Switzerland, 2023; pp. 19–41. [Google Scholar] [CrossRef]
- Schlotter, N.E. Raman Spectroscopy. In Comprehensive Polymer Science and Supplements; Pergamon: Amsterdam, The Netherlands, 1989; pp. 469–497. [Google Scholar] [CrossRef]
- Dimitrova, M.; Sundholm, D. Current density, current-density pathways, and molecular aromaticity. In Aromaticity: Modern Computational Methods and Applications; Elsevier: Amsterdam, The Netherlands, 2021; pp. 155–194. [Google Scholar] [CrossRef]
- Van de Voorde, K.M.; Kozawa, S.K.; Mack, J.A.; Thompson, C.B. Influence of Cross-Linker Functionality and Photoinitiator Loading on Network Connectivity and Actuation in 3D-Printed Model Thermosets. ACS Appl. Polym. Mater. 2024, 6, 3918–3929. [Google Scholar] [CrossRef]
- Torii, H. Delocalized electrons in infrared intensities. J. Mol. Struct. 2014, 1056–1057, 84–96. [Google Scholar] [CrossRef]
- Elliott, J.E.; Lovell, L.G.; Bowman, C.N. Primary cyclization in the polymerization of bis-GMA and TEGDMA: A modeling approach to understanding the cure of dental resins. Dent. Mater. 2001, 17, 221–229. [Google Scholar] [CrossRef] [PubMed]
- Lovell, L.G.; Berchtold, K.A.; Elliott, J.E.; Lu, H.; Bowman, C.N. Understanding the kinetics and network formation of dimethacrylate dental resins. Polym. Adv. Technol. 2001, 12, 335–345. [Google Scholar] [CrossRef]
- Fei, J.; Rong, Y.; Du, X.; Li, H.; Zhang, X.; Cui, P.; Huang, X. Vat photopolymerization printing of strong tear-resistance and stretchable polyurethane elastomer for highly sensitive strain sensors. Polym. Compos. 2024, 45, 2615–2628. [Google Scholar] [CrossRef]
- Fugolin, A.P.; Dobson, A.; Mbiya, W.; Navarro, O.; Ferracane, J.L.; Pfeifer, C.S. Use of (meth)acrylamides as alternative monomers in dental adhesive systems. Dent. Mater. 2019, 35, 686. [Google Scholar] [CrossRef] [PubMed]
- Maruo, Y.; Yoshihara, K.; Irie, M.; Nagaoka, N.; Matsumoto, T.; Minagi, S. Does Multifunctional Acrylate’s Addition to Methacrylate Improve Its Flexural Properties and Bond Ability to CAD/CAM PMMA Block? Materials 2022, 15, 7564. [Google Scholar] [CrossRef]
- Drobny, J.G. Electron Beam Processing of Commercial Polymers, Monomers, and Oligomers. In Ionizing Radiation and Polymers; William Andrew Publishing: Norwich, NY, USA, 2013; pp. 101–147. [Google Scholar] [CrossRef]
- De Camargo, I.L.; Morais, M.M.; Fortulan, C.A.; Branciforti, M.C. A review on the rheological behavior and formulations of ceramic suspensions for vat photopolymerization. Ceram. Int. 2021, 47, 11906–11921. [Google Scholar] [CrossRef]
- Arici, K.; Altınoz, D.E.; Cavusoglu, M.; Diken, S. Crystal structure, IR and NMR spectra of (E)-2 methoxy-4-(2-morpholinovinyl)phenol molecule and its DFT calculations. J. Mol. Struct. 2023, 1275, 134669. [Google Scholar] [CrossRef]
- Naka, K. Monomers, Oligomers, Polymers, and Macromolecules (Overview). In Encyclopedia of Polymeric Nanomaterials; Springer: Berlin/Heidelberg, Germany, 2014; pp. 1–6. [Google Scholar] [CrossRef]
- RAHN GmbH RAHN USA Corp RAHN Trading RA. MIRAMER M216 Technical Data Sheet Diluents; Rahn AG: Zürich, Switzerland, 2023. [Google Scholar]
- RAHN GmbH RAHN USA Corp RAHN Trading RA. MIRAMER M222 Technical Data Sheet Diluents; Rahn AG: Zürich, Switzerland, 2023. [Google Scholar]
- Van Canneyt, K.; Verdonck, P. Mechanics of Biofluids in Living Body. Compr. Biomed. Phys. 2014, 10, 39–53. [Google Scholar] [CrossRef]
- Mauriello, J.; Maury, R.; Guillaneuf, Y.; Gigmes, D. 3D/4D Printing of Polyurethanes by Vat Photopolymerization. Adv. Mater. Technol. 2023, 8, 2300366. [Google Scholar] [CrossRef]
- Kobayashi, M.; Saitoh, M.; Ishida, K.; Yachi, H. Viscosity Properties and Molecular Structure of Lube Base Oil Prepared from Fischer-Tropsch Waxes. J. Jpn. Pet. Inst. 2005, 48, 365–372. [Google Scholar] [CrossRef]
- Trollsås, M.; Hedrick, J.L. Dendrimer-like Star Polymers. J. Am. Chem. Soc. 1998, 120, 4644–4651. [Google Scholar] [CrossRef]
- Cowman, M.K. Hyaluronan and Hyaluronan Fragments. Adv. Carbohydr. Chem. Biochem. 2017, 74, 1–59. [Google Scholar] [CrossRef] [PubMed]
- Chaikumpollert, O.; Yamamoto, Y.; Suchiva, K.; Kawahara, S. Mechanical properties and cross-linking structure of cross-linked natural rubber. Polym. J. 2012, 44, 772–777. [Google Scholar] [CrossRef]
- Medellin, A.; Du, W.; Miao, G.; Zou, J.; Pei, Z.; Ma, C. Vat photopolymerization 3d printing of nanocomposites: A literature review. J. Micro Nanomanuf. 2019, 7, 031006. [Google Scholar] [CrossRef]
- Ballester-Bayarri, L.; Pascal, A.; Ayestaran, J.; Gonzalez, A.; Ballard, N.; Aguirresarobe, R. 3D Printing of Vinylogous Urethane-Based Methacrylic Covalent Adaptable Networks by Vat Photopolymerization. ACS Appl. Polym. Mater. 2024, 6, 2594–2603. [Google Scholar] [CrossRef]
- RAHN GmbH RAHN USA Corp RAHN Trading RA. GENOMER* 4259 Technical Data Sheet Urethane Acrylate; Rahn AG: Zürich, Switzerland, 2019. [Google Scholar]
- RAHN GmbH RAHN USA Corp RAHN Trading RA. GENOMER* 2263 Technical Data Sheet Epoxy Acrylate; Rahn AG: Zürich, Switzerland, 2019. [Google Scholar]
- RAHN GmbH RAHN USA Corp RAHN Trading RA. GENOMER* 5271 Technical Data Sheet Oligoamine; Rahn AG: Zürich, Switzerland, 2020. [Google Scholar]
- Huang, J.; Fu, P.; Li, W.; Xiao, L.; Chen, J.; Nie, X. Influence of crosslinking density on the mechanical and thermal properties of plant oil-based epoxy resin. RSC Adv. 2022, 12, 23048–23056. [Google Scholar] [CrossRef] [PubMed]
- Zou, W.; Lin, X.; Terentjev, E.M. Amine-Acrylate Liquid Single Crystal Elastomers Reinforced by Hydrogen Bonding. Adv. Mater. 2021, 33, 2101955. [Google Scholar] [CrossRef] [PubMed]
- Pongwisuthiruchte, A.; Aumnate, C.; Potiyaraj, P. Tailoring of Silicone Urethane Methacrylate Resin for Vat Photopolymerization-Based 3D Printing of Shape Memory Polymers. ACS Omega 2024, 9, 2884–2895. [Google Scholar] [CrossRef] [PubMed]
- Pfaffinger, M. Hot Lithography—New Possibilities in Polymer 3D Printing. Optik Photonik 2018, 13, 99–101. [Google Scholar] [CrossRef]
- Mamba’udin, A.; Handayani, M.; Triawan, F.; Rahmayanti, Y.D.; Muflikhun, M.A. Excellent Characteristics of Environmentally Friendly 3D-Printed Nasopharyngeal Swabs for Medical Sample Collection. Polymers 2023, 15, 3363. [Google Scholar] [CrossRef]
- Pagac, M.; Hajnys, J.; Ma, Q.P.; Jancar, L.; Jansa, J.; Stefek, P.; Mesicek, J. A Review of Vat Photopolymerization Technology: Materials, Applications, Challenges, and Future Trends of 3D Printing. Polymers 2021, 13, 598. [Google Scholar] [CrossRef]
- Zhang, K.; Meng, Q.; Qu, Z.; He, R. A review of defects in vat photopolymerization additive-manufactured ceramics: Characterization, control, and challenges. J. Eur. Ceram. Soc. 2024, 44, 1361–1384. [Google Scholar] [CrossRef]
- Liu, D.M. Influence of dispersant on powders dispersion and properties of zirconia green compacts. Ceram. Int. 2000, 26, 279–287. [Google Scholar] [CrossRef]
- Shen, M.; Fu, R.; Liu, H.; Liu, Y.; Hu, Y.; Zhang, Y.; Liu, X.; Li, M.; Zhao, Z. Photosensitive Si3N4 slurry with combined benefits of low viscosity and large cured depth for digital light processing 3D printing. J. Eur. Ceram. Soc. 2023, 43, 881–888. [Google Scholar] [CrossRef]
- Sokola, P.; Kalina, M.; Smilek, J.; Ptáček, P.; Krouská, J.; Salamon, D.; Spusta, T. Kinetic stability and rheological properties of photosensitive zirconia suspensions for DLP printing. Ceram. Int. 2023, 49, 18502–18509. [Google Scholar] [CrossRef]
- De Lisi, M.; Shu, C.; Attia, U.M.; Essa, K. DLP of Translucent Alumina: In-Depth Investigation on Slurry Development and Debinding Regimes. Machines 2023, 11, 321. [Google Scholar] [CrossRef]
- Li, X.; Su, H.; Dong, D.; Jiang, H.; Liu, Y.; Shen, Z.; Guo, Y.; Hao, S.; Zhang, Z.; Guo, M. New approach to preparing near zero shrinkage alumina ceramic cores with excellent properties by vat photopolymerization. J. Mater. Sci. Technol. 2024, 193, 61–72. [Google Scholar] [CrossRef]
- Asada, M.; Tanaka, H.; Suwa, Y.; Osawa, S.; Otsuka, H. Improved pigment dispersibility in thick inks based on increased molecular dispersion of poorly water-soluble block copolymers. Dye. Pigment. 2024, 226, 112140. [Google Scholar] [CrossRef]
- Yusa, S.I. Development and application of pH-responsive polymers. Polym. J. 2022, 54, 235–242. [Google Scholar] [CrossRef]
- Wang, C.; Gong, H.; Wei, W.; Wu, H.; Luo, X.; Li, N.; Liang, J.; Khan, S.B.; Xiao, C.; Lu, B.; et al. Vat photopolymerization of low-titanium lunar regolith simulant for optimal mechanical performance. Ceram. Int. 2022, 48, 29752–29762. [Google Scholar] [CrossRef]
- Guven, E.; Karpat, Y.; Cakmakci, M. Improving the dimensional accuracy of micro parts 3D printed with projection-based continuous vat photopolymerization using a model-based grayscale optimization method. Addit. Manuf. 2022, 57, 102954. [Google Scholar] [CrossRef]
- Wang, Y.; Chen, W.; Zhang, J.; Dong, T.; Shan, G.; Chi, X. Efficient volume exploration using the gaussian mixture model. IEEE Trans. Vis. Comput. Graph. 2011, 17, 1560–1573. [Google Scholar] [CrossRef]
- Bilmes, J.A. A Gentle Tutorial of the EM Algorithm and Its Application to Parameter Estimation for Gaussian Mixture and Hidden Markov Models. 1998. Available online: https://www.cs.cmu.edu/~aarti/Class/10701/readings/gentle_tut_HMM.pdf (accessed on 12 May 2024).
- World Health Organization. Sustainable Development Goals; World Health Organization: Geneva, Switzerland, 2015; Available online: https://www.who.int/europe/about-us/our-work/sustainable-development-goals (accessed on 23 September 2024).


| Material Sourced from Rahn | Identifier | Functionality | Viscosity (mPa·s) | Molecular Weight (g/mol) |
|---|---|---|---|---|
| Dipentaerythritol Hexaacrylate | DPHA | 6 | 7000 | 578 |
| Trimethylolpropane triacrylate | TMPTA | 3 | 110 | 296 |
| Trimethylolpropane trimethacrylate | TMPTMA | 3 | 55 | 338 |
| Aliphatic Urethane Acrylate | G-4259 | 2 | 11,000 | - |
| Aliphatic Urethane Acrylate | G-4293 | 2 | 25,000 | - |
| Amine Acrylate | G-5271 | 2 | 1200 | - |
| Epoxy Acrylate | G-2263 | 2 | 30,000 | - |
| Aliphatic Urethane Methacrylate | Primary | 2 | 10,000 | - |
| Dipropylene Glycol Diacrylate | DPGDA | 2 | 15 | 242 |
| 1,6-Hexanediol diacrylate | HDDA | 2 | 10 | 226 |
| Neopentyl Glycol Propoxylate Diacrylate | NPG(PO)2DA | 2 | 15 | 328 |
| Polyethylene Glycol(200) Diacrylate | PEG(200)DA | 2 | 25 | 308 |
| Polyethylene Glycol(300) Diacrylate | PEG(300)DA | 2 | 50 | 408 |
| Isobornyl Methacrylate | IBOMA | 1 | 8 | 222 |
| Isobornyl acrylate | IBOA | 1 | 8 | 208 |
| 4-Acryloylmorpholine | ACMO | 1 | 12 | 141 |
| Cyclic Trimethylolpropane Formal Acrylate | CTFA | 1 | 15 | 200 |
| ID | UA | Primary | AA | EA | DPHA | HDDA | DPGDA | NPG(PO)2DA | IBOMA | IBOA | CTFA | ACMO | IDA | PEG200DA | PEG300DA | TMPTA | TMPTMA | BYK 111 |
|---|---|---|---|---|---|---|---|---|---|---|---|---|---|---|---|---|---|---|
| M.1 | 0.5 | 0.3 | 0.2 | |||||||||||||||
| M.2 | 0.5 | 0.3 | 0.2 | |||||||||||||||
| M.3 | 0.4 | 0.1 | 0.5 | |||||||||||||||
| M.4 | 0.4 | 0.1 | 0.5 | |||||||||||||||
| C.1 | 0.8 | 0.1 | ||||||||||||||||
| C.2 | 0.7 | 0.2 | ||||||||||||||||
| C.3 | 0.6 | 0.3 | ||||||||||||||||
| C.4 | 0.6 | 0.4 | ||||||||||||||||
| C.5 | 0.5 | 0.5 | ||||||||||||||||
| C.6 | 0.8 | 0.1 | ||||||||||||||||
| C.7 | 0.7 | 0.2 | ||||||||||||||||
| C.8 | 0.6 | 0.3 | ||||||||||||||||
| C.9 | 0.6 | 0.4 | ||||||||||||||||
| C.10 | 0.5 | 0.5 | ||||||||||||||||
| A.1 | 0.4 | 0.1 | 0.5 | |||||||||||||||
| A.2 | 0.4 | 0.1 | 0.5 | |||||||||||||||
| B.1 | 0.5 | 0.1 | 0.4 | |||||||||||||||
| B.2 | 0.5 | 0.1 | 0.4 | |||||||||||||||
| B.3 | 0.5 | 0.1 | 0.4 | |||||||||||||||
| D.1 | 0.5 | 0.1 | 0.4 | |||||||||||||||
| D.2 | 0.5 | 0.2 | 0.3 | |||||||||||||||
| D.3 | 0.5 | 0.3 | 0.2 | |||||||||||||||
| D.4 | 0.5 | 0.4 | 0.1 | |||||||||||||||
| E.1 | 0.5 | 0.1 | 0.4 | 1 | ||||||||||||||
| E.2 | 0.5 | 0.1 | 0.4 | 3 | ||||||||||||||
| E.3 | 0.5 | 0.1 | 0.4 | 5 | ||||||||||||||
| F.1 | 0.9 | 0.1 | ||||||||||||||||
| F.2 | 0.8 | 0.2 | ||||||||||||||||
| F.3 | 0.64 | 0.36 | ||||||||||||||||
| F.4 | 0.56 | 0.44 | ||||||||||||||||
| F.5 | 0.50 | 0.50 | ||||||||||||||||
| F.6 | 0.45 | 0.55 | ||||||||||||||||
| F.7 | 0.41 | 0.59 | ||||||||||||||||
| F.8 | 0.29 | 0.71 | ||||||||||||||||
| F.9 | 0.20 | 0.80 |
| Parameter | Definition |
|---|---|
| File Name | The same name given to the imported file is stored and displayed to assign results to a specific dataset. |
| Fit Type | Displays whether Gaussian, Lorentzian, or the Linear Combination Pseudo-Voigt method was found to be the best fit. |
| AIC | The Akaike Information Criterion output for the selected fit type. A larger negative number indicates a better fit. |
| RMSE | The root mean square error is determined for the selected fit type. The smaller the value, the better the fit. |
| Peak Position | Shows where the sample’s maximum amplitude is located on the spectrum. This can indicate the reactivity of the sample. A higher degree of red spectral shift is an indication of increased reactivity due to changes in the molecular structure/intermolecular forces influencing the energy level of the alkene bond of interest. |
| OMSP Area | The normalized peak area of the sample indicates the density of alkene bonds in a particular sample. |
| Pseudo-Functionality | A functionality that is given to photoresin formulations based on their peak position despite being a multifunctionality mixture. |
| ΨOMSP Area | The peak area is determined by using the pseudo-functionality home position to calculate the density of alkene bonds in a sample available for photopolymerization. |
| Aspect Ratio | An insightful parameter that displays information on whether the OMSP output is of a tall or narrow shape, indicating many acrylates in the system vibrating at the same energy level or a shorter, broader peak, suggesting that there is a wide spread of acrylates. |
| Functionality | Chemical Name |
|---|---|
| 1 | Iso-Decyl acrylate (IDA) |
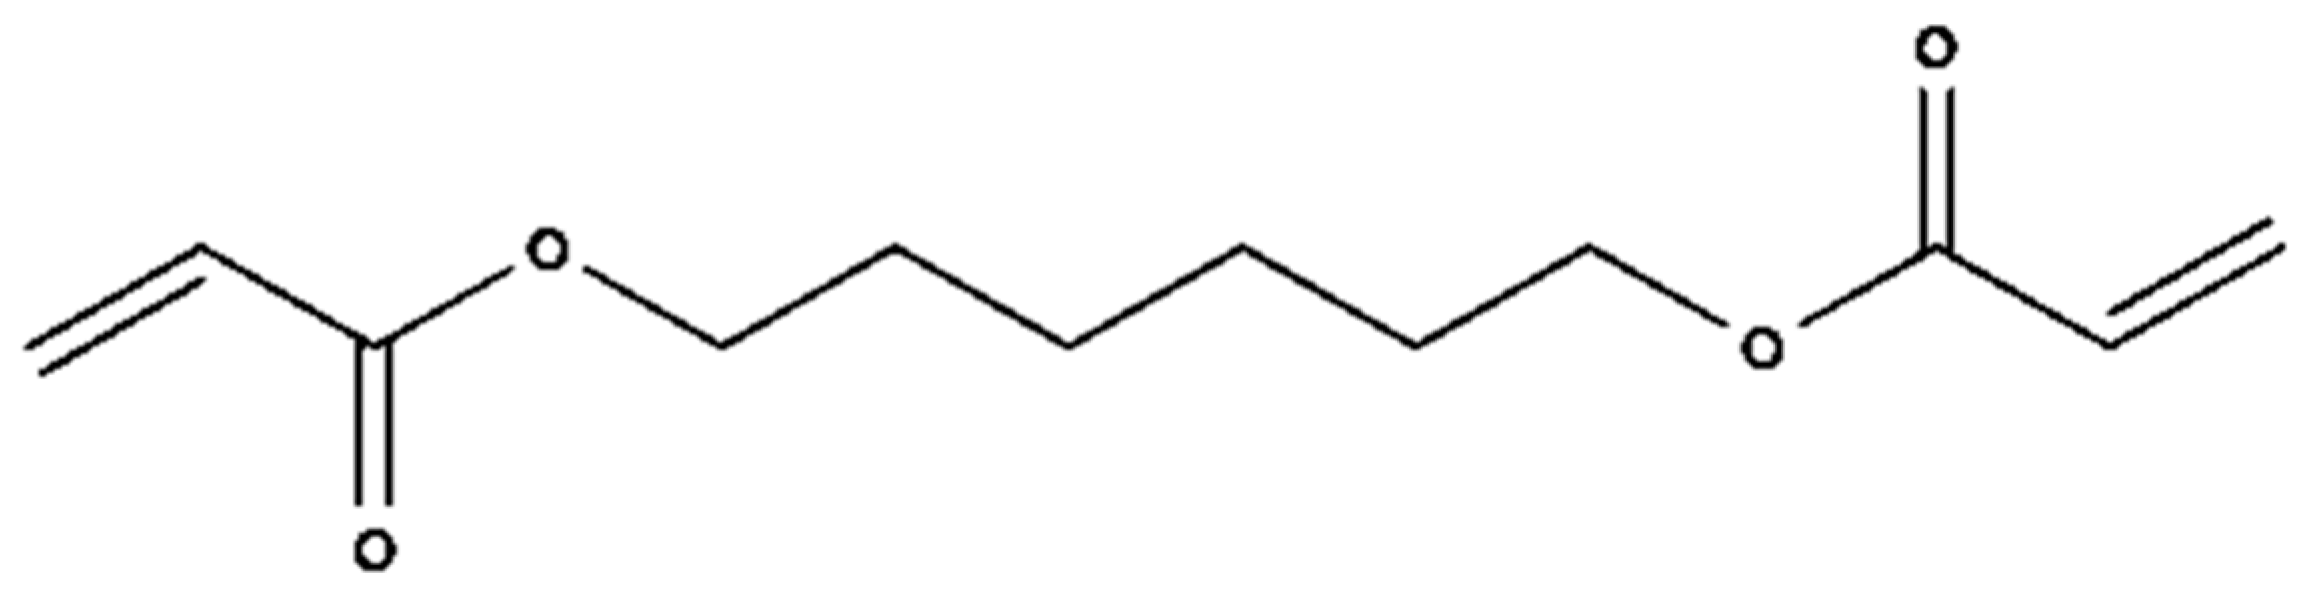
| 2 | 1,6-Hexanediol Diacrylate (HDDA) |
| 3 | Trimethylolpropane Triacrylate (TMPTA) |
| 4 | Pentaerythritol Tetraacrylate (PETA) |
| 5 | Dipentaerythritol Pentaacrylate (DPPA) |
| 6 | Dipentaerythritol Hexaacrylate (DPHA) |
| Functionality | Peak Position (cm−1) | σ | Aspect Ratio |
|---|---|---|---|
| 1 | 809.81 | 0.004 | 203.15 |
| 2 | 808.79 | 0.0024 | 39.927 |
| 3 | 807.77 | 0.0024 | 23.254 |
| 6 | 805.73 | 0.0016 | 4.3711 |
| ID | Viscosity (mPa·s) | Conversion (%) | σ | UTS (MPa) | σ | E | σ | Elongation (%) | σ | Hardness | σ |
|---|---|---|---|---|---|---|---|---|---|---|---|
| M.1 | 88 | 47.10 | 1.14 | 40.71 | 1.04 | 408.24 | 8.48 | 17.12 | 0.89 | 83.80 | 1.25 |
| M.2 | 173 | 37.13 | 3.48 | 36.46 | 1.11 | 393.65 | 16.99 | 17.07 | 0.58 | 81.54 | 0.75 |
| M.3 | 46 | 24.17 | 0.67 | 284.83 | 13.52 | 20.86 | 2.90 | 74.88 | 0.85 | 24.17 | 0.67 |
| M.4 | 133 | 22.17 | 1.76 | 222.92 | 24.98 | 22.14 | 0.63 | 70.70 | 2.54 | 22.17 | 1.76 |
| ID | Viscosity (mPa·s) | Conversion (%) | σ | UTS (MPa) | σ | E | σ | Elongation (%) | σ | Hardness | σ |
|---|---|---|---|---|---|---|---|---|---|---|---|
| A.1 | 88.00 | 47.10 | 1.14 | 40.71 | 1.04 | 408.24 | 8.48 | 17.12 | 0.89 | 83.80 | 1.25 |
| A.2 | 173.00 | 37.13 | 3.48 | 36.46 | 1.11 | 393.65 | 16.99 | 17.07 | 0.58 | 81.54 | 0.75 |
| ID | Conversion (%) | σ | UTS (MPa) | σ | E | σ | Elongation (%) | σ | Hardness | σ |
|---|---|---|---|---|---|---|---|---|---|---|
| B.1 | 22.55 | 4.57 | 35.92 | 4.85 | 342.59 | 41.67 | 15.20 | 0.81 | 78.64 | 3.02 |
| B.2 | 59.32 | 4.75 | 37.51 | 2.44 | 391.49 | 12.29 | 13.92 | 1.99 | 82.20 | 4.97 |
| B.3 | 16.11 | 2.04 | 3.56 | 0.52 | 56.20 | 7.31 | 8.69 | 0.88 | 54.84 | 1.99 |
| ID | UTS (MPa) | σ | E | σ | Elongation (%) | σ | Hardness | σ |
|---|---|---|---|---|---|---|---|---|
| D.1 | 35.56 | 1.90 | 338.12 | 18.76 | 16.36 | 1.67 | 82.60 | 0.89 |
| D.2 | 39.47 | 3.19 | 373.61 | 32.72 | 18.57 | 0.68 | 79.80 | 1.64 |
| D.3 | 44.45 | 2.84 | 441.59 | 30.13 | 18.23 | 1.33 | 80.70 | 2.13 |
| D.4 | 30.45 | 0.82 | 303.29 | 9.56 | 17.36 | 0.70 | 81.80 | 0.45 |
| Dispersant Amount | Peak Position | Conversion |
|---|---|---|
| 1 | 808.91 | 40.18 |
| 3 | 808.93 | 52.71 |
| 5 | 809.70 | 57.896 |
| ID | Gaussian Mix R2 | OMSP Area | σ | Peak Position | σ | Aspect Ratio | σ | Pseudo-Functionality | Pseudo Area | σ |
|---|---|---|---|---|---|---|---|---|---|---|
| A.1 | 0.9882 | 0.1435 | 0.0028 | 808.4785 | 0.0263 | 74.5632 | 0.9766 | 2.0 | 0.0776 | 0.0012 |
| A.2 | 0.9406 | 0.1354 | 0.0001 | 808.7328 | 0.0066 | 77.7593 | 0.1531 | 2.0 | 0.0737 | 0.0002 |
| B.1 | 0.9933 | 0.1408 | 0.0045 | 808.9115 | 0.0793 | 41.9378 | 0.6693 | 2.0 | 0.0811 | 0.0022 |
| B.2 | 0.9901 | 0.1796 | 0.0007 | 807.9112 | 0.0153 | 26.1247 | 0.0376 | 3.0 | 0.1355 | 0.0006 |
| B.3 | 0.9848 | 0.1616 | 0.0001 | 809.5891 | 0.0002 | 85.8764 | 0.0564 | 1.0 | 0.0992 | 0.0001 |
| C.1 | 0.9926 | 0.0853 | 0.0001 | 808.9715 | 0.0040 | 19.0611 | 0.0426 | 2.0 | 0.0474 | 0.0001 |
| C.2 | 0.9932 | 0.0944 | 0.0002 | 808.9818 | 0.0066 | 55.4130 | 0.1660 | 2.0 | 0.0524 | 0.0001 |
| C.3 | 0.9943 | 0.1048 | 0.0002 | 809.0262 | 0.0061 | 100.2605 | 0.8498 | 2.0 | 0.0584 | 0.0001 |
| C.4 | 0.9955 | 0.1119 | 0.0002 | 809.0477 | 0.0077 | 140.3469 | 6.1436 | 2.0 | 0.0626 | 0.0001 |
| C.5 | 0.9963 | 0.1206 | 0.0002 | 809.0362 | 0.0081 | 94.6027 | 121.0432 | 2.0 | 0.0674 | 0.0002 |
| C.6 | 0.9750 | 0.0712 | 0.0001 | 809.2512 | 0.0100 | 112.4926 | 123.6563 | 2.0 | 0.0391 | 0.0001 |
| C.7 | 0.9538 | 0.0690 | 0.0002 | 809.5008 | 0.0016 | 148.9019 | 126.0531 | 1.0 | 0.0386 | 0.0002 |
| C.8 | 0.9152 | 0.0683 | 0.0001 | 809.7751 | 0.0097 | 236.3868 | 24.9293 | 1.0 | 0.0393 | 0.0000 |
| C.9 | 0.8231 | 0.0827 | 0.0006 | 809.7850 | 0.0100 | 110.0589 | 16.7545 | 1.0 | 0.0470 | 0.0004 |
| C.10 | 0.8803 | 0.0647 | 0.0002 | 810.0170 | 0.0071 | 248.5165 | 317.9802 | 1.0 | 0.0381 | 0.0002 |
| D.1 | 0.9963 | 0.1266 | 0.0024 | 808.0475 | 0.0238 | 43.3092 | 45.8575 | 3.0 | 0.0955 | 0.0017 |
| D.2 | 0.9964 | 0.1244 | 0.0042 | 808.1450 | 0.0231 | 48.5235 | 25.9756 | 3.0 | 0.0946 | 0.0033 |
| D.3 | 0.9933 | 0.1174 | 0.0012 | 808.3110 | 0.0379 | 75.0845 | 16.1846 | 2.5 | 0.0761 | 0.0154 |
| D.4 | 0.9943 | 0.1164 | 0.0002 | 808.4077 | 0.0975 | 91.6005 | 4.6589 | 2.0 | 0.0683 | 0.0055 |
| E.1 | 0.1349 | 0.0004 | 808.9072 | 0.0086 | 43.4779 | 0.0296 | 2.0 | 0.0777 | 0.0004 | |
| E.2 | 0.1337 | 0.0001 | 808.9324 | 0.0023 | 43.9323 | 0.0099 | 2.0 | 0.0771 | 0.0001 | |
| E.3 | 0.0945 | 0.0019 | 809.6979 | 0.0151 | 30.0811 | 14.6260 | 1.0 | 0.0579 | 0.0011 | |
| F.1 | 0.99133 | 0.1698 | 0.0002 | 806.5943 | 0.0028 | 4.6328 | 0.5158 | 5.0 | 0.1479 | 0.0003 |
| F.2 | 0.97242 | 0.1812 | 0.0004 | 807.1414 | 0.0025 | 18.5927 | 18.7931 | 4.0 | 0.1318 | 0.0003 |
| F.3 | 0.97845 | 0.1860 | 0.0001 | 807.4527 | 0.0002 | 20.7377 | 12.5333 | 3.0 | 0.1371 | 0.0002 |
| F.4 | 0.97376 | 0.1893 | 0.0003 | 807.6646 | 0.0016 | 32.6495 | 0.0931 | 3.0 | 0.1407 | 0.0001 |
| F.5 | 0.96759 | 0.1933 | 0.0011 | 807.8435 | 0.0037 | 35.2491 | 0.0228 | 3.0 | 0.1447 | 0.0007 |
| F.6 | 0.96651 | 0.1943 | 0.0001 | 808.0486 | 0.0165 | 55.0680 | 26.1248 | 3.0 | 0.1470 | 0.0001 |
| F.7 | 0.96648 | 0.1955 | 0.0012 | 808.1543 | 0.0023 | 15.4292 | 0.1092 | 3.0 | 0.1486 | 0.0009 |
| F.8 | 0.96725 | 0.1973 | 0.0002 | 808.5364 | 0.0049 | 35.6670 | 25.1628 | 2.0 | 0.1043 | 0.0000 |
| F.9 | 0.97403 | 0.1990 | 0.0004 | 808.8632 | 0.0069 | 49.4474 | 41.8887 | 2.0 | 0.1084 | 0.0002 |
| M.1 | 0.9958 | 0.1663 | 0.0002 | 807.2729 | 0.0022 | 28.0230 | 0.0205 | 3.0 | 0.1202 | 0.0001 |
| M.2 | 0.9682 | 0.1784 | 0.0033 | 807.6898 | 0.0436 | 113.8961 | 18.4272 | 3.0 | 0.1321 | 0.0021 |
| M.3 | 0.9931 | 0.1248 | 0.0008 | 808.7009 | 0.0028 | 87.9753 | 4.2273 | 2.0 | 0.0674 | 0.0004 |
| M.4 | 0.8433 | 0.1244 | 0.0004 | 809.1787 | 0.0079 | 128.7159 | 7.0550 | 2.0 | 0.0720 | 0.0003 |
Disclaimer/Publisher’s Note: The statements, opinions and data contained in all publications are solely those of the individual author(s) and contributor(s) and not of MDPI and/or the editor(s). MDPI and/or the editor(s) disclaim responsibility for any injury to people or property resulting from any ideas, methods, instructions or products referred to in the content. |
© 2025 by the authors. Licensee MDPI, Basel, Switzerland. This article is an open access article distributed under the terms and conditions of the Creative Commons Attribution (CC BY) license (https://creativecommons.org/licenses/by/4.0/).
Share and Cite
Okoruwa, L.; Tarak, F.; Sameni, F.; Sabet, E. Bridging Experimentation and Computation: OMSP for Advanced Acrylate Characterization and Digital Photoresin Design in Vat Photopolymerization. Polymers 2025, 17, 203. https://doi.org/10.3390/polym17020203
Okoruwa L, Tarak F, Sameni F, Sabet E. Bridging Experimentation and Computation: OMSP for Advanced Acrylate Characterization and Digital Photoresin Design in Vat Photopolymerization. Polymers. 2025; 17(2):203. https://doi.org/10.3390/polym17020203
Chicago/Turabian StyleOkoruwa, Leah, Fatih Tarak, Farzaneh Sameni, and Ehsan Sabet. 2025. "Bridging Experimentation and Computation: OMSP for Advanced Acrylate Characterization and Digital Photoresin Design in Vat Photopolymerization" Polymers 17, no. 2: 203. https://doi.org/10.3390/polym17020203
APA StyleOkoruwa, L., Tarak, F., Sameni, F., & Sabet, E. (2025). Bridging Experimentation and Computation: OMSP for Advanced Acrylate Characterization and Digital Photoresin Design in Vat Photopolymerization. Polymers, 17(2), 203. https://doi.org/10.3390/polym17020203