
Investigation of the Mechanical Properties of Calcareous Sand Improved by Polyurethane Foam Adhesive Under Fixed Principal Stress Axes Shearing

Abstract
:1. Introduction
2. Test Conditions
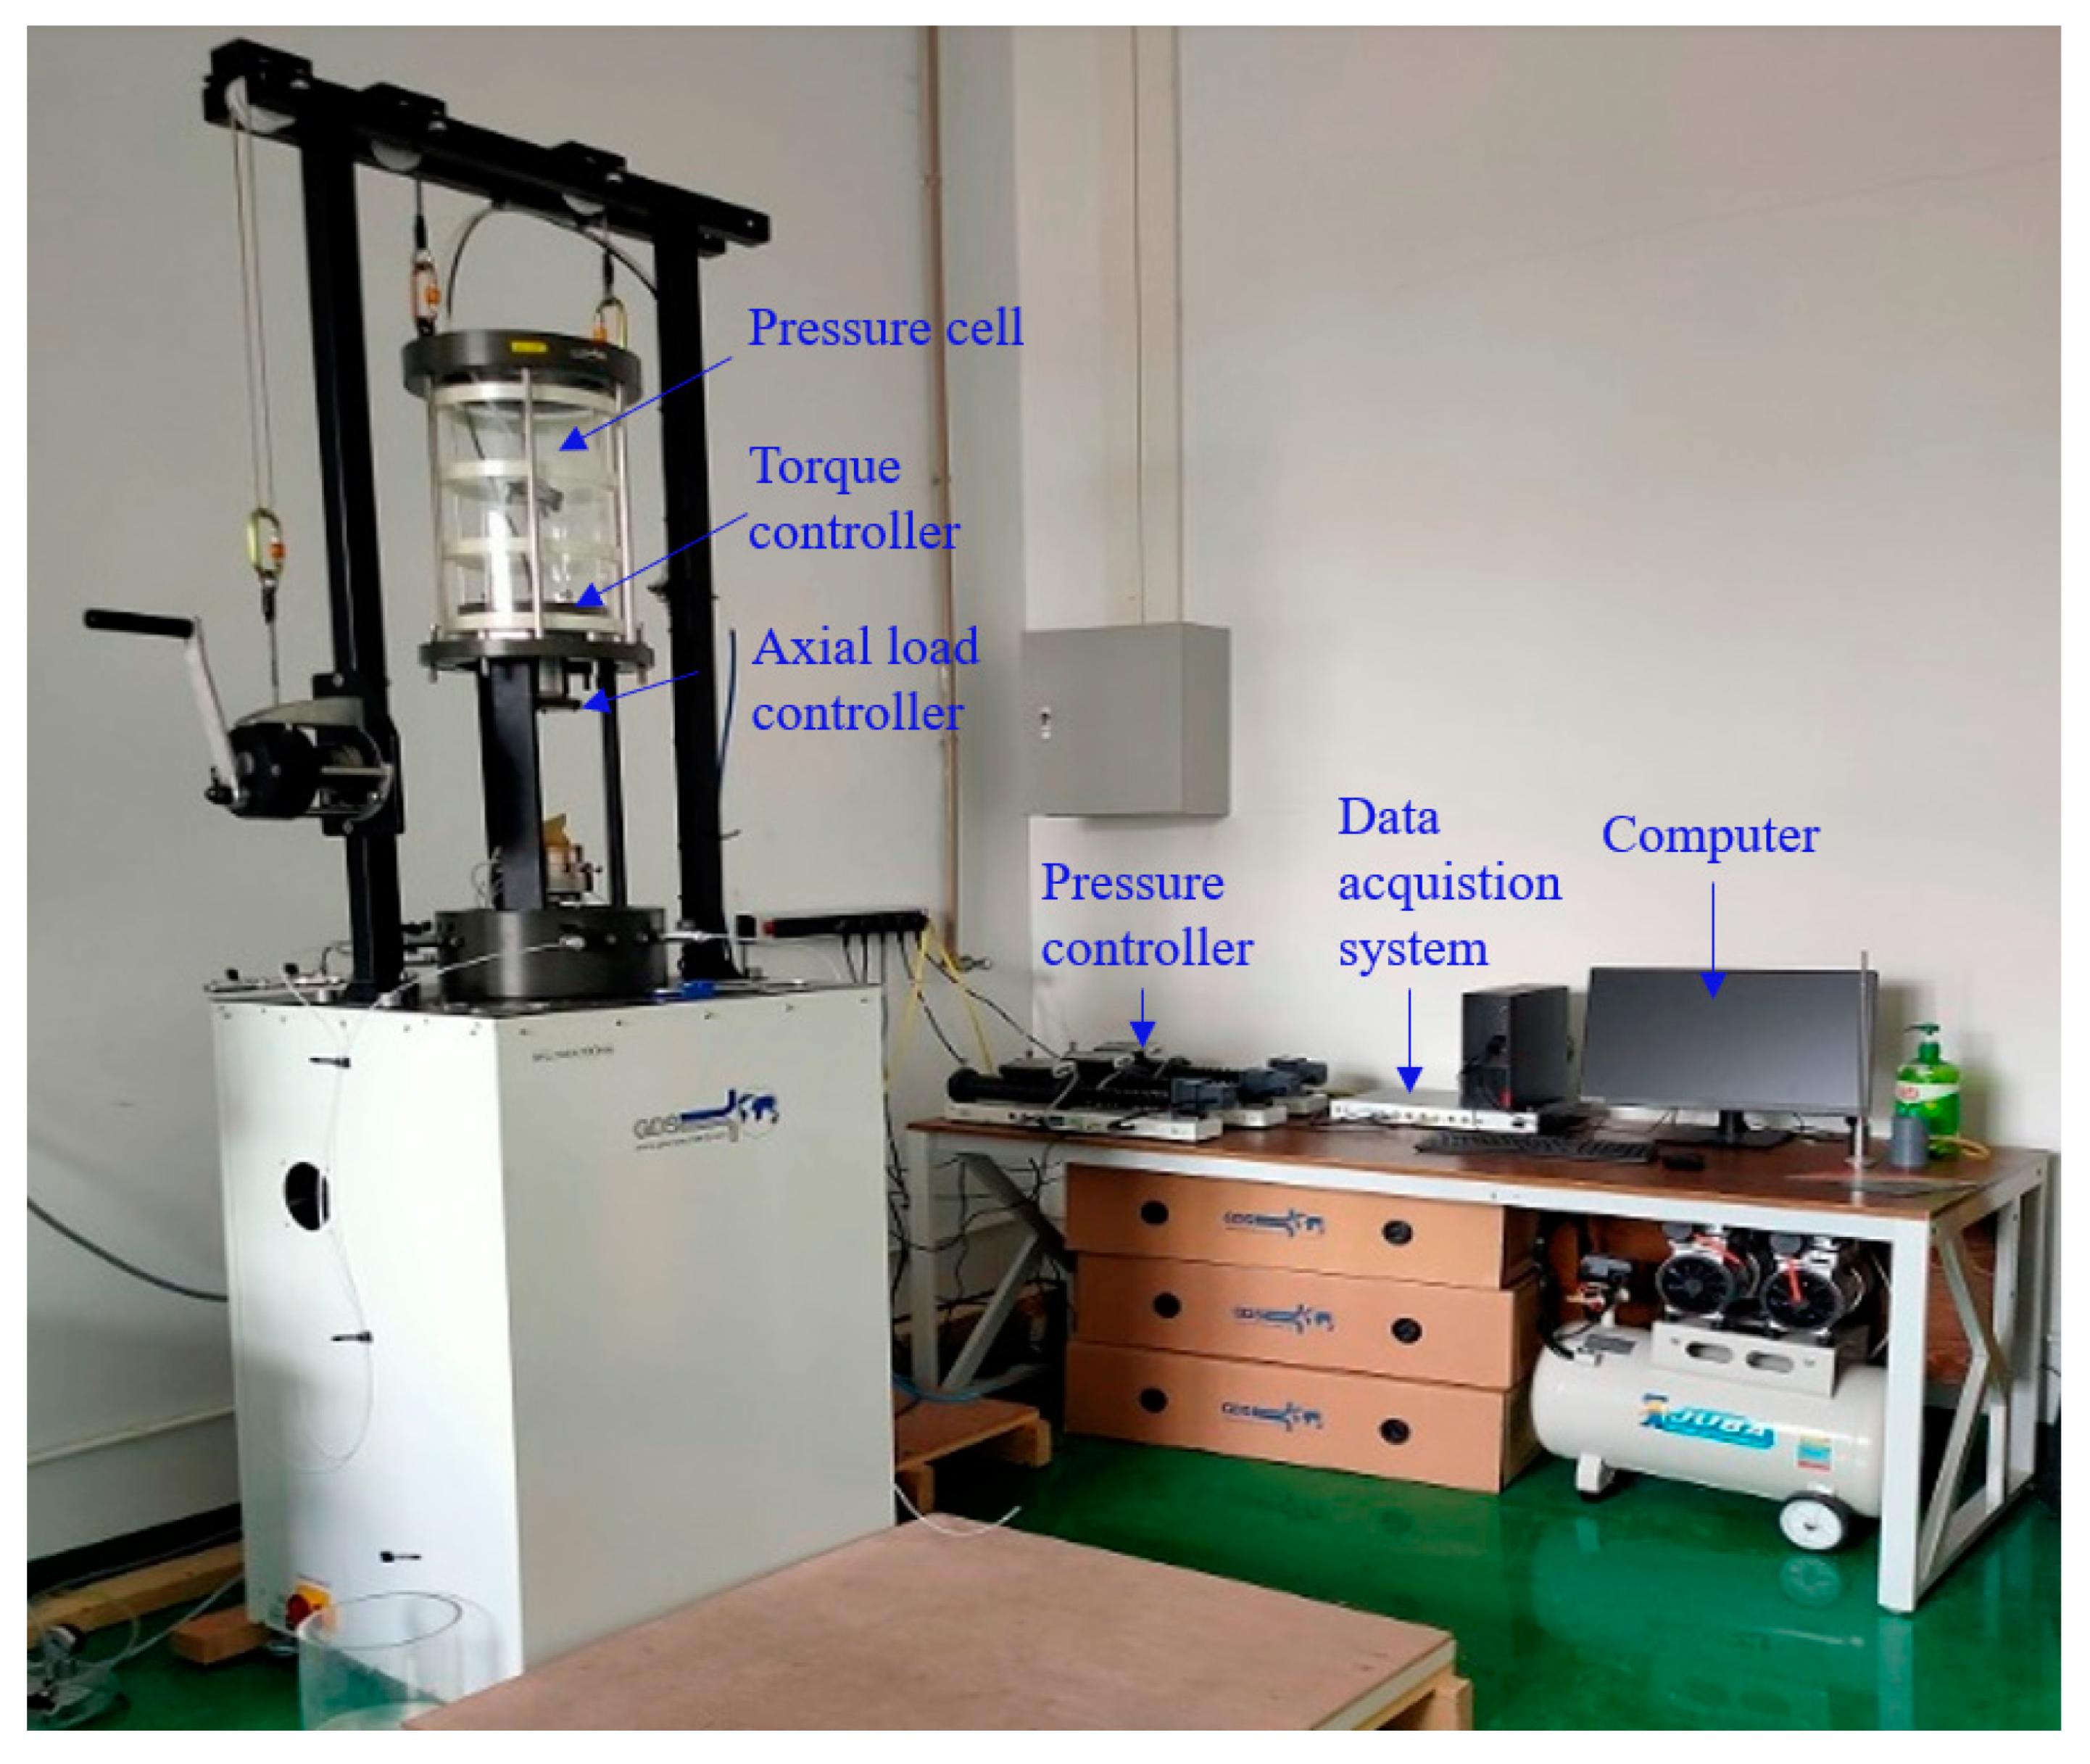
2.1. Test Apparatus
2.2. Test Materials
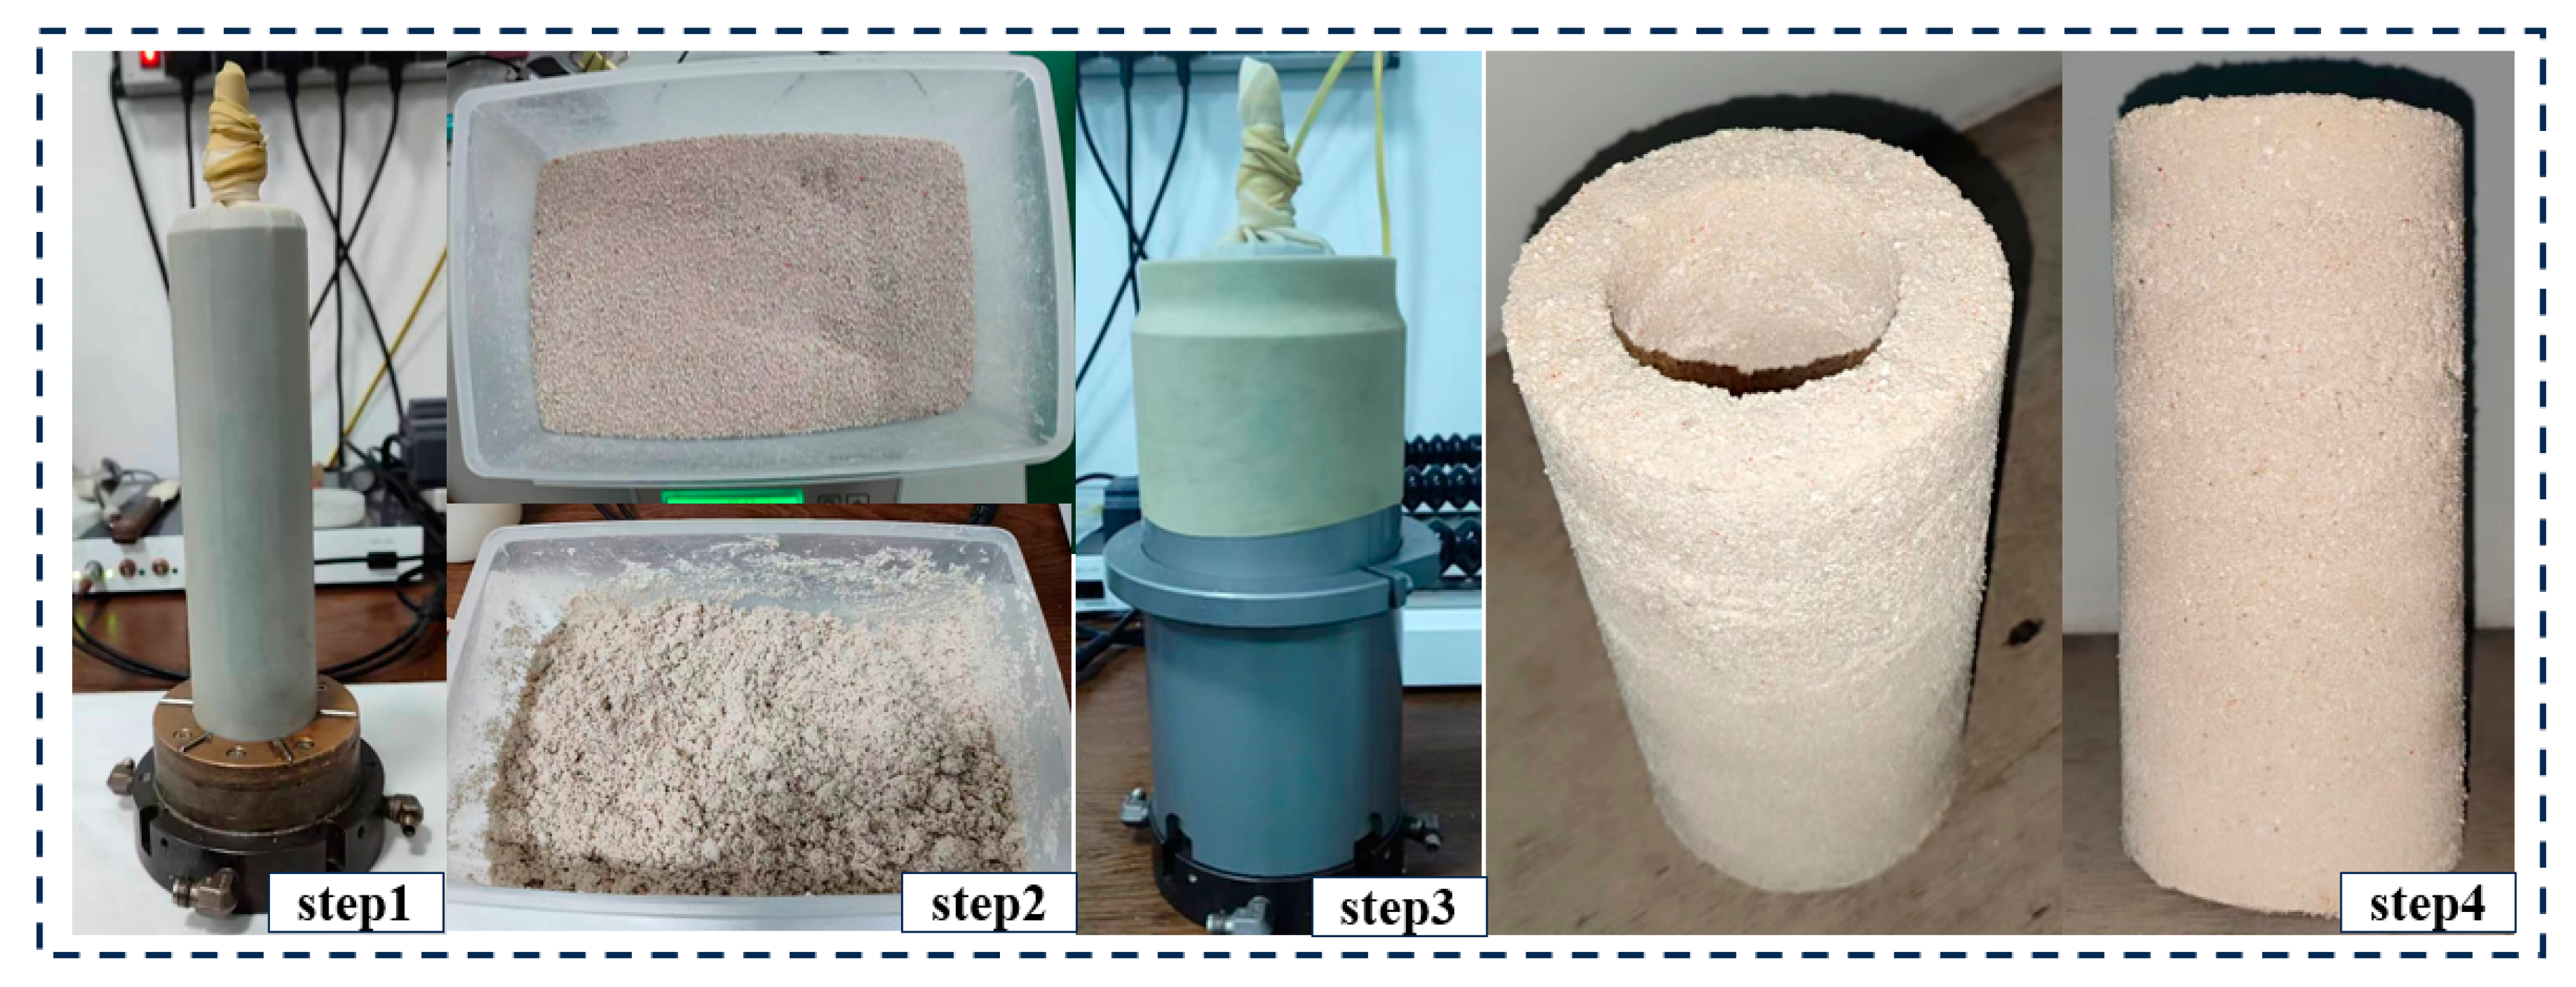
2.3. Specimen Preparation
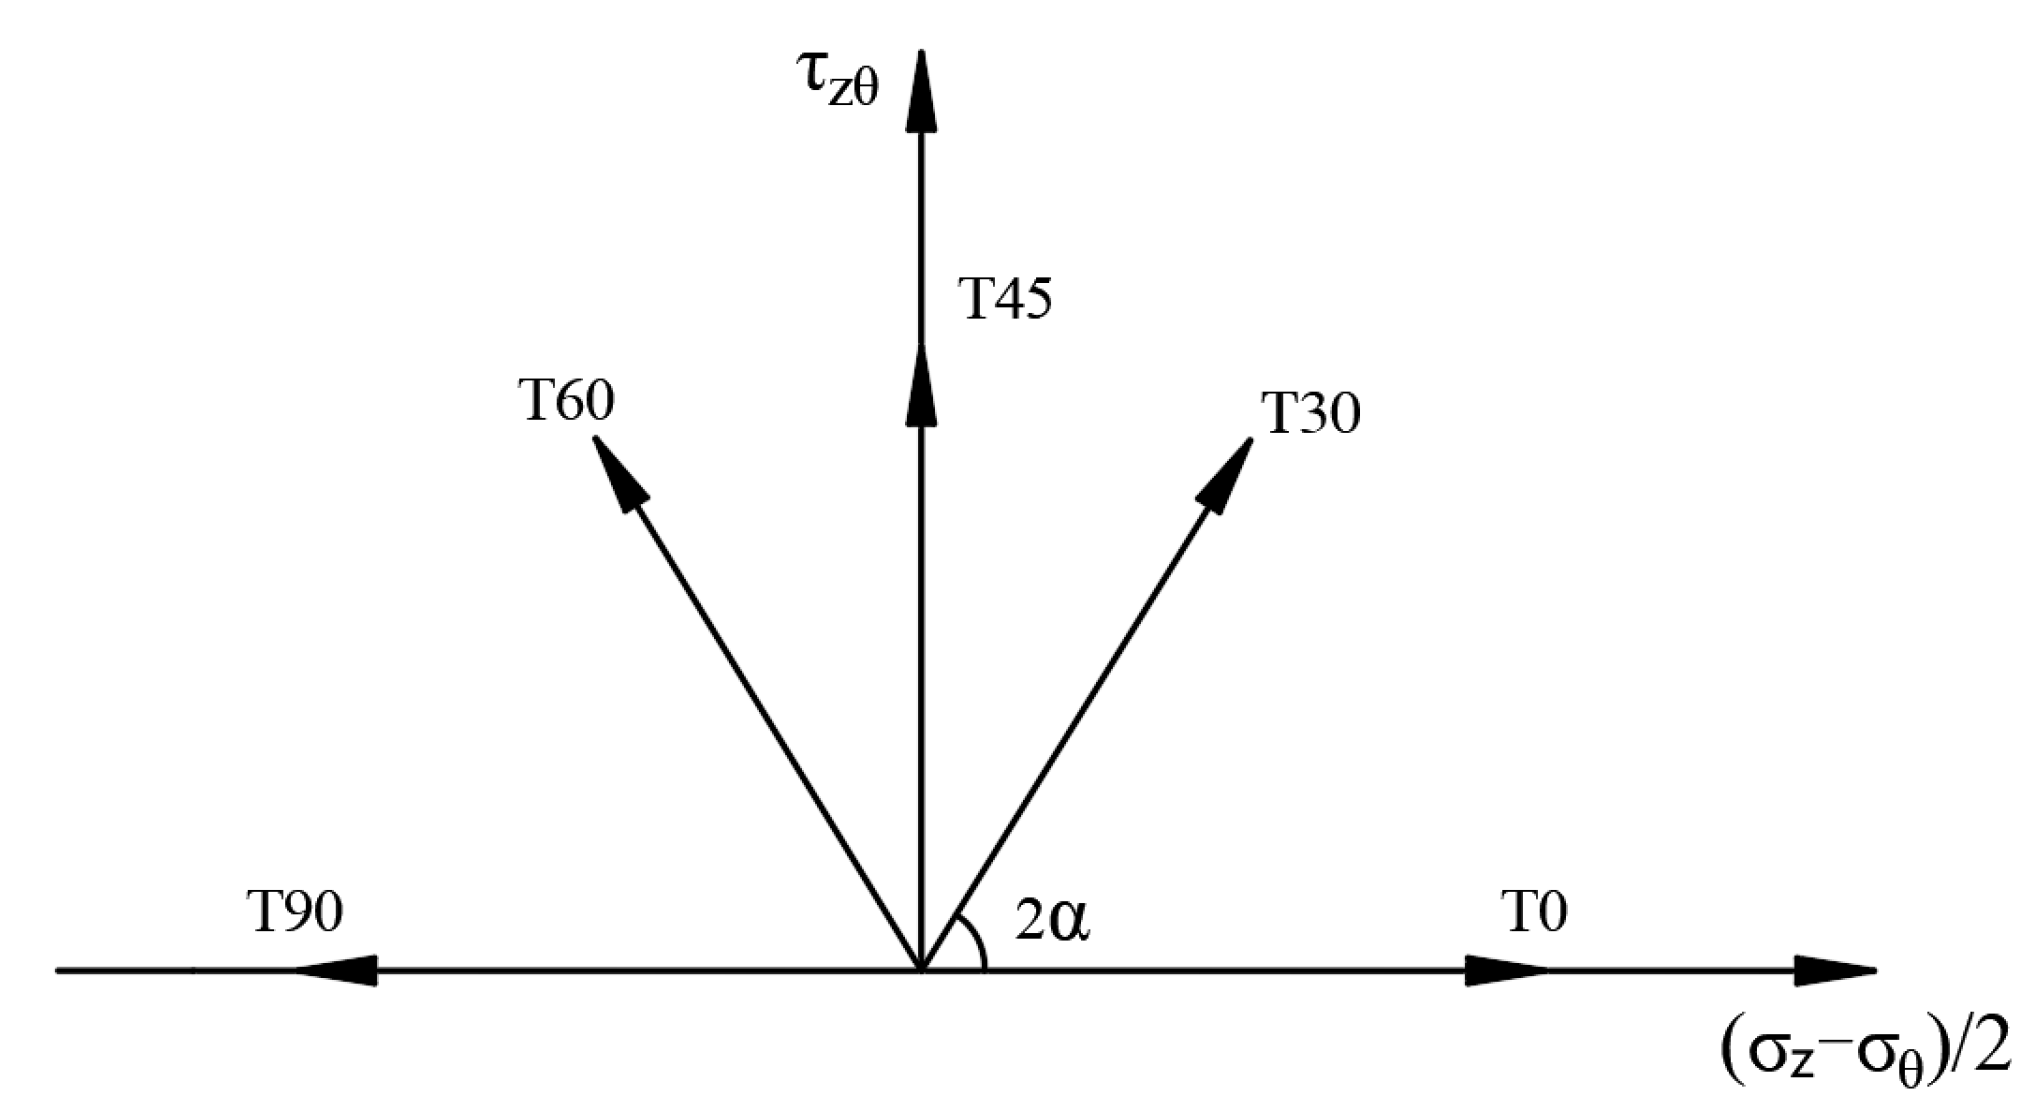
2.4. Torsional Shear Testing Methods and Standards
2.5. The Criteria for Failure
2.6. Test Scheme
3. Results and Analyses
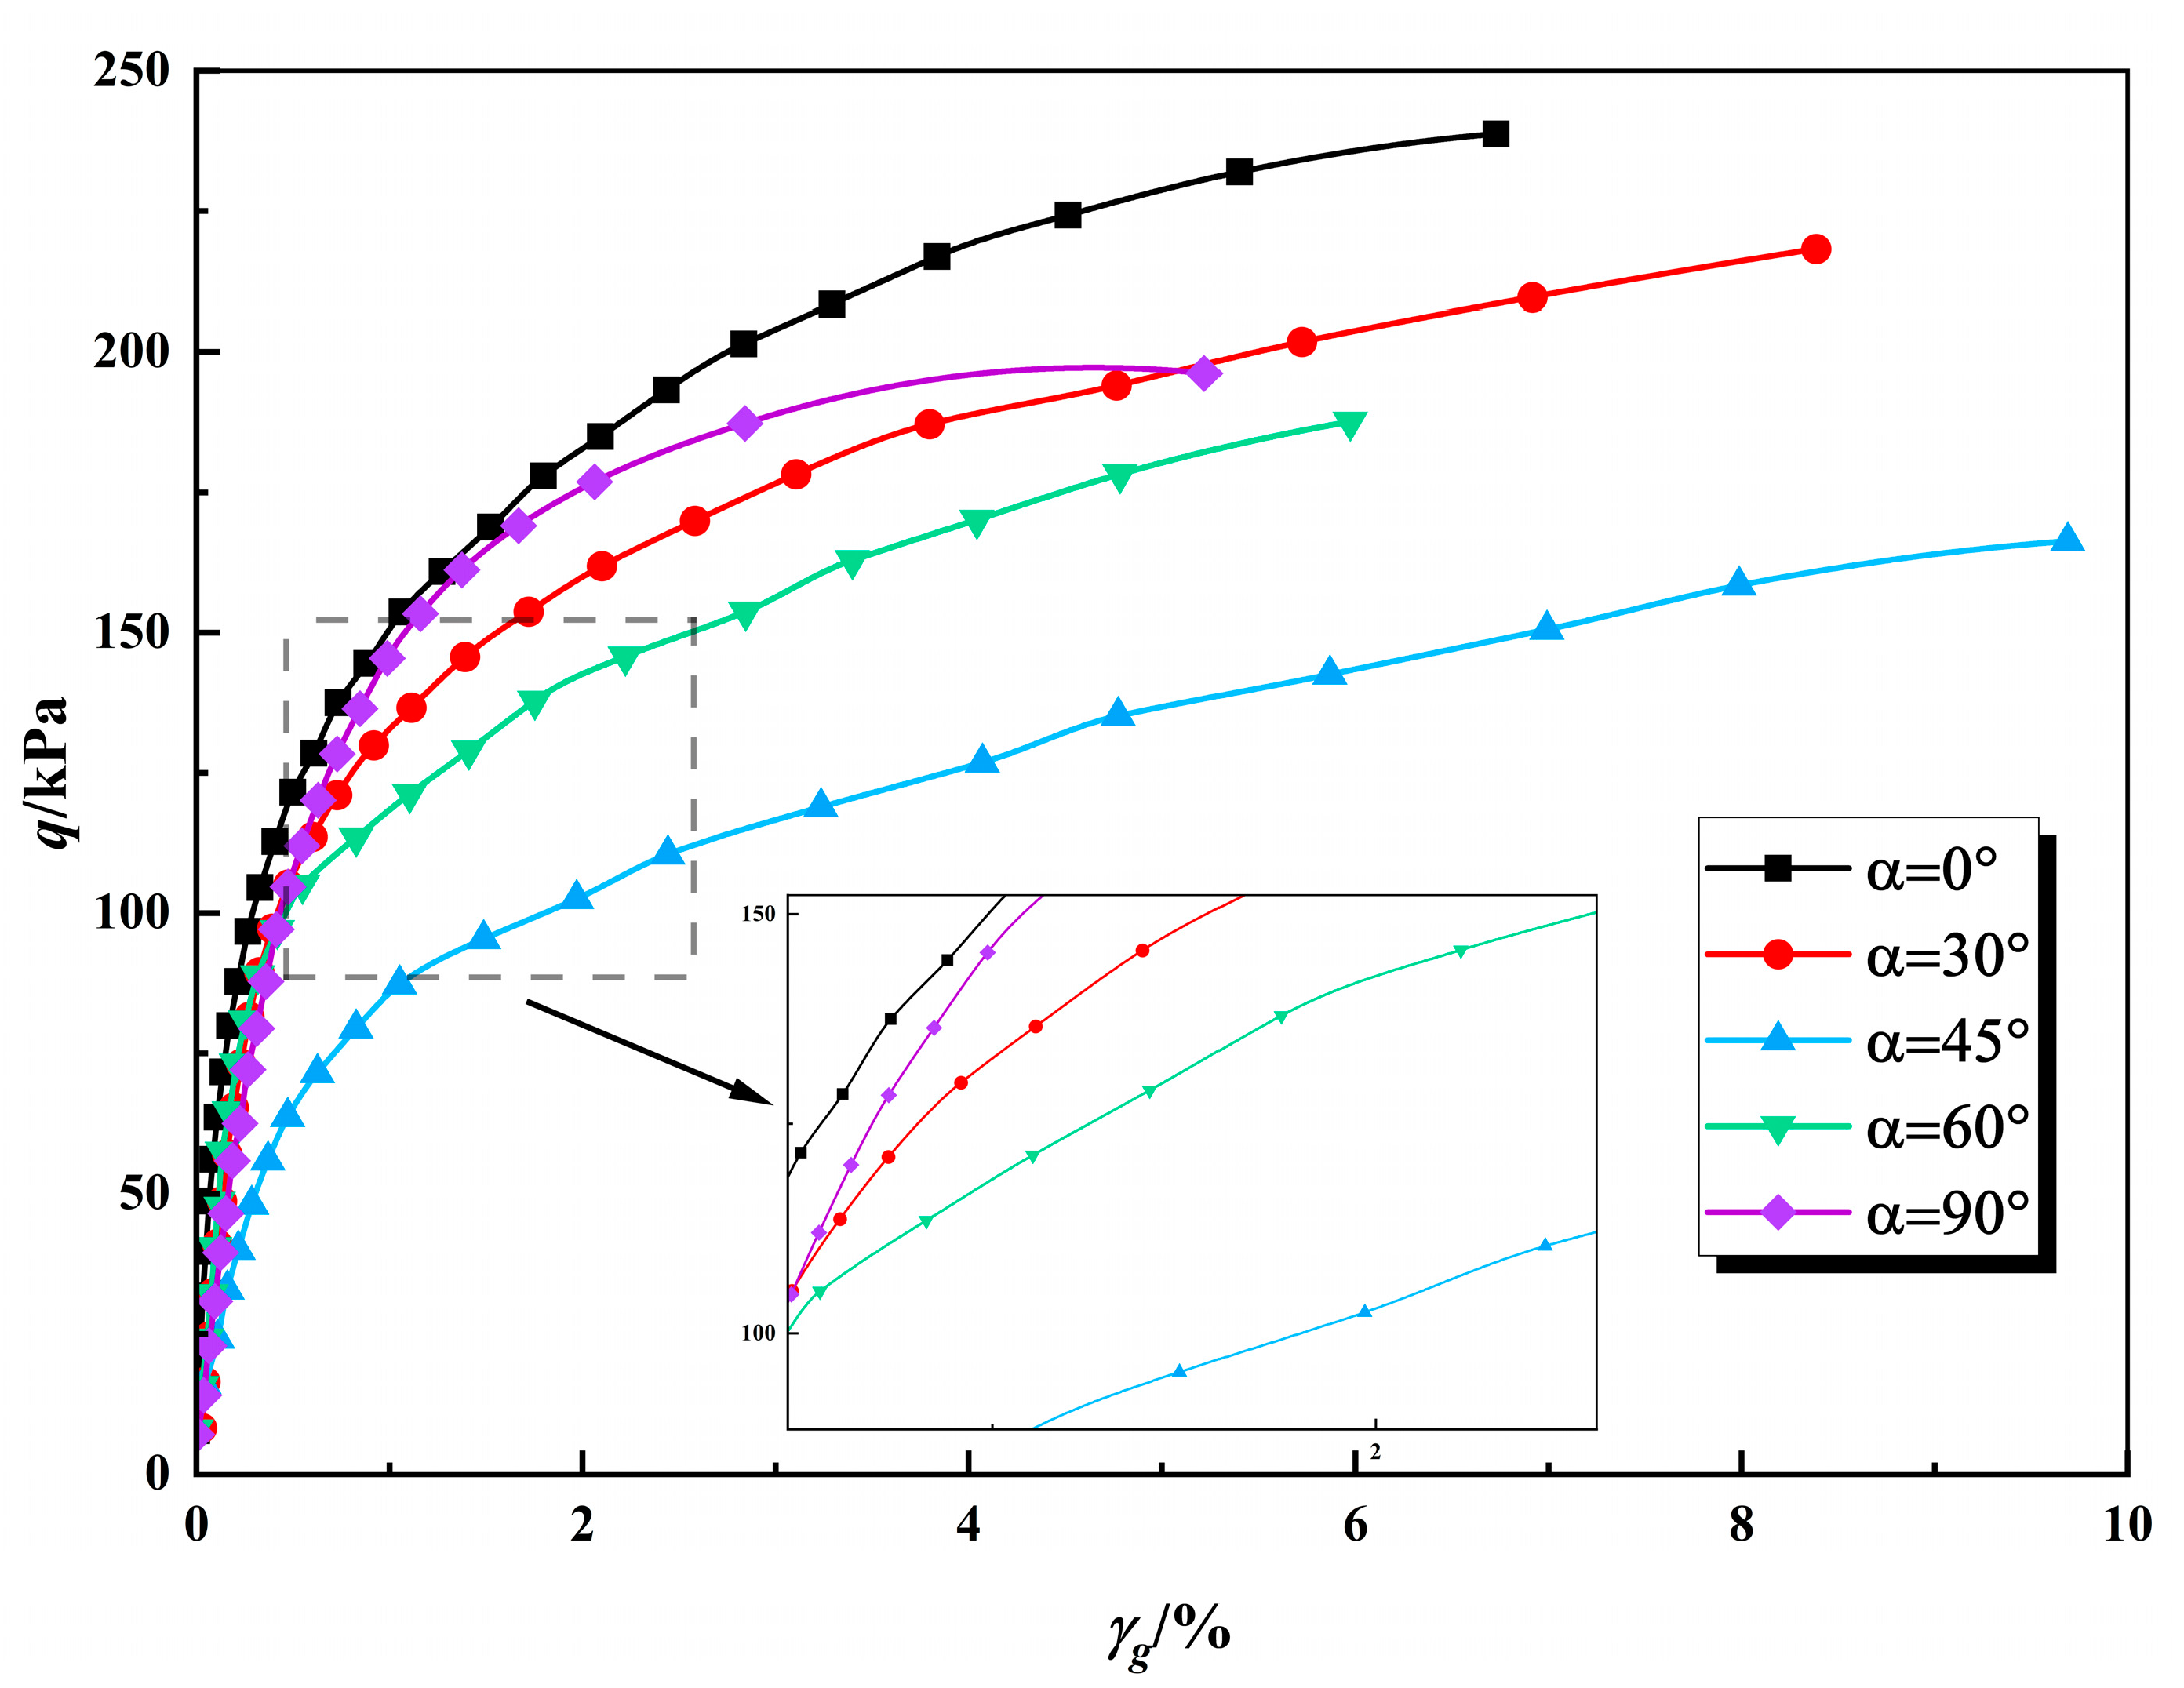
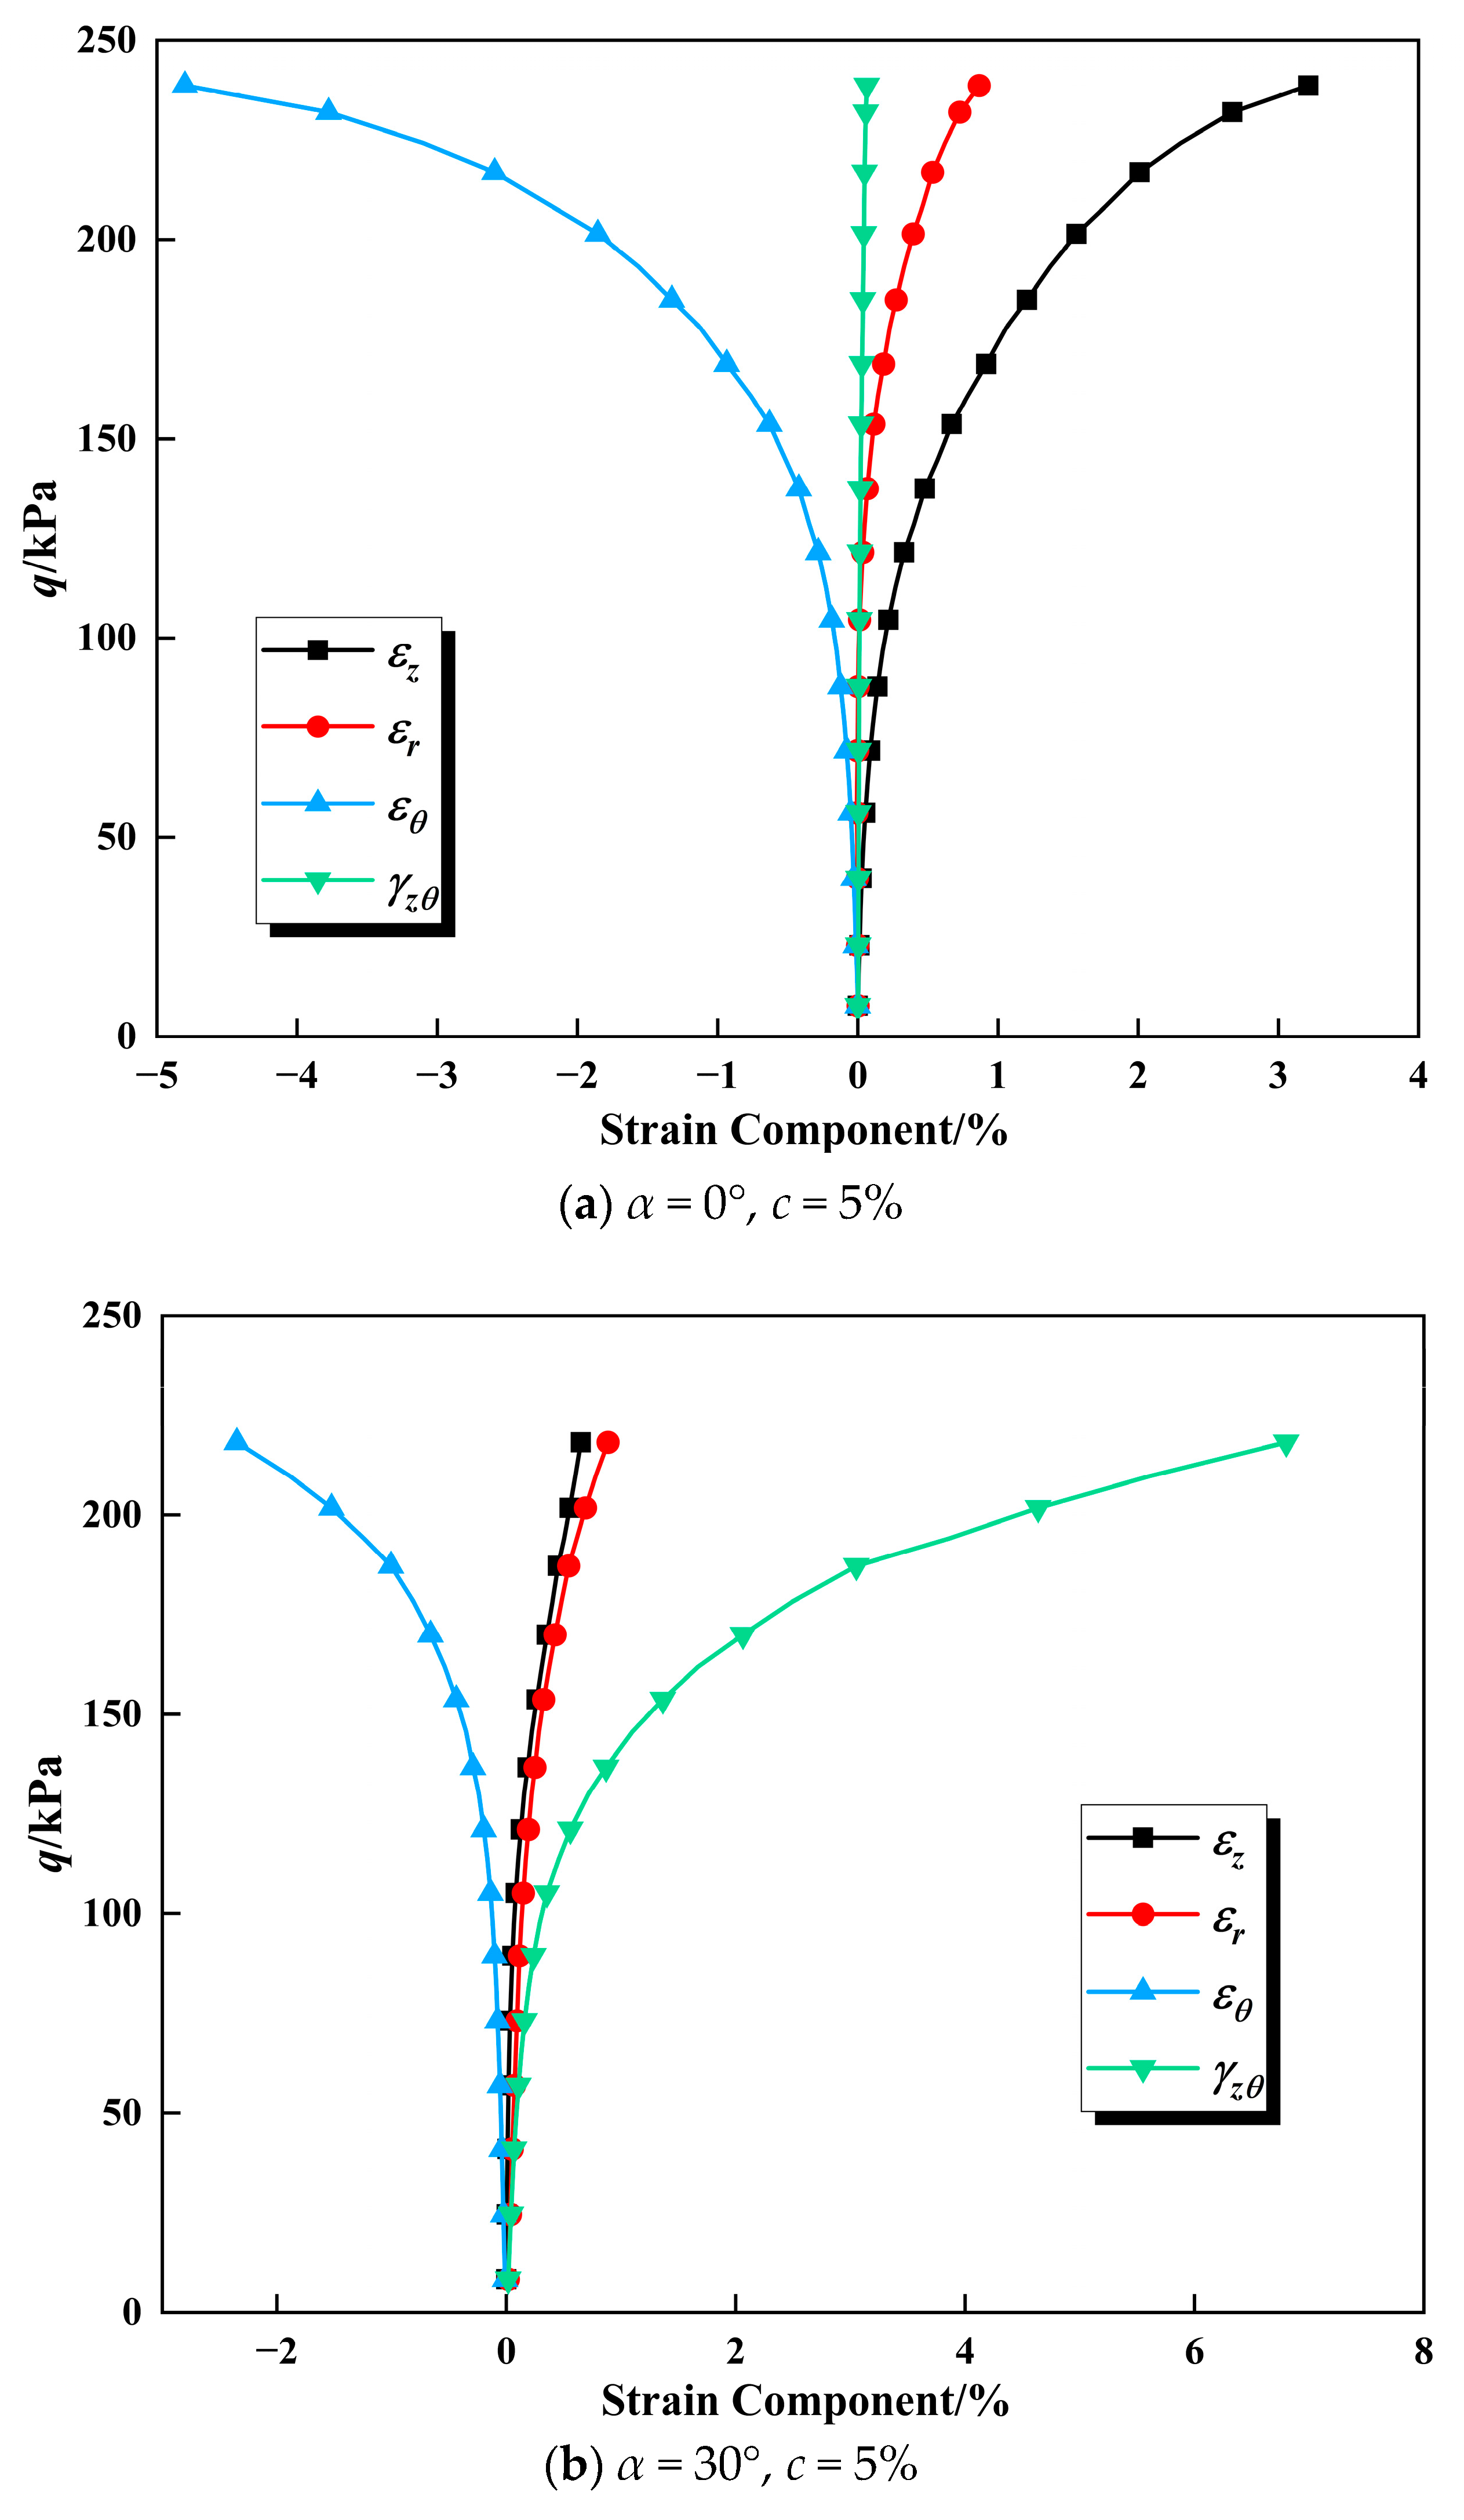
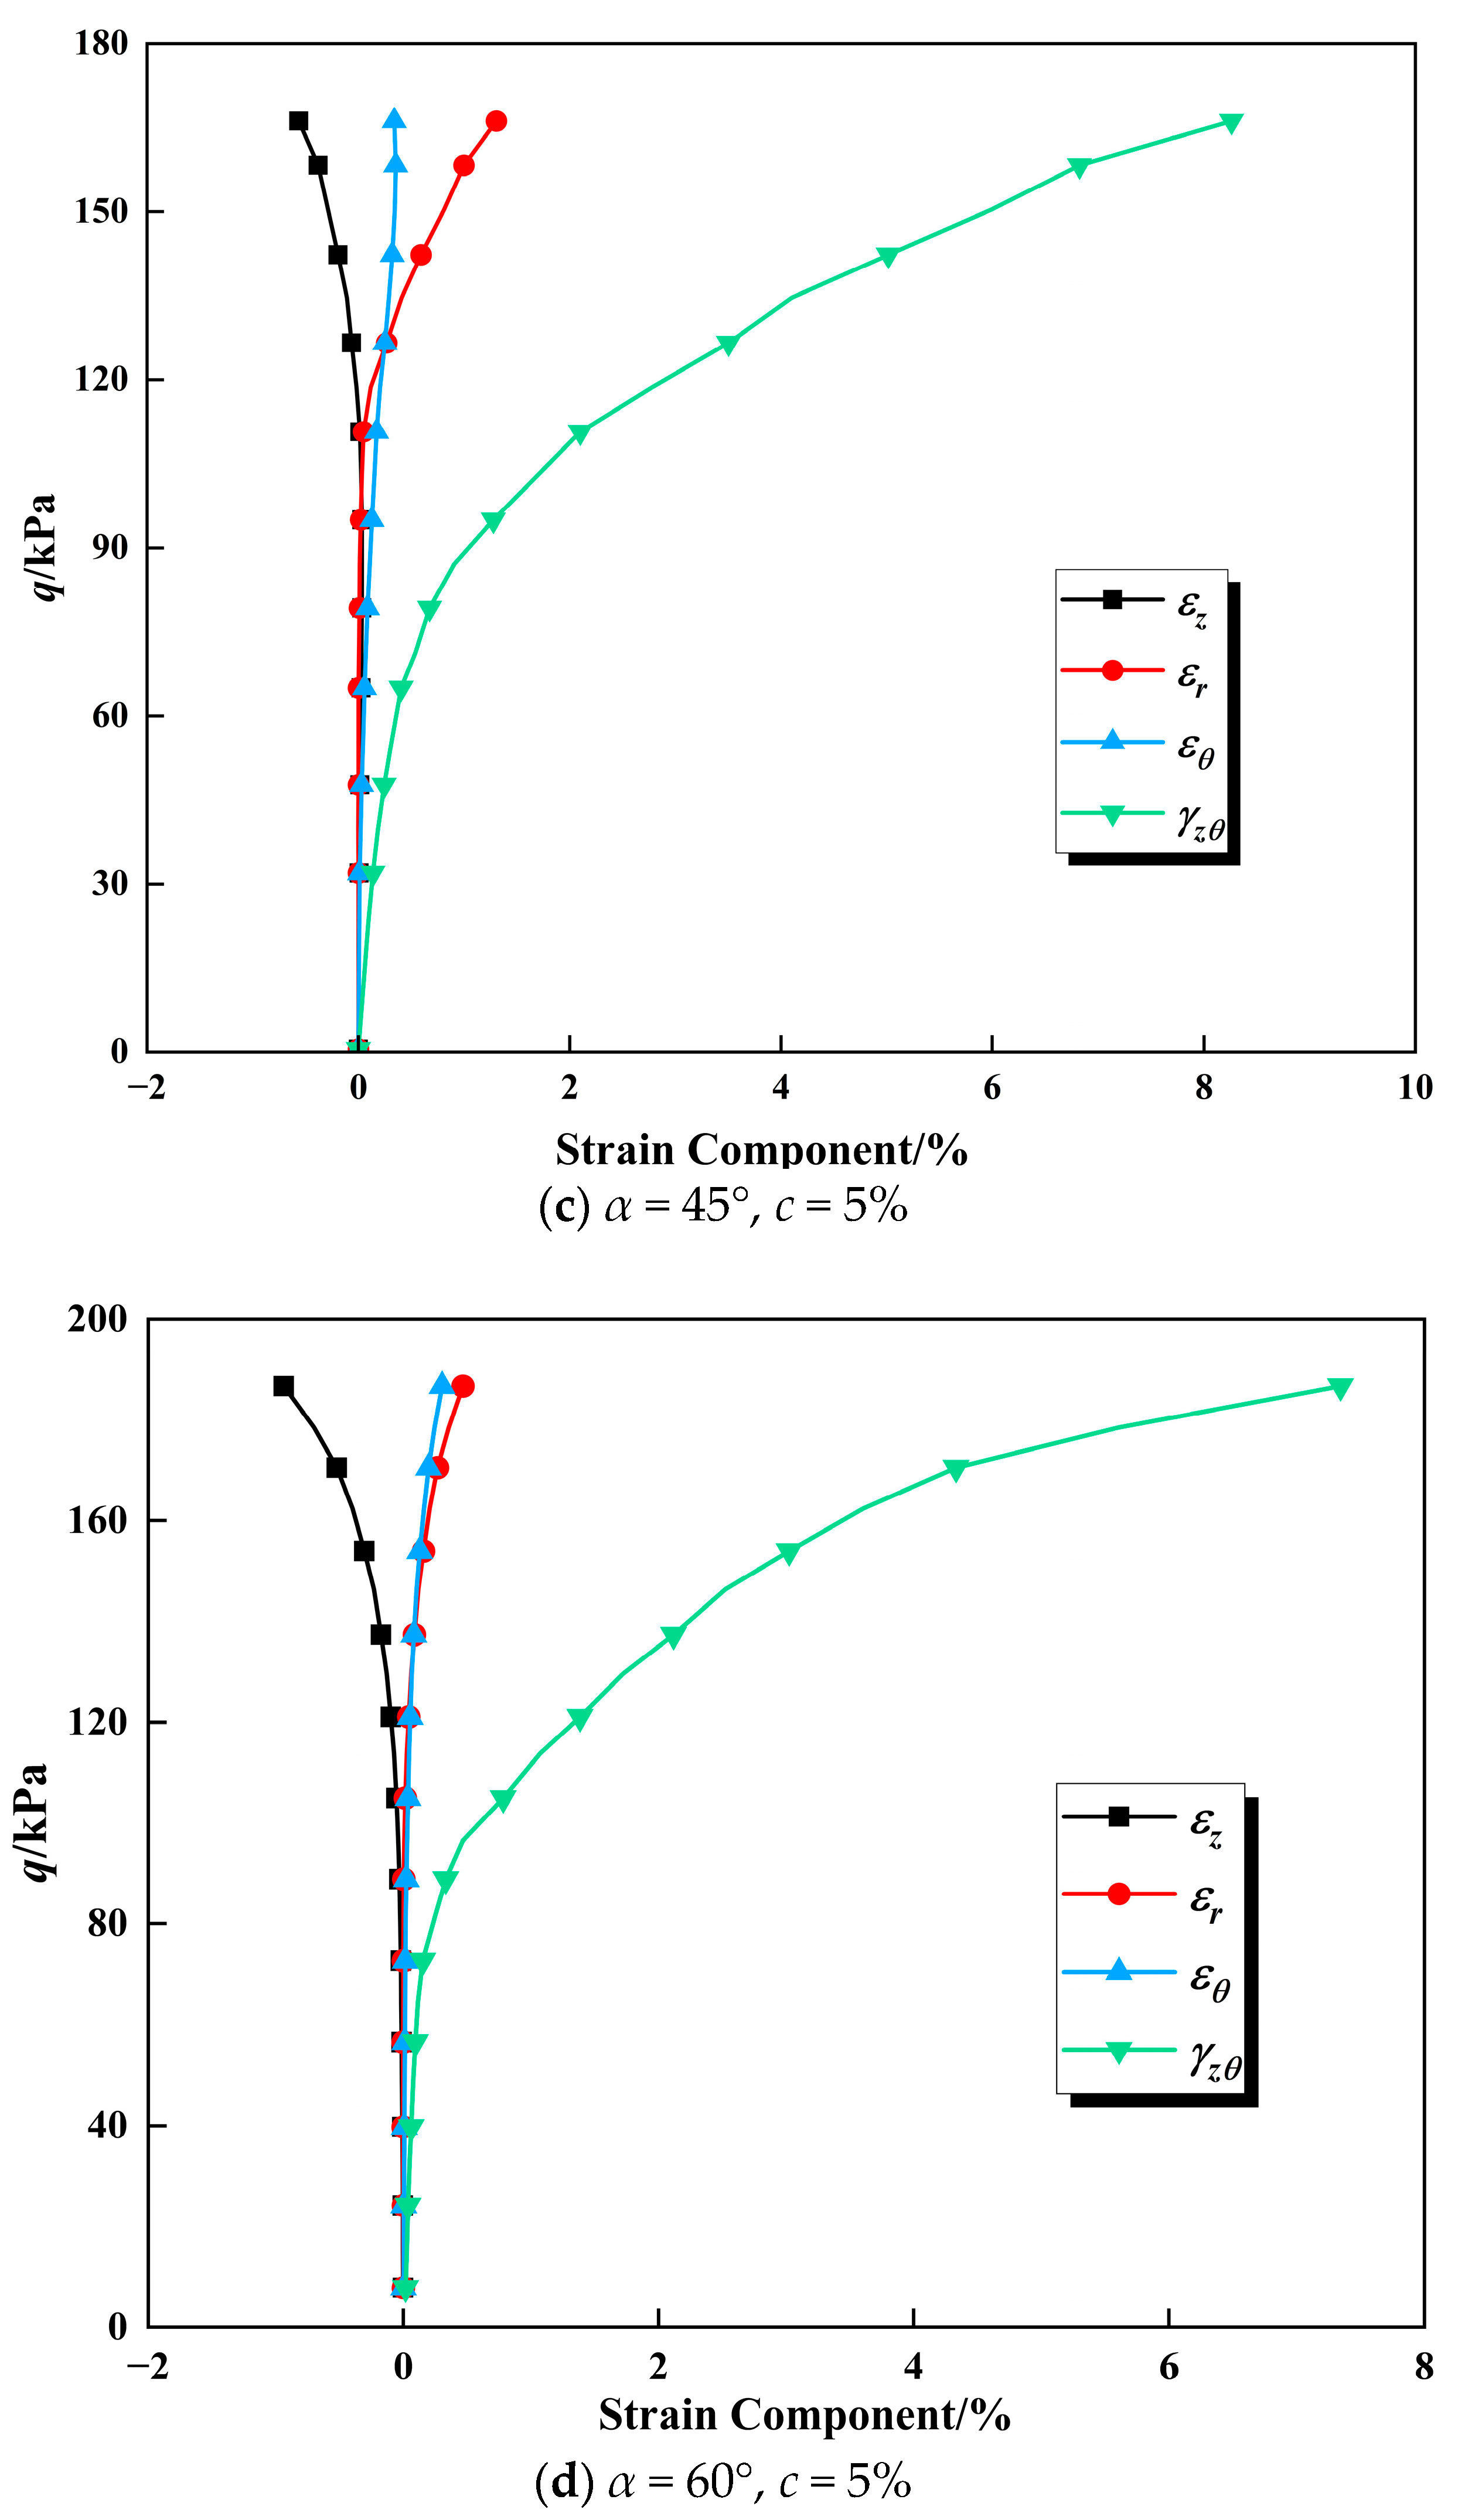
3.1. Stress–Strain Relationships Under Different Major Principal Stress Angles
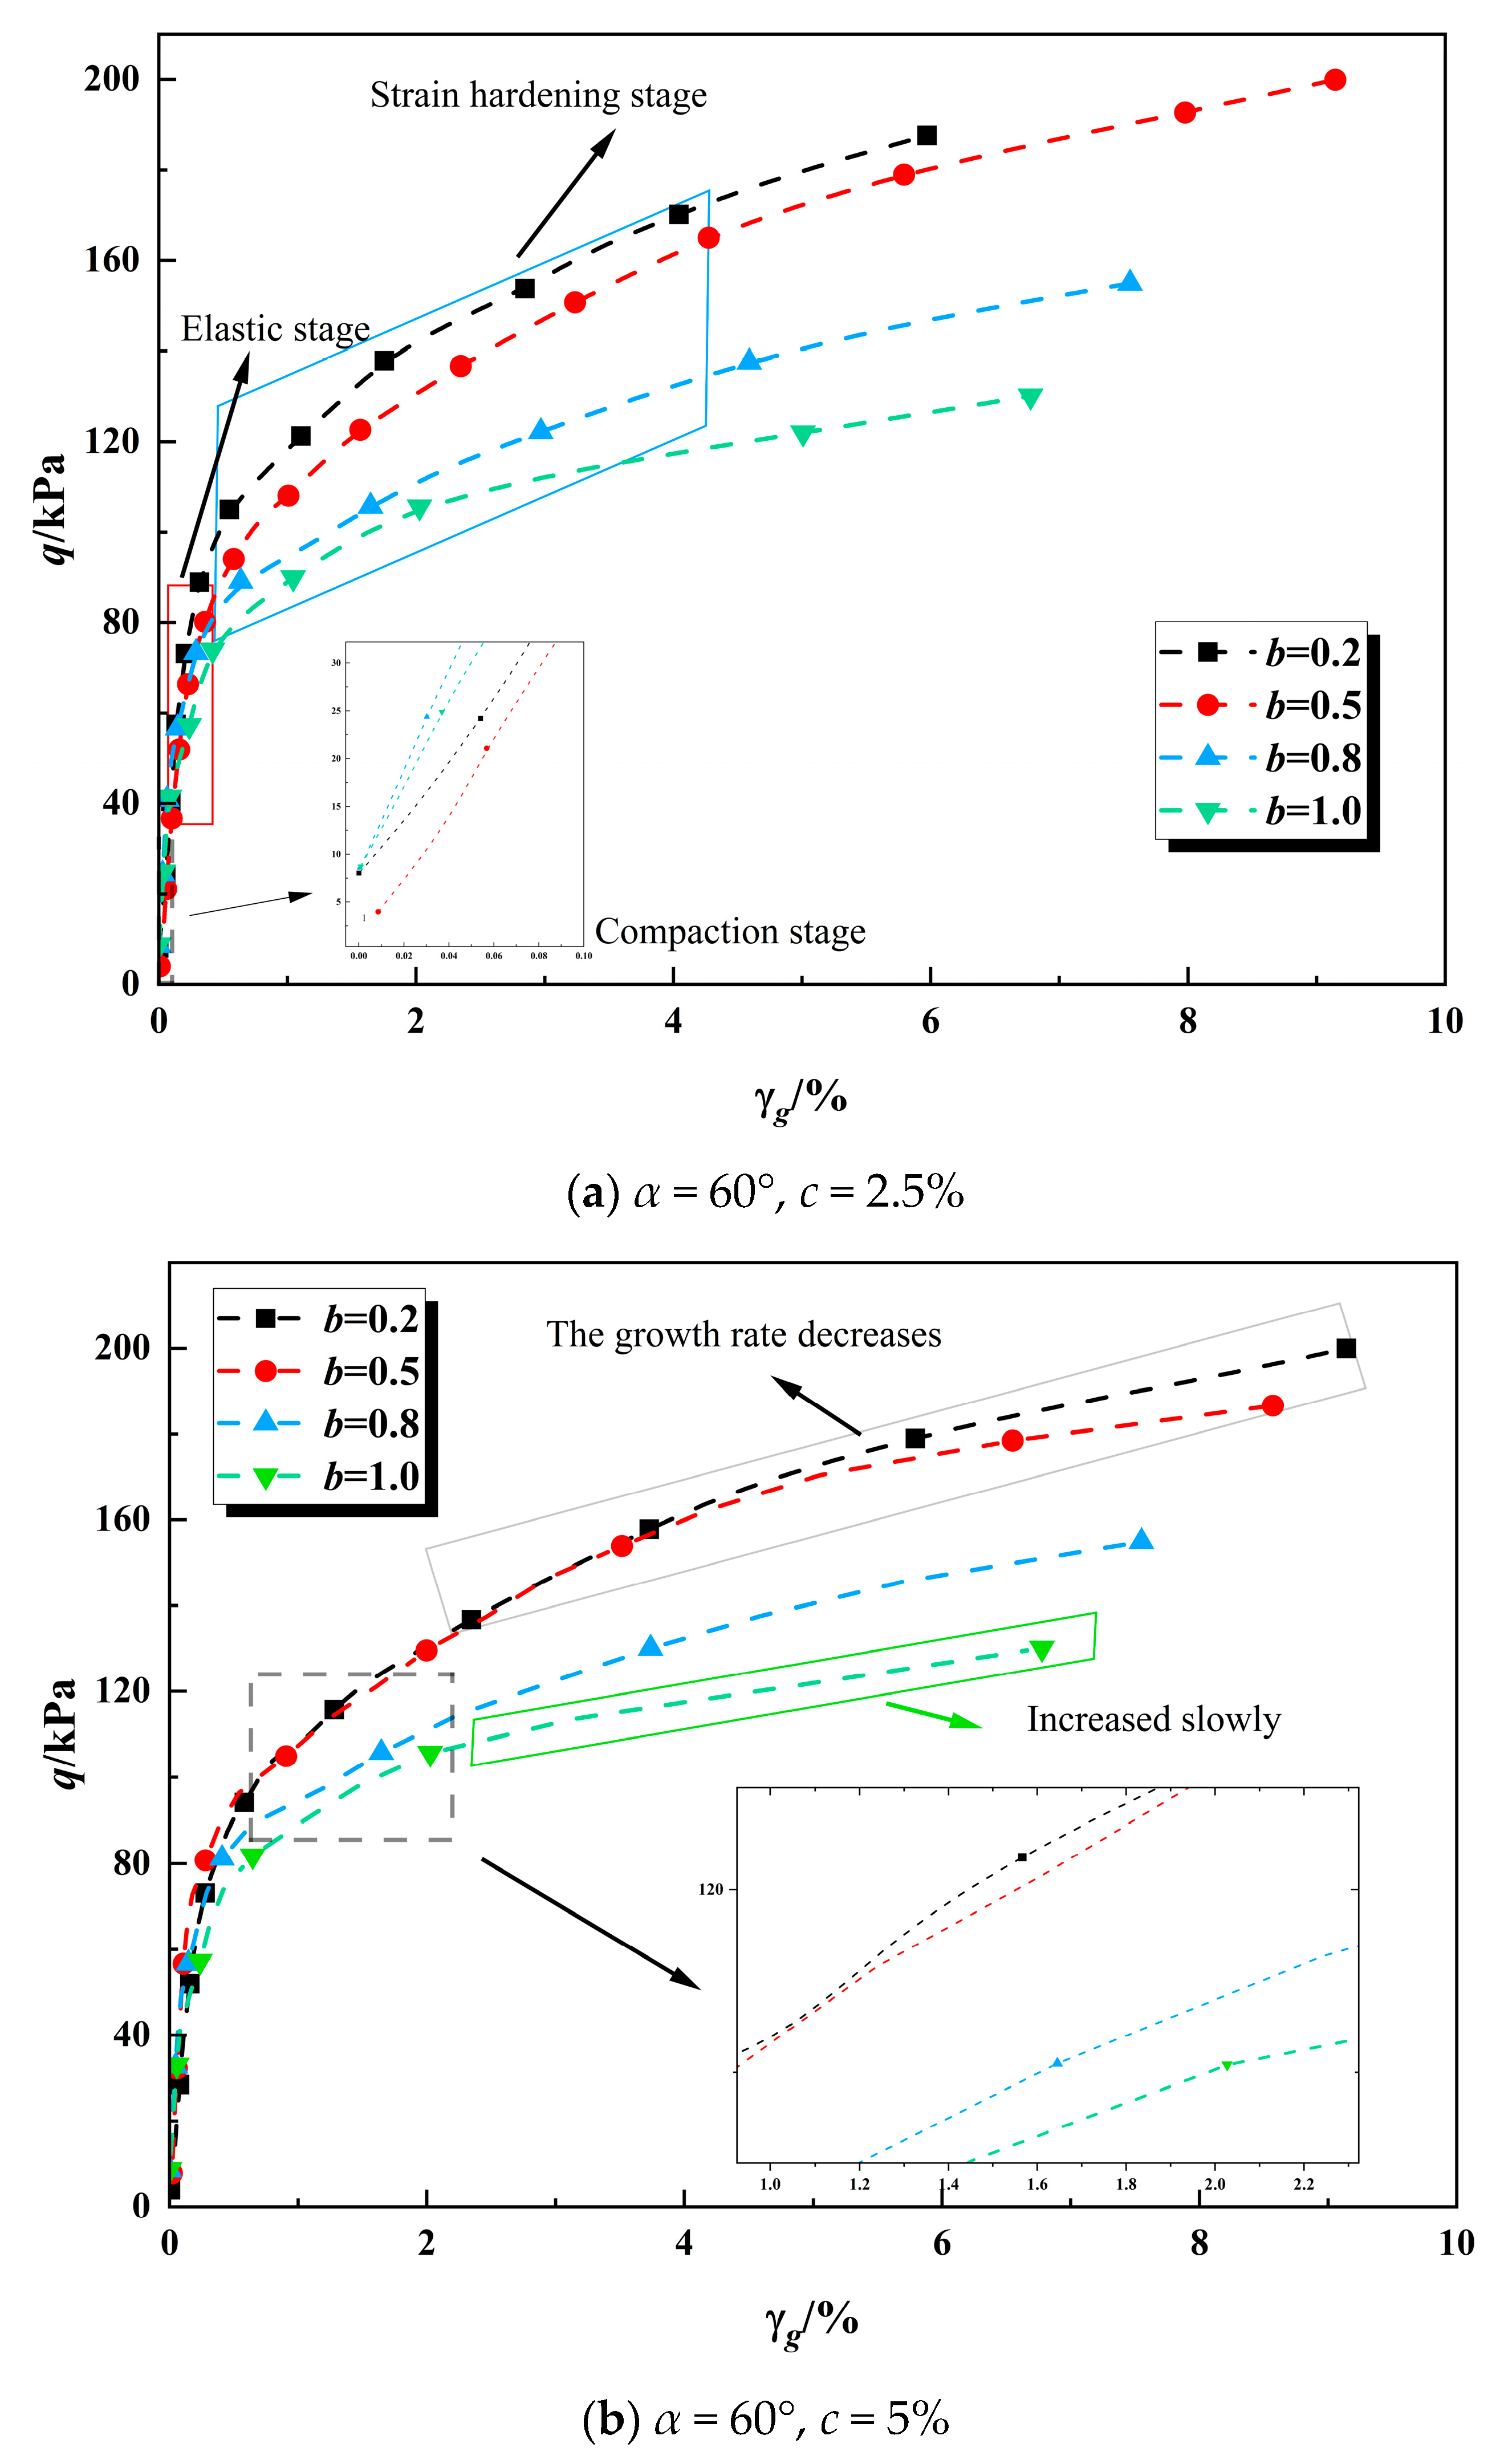
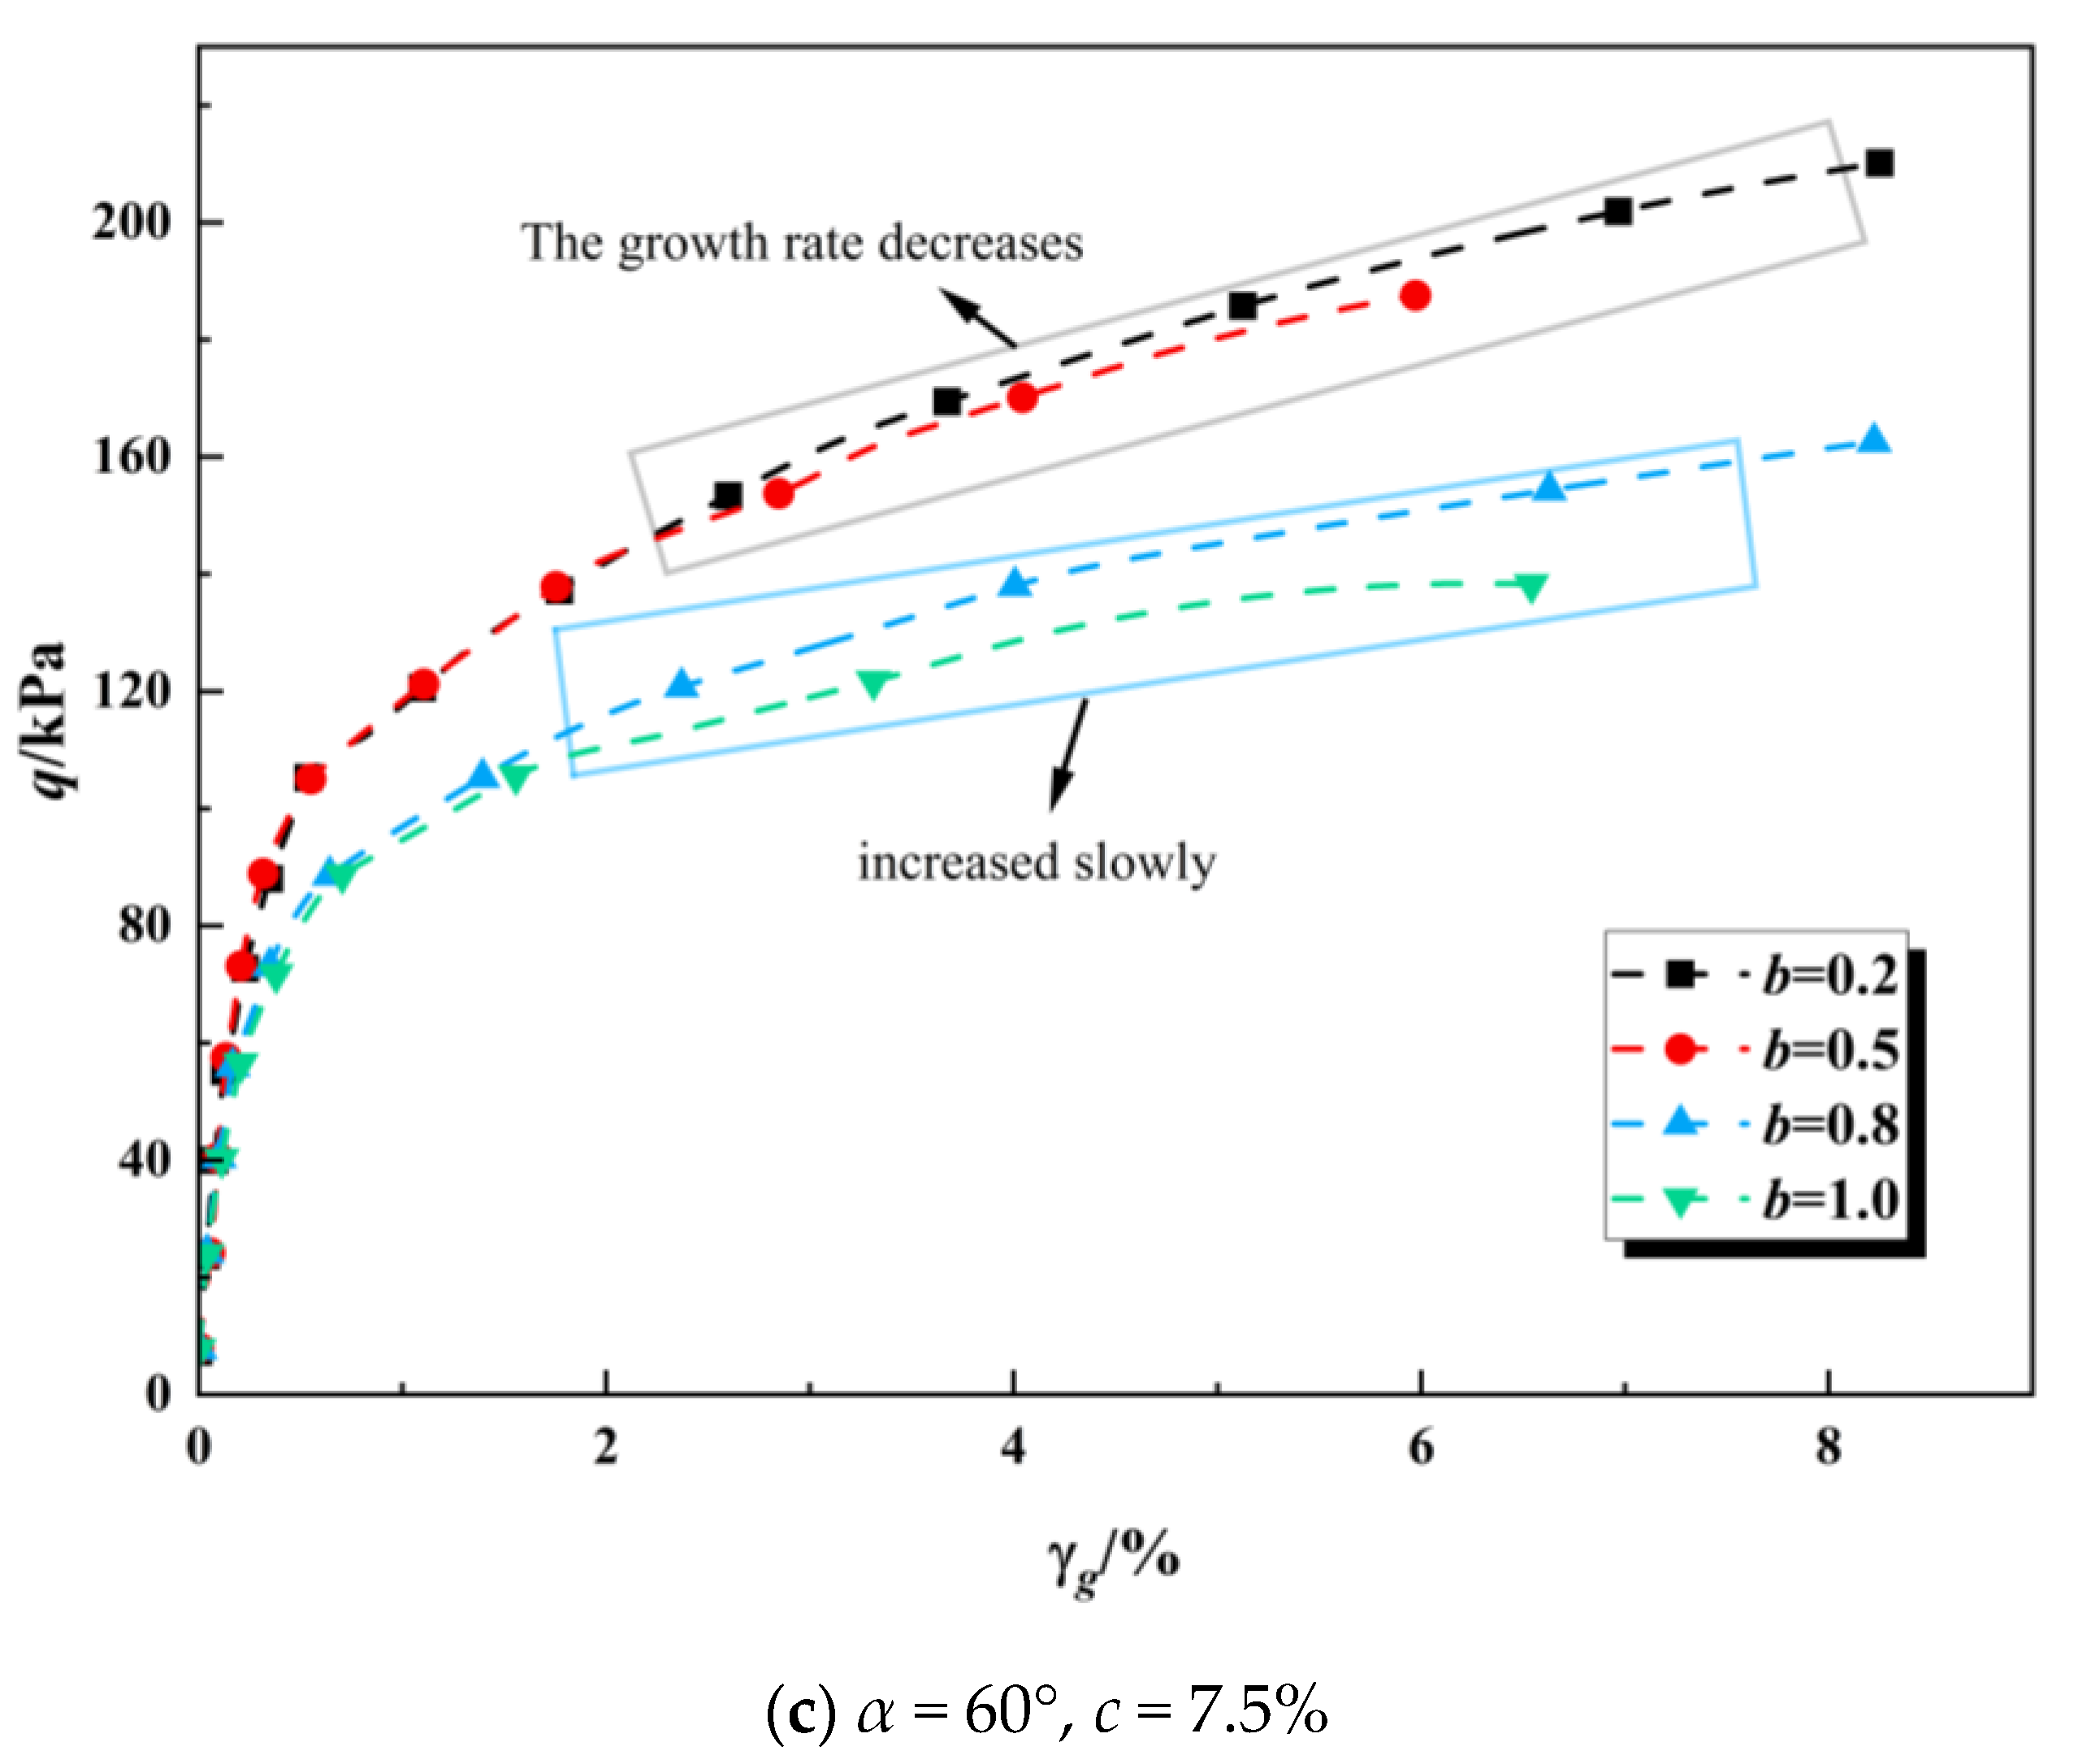
3.2. Stress–Strain Relationships Under Different Intermediate Principal Stress Coefficients
- (1)
- Compaction Stage: In the initial loading phase, when the major principal strain is below 0.1%, the calcareous sand particles, the cementitious matrix of the consolidated calcareous sand, and the internal pores of the sample undergo rearrangement. This process transitions the sample towards a state capable of bearing load.
- (2)
- Elastic Stage: The curve demonstrates a linear increase when the strain is within 0.5%, indicating the elastic nature of this stage. During this phase, the sample undergoes elastic deformation, which is fully recoverable upon unloading. Notably, the elastic modulus decreases as the intermediate principal stress coefficient increases.
- (3)
- Strain Hardening Stage: In this phase, as the load progressively increases, the calcareous sand particles and cementitious materials within the sample begin to experience damage. The initiation of microcracks leads to a faster rate of strain increase relative to stress. This stage is critical for the onset of damage within the sample.
- (4)
- Failure Stage: During this final stage, the stress exhibits minimal change while the strain increases rapidly, signifying that the sample has reached a state of failure.
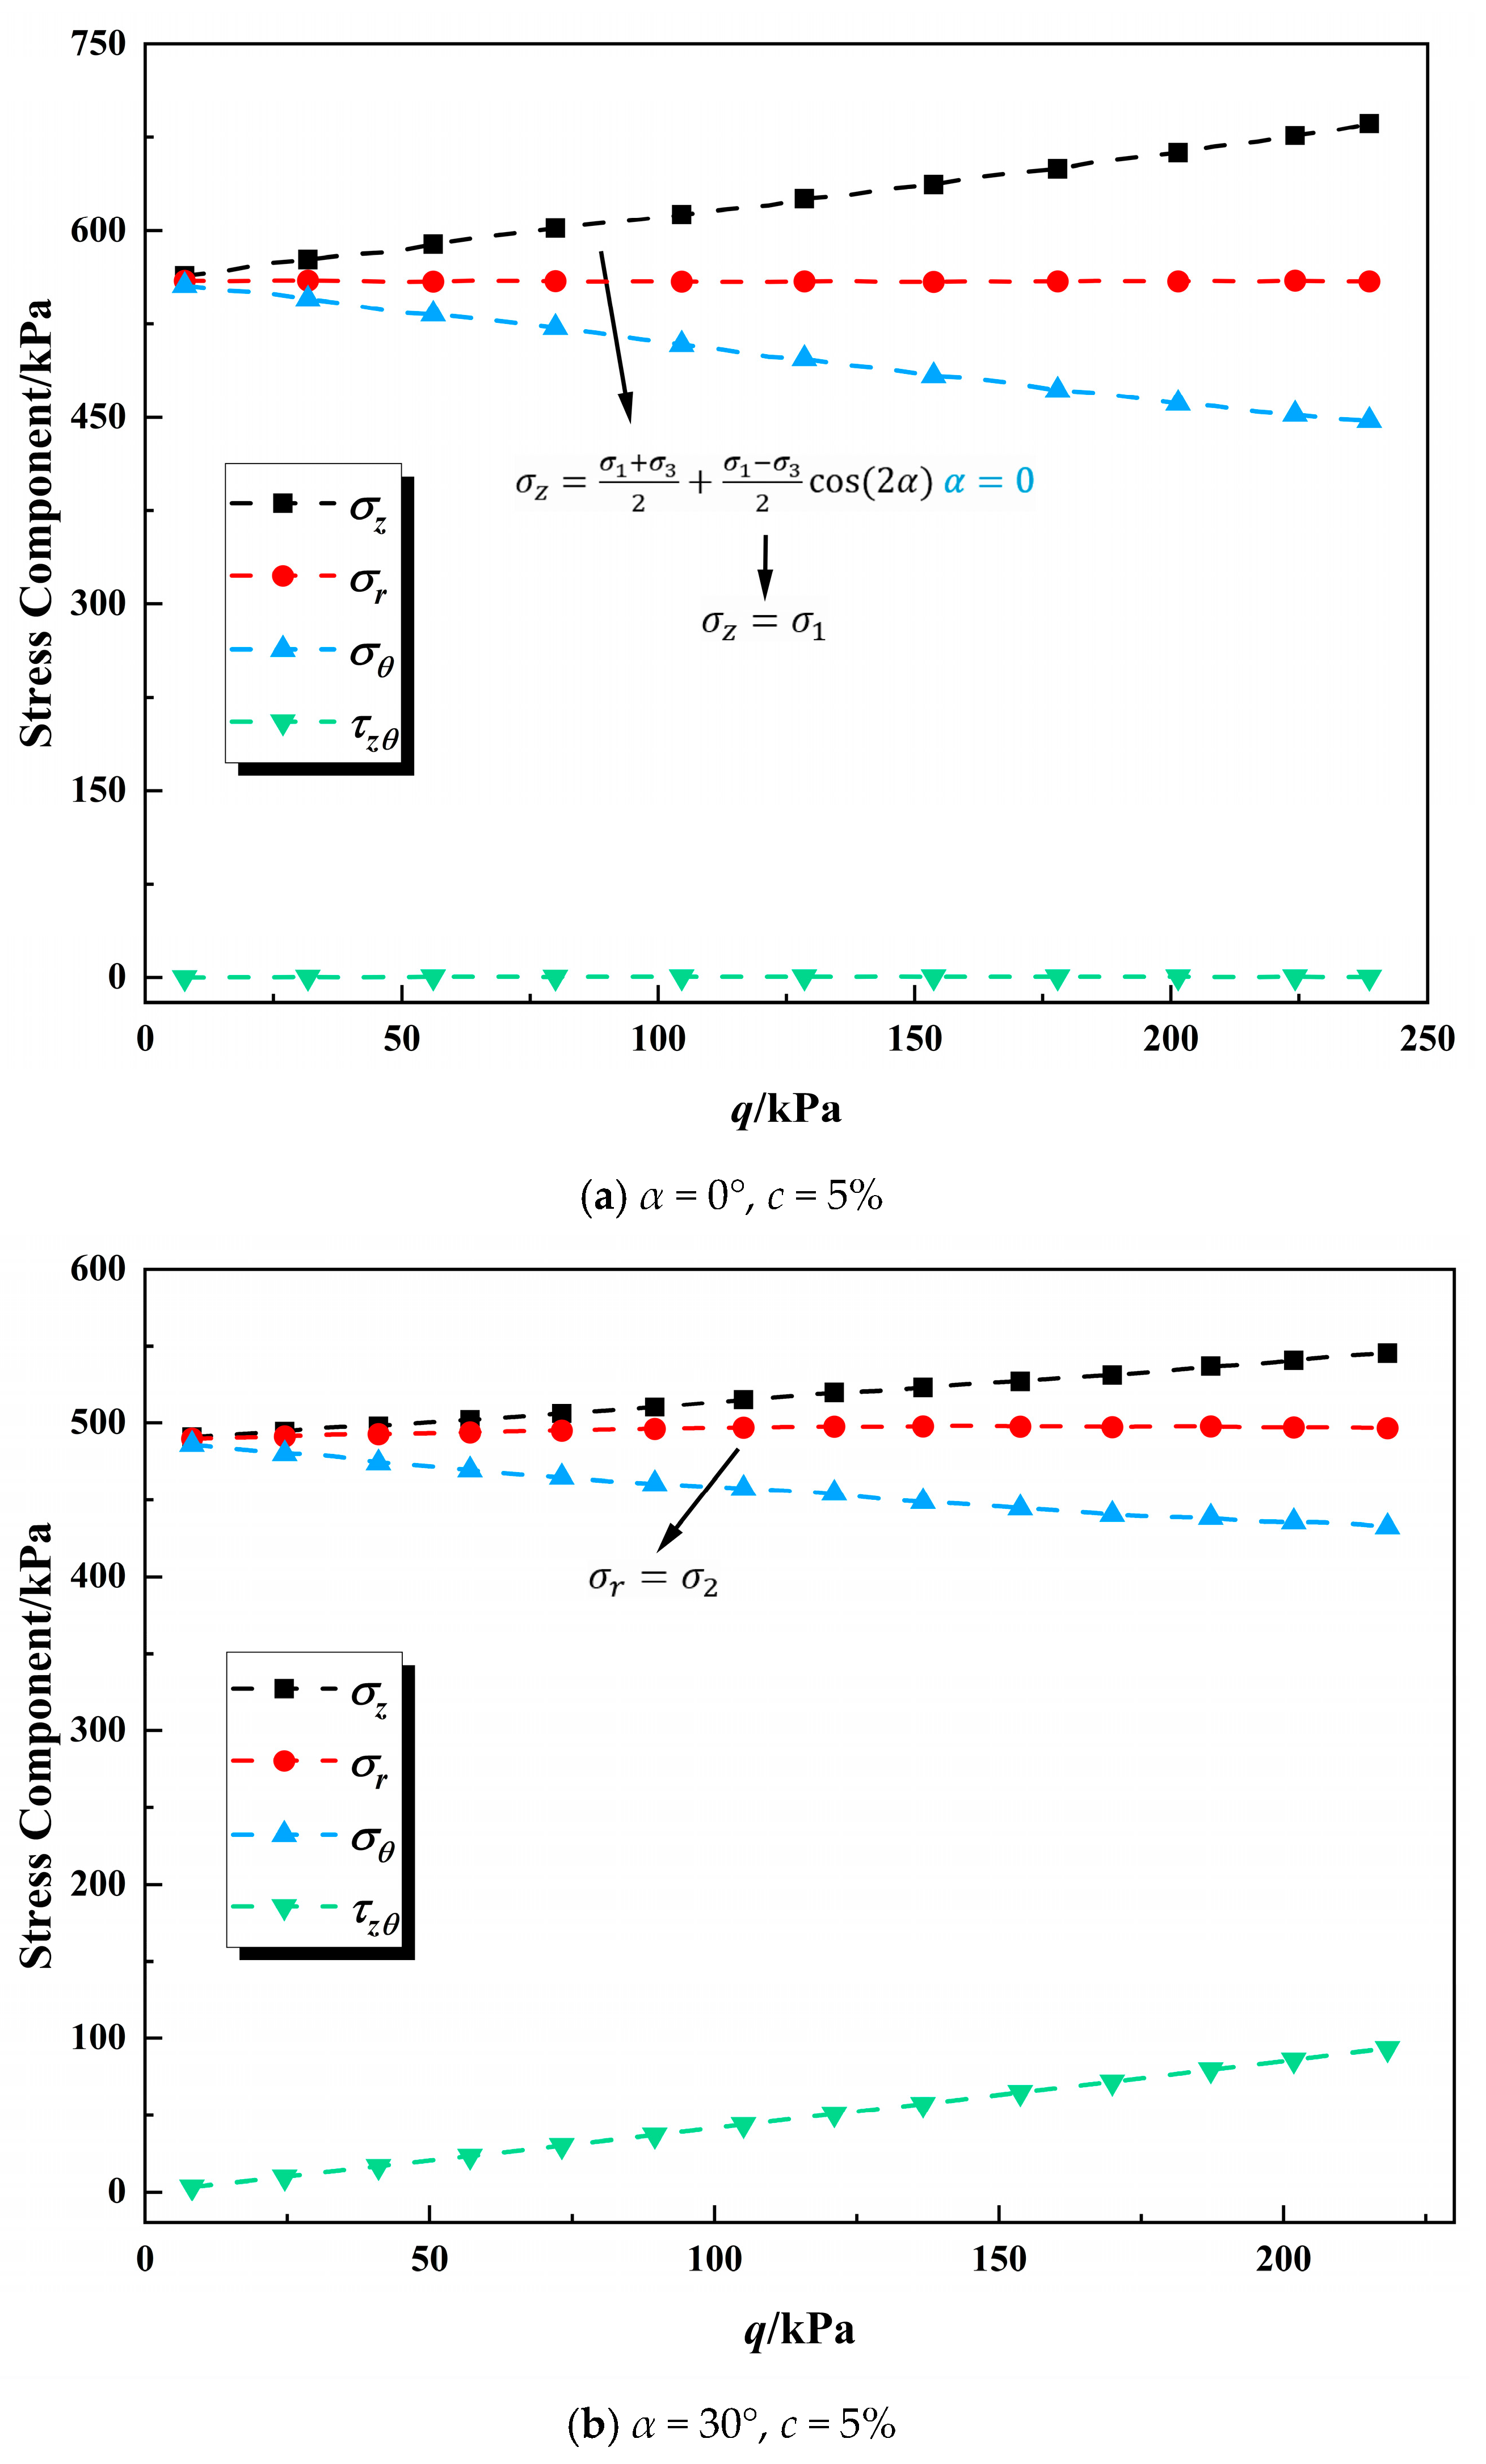
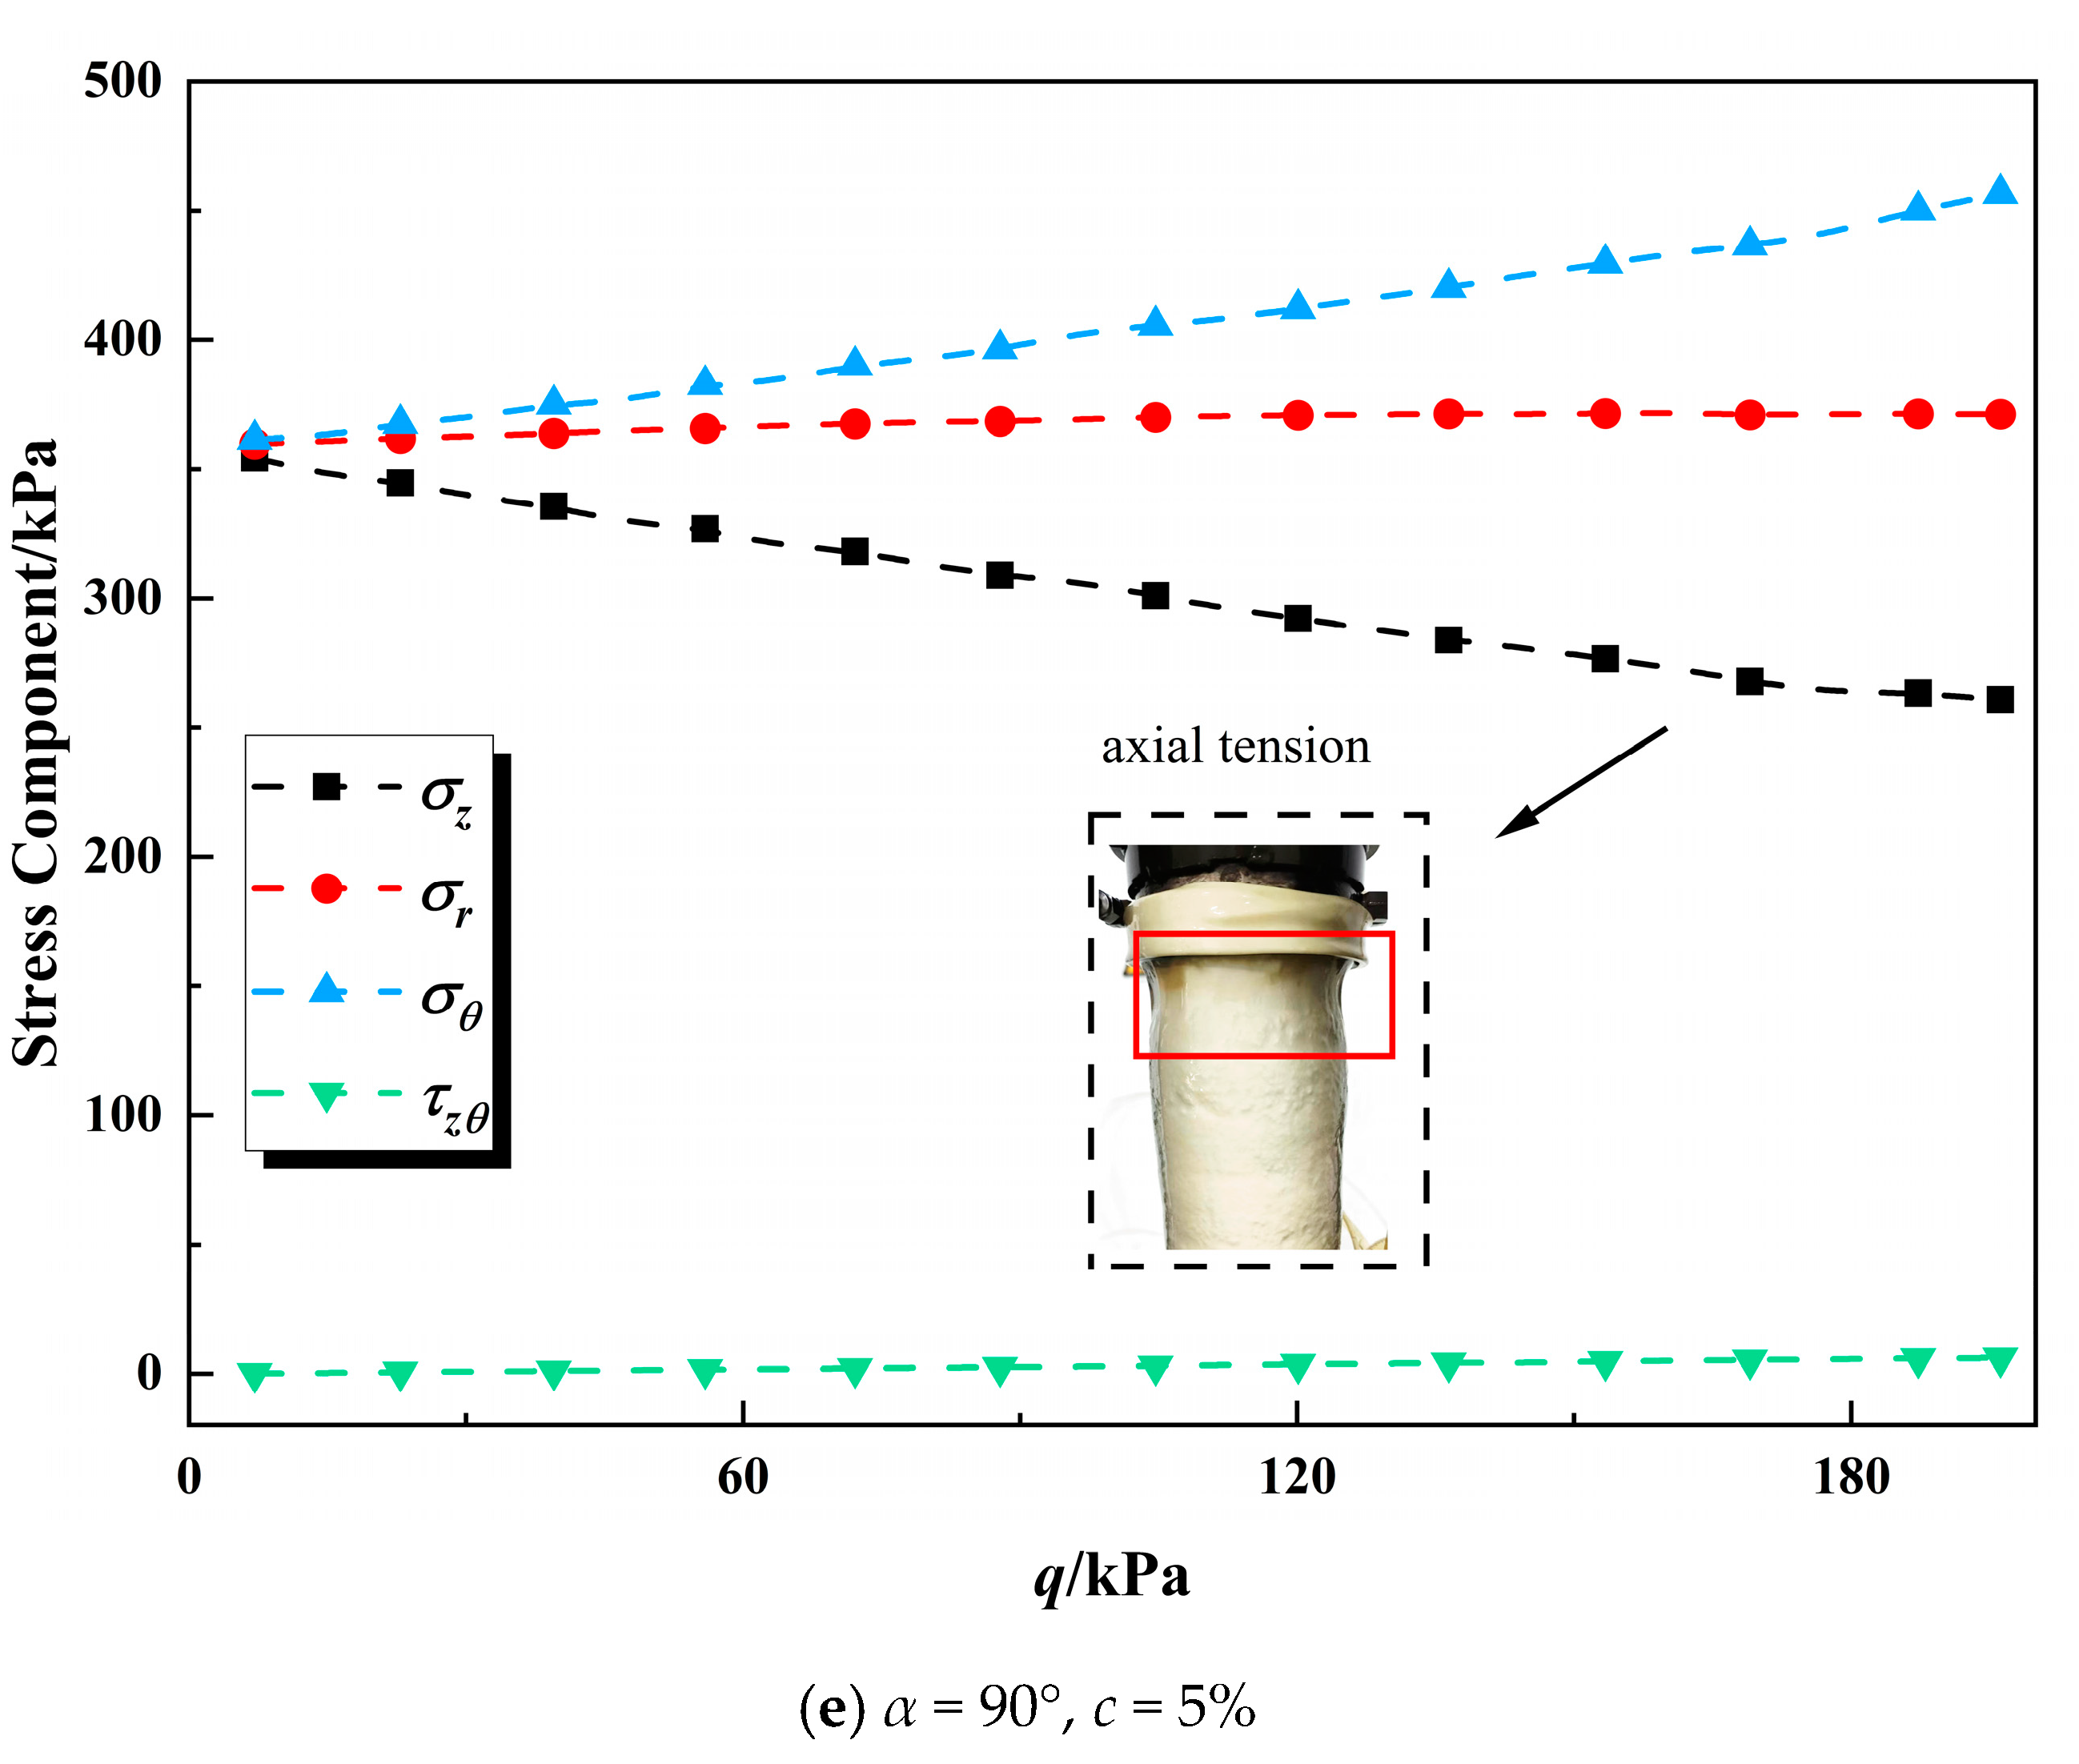
3.3. Stress Component
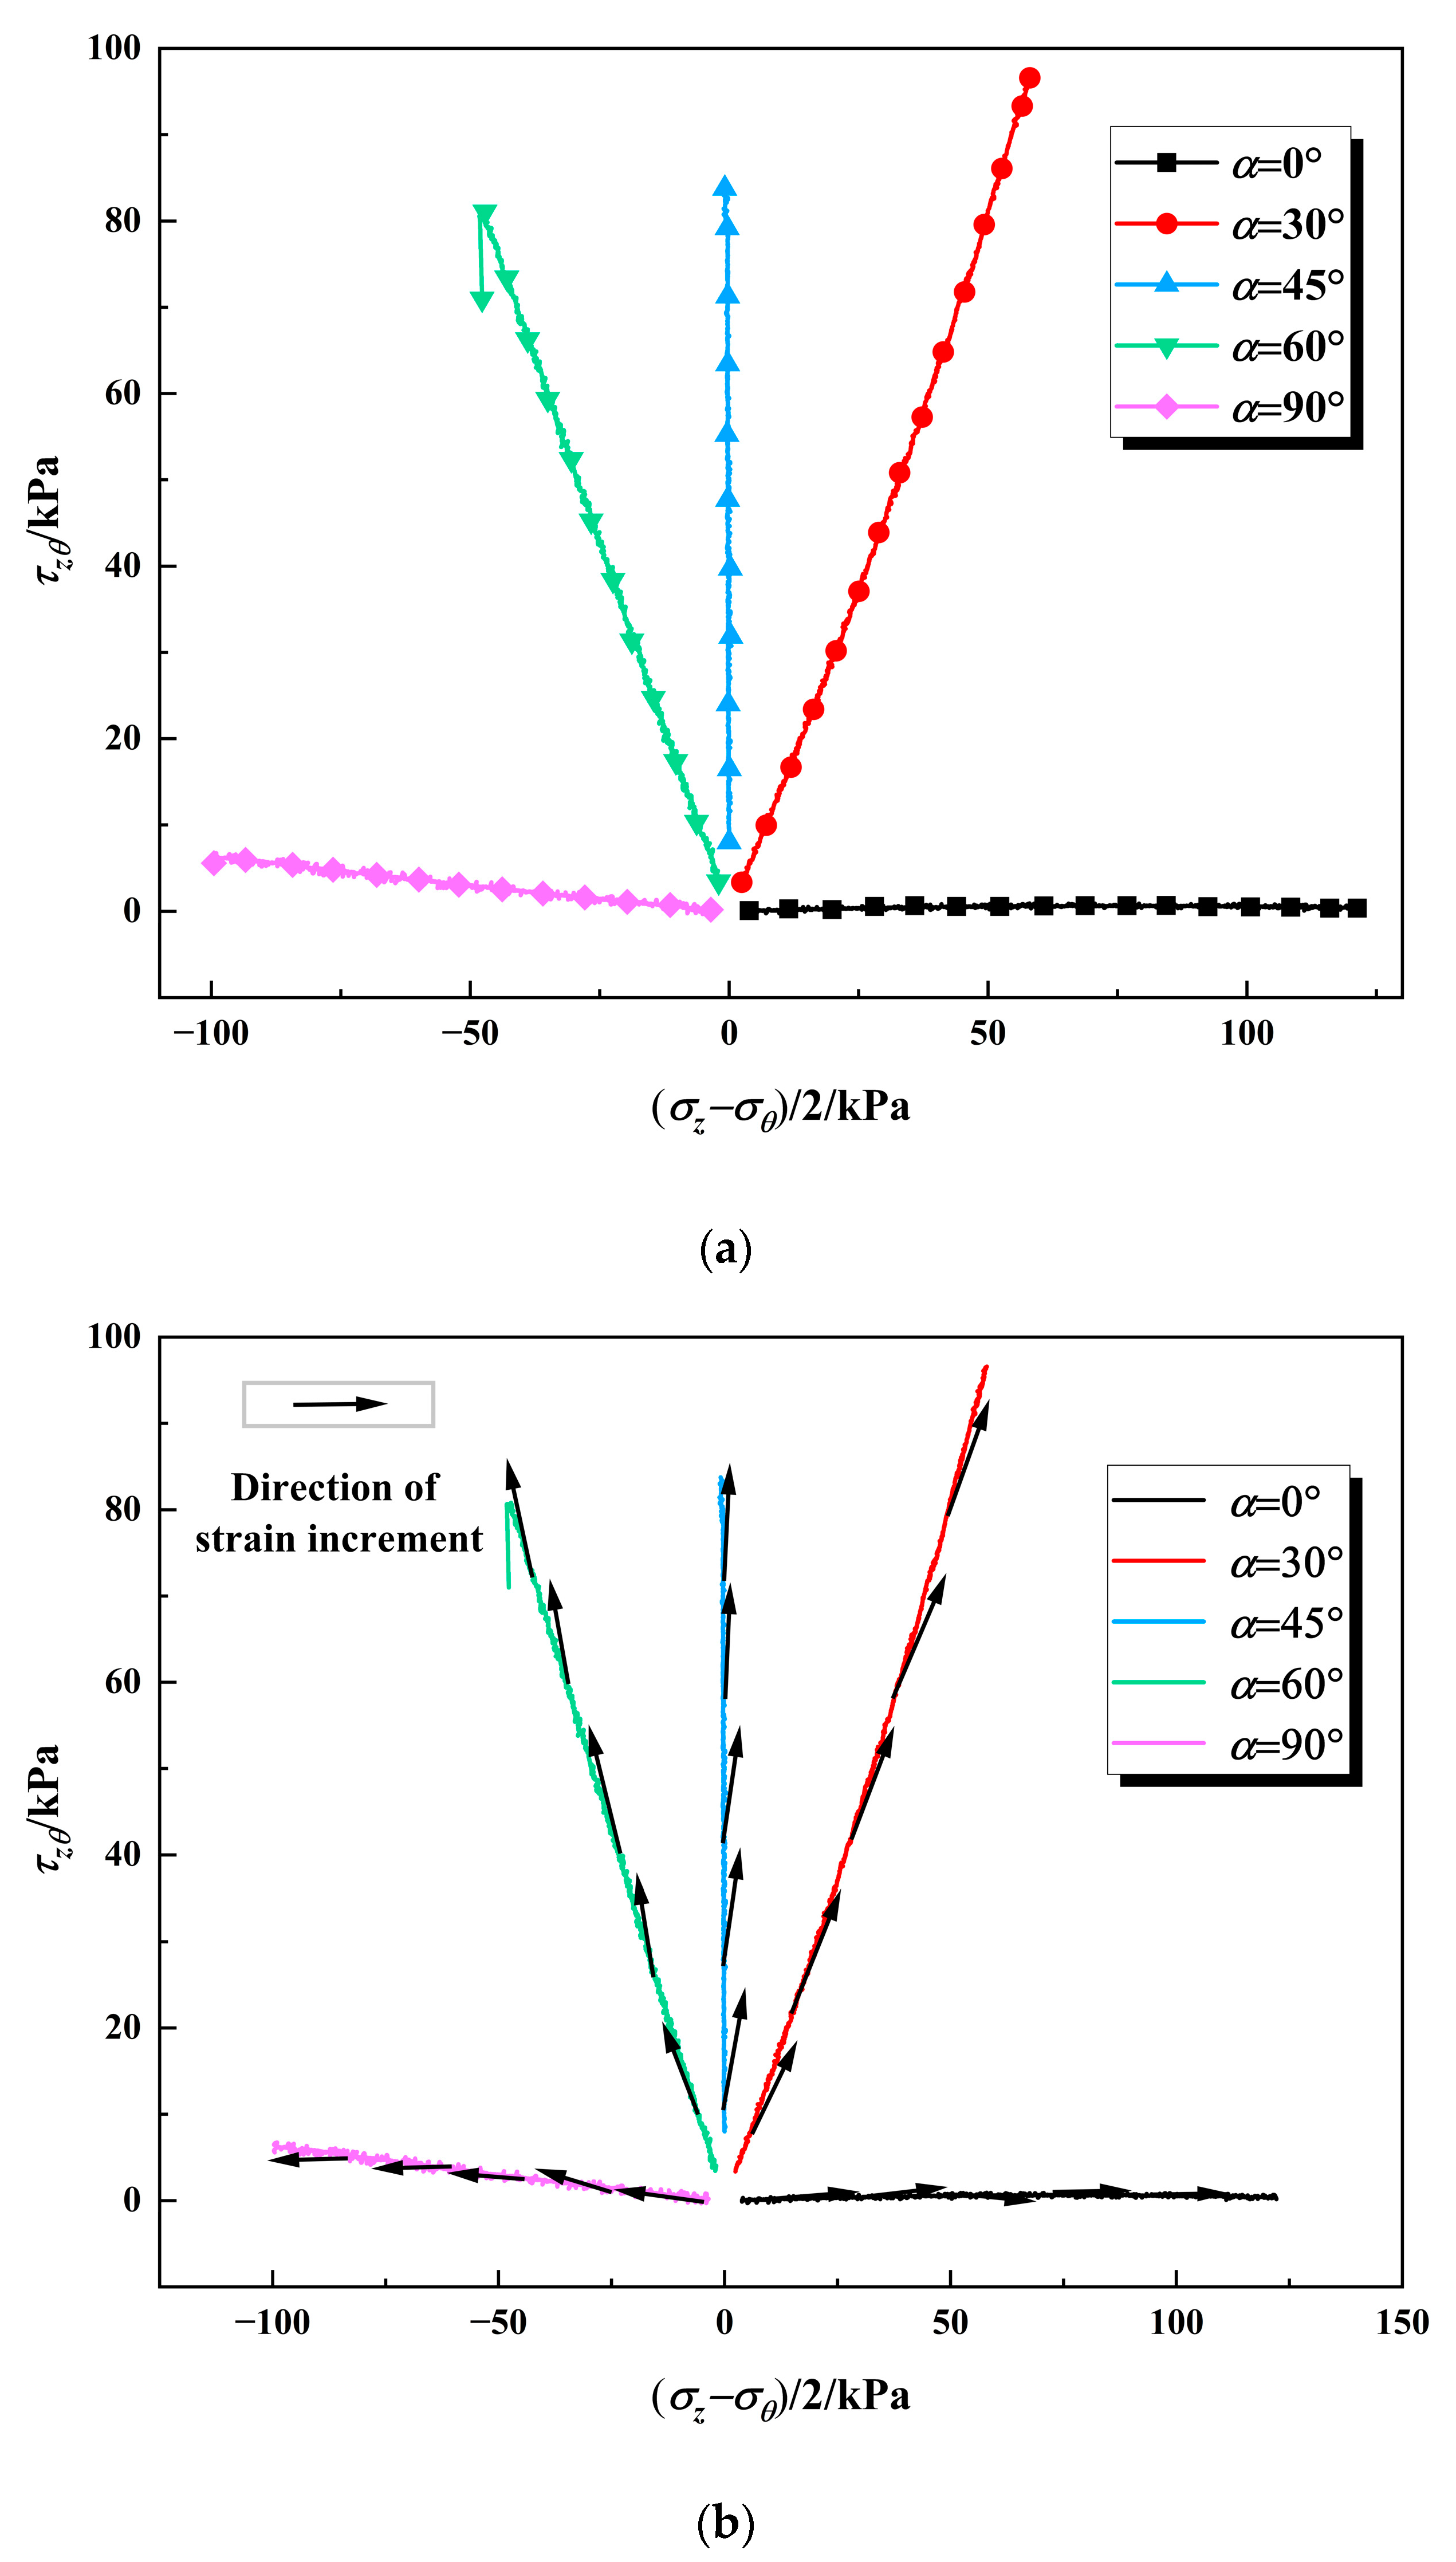
3.4. Non-Coaxial Characteristics
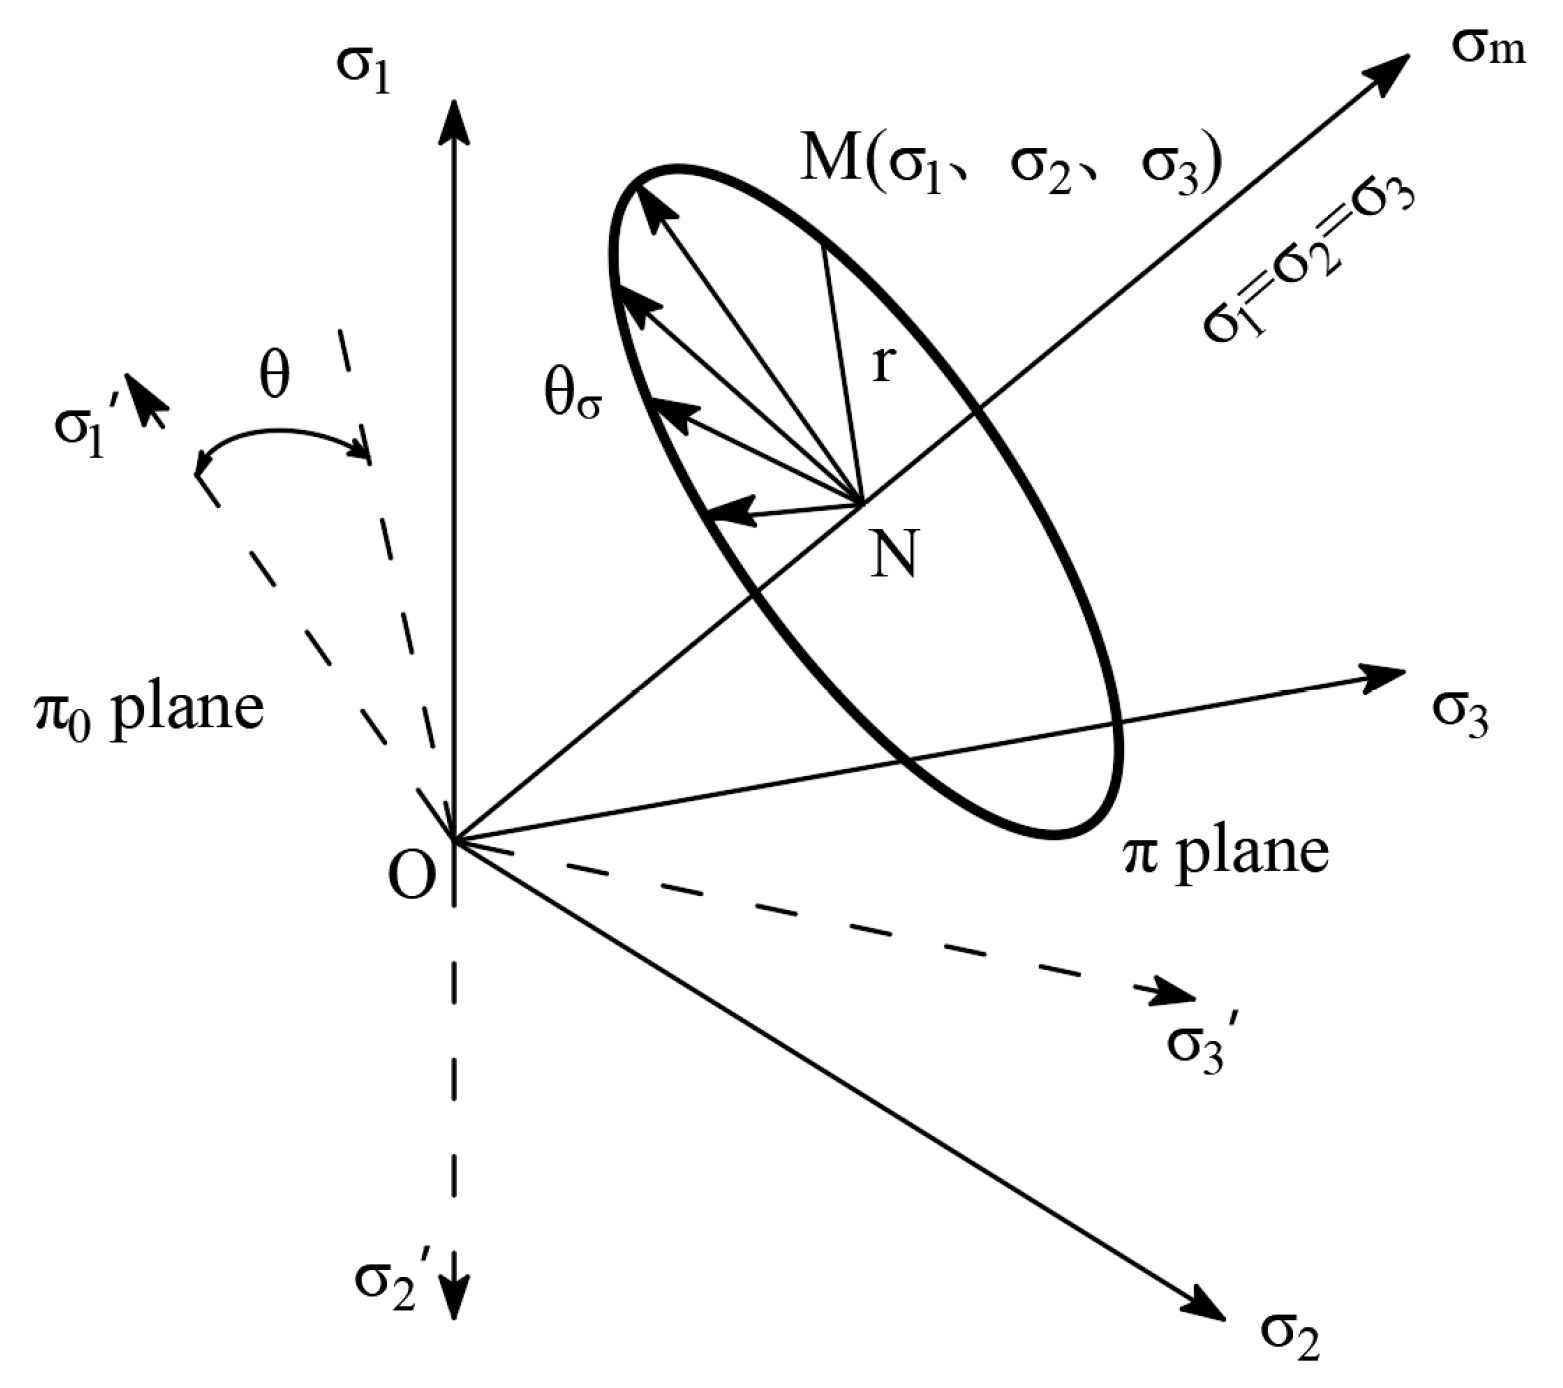
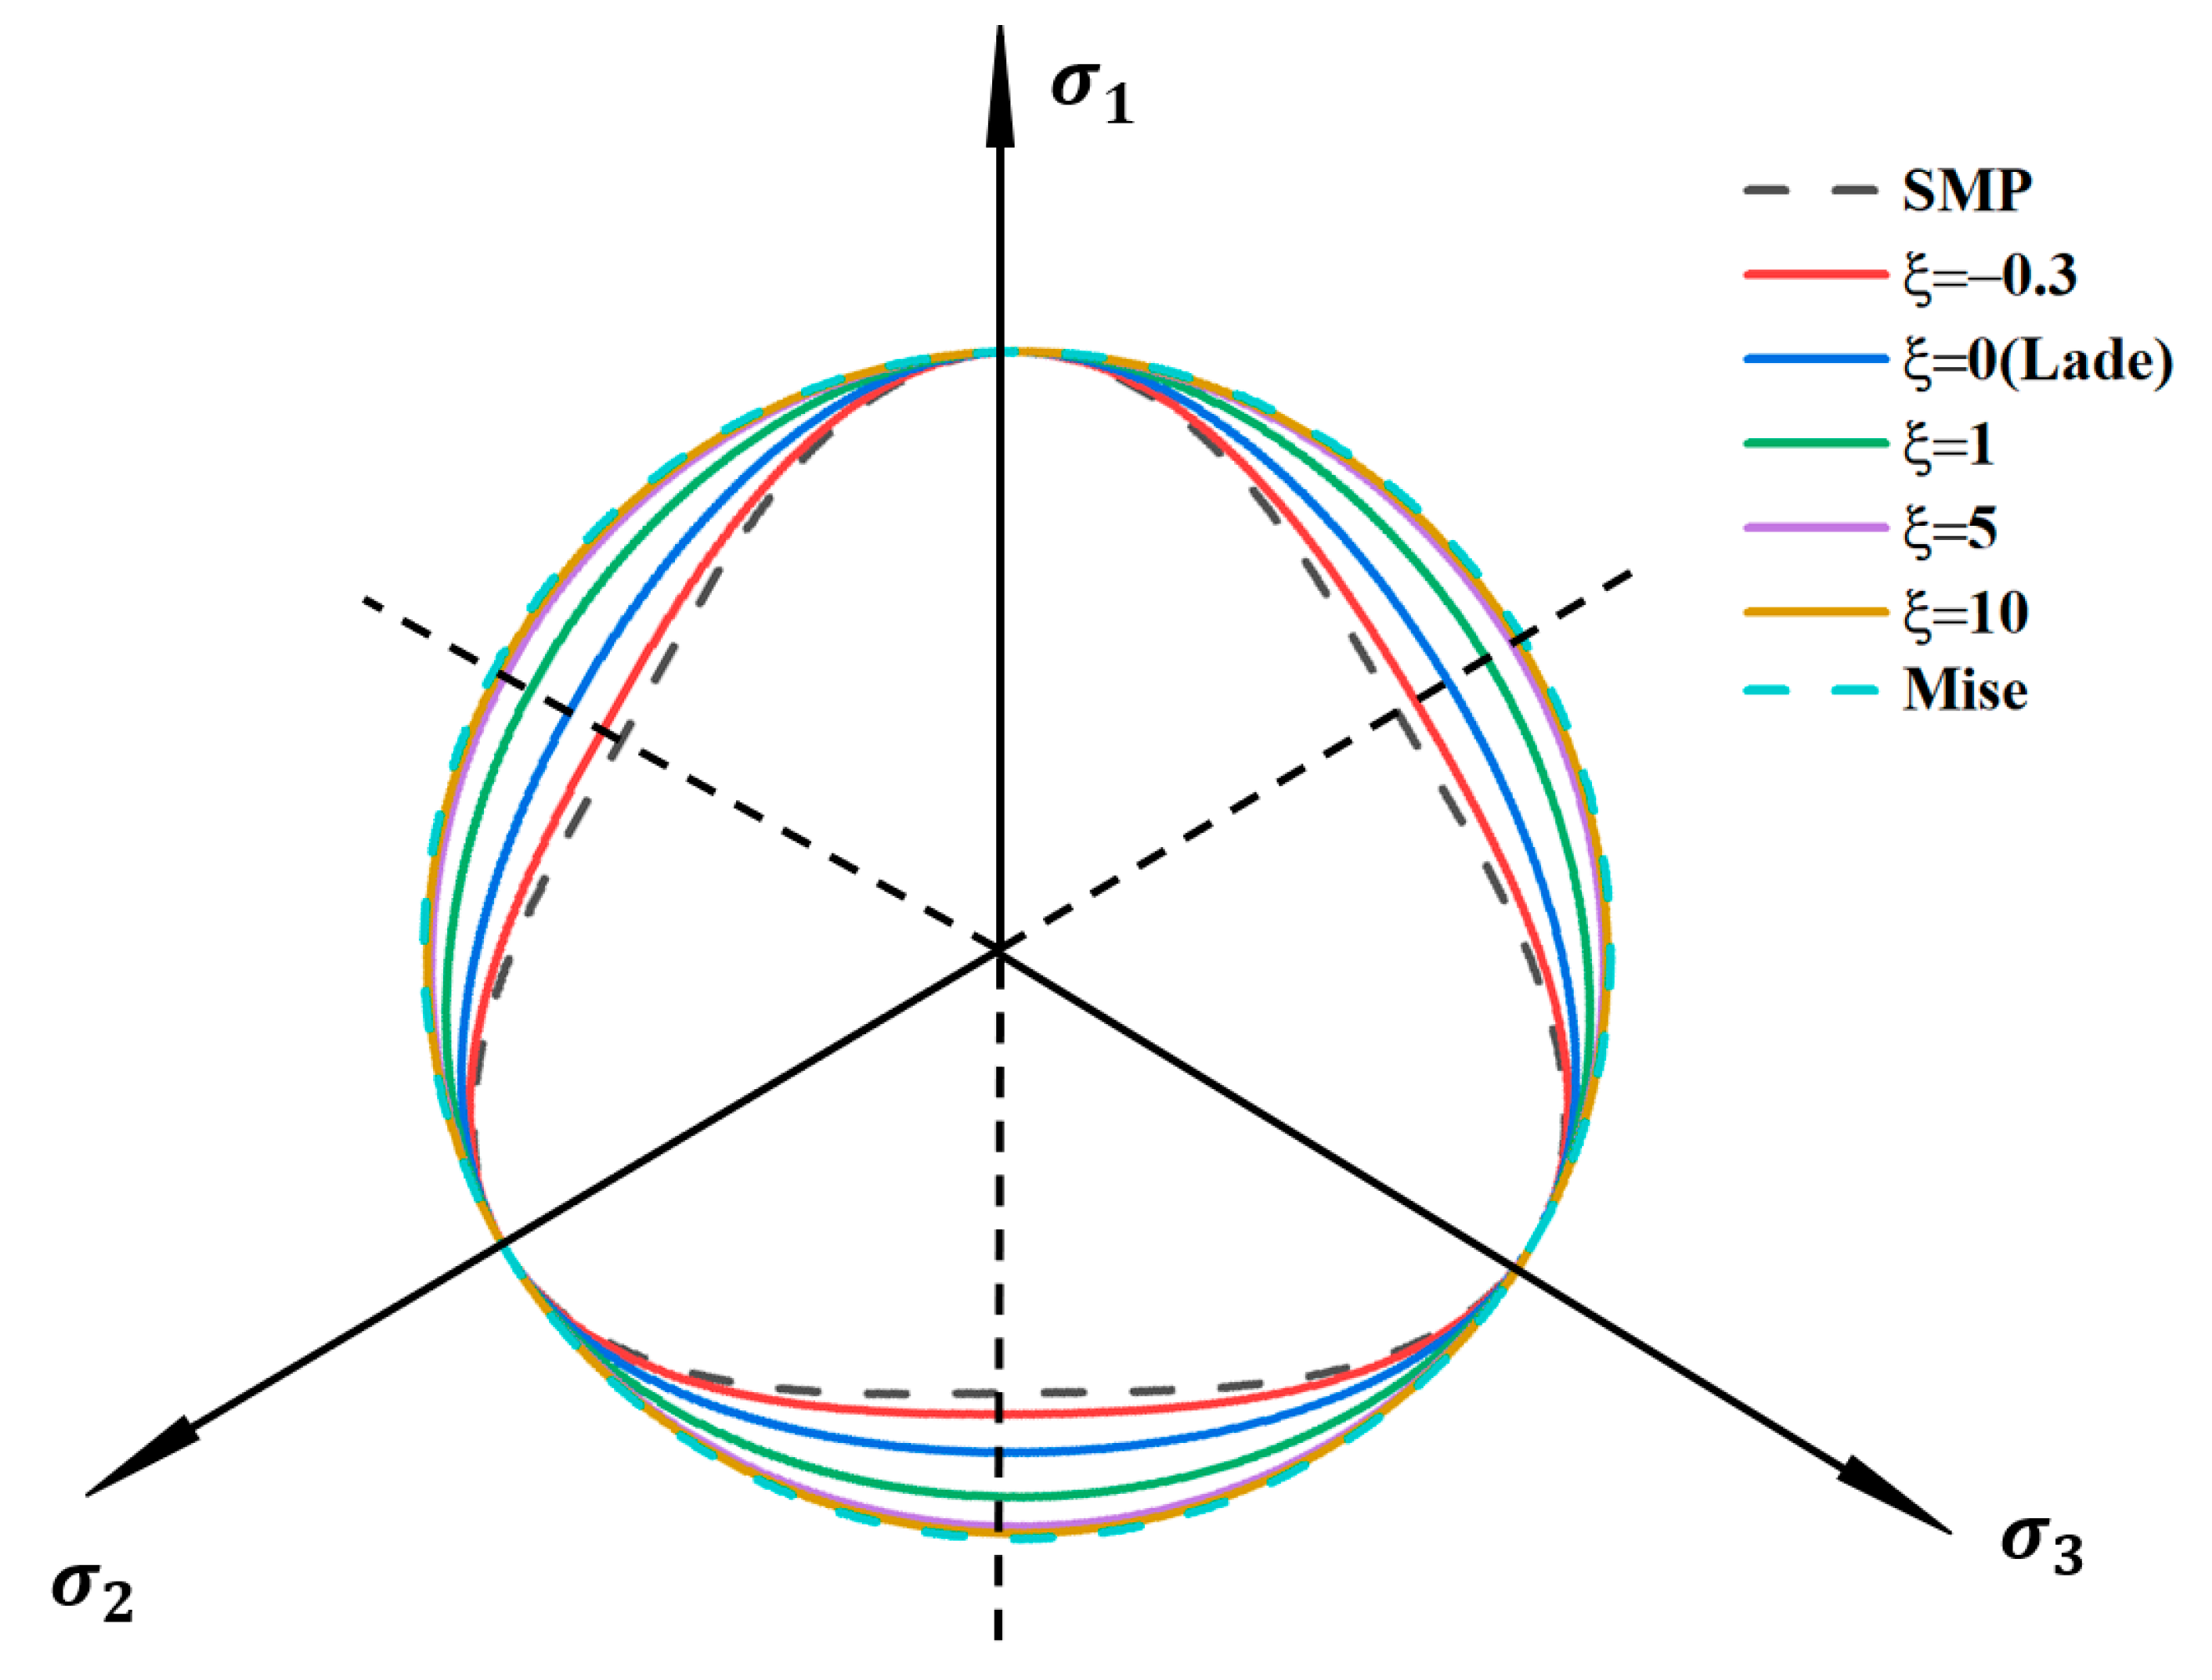
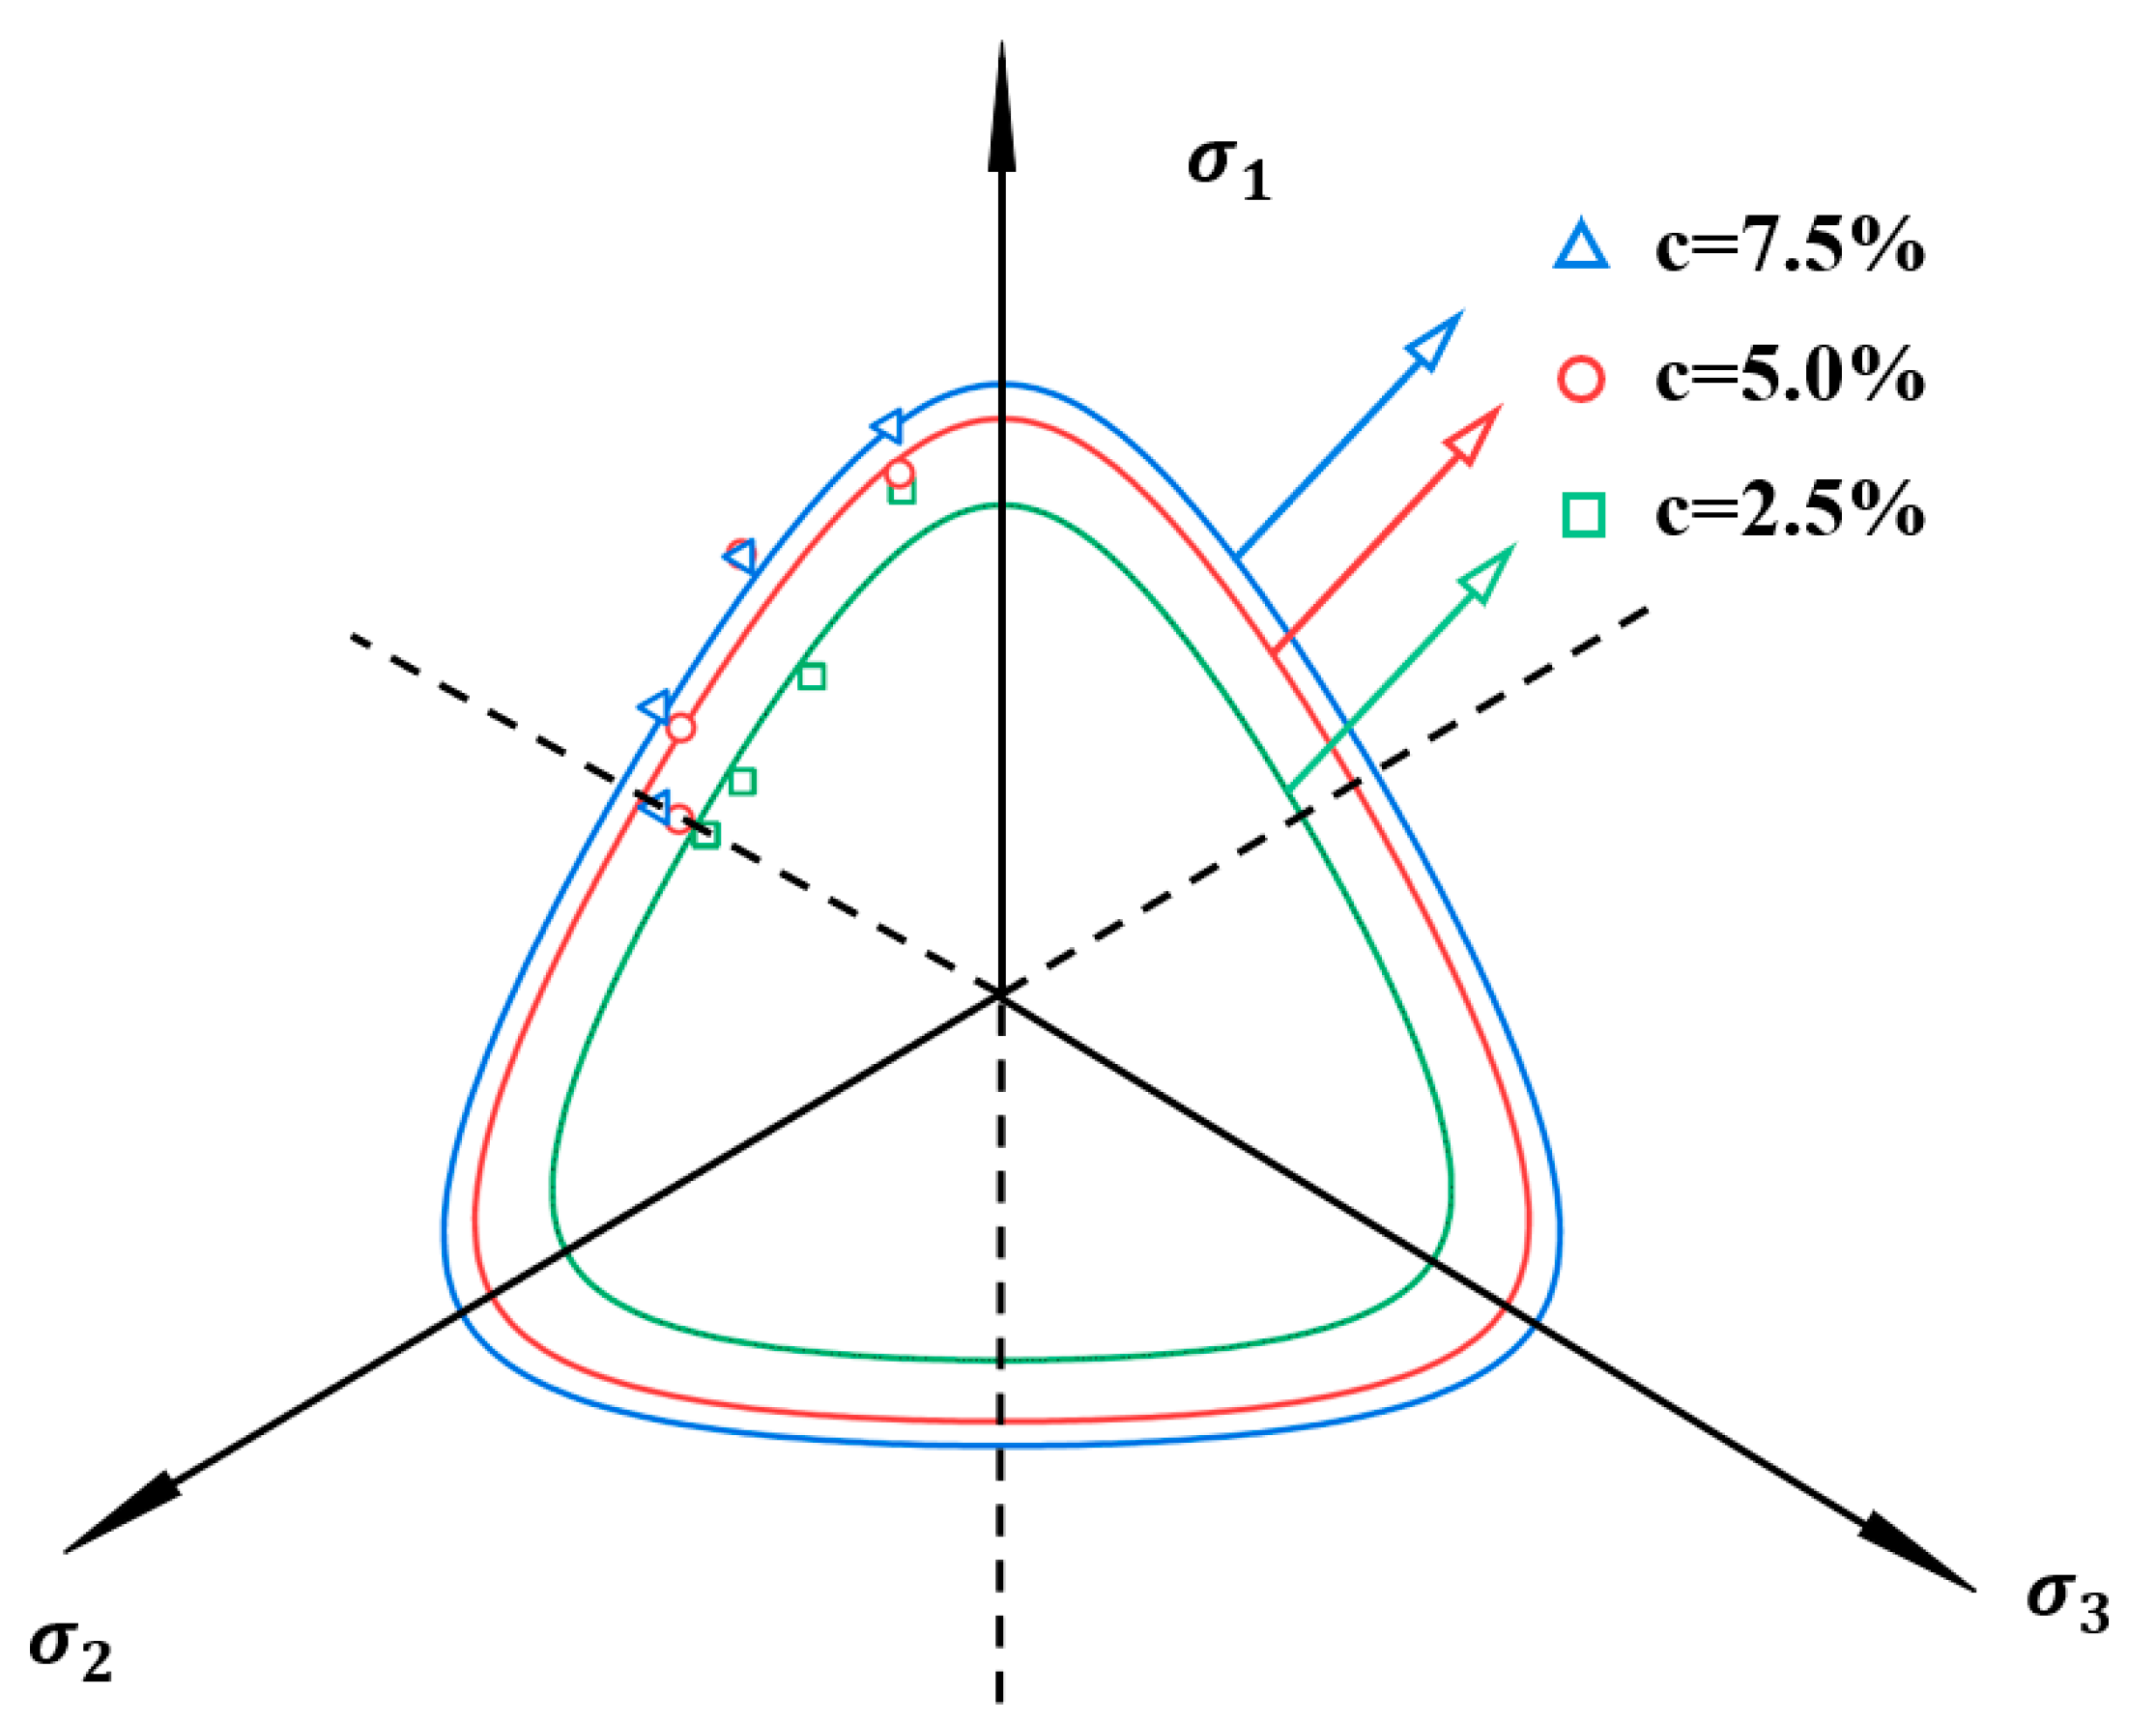
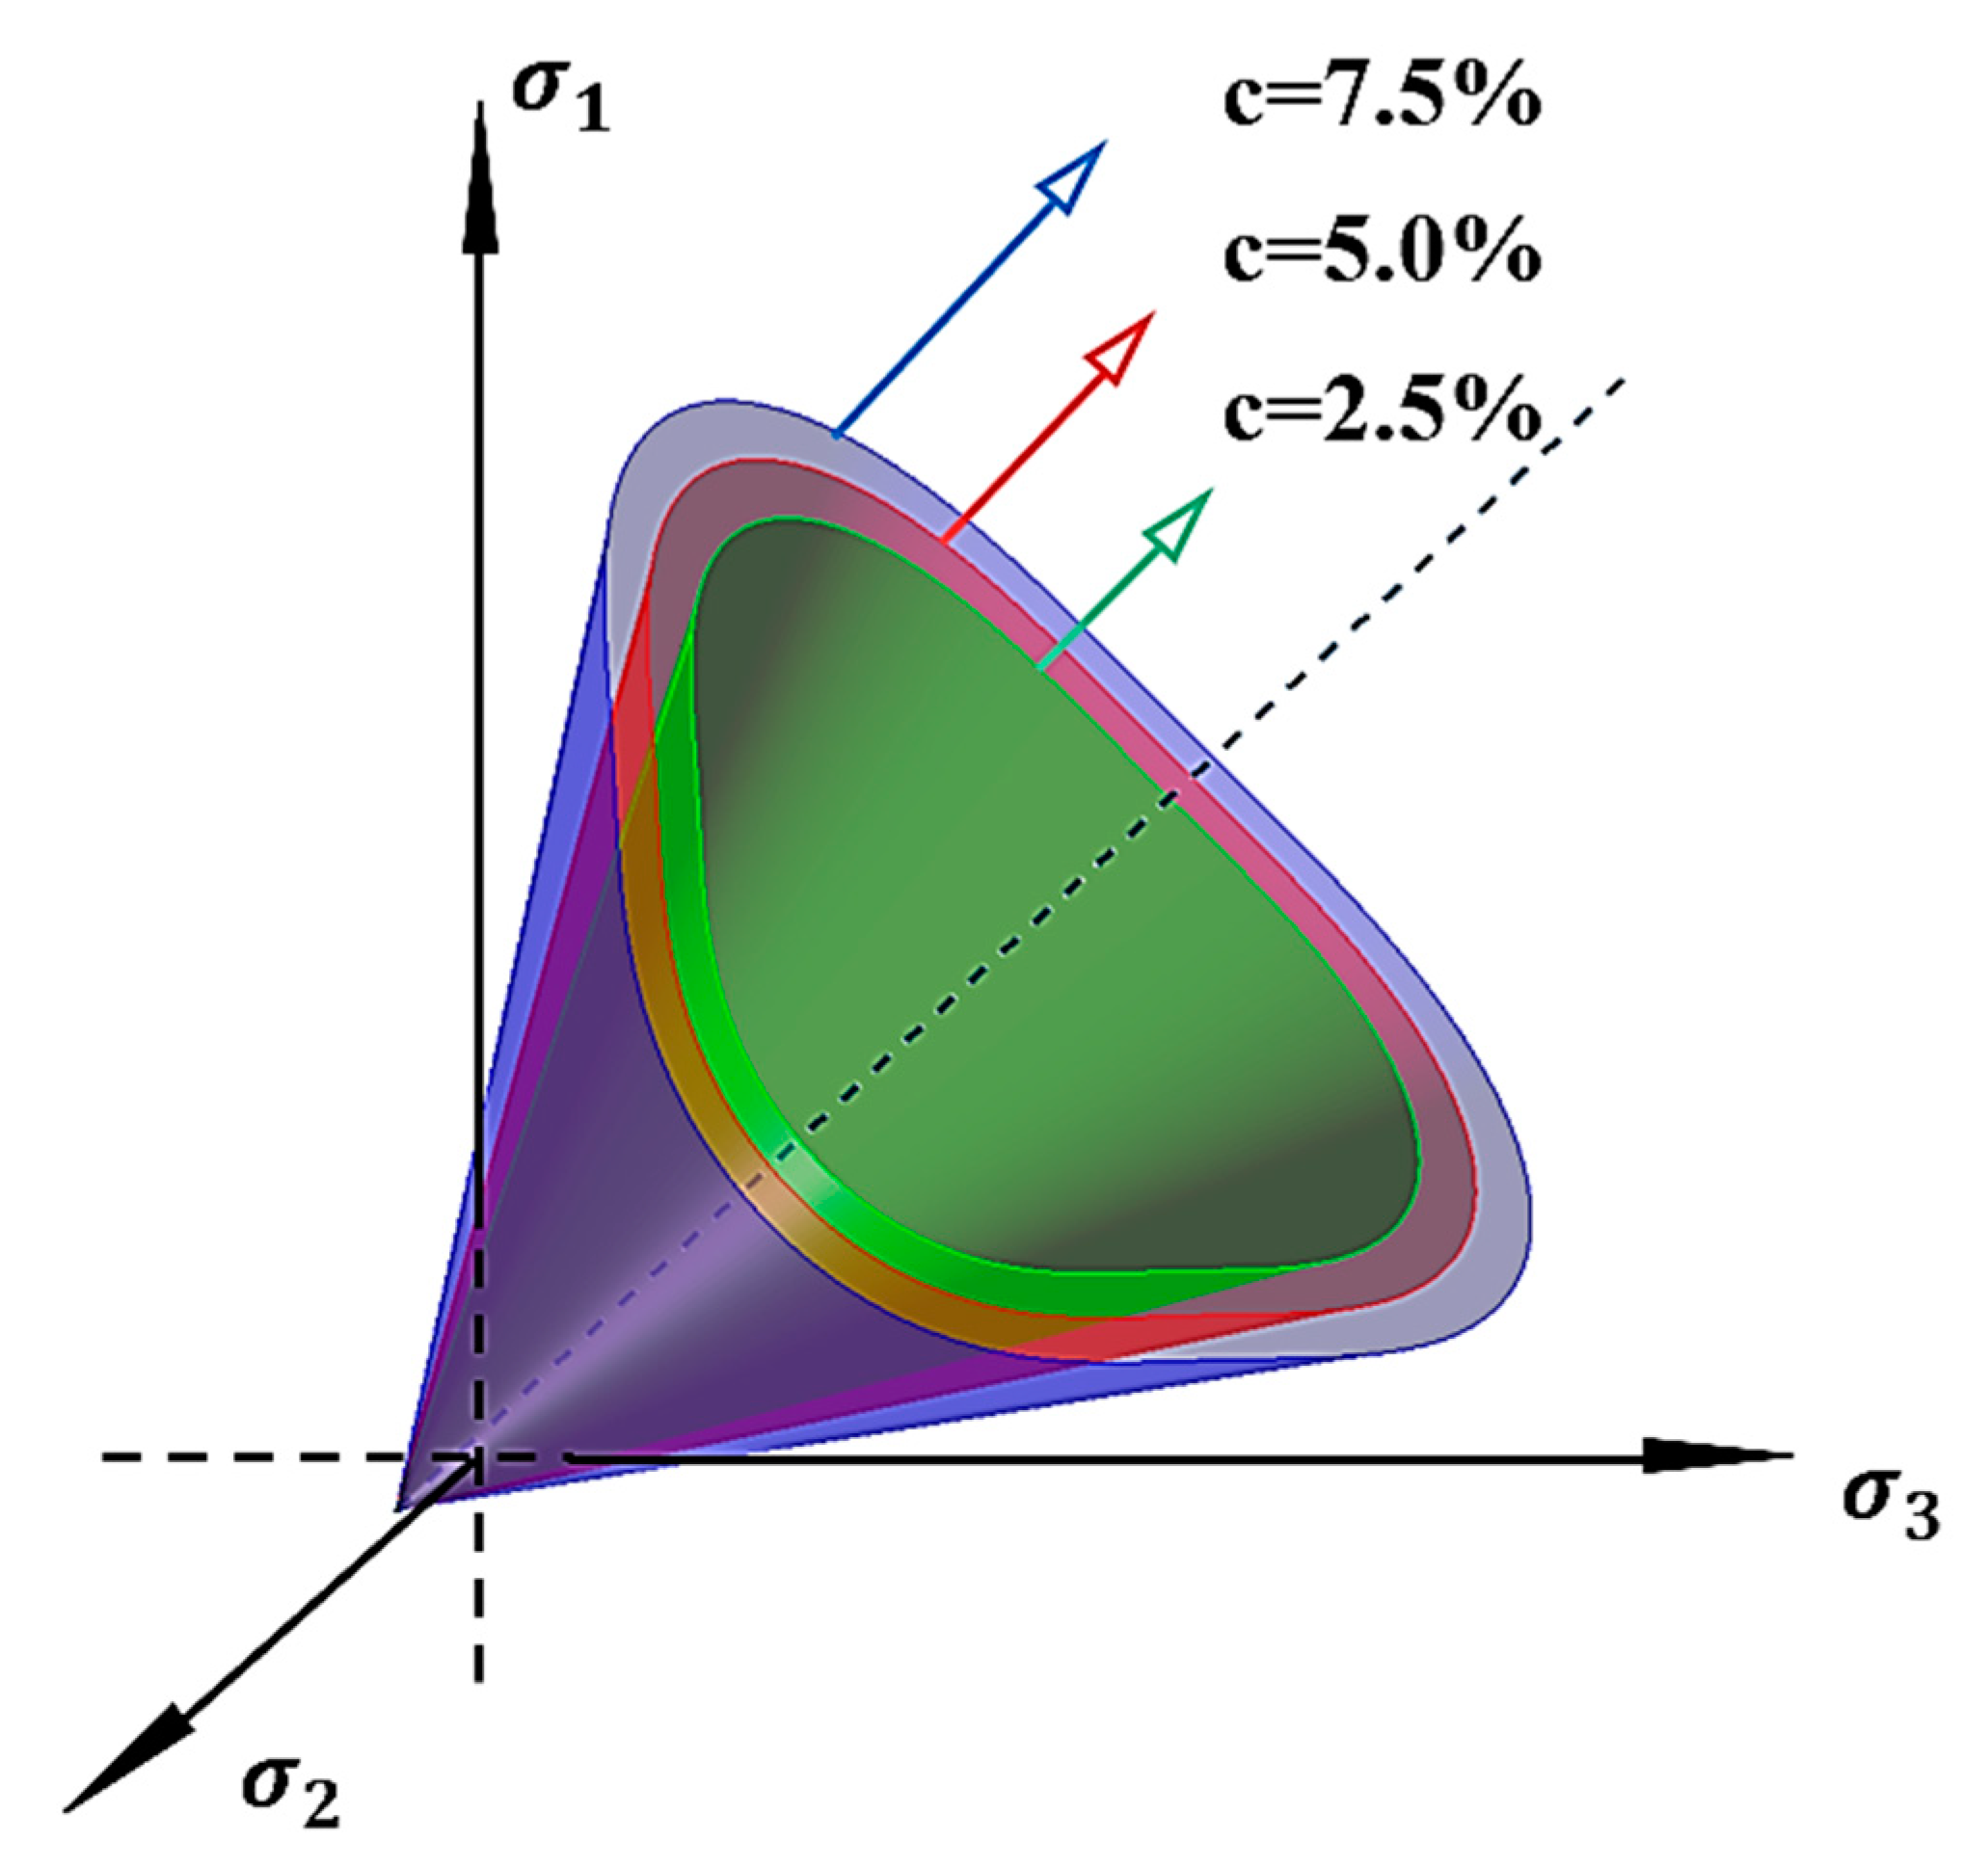
3.5. Strength Criterion of Polyurethane-Solidified Calcareous Sand
4. Conclusions
- (1)
- Shear Deformation Behavior and Quantitative Characterization
- (2)
- Multiaxial Strength Behavior and Criterion Development
- (3)
- Formulation and Validation of 3D Strength Criterion
Author Contributions
Funding
Institutional Review Board Statement
Data Availability Statement
Conflicts of Interest
References
- Liu, C.; Yang, Z.; Wang, R. The present condition and development in studies of mechanical properties of calcareous soils. Rock Soil Mech. 1995, 16, 74–83. [Google Scholar]
- Chin, J.T.; Poulos, H.G. Tests on model jacked piles in calcareous sand. Geotech. Test. J. 1996, 19, 164–180. [Google Scholar] [CrossRef]
- Coop, M.R.; Sorensen, K.K.; Bodas Freitas, T.; Georgoutsos, G. Particle breakage during shearing of a carbonate sand. Geotechnique 2004, 54, 157–163. [Google Scholar] [CrossRef]
- Xiao, Y.; Liu, H.; Xiao, P.; Xiang, J. Fractal crushing of carbonate sands under impact loading. Géotechnique Lett. 2016, 6, 199–204. [Google Scholar] [CrossRef]
- Xiao, Y.; Wu, B.; Shi, J.; Wang, L.; Liu, H. Acoustic emission of biocemented calcareous sand base. Int. J. Geomech. 2023, 23, 4023153. [Google Scholar] [CrossRef]
- Huang, J.T.; Airey, D.W. Properties of artificially cemented carbonate sand. J. Geotech. Geoenviron. Eng. 1998, 124, 492–499. [Google Scholar] [CrossRef]
- Coop, M.R. The mechanics of uncemented carbonate sands. Geotechnique 1990, 40, 607–626. [Google Scholar] [CrossRef]
- Liu, C.Q.; Wang, R. Preliminary research on physical and mechanical properties of calcareous sand. Rock Soil Mech. 1998, 19, 32–37. [Google Scholar]
- Sharma, S.S.; Fahey, M. Degradation of stiffness of cemented calcareous soil in cyclic triaxial tests. J. Geotech. Geoenviron. Eng. 2003, 129, 619–629. [Google Scholar] [CrossRef]
- Sharma, S.S.; Fahey, M. Deformation characteristics of two cemented calcareous soils. Can. Geotech. J. 2004, 41, 1139–1151. [Google Scholar] [CrossRef]
- Wang, Y.H.; Leung, S.C. Characterization of cemented sand by experimental and numerical investigations. J. Geotech. Geoenviron. Eng. 2008, 134, 992–1004. [Google Scholar] [CrossRef]
- Ziregue, A.; Khenfer, M.M.; Kint, M.Q.; Montrelay, N. Developmental potentiality of insulating lightweight concrete based on cork and calcareous sand. J. Adhes. Sci. Technol. 2016, 30, 934–946. [Google Scholar] [CrossRef]
- Li, Y.; Guo, Z.; Wang, L.; Li, Y.; Liu, Z. Shear resistance of MICP cementing material at the interface between calcareous sand and steel. Mater. Lett. 2020, 274, 128009. [Google Scholar] [CrossRef]
- Woodward, J. (Ed.) An Introduction to Geotechnical Processes; CRC Press: Boca Raton, FL, USA, 2004. [Google Scholar]
- Liu, J.; Chen, Z.; Zeng, Z.; Kanungo, D.P.; Bu, F.; Bai, Y.; Qi, C.; Qian, W. Influence of polyurethane polymer on the strength and mechanical behavior of sand-root composite. Fiber Polym. 2020, 21, 829–839. [Google Scholar] [CrossRef]
- Lat, D.C.; Ali, N.; Jais, I.B.M.; Yunus, N.Z.M.; Razali, R.; Talip, A.R.A. A review of polyurethane as a ground improvement method. Malays. J. Fundam. Appl. Sci. 2020, 16, 70–74. [Google Scholar] [CrossRef]
- Saleh, S.; Yunus, N.Z.M.; Ahmad, K.; Ali, N. Improving the strength of weak soil using polyurethane grouts: A review. Constr. Build. Mater. 2019, 202, 738–752. [Google Scholar] [CrossRef]
- Jain, P.; Pradeep, T. Potential of silver nanoparticle-coated polyurethane foam as an antibacterial water filter. Biotechnol. Bioeng. 2005, 90, 59–63. [Google Scholar] [CrossRef]
- Xiao, Y.; Liu, H.; Desai, C.S. New method for improvement of rockfill material with polyurethane foam adhesive. J. Geotech. Geoenviron. Eng. 2015, 141, 2814003. [Google Scholar] [CrossRef]
- Han-Long, L.; Ping, L.; Gui, Y.; Yang, X.; Yan-Chen, L. Experimental investigations on dynamic residual deformation behaviors of PFA-reinforced rockfill materials. Rock Soil Mech. 2017, 38, 1863. [Google Scholar]
- Buzzi, O.; Fityus, S.; Sloan, S.W. Use of expanding polyurethane resin to remediate expansive soil foundations. Can. Geotech. J. 2010, 47, 623–634. [Google Scholar] [CrossRef]
- Keene, A.; Edil, T.; Fratta, D.; Tinjum, J. Modeling the effect of polyurethane stabilization on rail track response. In Proceedings of the Geo-Congress 2013: Stability and Performance of Slopes and Embankments III, San Diego, CA, USA, 3–7 March 2013; pp. 1410–1419. [Google Scholar]
- Liu, P.; Meng, M.; Xiao, Y.; Liu, H.; Yang, G. Dynamic properties of polyurethane foam adhesive-reinforced gravels. Sci. China Technol. Sci. 2021, 64, 535–547. [Google Scholar] [CrossRef]
- Xiao, Y.; Stuedlein, A.W.; Chen, Q.; Liu, H.; Liu, P. Stress-strain-strength response and ductility of gravels improved by polyurethane foam adhesive. J. Geotech. Geoenviron. Eng. 2018, 144, 4017108. [Google Scholar] [CrossRef]
- Woodward, P.K.; El Kacimi, A.; Laghrouche, O.; Medero, G.; Banimahd, M. Application of polyurethane geocomposites to help maintain track geometry for high-speed ballasted railway tracks. J. Zhejiang Univ. Sci. A 2012, 13, 836–849. [Google Scholar] [CrossRef]
- Wang, S.; Li, X.; Zhang, Q. Field application of polyurethane foam adhesive for foundation stabilization in coastal regions. Case Stud. Constr. Mater. 2023, 18, 105–117. [Google Scholar]
- Chen, Y.; Liu, H.; Wang, T. Slope stabilization using polyurethane foam adhesive: A case study in mountainous areas. Landslides 2022, 19, 567–579. [Google Scholar]
- Li, H.; Wang, J.; Tan, Y. Field application of polyurethane foam adhesive for coastal highway foundation reinforcement in Southeast Asia. Geotech. Eng. J. 2023, 55, 123–135. [Google Scholar]
- Kardani, A.; Montazeri, A.; Urbassek, H.M. Strain-rate-dependent plasticity of Ta-Cu nanocomposites for therapeutic implants. Sci. Rep. 2023, 13, 15788. [Google Scholar] [CrossRef]
- Guo, P. Modified direct shear test for anisotropic strength of sand. J. Geotech. Geoenviron. Eng. 2008, 134, 1311–1318. [Google Scholar] [CrossRef]
- Oda, M. Initial fabrics and their relations to mechanical properties of granular material. Soils Found. 1972, 12, 17–36. [Google Scholar] [CrossRef]
- Pradhan, T.B.; Tatsuoka, F.; Horii, N. Simple shear testing on sand in a torsional shear apparatus. Soils Found. 1988, 28, 95–112. [Google Scholar] [CrossRef]
- Tatsuoka, F.; Sakamoto, M.; Kawamura, T.; Fukushima, S. Strength and deformation characteristics of sand in plane strain compression at extremely low pressures. Soils Found. 1986, 26, 65–84. [Google Scholar] [CrossRef]
- Yun-Ming, Y. A soil model considering principal stress rotation. Chin. J. Geotech. Eng. 2013, 35, 479–486. [Google Scholar]
- Tian, Y.; Yao, Y. Modelling the non-coaxiality of soils from the view of cross-anisotropy. Comput. Geotech. 2017, 86, 219–229. [Google Scholar] [CrossRef]
- Gao, Z.; Zhao, J. A non-coaxial critical-state model for sand accounting for fabric anisotropy and fabric evolution. Int. J. Solids Struct. 2017, 106, 200–212. [Google Scholar] [CrossRef]
- Hight, D.W.; Gens, A.; Symes, M.J. The development of a new hollow cylinder apparatus for investigating the effects of principal stress rotation in soils. Geotechnique 1983, 33, 355–383. [Google Scholar] [CrossRef]
- Gutierrez, M.; Ishihara, K.; Towhata, I. Model tests on the influence of principal stress rotation on the deformation of sand. Soils Found. 1991, 31, 1–15. [Google Scholar] [CrossRef]
- ASTM D4253/D4254; Standard Test Methods for Maximum and Minimum Density of Particulate Solid Matter by Vibratory Compaction. ASTM International: West Conshohocken, PA, USA, 2016.
- ASTM D6028; Standard Test Method for Torsional Shear Testing of Soils. ASTM International: West Conshohocken, PA, USA, 2016.
- Guo, Y.; Luan, M.-T.; Xu, C.-S.; He, Y. Effect of variation of principal stress orientation on undrained dynamic strength behavior of loose sand. Chin. J. Geotech. Eng. 2003, 25, 666–670. [Google Scholar]
- Wenshao, W. Distinction and interrelation between liquefaction, state of limit equilibrium and failure of soil mass. Chin. J. Geotech. Eng. 2005, 27, 1–10. [Google Scholar]
- Shen, R.F.; Wang, H.J.; Zhou, J.X. Dynamic strength of sand under cyclic rotation of principal stress directions. J. Hydraul. Eng-ASCE 1996, 1, 27–33. [Google Scholar]
- Gutierrez, M.; Ishihara, K. Non-coaxiality and energy dissipation in granular materials. Soils Found. 2000, 40, 49–59. [Google Scholar] [CrossRef]
- Gutierrez, M.; Ishihara, K.; Towhata, I. Flow theory for sand during rotation of principal stress direction. Soils Found. 1991, 31, 121–132. [Google Scholar] [CrossRef] [PubMed]
- Shen, Y.; Du, W.; Xu, J.; Rui, X.; Liu, H. Non-coaxiality of soft clay generated by principal stress rotation under high-speed train loading. Acta Geotech. 2022, 17, 411–426. [Google Scholar] [CrossRef]
- Wang, S. Study on the Static and Cyclic Behavior and Constitutive Model of Q2 Loess under Principal Stress Rotation. Ph.D. Thesis, Chongqing University, Chongqing, China, 2018. [Google Scholar]
- Dong, T.; Zheng, Y.; Liang, K.; Liu, C. Shear strength and shear bands of anisotropic sand. Acta Geotech. 2022, 17, 2841–2853. [Google Scholar] [CrossRef]


| Type of Measurement | Capacity | Maximum Error or Accuracy * |
|---|---|---|
| Axial load | −20~20 kN | 0.1% |
| Axial displacement | −40~40 mm | 0.001 mm |
| Torque | −400~400 N·m | 0.1% |
| Torque displacement | −114~114 mm | 0.001 mm |
| Torsional angle | −45°~45° | 0.1% |
| Internal and outer cell pressure | 0~2 MPa | 0.25% |
| Test Nos. | c (%) | α (°) | p′ (kPa) | b |
|---|---|---|---|---|
| T1 | 5% | 0 | 100 | 0.5 |
| T2 | 5% | 30 | 100 | 0.5 |
| T3 | 5% | 45 | 100 | 0.5 |
| T4 | 5% | 60 | 100 | 0.5 |
| T5 | 5% | 90 | 100 | 0.5 |
| T6–T9 | 2.5% | 60 | 100 | 0.2, 0.5, 0.8, 1.0 |
| T10–T12 | 5% | 60 | 100 | 0.2, 0.8, 1.0 |
| T12–T16 | 7.5% | 60 | 100 | 0.2, 0.5, 0.8, 1.0 |
| Stress Components | Strain Components | |
|---|---|---|
| Axial | ||
| Radial | ||
| Circumferential | ||
| Torsional shear | ||
| Major principal | ||
| Intermediate principal | ||
| Minor principal |
| Principal stress orientation angle | |
| Direction angle of principal strain rate | |
| Non-coaxial angle | |
| Stress increment | |
| Strain increment generated by unit stress |
Disclaimer/Publisher’s Note: The statements, opinions and data contained in all publications are solely those of the individual author(s) and contributor(s) and not of MDPI and/or the editor(s). MDPI and/or the editor(s) disclaim responsibility for any injury to people or property resulting from any ideas, methods, instructions or products referred to in the content. |
© 2025 by the authors. Licensee MDPI, Basel, Switzerland. This article is an open access article distributed under the terms and conditions of the Creative Commons Attribution (CC BY) license (https://creativecommons.org/licenses/by/4.0/).
Share and Cite
Chang, D.; Xie, Y.; Zhang, X.; Liu, J. Investigation of the Mechanical Properties of Calcareous Sand Improved by Polyurethane Foam Adhesive Under Fixed Principal Stress Axes Shearing. Polymers 2025, 17, 644. https://doi.org/10.3390/polym17050644
Chang D, Xie Y, Zhang X, Liu J. Investigation of the Mechanical Properties of Calcareous Sand Improved by Polyurethane Foam Adhesive Under Fixed Principal Stress Axes Shearing. Polymers. 2025; 17(5):644. https://doi.org/10.3390/polym17050644
Chicago/Turabian StyleChang, Dan, Yongjun Xie, Xinghua Zhang, and Jiankun Liu. 2025. "Investigation of the Mechanical Properties of Calcareous Sand Improved by Polyurethane Foam Adhesive Under Fixed Principal Stress Axes Shearing" Polymers 17, no. 5: 644. https://doi.org/10.3390/polym17050644
APA StyleChang, D., Xie, Y., Zhang, X., & Liu, J. (2025). Investigation of the Mechanical Properties of Calcareous Sand Improved by Polyurethane Foam Adhesive Under Fixed Principal Stress Axes Shearing. Polymers, 17(5), 644. https://doi.org/10.3390/polym17050644