

Rubber Fatigue Revisited: A State-of-the-Art Review Expanding on Prior Works by Tee, Mars and Fatemi


Abstract
:1. Introduction
2. Modeling of Fatigue Life for Rubber-like Materials
2.1. Crack Nucleation Method
2.1.1. Strain-Based Damage Parameters
2.1.2. Energy-Based Damage Parameters
2.1.3. Stress-Based Damage Parameters
2.1.4. Discussions on Potential Abilities of Various Damage Parameters
2.1.5. Applications for Crack Nucleation Method
2.2. Crack Growth Method
2.2.1. Calculation of Energy Release Rate or Tearing Energy
2.2.2. Analyzing the Susceptible Position and Direction for Crack Growth
2.2.3. Crack Growth Approach Applications
2.3. Fatigue Phase-Field Method
2.4. Aspect of Probability and Statistics Analysis
2.5. Data-Driven Method Based on Machine Learning
3. Fatigue Experiments of Rubber-like Materials
3.1. Considering Various Mechanical Loading Histories
3.1.1. Uniaxial Loads
3.1.2. Simple Shear Loads
3.1.3. Multiaxial Loads
3.1.4. Variable Amplitude Loads
3.2. Fatigue Specimens
3.2.1. Smooth Specimens
3.2.2. Notched Specimens
4. Reinforcement Methods for Rubber-Based Structures Against Fatigue Failure
4.1. Crystallization
4.2. Reinforcing Fillers
5. Recent Progress on Fatigue Analysis of Magnetorheological Elastomers (MREs)
6. Discussions and Conclusions
Author Contributions
Funding
Institutional Review Board Statement
Data Availability Statement
Conflicts of Interest
Symbols and Abbreviations
| , , and | stretch ratio (elongation), mean, and amplitude, respectively; |
| engineering (nominal) strain | |
| Green–Lagrange strain, | |
| Almansi–Euler strain | |
| logarithmic strain | |
| octahedral shear strain | |
| strain components of Green–Lagrange strain tensor | |
| effective tensile strain criterion | |
| principal components of | |
| maximum eigenvalue of the Cauchy stress tensor | |
| da/dN | crack growth rate where the crack length is a and the number of cycles is N |
| Tmax | the maximum tearing energy |
| U | internal energy stored in the component |
| A | crack area of a single fracture surface |
| and | SED and CED, respectively |
| R-ratio (Rγ, Rε, Rδ or Rθ) | ratio of minimum to maximum load during one cycle |
| δ and θ | displacement and twist/rotation, respectively |
| P and T | axial load and torque, respectively |
| , , and | shear strain (the twist per unit length), mean value, and amplitude, respectively |
| the signal frequency | |
| the phase angle between extension and twist | |
| B | stretch biaxiality ratio (defined as the ratio of log of transverse principal stretch to log of maximum principal stretch) |
| S–N | stress versus number of cycles to failure |
| E* | complex modulus |
| CB | carbon black |
| HF | hemp fiber |
| MREs | magnetorheological elastomers |
| MR | magnetorheological |
| EOMt | expanded organo-montmorillonite |
| SR | silicone rubber |
| NR | natural rubber |
| SBR | styrene butadiene rubber |
| SED | strain energy density |
| CED | cracking energy density |
| EPDM | ethylene propylene diene monomer rubber |
| FEA | finite element analysis |
| ERR | energy release rate |
| TE | tearing energy |
| SWT | Smith–Watson–Topper |
| CXH | Chen–Xu–Huang |
| CMA | configurational mechanics approach |
| CPA | critical plane approach |
| CLD | constant life diagram |
| 1D, 3D, 6D | one-, three-, six-dimensional |
| CDM | continuous damage mechanics |
| SENT | single-edged notched tension specimen |
| LEFM | linear elastic fracture mechanics |
| MCS | Monte Carlo simulation |
| ML | machine learning |
| ISSA-SVR | improved sparrow search algorithm and the support vector regression |
| BPNN | back-propagation neural network |
| ISCA | improved sine–cosine algorithm |
| SVM | support vector machine |
| CR | polychloroprene rubber |
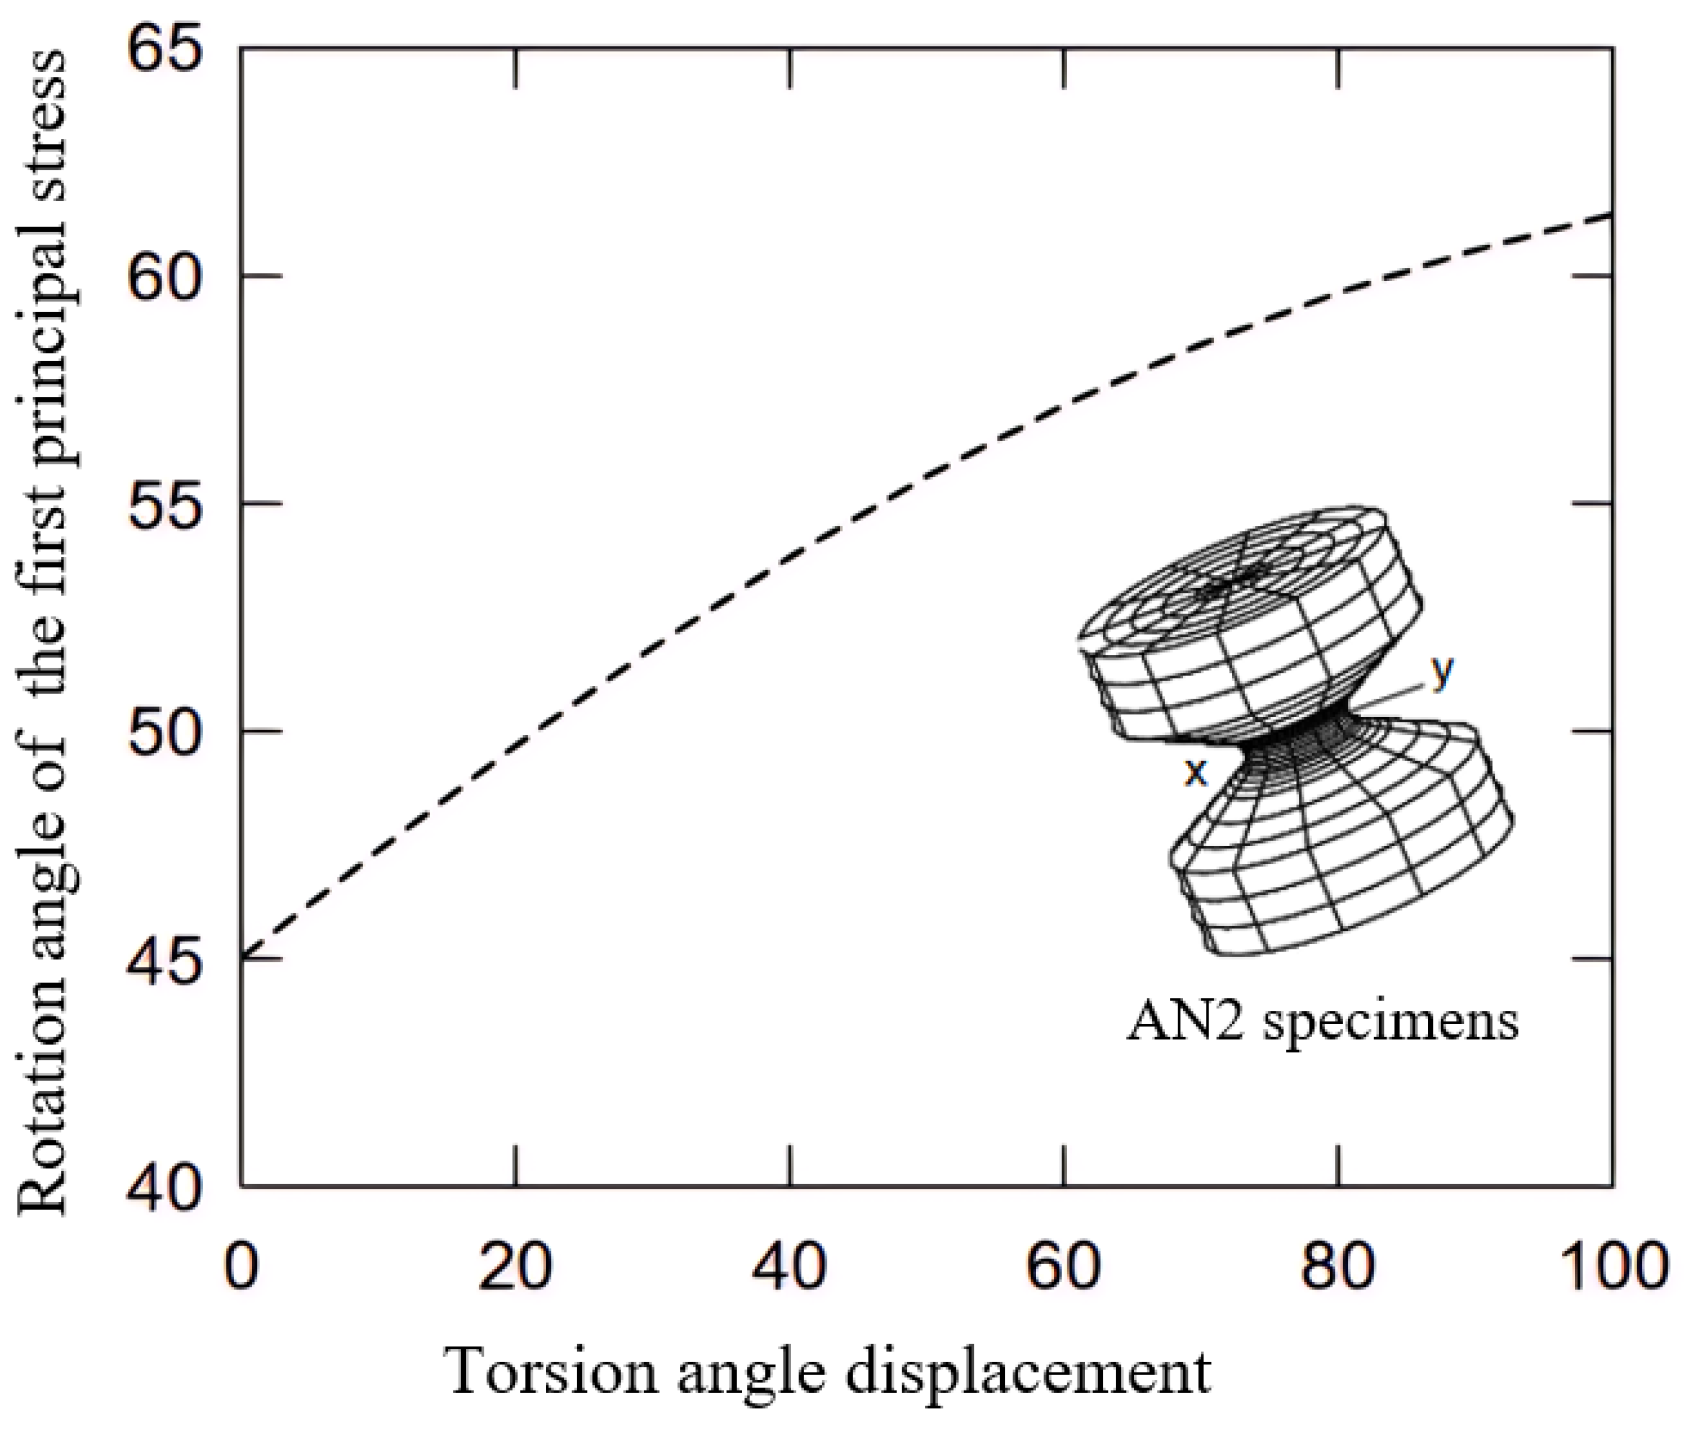
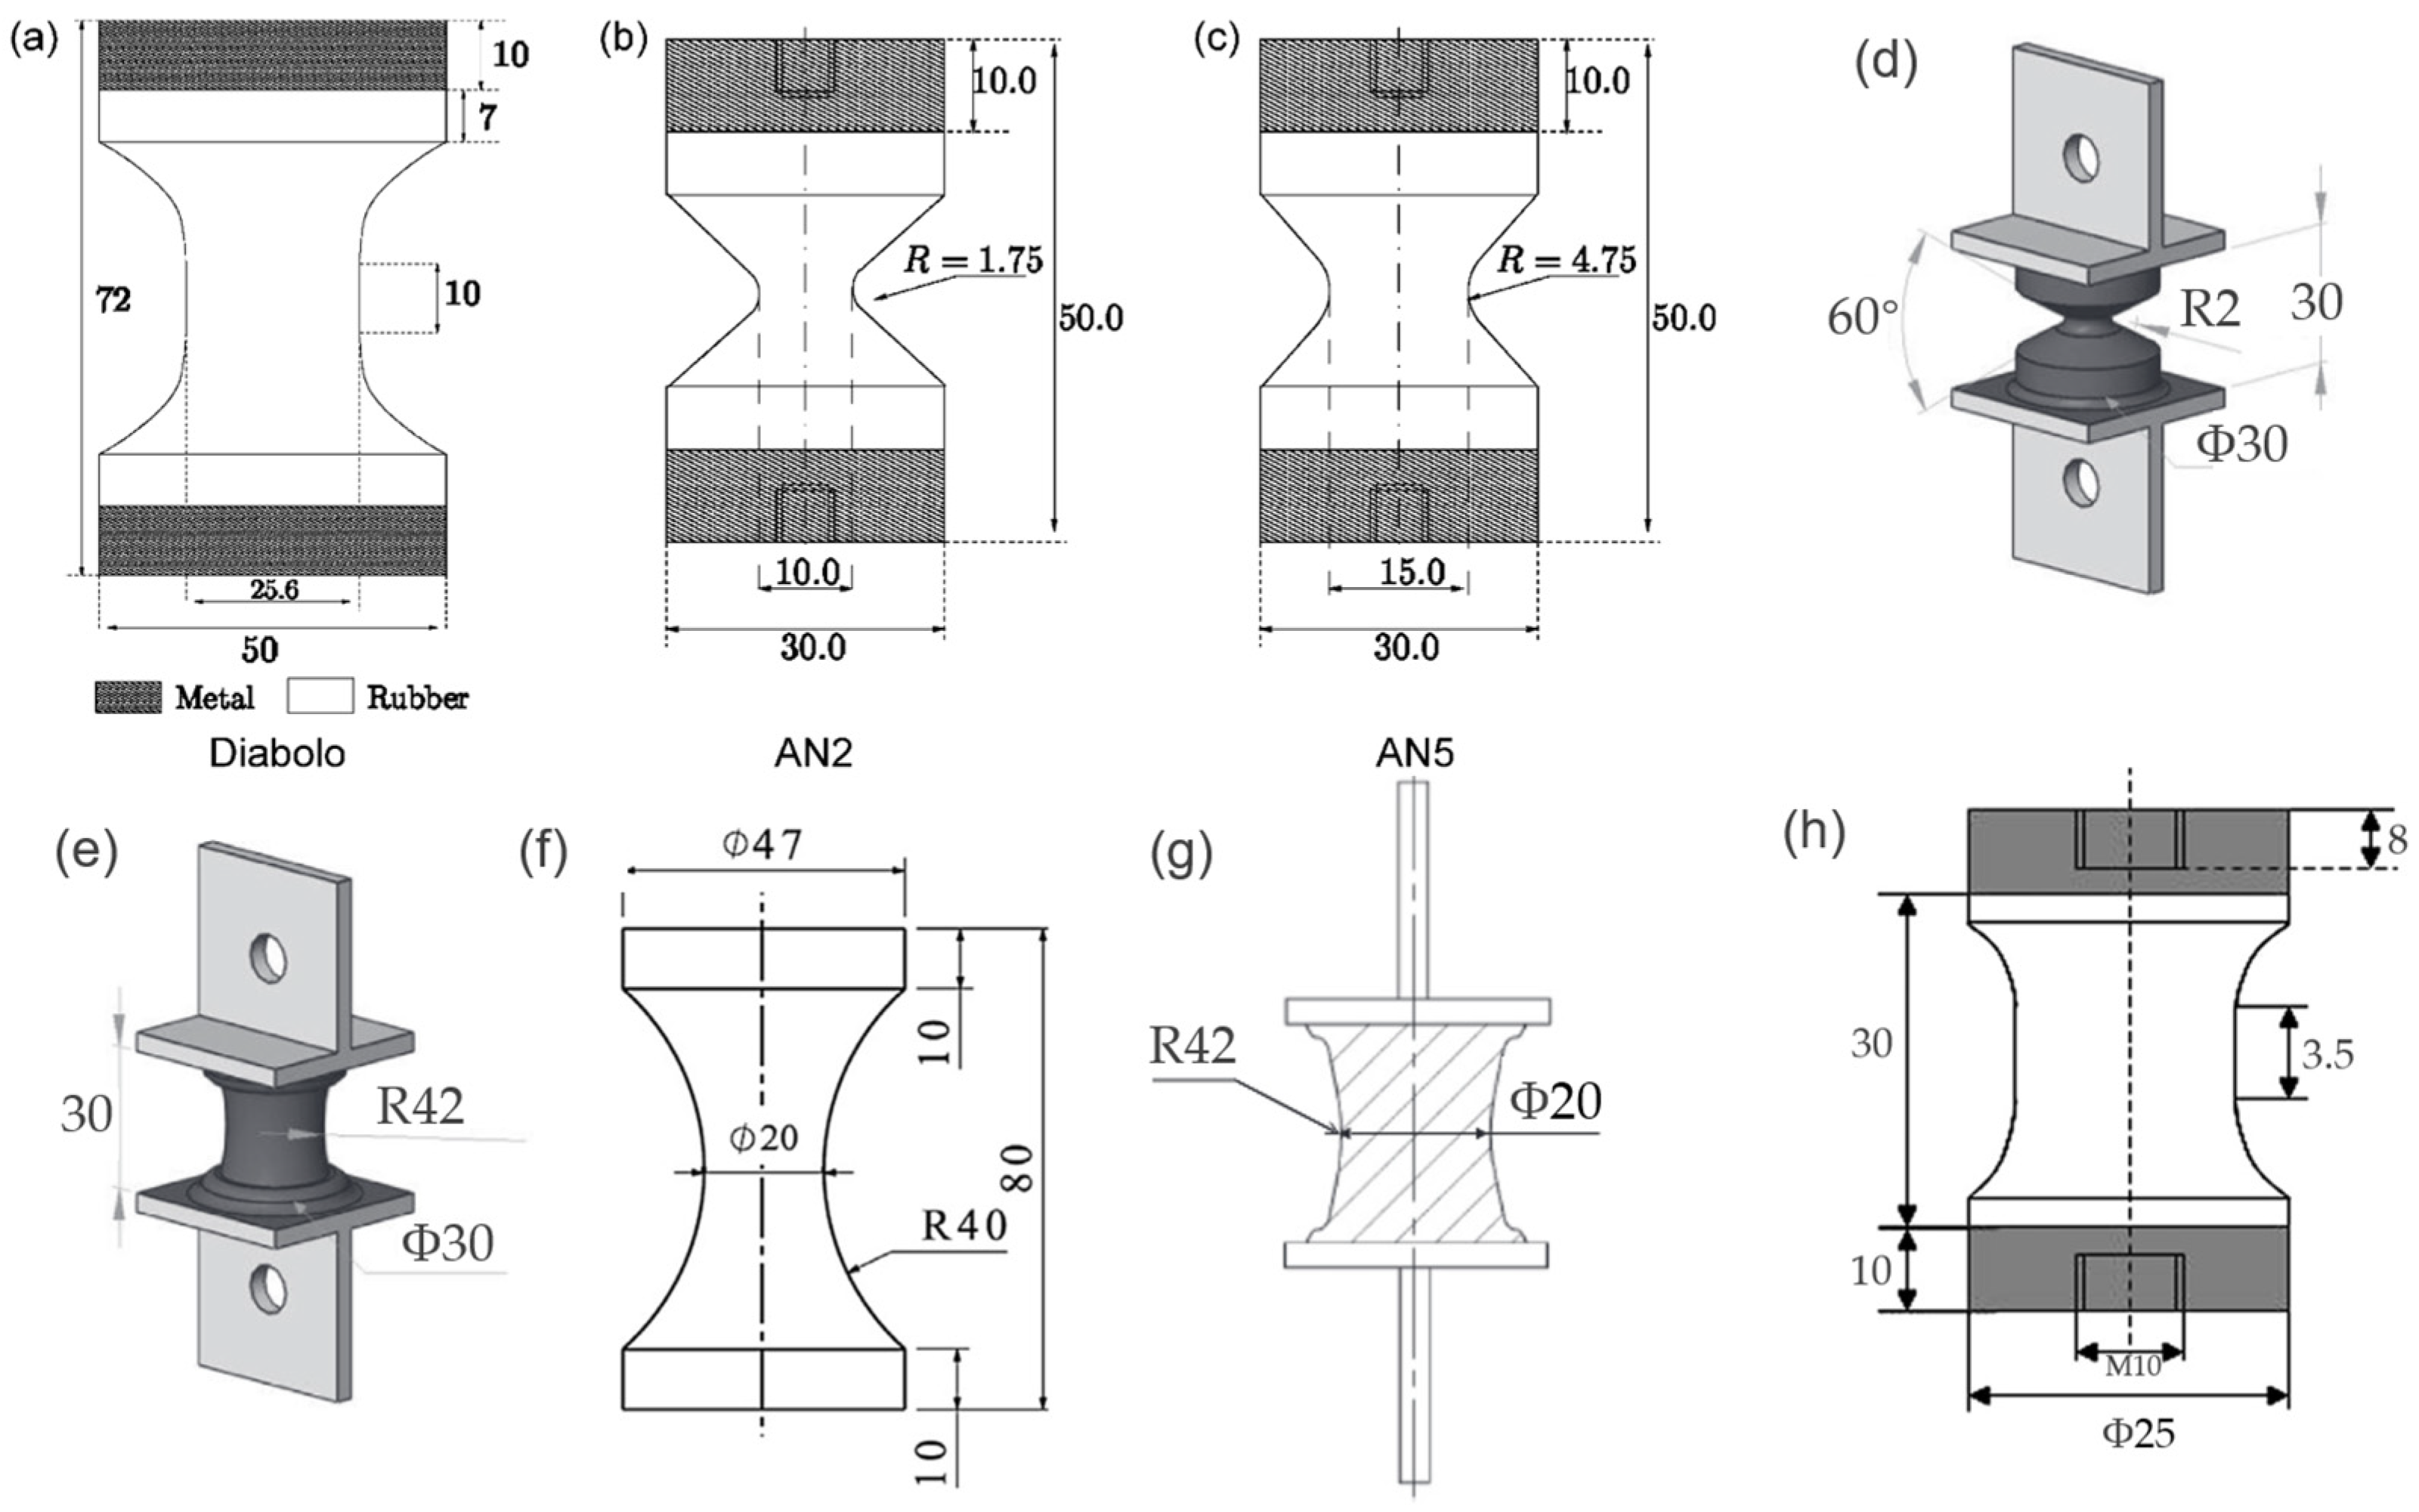
| AN2 and AN5 | cylindrical hourglass-shaped specimens with notch radii equal to 1.75 and 4.75 mm, respectively. |
| AE2 and AE42 | axisymmetric specimens with curvature radii equal to 2 and 42 mm, respectively. |
| DENT | double edge notched tension specimen |
| CCT | center cracked tension specimen |
| PS | pure shear or planar tension specimen with or without a precut |
| phr | parts per hundred rubber |
| NBR | nitrile butadine rubber |
| CIP | carbonyl iron powder/particle |
References
- Kang, W.; Liu, J.; Xiong, W.; You, T.; Wang, X.; Zeng, K.; Deng, Y.; Guo, Z.; Yuan, K. Basic Mechanical and Fatigue Properties of Rubber Materials and Components for Railway Vehicles: A Literature Survey. Rev. Adv. Mater. Sci. 2022, 61, 587–610. [Google Scholar] [CrossRef]
- Saber, A.; Sedaghati, R. The Modeling of Magnetorheological Elastomers: A State-of-the-art Review. Adv. Eng. Mater. 2023, 25, 2300182. [Google Scholar] [CrossRef]
- Mars, W.V.; Fatemi, A. Factors That Affect the Fatigue Life of Rubber: A Literature Survey. Rubber Chem. Technol. 2004, 77, 391–412. [Google Scholar] [CrossRef]
- Bensalem, K.; Eesaee, M.; Hassanipour, M.; Elkoun, S.; David, E.; Agbossou, K.; Nguyen-Tri, P. Lifetime Estimation Models and Degradation Mechanisms of Elastomeric Materials: A Critical Review. Polym. Degrad. Stab. 2024, 220, 110644. [Google Scholar] [CrossRef]
- Tan, B.; Feyzullahoğlu, E. The Investigation of Effects of Environmental Conditions on Fatigue Strength and Spring Stiffness of Rubber Materials. J. Elastomers Plast. 2021, 53, 632–652. [Google Scholar] [CrossRef]
- Abraham, F.; Alshuth, T.; Jerrams, S. The Effect of Minimum Stress and Stress Amplitude on the Fatigue Life of Non Strain Crystallising Elastomers. Mater. Des. 2005, 26, 239–245. [Google Scholar] [CrossRef]
- Jerrams, S.; Murphy, N.; Hanley, J. The Significance of Equi-Biaxial Bubble Inflation in Determining Elastomeric Fatigue Properties. In Advanced Elastomers—Technology, Properties and Applications; Boczkowska, A., Ed.; InTech: Hyogo, Japan, 2012; ISBN 978-953-51-0739-2. [Google Scholar]
- Mars, W.V.; Fatemi, A. A Literature Survey on Fatigue Analysis Approaches for Rubber. Int. J. Fatigue 2002, 24, 949–961. [Google Scholar] [CrossRef]
- Tee, Y.L.; Loo, M.S.; Andriyana, A. Recent Advances on Fatigue of Rubber after the Literature Survey by Mars and Fatemi in 2002 and 2004. Int. J. Fatigue 2018, 110, 115–129. [Google Scholar] [CrossRef]
- Qiu, X.; Yin, H.; Xing, Q. Research Progress on Fatigue Life of Rubber Materials. Polymers 2022, 14, 4592. [Google Scholar] [CrossRef]
- Mars, W.V.; Fatemi, A. Multiaxial Fatigue of Rubber: Part I: Equivalence Criteria and Theoretical Aspects. Fatigue Fract. Eng. Mater. Struct. 2005, 28, 515–522. [Google Scholar] [CrossRef]
- Ayoub, G.; Naït-Abdelaziz, M.; Zaïri, F.; Gloaguen, J.M.; Charrier, P. A Continuum Damage Model for the High-Cycle Fatigue Life Prediction of Styrene-Butadiene Rubber under Multiaxial Loading. Int. J. Solids Struct. 2011, 48, 2458–2466. [Google Scholar] [CrossRef]
- Verron, E.; Andriyana, A. Definition of a New Predictor for Multiaxial Fatigue Crack Nucleation in Rubber. J. Mech. Phys. Solids 2008, 56, 417–443. [Google Scholar] [CrossRef]
- Cadwell, S.M.; Merrill, R.A.; Sloman, C.M.; Yost, F.L. Dynamic Fatigue Life of Rubber. Ind. Eng. Chem. Anal. Ed. 1940, 12, 19–23. [Google Scholar]
- Yu, Y.; Yin, Z.; Li, J. Fatigue Life Analysis Methods for Rolling Lobe Air Spring; No. 2024-01-2259; SAE: Detroit, MI, USA, 2024. [Google Scholar]
- Harbour, R.J.; Fatemi, A.; Mars, W.V. Fatigue Life Analysis and Predictions for NR and SBR under Variable Amplitude and Multiaxial Loading Conditions. Int. J. Fatigue 2008, 30, 1231–1247. [Google Scholar] [CrossRef]
- Mars, W.V.; Fatemi, A. Multiaxial Fatigue of Rubber: Part II: Experimental Observations and Life Predictions. Fatigue Fract. Eng. Mater. Struct. 2005, 28, 523–538. [Google Scholar] [CrossRef]
- Shangguan, W.; Wang, X.; Deng, J.; Rakheja, S.; Pan, X.; Yu, B. Experiment and Modeling of Uniaxial Tension Fatigue Performances for Filled Natural Rubbers. Mater. Des. 2014, 58, 65–73. [Google Scholar] [CrossRef]
- Fielding, J.H. Flex Life and Crystallization of Synthetic Rubber. Ind. Eng. Chem. 1943, 35, 1259–1261. [Google Scholar] [CrossRef]
- Roach, J.F. Crack Growth in Elastomers Under Biaxial Stresses. Ph.D. Thesis, The University of Akron, Akron, OH, USA, 1982. [Google Scholar]
- Roberts, B.J.; Benzies, J.B. The Relationship between Uniaxial and Equibiaxial Fatigue in Gum and Carbon-Black-Tilled Vulcanizates. In Proceedings of the Rubbercon, Brighton, UK, 16–20 May 1977; Volume 2.1, pp. 2.1–2.13. [Google Scholar]
- Ro, H.S. Modeling and Interpretation of Fatigue Failure Initiation in Rubber Related to Pneumatic Tires. Ph.D. Thesis, Purdue University, West Lafayette, IN, USA, 1989. [Google Scholar]
- Zine, A.; Benseddiq, N.; Abdelaziz, M.N.; Hocine, N.A.; Bouami, D. Prediction of Rubber Fatigue Life under Multiaxial Loading. Fatigue Fract. Eng. Mater. Struct. 2006, 29, 267–278. [Google Scholar] [CrossRef]
- Belkhiria, S.; Hamdi, A.; Fathallah, R. Strain-Based Criterion for Uniaxial Fatigue Life Prediction for an SBR Rubber: Comparative Study and Development. Proc. Inst. Mech. Eng. Part L J. Mater. Des. Appl. 2020, 234, 897–909. [Google Scholar] [CrossRef]
- Luo, W.; Huang, Y.; Yin, B.; Jiang, X.; Hu, X. Fatigue Life Assessment of Filled Rubber by Hysteresis Induced Self-Heating Temperature. Polymers 2020, 12, 846. [Google Scholar] [CrossRef]
- Kim, W.D.; Lee, H.J.; Kim, J.Y.; Koh, S.K. Fatigue Life Estimation of an Engine Rubber Mount. Int. J. Fatigue 2004, 26, 553–560. [Google Scholar] [CrossRef]
- Woo, C.-S.; Kim, W.-D.; Kwon, J.-D. A Study on the Material Properties and Fatigue Life Prediction of Natural Rubber Component. Mater. Sci. Eng. A 2008, 483–484, 376–381. [Google Scholar] [CrossRef]
- Luo, R.K. Effective Strain Criterion under Multimode and Multiaxial Loadings—A Rubber S–N Curve with the Scatter-Band Factor of 1.6 from 90 Fatigue Cases. Express Polym. Lett. 2022, 16, 130–141. [Google Scholar] [CrossRef]
- Luo, R.K. Rubber Fatigue Prediction for Filled Natural Rubber under Positive and Negative R Ratios. Int. J. Fatigue 2022, 158, 106769. [Google Scholar] [CrossRef]
- Luo, R.K. Shear Modulus-Based Prediction of the Fatigue Life of Antivibration Rubber Components. Int. J. Fatigue 2022, 162, 107010. [Google Scholar] [CrossRef]
- Wang, X.; Shangguan, W.; Rakheja, S.; Li, W.; Yu, B. A Method to Develop a Unified Fatigue Life Prediction Model for Filled Natural Rubbers under Uniaxial Loads. Fatigue Fract. Eng. Mater. Struct. 2014, 37, 50–61. [Google Scholar] [CrossRef]
- Rivlin, R.S.; Thomas, A.G. Rupture of Rubber. I. Characteristic Energy for Tearing. J. Polym. Sci. 1953, 10, 291–318. [Google Scholar] [CrossRef]
- Findley, W.N.; Mathur, P.N.; Szczepanski, E.; Temel, A.O. Energy versus Stress Theories for Combined Stress—A Fatigue Experiment Using a Rotating Disk. J. Basic Eng. 1961, 83, 10–14. [Google Scholar] [CrossRef]
- Moon, S.-I.; Cho, I.-J.; Woo, C.-S.; Kim, W.-D. Study on Determination of Durability Analysis Process and Fatigue Damage Parameter for Rubber Component. J. Mech. Sci. Technol. 2011, 25, 1159–1165. [Google Scholar] [CrossRef]
- Mars, W.V. Cracking Energy Density as a Predictor of Fatigue Life under Multiaxial Conditions. Rubber Chem. Technol. 2002, 75, 1–17. [Google Scholar] [CrossRef]
- Poisson, J.-L.; Lacroix, F.; Meo, S.; Berton, G.; Ranganathan, N. Biaxial Fatigue Behavior of a Polychloroprene Rubber. Int. J. Fatigue 2011, 33, 1151–1157. [Google Scholar] [CrossRef]
- Marco, Y.; Huneau, B.; Masquelier, I.; Le Saux, V.; Charrier, P. Prediction of Fatigue Properties of Natural Rubber Based on the Descriptions of the Cracks Population and of the Dissipated Energy. Polym. Test. 2017, 59, 67–74. [Google Scholar] [CrossRef]
- Harbour, R.J.; Fatemi, A.; Mars, W.V. Fatigue Crack Orientation in NR and SBR under Variable Amplitude and Multiaxial Loading Conditions. J. Mater. Sci. 2008, 43, 1783–1794. [Google Scholar] [CrossRef]
- Zine, A.; Benseddiq, N.; Naït Abdelaziz, M. Rubber Fatigue Life under Multiaxial Loading: Numerical and Experimental Investigations. Int. J. Fatigue 2011, 33, 1360–1368. [Google Scholar] [CrossRef]
- Kim, T.W.; Jeong, H.Y.; Choe, J.H.; Kim, Y.H. Prediction of the Fatigue Life of Tires Using CED and VCCT. Key Eng. Mater. 2005, 297–300, 102–107. [Google Scholar] [CrossRef]
- Mohamedmeki, Z.M.; Esmail, F.J.; Ajeel, E.A. Fatigue Life Analysis of Laminated Elastomeric Bearing Pad. Mater. Today Proc. 2021, 42, 2361–2368. [Google Scholar] [CrossRef]
- Nyaaba, W.; Frimpong, S.; Anani, A. Fatigue Damage Investigation of Ultra-Large Tire Components. Int. J. Fatigue 2019, 119, 247–260. [Google Scholar] [CrossRef]
- Wang, Z.; Zhou, Y.; Liu, J.; Xu, Z.; Chen, M.; Gao, R.; He, S.; Li, F. Fatigue Life Investigation of Rubber Bearing for Heavy Trucks: Optimal Design by Using Finite Element Method with Experimental Verification. Int. J. Fatigue 2024, 180, 108080. [Google Scholar] [CrossRef]
- Pan, Z.; Lai, Y.; Wang, Y.; Duan, W.; Qiao, Y.; Liu, Y.; Song, C. Fatigue Life Prediction and Effects of Cerium Oxide-filled Vulcanized Natural Rubber on Fatigue Life under Multiaxial Loading. Fatigue Fract. Eng. Mater. Struct. 2021, 44, 3349–3362. [Google Scholar] [CrossRef]
- Endurica LLC. Rubber Fatgiue Simulation Software; Endurica LLC: Findlay, OH, USA, 2025. [Google Scholar]
- Le Cam, J.-B.; Huneau, B.; Verron, E. Fatigue Damage in Carbon Black Filled Natural Rubber under Uni- and Multiaxial Loading Conditions. Int. J. Fatigue 2013, 52, 82–94. [Google Scholar] [CrossRef]
- Andriyana, A.; Saintier, N.; Verron, E. Configurational Mechanics and Critical Plane Approach: Concept and Application to Fatigue Failure Analysis of Rubberlike Materials. Int. J. Fatigue 2010, 32, 1627–1638. [Google Scholar] [CrossRef]
- Saintier, N.; Cailletaud, G.; Piques, R. Multiaxial Fatigue Life Prediction for a Natural Rubber. Int. J. Fatigue 2006, 28, 530–539. [Google Scholar] [CrossRef]
- Previati, G.; Kaliske, M. Crack Propagation in Pneumatic Tires: Continuum Mechanics and Fracture Mechanics Approaches. Int. J. Fatigue 2012, 37, 69–78. [Google Scholar] [CrossRef]
- Gosar, A.; Nagode, M.; Oman, S. Continuous Fatigue Damage Prediction of a Rubber Fibre Composite Structure Using Multiaxial Energy-based Approach. Fatigue Fract. Eng. Mater. Struct. 2019, 42, 307–320. [Google Scholar] [CrossRef]
- Andre, N.; Cailletaud, G. Piques Haigh Diagram for Fatigue Crack Initiation Prediction of Natural Rubber Components. Kautsch. Gummi Kunstoffe 1999, 52, 120–123. [Google Scholar]
- Bathias, C.; Houel, P.; Berete Faly, Y.; Gorju, K.L. Damage Characterization of Elastomeric Composites Using X-Ray Attenuation. In Progress in Durability Analysis of Composite Systems; Balkema: Rotterdam, The Netherlands, 1998; pp. 103–109. [Google Scholar]
- Saintier, N.; Cailletaud, G.; Piques, R. Crack Initiation and Propagation under Multiaxial Fatigue in a Natural Rubber. Int. J. Fatigue 2006, 28, 61–72. [Google Scholar] [CrossRef]
- Tao, Y.; Stevens, C.A.; Bilotti, E.; Peijs, T.; Busfield, J.J.C. Fatigue of Carbon Cord-Rubber Composites: Effect of Frequency, R Ratio and Life Prediction Using Constant Life Models. Int. J. Fatigue 2020, 135, 105558. [Google Scholar] [CrossRef]
- Harris, B. A Parametric Constant-Life Model for Prediction of the Fatigue Lives of Fibre-Reinforced Plastics. In Fatigue in Composites; Elsevier: Amsterdam, The Netherlands, 2003; pp. 546–568. ISBN 978-1-85573-608-5. [Google Scholar]
- Philippidis, T.P.; Vassilopoulos, A.P. Life Prediction Methodology for GFRP Laminates under Spectrum Loading. Compos. Part Appl. Sci. Manuf. 2004, 35, 657–666. [Google Scholar] [CrossRef]
- Luo, R.K.; Wu, W.X.; Cook, P.W.; Mortel, W.J. An Approach to Evaluate the Service Life of Rubber Springs Used in Rail Vehicle Suspensions. Proc. Inst. Mech. Eng. Part F J. Rail Rapid Transit 2004, 218, 173–177. [Google Scholar] [CrossRef]
- Luo, R.K. Multiaxial Fatigue Prediction on Crack Initiation for Rubber Antivibration Design—Location and Orientation with Stress Ranges. Proc. Inst. Mech. Eng. Part L J. Mater. Des. Appl. 2021, 235, 469–480. [Google Scholar] [CrossRef]
- Luo, R.K. Effective Stress Criterion for Rubber Multiaxial Fatigue under Both Proportional and Non-Proportional Loadings. Eng. Fail. Anal. 2021, 121, 105172. [Google Scholar] [CrossRef]
- Luo, R.K.; Mortel, W.J.; Wu, X.P. Fatigue Failure Investigation on Anti-Vibration Springs. Eng. Fail. Anal. 2009, 16, 1366–1378. [Google Scholar] [CrossRef]
- Luo, R.K.; Wu, W.X. Fatigue Failure Analysis of Anti-Vibration Rubber Spring. Eng. Fail. Anal. 2006, 13, 110–116. [Google Scholar] [CrossRef]
- Shangguan, W.; Zheng, G.; Liu, T.; Duan, X.; Rakheja, S. Prediction of Fatigue Life of Rubber Mounts Using Stress-Based Damage Indexes. Proc. Inst. Mech. Eng. Part L J. Mater. Des. Appl. 2017, 231, 657–673. [Google Scholar] [CrossRef]
- Brunac, J.-B.; Gérardin, O.; Leblond, J.-B. On the Heuristic Extension of Haigh’s Diagram for the Fatigue of Elastomers to Arbitrary Loadings. Int. J. Fatigue 2009, 31, 859–867. [Google Scholar] [CrossRef]
- Ayoub, G.; Naït-abdelaziz, M.; Zaïri, F.; Gloaguen, J.M. Multiaxial Fatigue Life Prediction of Rubber-like Materials Using the Continuum Damage Mechanics Approach. Procedia Eng. 2010, 2, 985–993. [Google Scholar] [CrossRef]
- Wang, B.; Lu, H.; Kim, G. A Damage Model for the Fatigue Life of Elastomeric Materials. Mech. Mater. 2002, 34, 475–483. [Google Scholar] [CrossRef]
- Ayoub, G.; Naït-Abdelaziz, M.; Zaïri, F.; Gloaguen, J.M.; Charrier, P. Fatigue Life Prediction of Rubber-like Materials under Multiaxial Loading Using a Continuum Damage Mechanics Approach: Effects of Two-Blocks Loading and R Ratio. Mech. Mater. 2012, 52, 87–102. [Google Scholar] [CrossRef]
- Li, Q.; Zhao, J.; Zhao, B. Fatigue Life Prediction of a Rubber Mount Based on Test of Material Properties and Finite Element Analysis. Eng. Fail. Anal. 2009, 16, 2304–2310. [Google Scholar] [CrossRef]
- Samad, M.S.A.; Ali, A.; Sidhu, R.S. Durability of Automotive Jounce Bumper. Mater. Des. 2011, 32, 1001–1005. [Google Scholar] [CrossRef]
- Woo, C.-S.; Kim, W.-D. Fatigue Lifetime Prediction Methodology of Rubber Components. In Proceedings of the High Performance Structures and Materials IV; WIT Press: Algarve, Portugal, 2008; Volume I, pp. 285–293. [Google Scholar]
- Echchur Rangarajan, S.; Ramarathnam, K.K. Damage Evolution in Natural Rubber: An Experimental Study. J. Mech. Phys. Solids 2020, 137, 103850. [Google Scholar] [CrossRef]
- Echchur Rangarajan, S.; Ramarathnam, K.K. Viscoelastic Properties of Natural Rubber with Fatigue Damage. Int. J. Fatigue 2021, 150, 106344. [Google Scholar] [CrossRef]
- Zarrin-Ghalami, T.; Fatemi, A. Multiaxial Fatigue and Life Prediction of Elastomeric Components. Int. J. Fatigue 2013, 55, 92–101. [Google Scholar] [CrossRef]
- Woo, C.-S.; Kim, W.-D.; Kim, W.-S.; Kwon, J.-D. A Study on the Fatigue Life Prediction and Evaluation of Rubber Components; International Rubber Conference Organization: Beijing, China, 2004; pp. 342–348. [Google Scholar]
- Oshima, H.; Aono, Y.; Noguchi, H.; Shibata, S. Fatigue Characteristics of Vulcanized Natural Rubber for Automotive Engine Mounting (Characteristics of Composition and Mechanical Properties). Mem. Fac. Eng. Kyushu Univ. 2007, 67, 75–83. [Google Scholar]
- Wang, G.; Wang, W.; Liang, C.; Cao, L. Fatigue Life Prediction of Radial Tire Bead Using a Maximum Strain Energy Density Range Method. Appl. Sci. 2021, 11, 5477. [Google Scholar] [CrossRef]
- Chung, J.; Kim, N.H. Numerical Methods of Multiaxial Fatigue Life Prediction for Elastomers under Variable Amplitude Loadings. Fatigue Fract. Eng. Mater. Struct. 2016, 39, 866–876. [Google Scholar] [CrossRef]
- Li, W.; Xin, Z. Flexural Fatigue Life Prediction of a Tooth V-Belt Made of Fiber Reinforced Rubber. Int. J. Fatigue 2018, 111, 269–277. [Google Scholar] [CrossRef]
- Oman, S.; Nagode, M. On the Influence of the Cord Angle on Air-Spring Fatigue Life. Eng. Fail. Anal. 2013, 27, 61–73. [Google Scholar] [CrossRef]
- Mars, W.V. Multiaxial Fatigue of Rubber. Ph.D. Thesis, University of Toledo, Toledo, OH, USA, 2001. [Google Scholar]
- Bi, J.; Dimitrova, G.; Eyl, S.; Ave, A.; Ri, J. Development of a durable automotive bushing with fe-safe/Rubber. In Proceedings of the Simulia Regional Users Meeting, Plymouth, MI, USA, 12–13 November 2015; Available online: https://www.researchgate.net/publication/280945833_Rubber_bushing_design_and_shape_optimization_based_on_fatigue_life_prediction/citations (accessed on 19 February 2025).
- Nyaaba, W.; Bolarinwa, E.O.; Frimpong, S. Durability Prediction of an Ultra-Large Mining Truck Tire Using an Enhanced Finite Element Method. Proc. Inst. Mech. Eng. Part D J. Automob. Eng. 2019, 233, 161–169. [Google Scholar] [CrossRef]
- Oman, S.; Fajdiga, M.; Nagode, M. Estimation of Air-Spring Life Based on Accelerated Experiments. Mater. Des. 2010, 31, 3859–3868. [Google Scholar] [CrossRef]
- Fatemi, A.; Socie, D.F. A Critical Plane Approach to Multiaxial Fatigue Damage Including Out-of-phase Loading. Fatigue Fract. Eng. Mater. Struct. 1988, 11, 149–165. [Google Scholar] [CrossRef]
- Chen, X.; Xu, S.; Huang, D. A Critical Plane-strain Energy Density Criterion for Multiaxial Low-cycle Fatigue Life under Non-proportional Loading. Fatigue Fract. Eng. Mater. Struct. 1999, 22, 679–686. [Google Scholar] [CrossRef]
- Gent, A.N. Engineering with Rubber: How to Design Rubber Components, 3rd ed.; Carl Hanser Fachbuchverlag, S.l.: Munich, Germany, 2012; ISBN 978-3-446-42871-3. [Google Scholar]
- Griffith, A.A. The Phenomena of Rupture and Flow in Solids. Philos. Trans. R. Soc. Lond. Ser. Contain. Pap. Math. Phys. Character 1921, 221, 163–198. [Google Scholar] [CrossRef]
- Asare, S.; Busfield, J.J.C. Fatigue Life Prediction of Bonded Rubber Components at Elevated Temperature. Plast. Rubber Compos. 2011, 40, 194–200. [Google Scholar] [CrossRef]
- Lake, G.J. Fatigue and Fracture of Elastomers. Rubber Chem. Technol. 1995, 68, 435–460. [Google Scholar] [CrossRef]
- Lindley, P.B. Relation between Hysteresis and the Dynamic Crack Growth Resistance of Natural Rubber. Int. J. Fract. 1973, 9, 449–462. [Google Scholar]
- Wang, X.; Liao, M.; Xu, Y.; Liu, X.-A. Fatigue Crack Propagation Characteristics of Rubbery Materials under Variable Amplitude Loading. Results Phys. 2018, 10, 233–240. [Google Scholar] [CrossRef]
- Lindley, P.B.; Stevenson, A. Fatigue Resistance of Natural Rubber in Compression. Rubber Chem. Technol. 1982, 55, 337–351. [Google Scholar] [CrossRef]
- Liu, Z.; Zakoworotny, M.; Guo, J.; Zehnder, A.T.; Hui, C.-Y. Energy Release Rate of a Single Edge Cracked Specimen Subjected to Large Deformation. Int. J. Fract. 2020, 226, 71–79. [Google Scholar] [CrossRef]
- Heinrich, G.; Kipscholl, R.; Stoček, R. (Eds.) Fatigue Crack Growth in Rubber Materials: Experiments and Modelling; Advances in Polymer Science; Springer International Publishing: Cham, Switzerland, 2021; Volume 286, ISBN 978-3-030-68919-3. [Google Scholar]
- Mirza, S.; Hansen, P.; Harris, J. Modelling and Durability Assessment for Rubber Components in Rail Vehicles. Plast. Rubber Compos. 2011, 40, 185–193. [Google Scholar] [CrossRef]
- Ytuarte, E.; Aguirre-Mesa, A.M.; Ramirez-Tamayo, D.; Avila, D.; Millwater, H.; Restrepo, D.; Montoya, A. Tearing Energy Calculation in Hyperelastic Fracture Mechanics Using the Local and Global Complex-Variable Finite Element Method. Int. J. Solids Struct. 2022, 239–240, 111425. [Google Scholar] [CrossRef]
- Busfield, J.J.C.; Davies, C.K.L.; Thomas, A.G. Aspects of Fracture in Rubber Components. In Proceedings of the Progress in Rubber and Plastics Technology; Rapra Technology: Shrewsbury, UK, 1996; Volume 12, pp. 191–207. [Google Scholar]
- Busfield, J.J.C.; Jha, V.; Liang, H.; Papadopoulos, I.C.; Thomas, A.G. Prediction of Fatigue Crack Growth Using Finite Element Analysis Techniques Applied to Three-Dimensional Elastomeric Components. Plast. Rubber Compos. 2005, 34, 349–356. [Google Scholar] [CrossRef]
- Heydari-Meybodi, M.; Ayatollahi, M.R.; Berto, F. Rupture Analysis of Rubber in the Presence of a Sharp V-Shape Notch under Pure Mode-I Loading. Int. J. Mech. Sci. 2018, 146–147, 405–415. [Google Scholar] [CrossRef]
- Sundararaman, S.; Liang, G.; Chandrashekhara, K.; Oliver, L.R.; Holmes, S.G. Mode-I Fatigue Crack Growth Analysis of V-Ribbed Belts. Finite Elem. Anal. Des. 2007, 43, 870–878. [Google Scholar] [CrossRef]
- Rice, J.R. A Path Independent Integral and the Approximate Analysis of Strain Concentration by Notches and Cracks. J. Appl. Mech. 1968, 35, 379–386. [Google Scholar] [CrossRef]
- Yang, X.; Fu, M.; Wang, X.; Liu, X. Nonlinear Finite Element Analysis of Crack Growth at the Interface of Rubber-like Bimaterials. Sci. China Phys. Mech. Astron. 2011, 54, 1866–1874. [Google Scholar] [CrossRef]
- Caimmi, F.; Calabrò, R.; Briatico-Vangosa, F.; Marano, C.; Rink, M. Toughness of Natural Rubber Compounds under Biaxial Loading. Eng. Fract. Mech. 2015, 149, 250–261. [Google Scholar] [CrossRef]
- El Yaagoubi, M.; Juhre, D.; Meier, J.; Alshuth, T.; Giese, U. Prediction of Energy Release Rate in Crack Opening Mode (Mode I) for Filled and Unfilled Elastomers Using the Ogden Model. Eng. Fract. Mech. 2017, 182, 74–85. [Google Scholar] [CrossRef]
- El Yaagoubi, M.; Juhre, D.; Meier, J.; Alshuth, T.; Giese, U. Prediction of Tearing Energy in Mode III for Filled Elastomers. Theor. Appl. Fract. Mech. 2017, 88, 31–38. [Google Scholar] [CrossRef]
- Liu, Q.; Shi, W.; Chen, Z. Rubber Fatigue Life Prediction Using a Random Forest Method and Nonlinear Cumulative Fatigue Damage Model. J. Appl. Polym. Sci. 2020, 137, 48519. [Google Scholar] [CrossRef]
- Tavosi, S.; Alimardani, M.; Ghoreishy, M.H.R.; Tavakol, M. Fatigue Failure Modeling in Rubber Stator of Downhole Motors: Dependency to Materials and Geometry, and Its Application to Life Prediction. Eng. Fail. Anal. 2024, 159, 108072. [Google Scholar] [CrossRef]
- Peter, O.; Stěnička, M.; Heinrich, G.; Robertson, C.G.; Pawlas, J.; Stoček, R.; Ondrík, J. The Tearing Energy Threshold of Crack Growth in Rubber Exposed to Ozone an Experimental–Numerical. Int. J. Fract. 2024, 248, 49–66. [Google Scholar] [CrossRef]
- Hocine, N.A.; Abdelaziz, M.N.; Ghfiri, H.; Mesmacque, G. Evaluation of the Energy Parameter J on Rubber-like Materials: Comparison between Experimental and Numerical Results. Eng. Fract. Mech. 1996, 55, 919–933. [Google Scholar] [CrossRef]
- Aït Hocine, N.; Naït Abdelaziz, M. Fracture Analysis of Rubber-like Materials Using Global and Local Approaches: Initiation and Propagation Direction of a Crack. Polym. Eng. Sci. 2009, 49, 1076–1088. [Google Scholar] [CrossRef]
- Mars, W.V.; Fatemi, A. The Correlation of Fatigue Crack Growth Rates in Rubber Subjected to Multiaxial Loading Using Continuum Mechanical Parameters. Rubber Chem. Technol. 2007, 80, 169–182. [Google Scholar] [CrossRef]
- Ding, Z.; Chen, J.; Song, C.; Wang, W. Analysis of fatigue crack growth life for rubber vibration damper. J. Mech. Eng. 2010, 46, 58. [Google Scholar] [CrossRef]
- Young, D.G. Application of Fatigue Methods Based on Fracture Mechanics for Tire Compound Development. Rubber Chem. Technol. 1990, 63, 567–581. [Google Scholar] [CrossRef]
- Elango, C.; Pandi, S.K.; Mahadule, R.N.; Zarrin-Ghalami, T. Fatigue Life Prediction and Correlation of Engine Mount Elastomeric Bushing Using a Crack Growth Approach; No. 2022-01-0760; SAE International: Detroit, MI, USA, 2022. [Google Scholar]
- Sundararaman, S.; Hu, J.; Chen, J.; Chandrashekhara, K. Temperature Dependent Fatigue-Failure Analysis of V-Ribbed Serpentine Belts. Int. J. Fatigue 2009, 31, 1262–1270. [Google Scholar] [CrossRef]
- Roy, P.; Behera, D.; Madenci, E. Peridynamic Simulation of Finite Elastic Deformation and Rupture in Polymers. Eng. Fract. Mech. 2020, 236, 107226. [Google Scholar] [CrossRef]
- Ambati, M.; Gerasimov, T.; De Lorenzis, L. A Review on Phase-Field Models of Brittle Fracture and a New Fast Hybrid Formulation. Comput. Mech. 2015, 55, 383–405. [Google Scholar] [CrossRef]
- Loew, P.J.; Peters, B.; Beex, L.A.A. Fatigue Phase-Field Damage Modeling of Rubber Using Viscous Dissipation: Crack Nucleation and Propagation. Mech. Mater. 2020, 142, 103282. [Google Scholar] [CrossRef]
- Loew, P.J.; Poh, L.H.; Peters, B.; Beex, L.A.A. Accelerating Fatigue Simulations of a Phase-Field Damage Model for Rubber. Comput. Methods Appl. Mech. Eng. 2020, 370, 113247. [Google Scholar] [CrossRef]
- Tian, F.; Tang, X.; Xu, T.; Li, L. Adaptive Edge-Based Smoothed Finite Element Method (ES-FEM) for Phase-Field Modeling of Fractures at Large Deformations. Comput. Methods Appl. Mech. Eng. 2020, 372, 113376. [Google Scholar] [CrossRef]
- Miehe, C.; Schänzel, L.-M. Phase Field Modeling of Fracture in Rubbery Polymers. Part I: Finite Elasticity Coupled with Brittle Failure. J. Mech. Phys. Solids 2014, 65, 93–113. [Google Scholar] [CrossRef]
- Brighenti, R.; Vernerey, F.J.; Artoni, F. Rate-Dependent Failure Mechanism of Elastomers. Int. J. Mech. Sci. 2017, 130, 448–457. [Google Scholar] [CrossRef]
- Loew, P.J.; Peters, B.; Beex, L.A.A. Rate-Dependent Phase-Field Damage Modeling of Rubber and Its Experimental Parameter Identification. J. Mech. Phys. Solids 2019, 127, 266–294. [Google Scholar] [CrossRef]
- Larin, O.O. Probabilistic Model of Fatigue Damage Accumulation in Rubberlike Materials. Strength Mater. 2015, 47, 849–858. [Google Scholar] [CrossRef]
- Kamiński, M.; Lauke, B. Probabilistic and Stochastic Aspects of Rubber Hyperelasticity. Meccanica 2018, 53, 2363–2378. [Google Scholar] [CrossRef]
- Bakhshizade, A.; Ghasemi-Ghalebahman, A.; Hajimousa, M.A. Development of Novel Models for Fatigue Life Assessment of Natural Rubber/Styrene-butadiene Rubber/Nanoclay Nanocomposite. Polym. Compos. 2024, 45, 1851–1871. [Google Scholar] [CrossRef]
- Belkhiria, S.; Seddik, R.; Atig, A.; Ben Sghaier, R.; Hamdi, A.; Fathallah, R. Fatigue Reliability Prediction of Rubber Parts Based on Wöhler Diagrams. Int. J. Adv. Manuf. Technol. 2018, 96, 439–450. [Google Scholar] [CrossRef]
- Belkhiria, S.; Seddik, R.; Hamdi, A.; Fathallah, R. FE and Probabilistic Analysis for Rubber Life Estimation Considering Cracking Energy Density as a Fatigue Predictor. Polym. Polym. Compos. 2023, 31, 09673911231202377. [Google Scholar] [CrossRef]
- Wang, X.; Liu, Z.; Zeng, X.; Xu, Y. A Method to Obtain Probabilistic Fatigue Lives under Varying Strain Peaks for Rubber Components with Small Samples. Fatigue Fract. Eng. Mater. Struct. 2024, 47, 2955–2968. [Google Scholar] [CrossRef]
- Mars, W.V.; Fatemi, A. Fatigue Crack Nucleation and Growth in Filled Natural Rubber. Fatigue Fract. Eng. Mater. Struct. 2003, 26, 779–789. [Google Scholar] [CrossRef]
- Dizon, E.S.; Hicks, A.E.; Chirico, V.E. The Effect of Carbon Black Parameters on the Fatigue Life of Filled Rubber Compounds. Rubber Chem. Technol. 1974, 47, 231–249. [Google Scholar] [CrossRef]
- Liu, X.; Shangguan, W.; Zhao, X. Probabilistic Fatigue Life Prediction Model of Natural Rubber Components Based on the Expanded Sample Data. Int. J. Fatigue 2022, 163, 107034. [Google Scholar] [CrossRef]
- Liu, X.; Zhao, X.; Liu, X. A Unified Probabilistic Fatigue Life Prediction Model for Natural Rubber Components Considering Strain Ratio Effect. Fatigue Fract. Eng. Mater. Struct. 2023, 46, 1473–1487. [Google Scholar] [CrossRef]
- El Yaagoubi, M.; Meier, J.; Juhre, D. Lifetime Prediction of Carbon Black Filled Elastomers Based on the Probability Distribution of Particle Using an Inelastic and Hyperelastic Material Model. Eng. Fail. Anal. 2020, 118, 104943. [Google Scholar] [CrossRef]
- Centola, A.; Ciampaglia, A.; Paolino, D.S.; Tridello, A. Probabilistic Machine Learning for Preventing Fatigue Failures in Additively Manufactured SS316L. Eng. Fail. Anal. 2025, 168, 109081. [Google Scholar] [CrossRef]
- Chen, S.; Zhou, X.; Bai, Y. A Frequency Domain Enhanced Multi-View Neural Network Approach to Multiaxial Fatigue Life Prediction for Various Metal Materials. Int. J. Fatigue 2025, 190, 108620. [Google Scholar] [CrossRef]
- Liu, Q.; Shi, W.; Chen, Z. Fatigue Life Prediction for Vibration Isolation Rubber Based on Parameter-optimized Support Vector Machine Model. Fatigue Fract. Eng. Mater. Struct. 2019, 42, 710–718. [Google Scholar] [CrossRef]
- Liu, X.; Shangguan, W.; Zhao, X. Residual Fatigue Life Prediction of Natural Rubber Components under Variable Amplitude Loads. Int. J. Fatigue 2022, 165, 107199. [Google Scholar] [CrossRef]
- Liu, X.; Zhao, X.; Shangguan, W. Fatigue Life Prediction of Natural Rubber Components Using an Artificial Neural Network. Fatigue Fract. Eng. Mater. Struct. 2022, 45, 1678–1689. [Google Scholar] [CrossRef]
- Liu, X.; Wang, X. Natural Rubber Components Fatigue Life Estimation through an Extreme Learning Machine. Proc. Inst. Mech. Eng. Part L J. Mater. Des. Appl. 2023, 237, 81–91. [Google Scholar] [CrossRef]
- Wang, X.; Liu, J. Intelligent Prediction of Fatigue Life of Natural Rubber Considering Strain Ratio Effect. Fatigue Fract. Eng. Mater. Struct. 2023, 46, 1687–1703. [Google Scholar] [CrossRef]
- Xiang, K.-L.; Xiang, P.-Y.; Wu, Y.-P. Prediction of the Fatigue Life of Natural Rubber Composites by Artificial Neural Network Approaches. Mater. Des. 2014, 57, 180–185. [Google Scholar] [CrossRef]
- Duan, X.; Shangguan, W.; Li, M.; Rakheja, S. Measurement and Modelling of the Fatigue Life of Rubber Mounts for an Automotive Powertrain at High Temperatures. Proc. Inst. Mech. Eng. Part D J. Automob. Eng. 2016, 230, 942–954. [Google Scholar] [CrossRef]
- Bannantine, J.A.; Comer, J.J.; Handrock, J.L. Fundamentals of Metal Fatigue Analysis; Prentice Hall: Englewood Cliffs, NJ, USA, 1989. [Google Scholar]
- Ayoub, G.; Naït-Abdelaziz, M.; Zaïri, F. Multiaxial Fatigue Life Predictors for Rubbers: Application of Recent Developments to a Carbon-Filled SBR. Int. J. Fatigue 2014, 66, 168–176. [Google Scholar] [CrossRef]
- Beatty, J.R. Fatigue of Rubber. Rubber Chem. Technol. 1964, 37, 1341–1364. [Google Scholar] [CrossRef]
- ASTM D4482-11; Standard Test Method for Rubber Property—Extension Cycling Fatigue. ASTM International: West Conshohocken, PA, USA, 2021.
- ISO 6943-17; Rubber, Vulcanized—Determination of Tension Fatigue. ISO: Geneva, Switzerland, 2022.
- Champy, C.; Le Saux, V.; Marco, Y.; Glanowski, T.; Charrier, P.; Hervouet, W. Fatigue of Crystallizable Rubber: Generation of a Haigh Diagram over a Wide Range of Positive Load Ratios. Int. J. Fatigue 2021, 150, 106313. [Google Scholar] [CrossRef]
- Harbour, R.J.; Fatemi, A.; Mars, W.V. Fatigue Crack Growth of Rubber under Variable Amplitude Loading; Elsevier Ltd.: Altanta, GA, USA, 2006. [Google Scholar]
- Saintier, N.; Cailletaud, G.; Piques, R. Cyclic Loadings and Crystallization of Natural Rubber: An Explanation of Fatigue Crack Propagation Reinforcement under a Positive Loading Ratio. Mater. Sci. Eng. A 2011, 528, 1078–1086. [Google Scholar] [CrossRef]
- Beatty, J.R. Some Fatigue Properties of Rubber Blends. J. Elastomers Plast. 1979, 11, 147–167. [Google Scholar] [CrossRef]
- Harbour, R.J.; Fatemi, A.; Mars, W.V. Fatigue Crack Growth of Filled Rubber under Constant and Variable Amplitude Loading Conditions. Fatigue Fract. Eng. Mater. Struct. 2007, 30, 640–652. [Google Scholar] [CrossRef]
- Belkhiria, S.; Abroug, A.; Fathallah, R. A Simple Fatigue Methodology for Filled Natural Rubbers under Positive and Negative R Ratios. Mater. Res. Express 2024, 11, 055307. [Google Scholar] [CrossRef]
- Hottin, A.; Naït Abdelaziz, M.; Talha, A.; Charrier, P. Continuum Damage Mechanics to Predict Rubber Fatigue Life under Multiaxial Loadings. Int. J. Fatigue 2023, 170, 107559. [Google Scholar] [CrossRef]
- Le Mire, E.; Verron, E.; Huneau, B.; Selles, N. Multiaxial Fatigue Experiments for Elastomers Based on True Strain Invariants. J. Rubber Res. 2021, 24, 227–236. [Google Scholar] [CrossRef]
- Wang, Y.; Yu, W.; Chen, X.; Yan, L. Fatigue Life Prediction of Vulcanized Natural Rubber under Proportional and Non-proportional Loading. Fatigue Fract. Eng. Mater. Struct. 2008, 31, 38–48. [Google Scholar] [CrossRef]
- Martin, B.; Verron, E.; Coret, M.; Selles, N. Towards a Rational Approach for Multi-Axial Experimental Campaigns for Rubberlike Material. Int. J. Solids Struct. 2024, 305, 113060. [Google Scholar] [CrossRef]
- Bourchak, M.; Aid, A. PE-HD Fatigue Damage Accumulation under Variable Loading Based on Various Damage Models. Express Polym. Lett. 2017, 11, 117–126. [Google Scholar] [CrossRef]
- ASTM D412-16; Standard Test Methods for Vulcanized Rubber and Thermoplastic Elastomers—Tension. ASTM International: West Conshohocken, PA, USA, 2021.
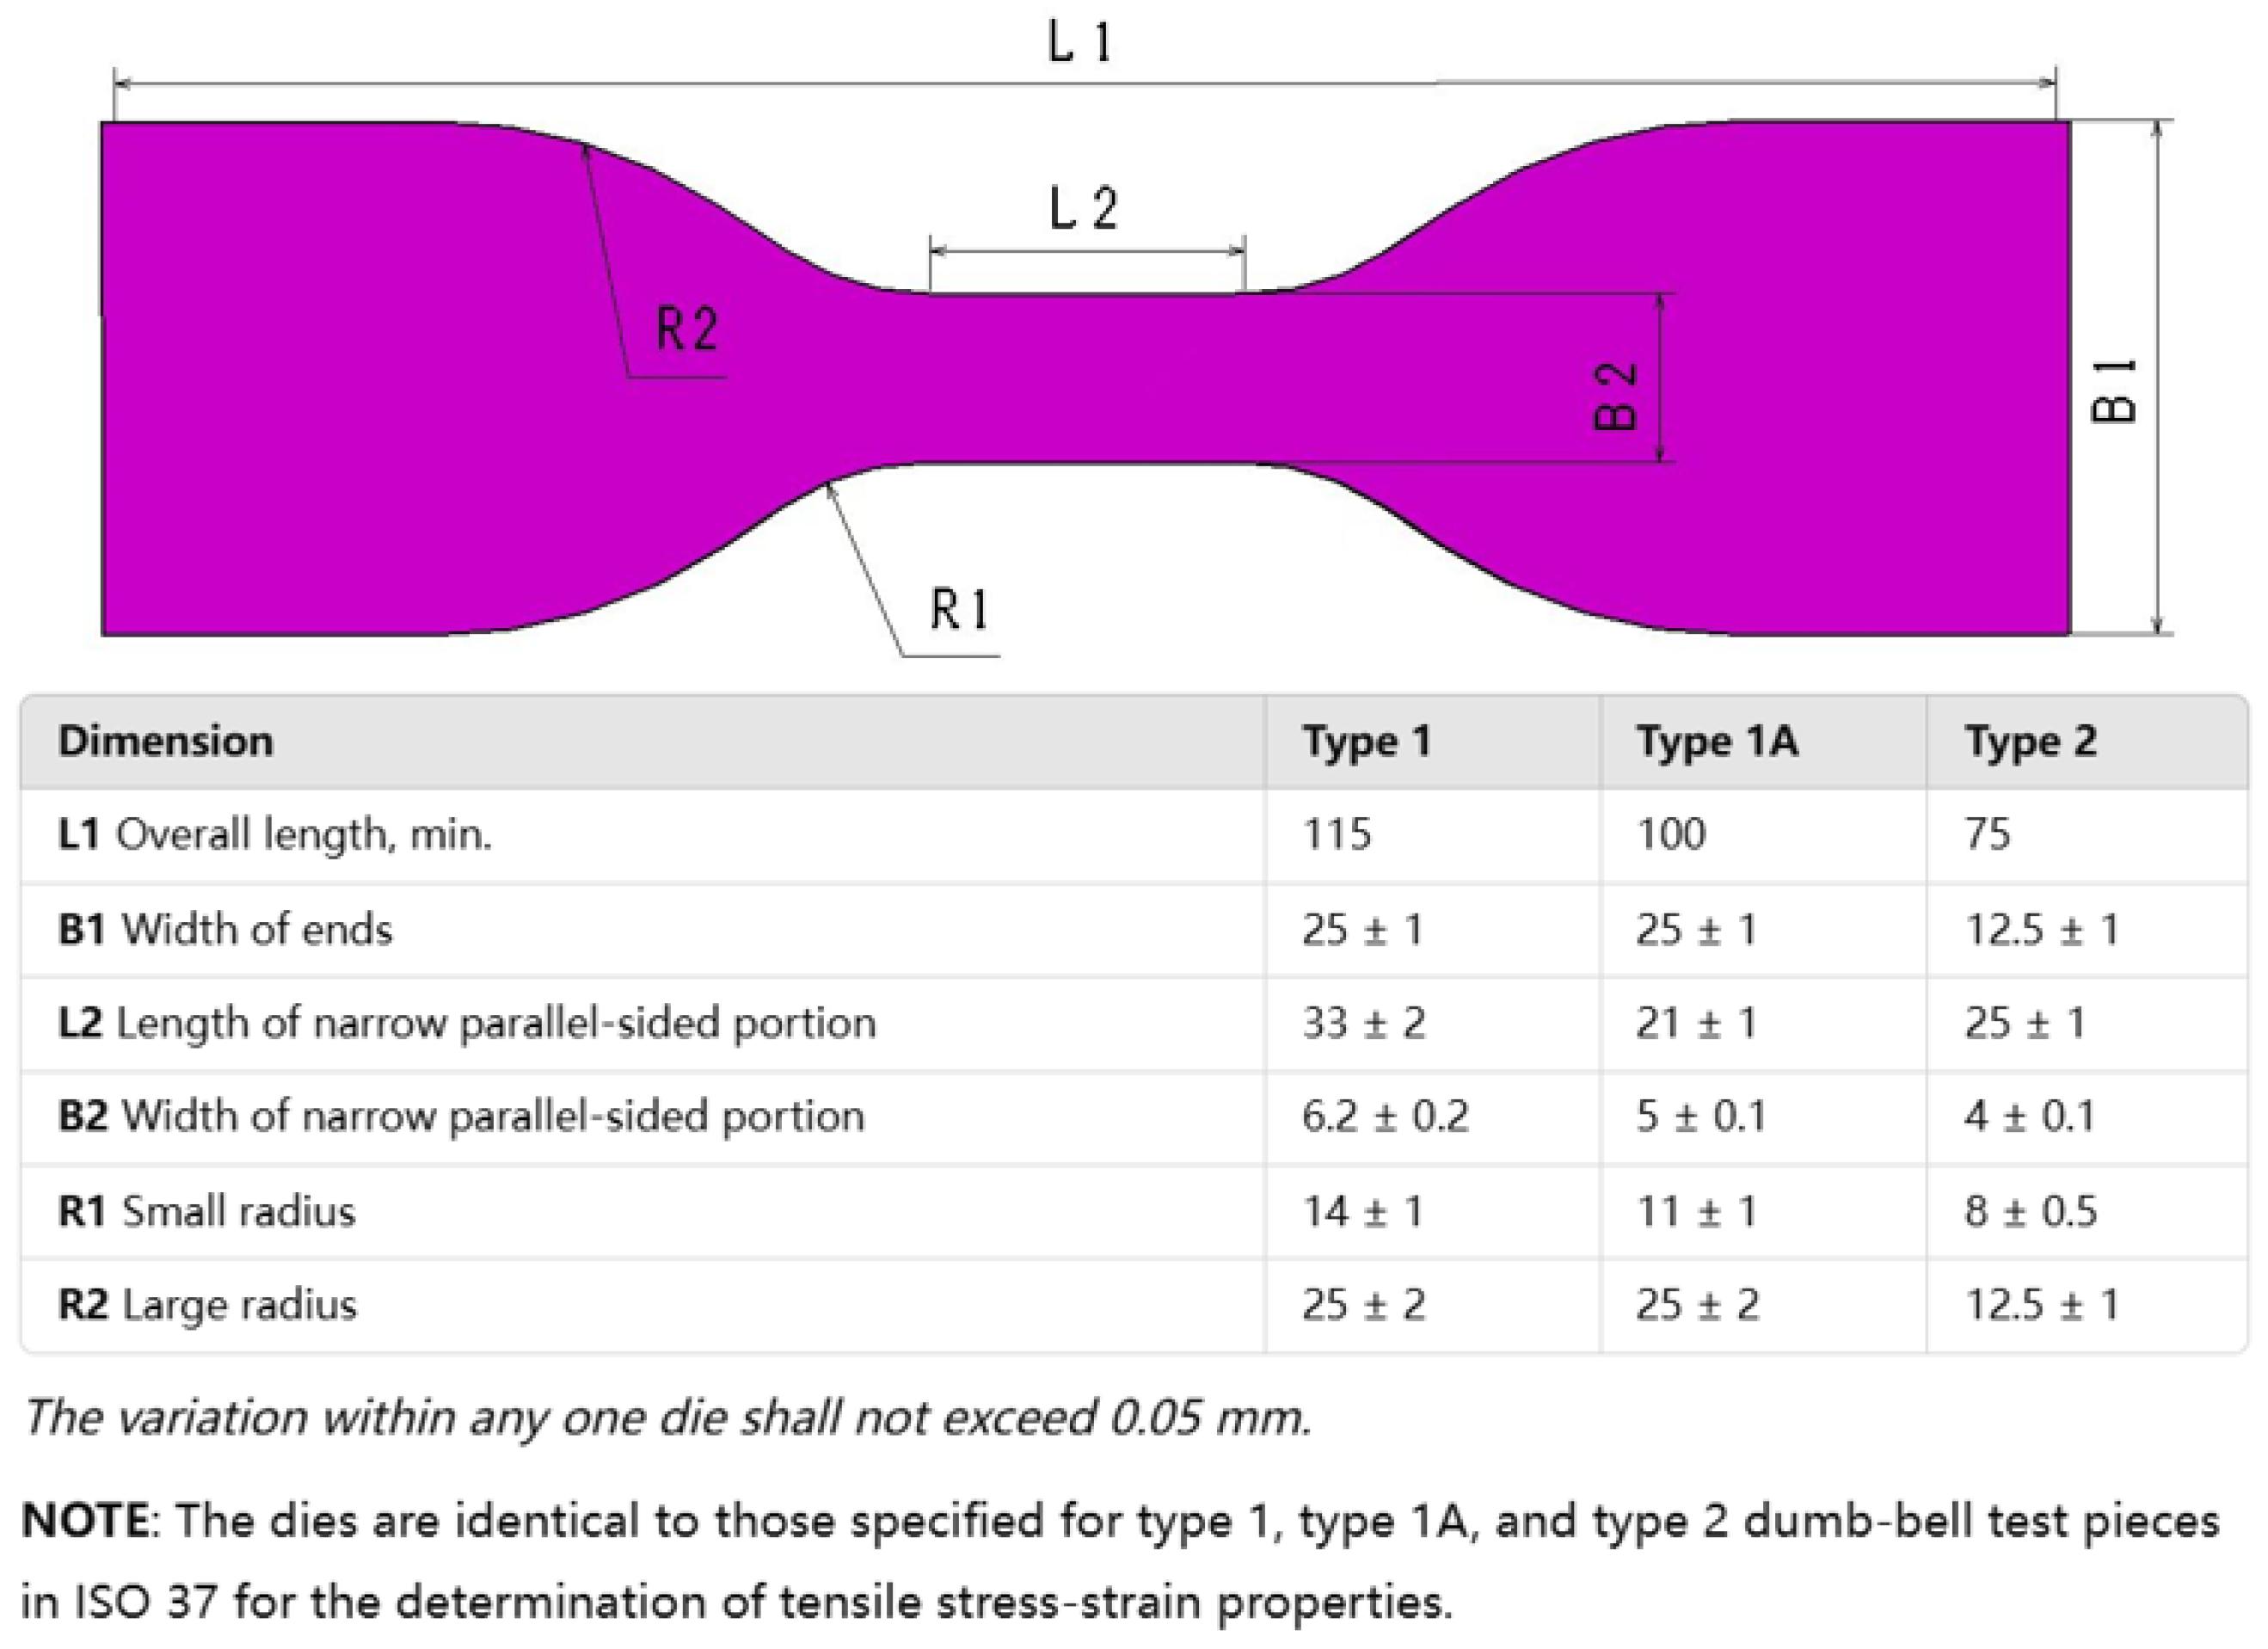
- ISO 37; Rubber, Vulcanized or Thermoplastic—Determination of Tensile Stress-Strain Properties. ISO: Geneva, Switzerland, 2024.
- El Yaagoubi, M.; El Maanaoui, H.; Meier, J. New Fatigue Test Sample: Lifetime Prediction of Carbon Black Filled Elastomers Based on the Probability Distribution of Particles. Polymer 2020, 208, 122973. [Google Scholar] [CrossRef]
- El Yaagoubi, M.; Juhre, D.; Meier, J.; Kröger, N.; Alshuth, T.; Giese, U. Lifetime Prediction of Filled Elastomers Based on Particle Distribution and the J-Integral Evaluation. Int. J. Fatigue 2018, 112, 341–354. [Google Scholar] [CrossRef]
- Mars, W.V.; Fatemi, A. A Novel Specimen for Investigating the Mechanical Behavior of Elastomers under Multiaxial Loading Conditions. Exp. Mech. 2004, 44, 136–146. [Google Scholar] [CrossRef]
- Zhou, Y.; Jerrams, S.; Chen, L. Multi-Axial Fatigue in Magnetorheological Elastomers Using Bubble Inflation. Mater. Des. 2013, 50, 68–71. [Google Scholar] [CrossRef]
- Antunes, F.; Branco, R.; Ferreira, J.; Borrego, L. Stress Intensity Factor Solutions for CTS Mixed Mode Specimen. Fract. Struct. Integr. 2019, 13, 676–692. [Google Scholar] [CrossRef]
- ASTM D813-95; Standard Test Method for Rubber Deterioration-Crack Growth. ASTM International: West Conshohocken, PA, USA, 2000.
- ASTM D430-06; Standard Test Methods for Rubber Deterioration-Dynamic Fatigue. ASTM International: West Conshohocken, PA, USA, 2018.
- ISO-132; Rubber, Vulcanized or Thermoplastic—Determination of Flex Cracking and Crack Growth (De Mattia). ISO: Geneva, Switzerland, 2017.
- Bauman, J.T. Fatigue, Stress, and Strain of Rubber Components: A Guide for Design Engineers; Hanser Publications: Munich, Germany; Cincinnati, OH, USA, 2008; ISBN 978-1-56990-431-2. [Google Scholar]
- Greensmith, H.W. Rupture of Rubber. X. The Change in Stored Energy on Making a Small Cut in a Test Piece Held in Simple Extension. J. Appl. Polym. Sci. 1963, 7, 993–1002. [Google Scholar] [CrossRef]
- Lindley, P.B. Energy for Crack Growth in Model Rubber Components. J. Strain Anal. 1972, 7, 132–140. [Google Scholar] [CrossRef]
- ASTM D624; Standard Test Method for Tear Strength of Conventional Vulcanized Rubber and Thermoplastic Elastomers. ASTM International: West Conshohocken, PA, USA, 2020.
- Young, D.G. Dynamic Property and Fatigue Crack Propagation Research on Tire Sidewall and Model Compounds. Rubber Chem. Technol. 1985, 58, 785–805. [Google Scholar] [CrossRef]
- Zhao, J.; Ghebremeskel, G.N. A Review of Some of the Factors Affecting Fracture and Fatigue in SBR and BR Vulcanizates. Rubber Chem. Technol. 2001, 74, 409–427. [Google Scholar] [CrossRef]
- Gehling, T.; Kerschbaumer, R.C.; Pinter, G.; Fasching, M.A.; Schwarz, T.; Schieppati, J. Investigating the Impact of Manufacturing Conditions on Crack Growth Rate in Nitrile Butadiene Rubber for Enhanced Service Life—Part 01. Results Eng. 2023, 20, 101484. [Google Scholar] [CrossRef]
- Xue, C.; Gao, H.; Hu, G. Viscoelastic and Fatigue Properties of Graphene and Carbon Black Hybrid Structure Filled Natural Rubber Composites under Alternating Loading. Constr. Build. Mater. 2020, 265, 120299. [Google Scholar] [CrossRef]
- Wu, Y.; Zhao, W.; Zhang, L. Improvement of Flex-fatigue Life of Carbon-black-filled Styrene-butadiene Rubber by Addition of Nanodispersed Clay. Macromol. Mater. Eng. 2006, 291, 944–949. [Google Scholar] [CrossRef]
- Kim, H.J.; Jeong, H. A Study on the Material Properties and Fatigue Life of Natural Rubber with Different Carbon Blacks. Int. J. Fatigue 2005, 27, 263–272. [Google Scholar] [CrossRef]
- Izadi, M.; Tabatabaee Ghomi, M.; Pircheraghi, G. Mechanical Strength Improvement of Mud Motor’s Elastomer by Nano Clay and Prediction the Working Life via Strain Energy. Int. J. Eng. 2019, 32, 338–345. [Google Scholar] [CrossRef]
- Tamilselvan, T.; Prasanna, S.C. Review on the Effect of Nanofiller Addition on the Technical Properties of Polymers. Int. J. Mech. Prod. Eng. Res. Dev. 2018, 8, 1023–1032. [Google Scholar]
- Chandran, V.; Manvel Raj, T.; Lakshmanan, T.; Senthil Kumar, M. Influence of Different Fillers on Natural Rubber Composites to Assess Mechanical Performance. Int. J. Eng. 2015, 28, 932–939. [Google Scholar] [CrossRef]
- Bakhshizade, A.; Ghasemi-Ghalebahman, A.; Hajimousa, M.A. Evaluation of Fatigue Performance of Filled and Unfilled Natural Rubber/Styrene-butadiene Rubber Composites. Polym. Eng. Sci. 2023, 63, 189–205. [Google Scholar] [CrossRef]
- Rooj, S.; Das, A.; Morozov, I.A.; Stöckelhuber, K.W.; Stocek, R.; Heinrich, G. Influence of “Expanded Clay” on the Microstructure and Fatigue Crack Growth Behavior of Carbon Black Filled NR Composites. Compos. Sci. Technol. 2013, 76, 61–68. [Google Scholar] [CrossRef]
- Liang, J.; Zhang, H.; Luo, Z.; Zhong, J.; Wang, X. Fatigue-crack-propagation Behavior and Mechanism of Long Hemp-fiber-enhanced Styrene–Butadiene Rubber/Carbon Black Compounds. Polym. Compos. 2024, 45, 2941–2953. [Google Scholar] [CrossRef]
- Zhang, Y.; Guo, J.; Yang, J.; Li, X. Recent Structural Developments and Applications of Magnetorheological Dampers (Mrd): A Review. Magnetochemistry 2023, 9, 90. [Google Scholar] [CrossRef]
- Kaleta, J.; Królewicz, M.; Lewandowski, D. Magnetomechanical Properties of Anisotropic and Isotropic Magnetorheological Composites with Thermoplastic Elastomer Matrices. Smart Mater. Struct. 2011, 20, 085006. [Google Scholar] [CrossRef]
- Johari, M.A.F.; Mazlan, S.A.; Ubaidillah; Harjana; Abdul Aziz, S.A.; Nordin, N.A.; Johari, N.; Nazmi, N. An Overview of Durability Evaluations of Elastomer-Based Magnetorheological Materials. IEEE Access 2020, 8, 134536–134552. [Google Scholar] [CrossRef]
- Zhou, Y.; Jerrams, S.; Betts, A.; Chen, L. Fatigue Life Prediction of Magnetorheological Elastomers Subjected to Dynamic Equi-Biaxial Cyclic Loading. Mater. Chem. Phys. 2014, 146, 487–492. [Google Scholar] [CrossRef]
- Murphy, N. Providing Stress Controlled Equi-Biaxial Fatigue Test Data for Elastomers Using the Bubble Inflation Method. Ph.D. Thesis, Dublin Institute of Technology, Dublin, Ireland, 2010. [Google Scholar]
- Zhou, Y.; Jerrams, S.; Betts, A.; Farrell, G.; Chen, L. The Influence of Particle Content on the Equi-Biaxial Fatigue Behaviour of Magnetorheological Elastomers. Mater. Des. 2015, 67, 398–404. [Google Scholar] [CrossRef]
- Zhou, Y.; Johnson, M.; Wen, S.; Betts, A.; Jerrams, S. Equi-Biaxial Fatigue Behaviour of Magnetorheological Elastomers in Magnetic Fields. J. Intell. Mater. Syst. Struct. 2017, 28, 687–696. [Google Scholar] [CrossRef]
- Zhou, Y.; Jiang, L.; Chen, S.; Ma, J.; Betts, A.; Jerrams, S. Determination of Reliable Fatigue Life Predictors for Magnetorheological Elastomers under Dynamic Equi-Biaxial Loading. Polym. Test. 2017, 61, 177–184. [Google Scholar] [CrossRef]
- Gorman, D.; Murphy, N.; Ekins, R.; Jerrams, S. The Evaluation and Implementation of Magnetic Fields for Large Strain Uniaxial and Biaxial Cyclic Testing of Magnetorheological Elastomers. Polym. Test. 2016, 51, 74–81. [Google Scholar] [CrossRef]
- Gorman, D.; Murphy, N.; Ekins, R.; Jerrams, S. The Evaluation of the Effect of Strain Limits on the Physical Properties of Magnetorheological Elastomers Subjected to Uniaxial and Biaxial Cyclic Testing. Int. J. Fatigue 2017, 103, 1–4. [Google Scholar] [CrossRef]
- Lian, C.; Lee, K.-H.; Choi, S.-B.; Lee, C.-H. A Study of the Magnetic Fatigue Properties of a Magnetorheological Elastomer. J. Intell. Mater. Syst. Struct. 2019, 30, 749–754. [Google Scholar] [CrossRef]
- Wang, Y.; Xuan, S.; Ge, L.; Wen, Q.; Gong, X. Conductive Magnetorheological Elastomer: Fatigue Dependent Impedance-Mechanic Coupling Properties. Smart Mater. Struct. 2017, 26, 015004. [Google Scholar] [CrossRef]
- Zhang, W.; Gong, X.L.; Jiang, W.Q.; Fan, Y.C. Investigation of the Durability of Anisotropic Magnetorheological Elastomers Based on Mixed Rubber. Smart Mater. Struct. 2010, 19, 085008. [Google Scholar] [CrossRef]
- Yoon, J.-H.; Lee, S.-W.; Bae, S.-H.; Kim, N.-I.; Yun, J.-H.; Jung, J.-H.; Kim, Y.-G. Effect of Cyclic Shear Fatigue under Magnetic Field on Natural Rubber Composite as Anisotropic Magnetorheological Elastomers. Polymers 2022, 14, 1927. [Google Scholar] [CrossRef]
- Saeidi Googarchin, H.; Shojaeefard, M.H.; Hosseini, S.M.; Banagar, I. A Comparative Study on Energy-Based Fatigue Criteria for Lifetime Calculation of Magnetorheological Elastomers under Multiaxial Loading. Int. J. Damage Mech. 2022, 31, 694–722. [Google Scholar] [CrossRef]
- Hosseini, S.M.; Shojaeefard, M.H.; Saeidi Googarchin, H. Fatigue Life Prediction of Magneto-Rheological Elastomers in Magnetic Field. Mater. Res. Express 2021, 8, 025304. [Google Scholar] [CrossRef]
- Mooney, M. A Theory of Large Elastic Deformation. J. Appl. Phys. 1940, 11, 582–592. [Google Scholar] [CrossRef]
- Yeoh, O.H. Some Forms of the Strain Energy Function for Rubber. Rubber Chem. Technol. 1993, 66, 754–771. [Google Scholar] [CrossRef]
- Marckmann, G.; Verron, E. Comparison of Hyperelastic Models for Rubber-Like Materials. Rubber Chem. Technol. 2006, 79, 835–858. [Google Scholar] [CrossRef]
- Hosseini, S.M.; Shojaeefard, M.H.; Googarchin, H.S. The Effect of Repetitive Magnetic and Cyclic Loading on the Fatigue Life Prediction of a Magnetorheological Elastomer. J. Elastomers Plast. 2022, 54, 279–299. [Google Scholar] [CrossRef]
- Mouslih, Y.; Le Cam, J.-B.; Ruellan, B.; Jeanneau, I.; Canevet, F. Temperature Effects on the Lifetime Reinforcement Due to Strain-Induced Crystallization in Carbon Black Filled Natural Rubber under Non-Relaxing Torsion: Comparison with Non-Relaxing Tensile Loadings. Mech. Mater. 2024, 196, 105045. [Google Scholar] [CrossRef]
- Mohd Sani, N.F.; Majid, N.A.; Rehman, A.; Hayeemasae, N.; Radhakrishnan, S.; Kulkarni, M.B.; Khimi, R. A Review of the Recent Development in Self-Healing Rubbers and Their Quantification Methods. Prog. Rubber Plast. Recycl. Technol. 2024, 40, 203–241. [Google Scholar] [CrossRef]
- Madeira, H.; Le Gac, P.Y.; Le Gall, M.; Verron, E. Prediction of Fatigue Lifetime by the Strain Energy Density for Filled Polychloroprene during Thermo-Oxidative Ageing. Int. J. Fatigue 2024, 178, 108023. [Google Scholar] [CrossRef]
- Luo, G.; Song, Z.; Guo, J.; Zhang, C.; Yang, X. Coupling Effect of Non-relaxing and High Temperature on Fatigue Properties of Carbon-black Filled Isoprene Rubber. J. Appl. Polym. Sci. 2024, 141, e55223. [Google Scholar] [CrossRef]
- Abdelmoniem, M.; Yagimli, B. Self-Heating in Rubber Components: Experimental Studies and Numerical Analysis. J. Rubber Res. 2024, 28, 71–85. [Google Scholar] [CrossRef]
- Keqi Luo, R. Fatigue Prediction Criteria for Rubber Antivibration Design with Temperature Effects. Int. J. Fatigue 2024, 183, 108271. [Google Scholar] [CrossRef]


| Type of Loading | Stress/Strain Magnitude | Timing | Principal Directions |
|---|---|---|---|
| Equi-biaxial | Equal stress/strain in two directions. | Simultaneous (no phase shift) | Constant, aligned with load axes. |
| Inequi-biaxial | Unequal stress/strain in two directions. | Simultaneous (no phase shift) | Constant, aligned with load axes. |
| In-phase | Any stress/strain ratio (equal or unequal). | Synchronized (no phase shift) | Constant throughout the cycle. |
| Out-of-phase | Any stress/strain ratio (equal or unequal). | Asynchronous (with phase shift) | Rotates during the cycle. |
| Proportional | Constant stress/strain ratio in all directions. | Either in-phase or out-of-phase | Constant throughout the cycle. |
| Non-proportional | Variable stress/strain ratio in all directions. | Either in-phase or out-of-phase | Rotates during the cycle. |
| Path Code | Number of Test Data | The Twist Range | Objective of the Designed Path |
|---|---|---|---|
| B | 14 | 6°~23.2° (θmax, Rθ = 0) | Path B and C are for crack closure effect. |
| C | 9 | ±5.4°~±15° (Rθ = −1) | |
| J | 2 | ±9°, −14.8°~14.6° (Rθ ≈ −1) | Path J, K, and M are for the effect of static axial load on rubber fatigue. |
| K | 2 | ±8°, ±12° (Rθ = −1) | |
| M | 4 | ±7°, ±7°, ±12°, ±15° (Rθ = −1) |
| Path Code | Number of Test Data | Global Loads | Description | |
|---|---|---|---|---|
| Displacement Peak δmax (mm) | Twist Peak θmax (°) | |||
| D | 16 | 0.76~5.01 (Rδ = 0) | 3~20 (Rθ = 0) | Proportional tension–torsion loading (Rδ = Rθ = 0), where paths D1 and D2 with different ratios of axial strain to shear strain (0.25 and 0.5, respectively) are used to identify the effect of proportional loading |
| E | 5 | 0.75~2.03 (Rδ = −1) | 3~8 (Rθ = −1) | Proportional tension–torsion loading (Rδ = Rθ = −1) |
| F | 3 | −1.51 (Rδ = ∞) | 12~20 (Rθ = 0) | Proportional compression-torsion loading |
| G | 3 | 2~3.58 (Rδ = 0) | 7~14 (Rθ = 0) | Non-proportional tension–torsion loading (phase angle φ = 45°) (Rδ = Rθ = 0) |
| H | 5 | 0.76~3.53 (Rδ = 0) | 3~14.1 (Rθ = 0) | Non-proportional tension–torsion loading (phase angle φ = 90°) (Rδ = Rθ = 0) |
| I | 4 | 0.76~3.53 (Rδ = 0) | 3~14.1 (Rθ = 0) | Non-proportional tension–torsion loading (phase angle φ = 180°) with maximum strain rotation (Rδ = Rθ = 0) |
| L | 5 | −0.76, −1.52 (Rδ = ∞) | 10~20 (Rθ = 0) | Non-proportional compression–torsion (phase angle φ = 180°) |
| N | 2 | 1.36, 3.13 (Rδ = 0) | 5.9, 13.6 (Rθ = 0) | Proportional tension–torsion loading (load control) (Rδ = Rθ = 0) |
| O | 2 | 1.33, 4.27 (Rδ = 0) | 5.4, 13.2 (Rθ = 0) | Non-proportional tension–torsion loading (load control) (Rδ = Rθ = 0) |
| Specimen and Formula for TE | Notched Specimen Shape and Loading | Illustrations [169] |
|---|---|---|
| Edge crack panel or single-edged notched tension (SENT) |  | Where is determined empirically and [170] or [171] are usually used. is the extension ratio; W is the SED as if there were no crack. The SED is not uniform within the specimen so it should be obtained via measured stress–strain data from another similar test on an uncut specimen or through finite element analysis. |
| Planar tension or pure shear specimen (PS) | 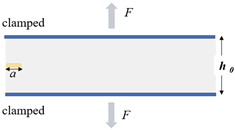 | Where h0 denotes undeformed height of the specimen and W is strain energy density as if there were no crack. |
| Trouser tear piece (ASTM D624-Type T) [172] |  | Where is the extension ratio; A0 is the cross-section area of an undeformed single leg; F is the external tensional load on the leg; and W denotes strain energy density. |
Disclaimer/Publisher’s Note: The statements, opinions and data contained in all publications are solely those of the individual author(s) and contributor(s) and not of MDPI and/or the editor(s). MDPI and/or the editor(s) disclaim responsibility for any injury to people or property resulting from any ideas, methods, instructions or products referred to in the content. |
© 2025 by the authors. Licensee MDPI, Basel, Switzerland. This article is an open access article distributed under the terms and conditions of the Creative Commons Attribution (CC BY) license (https://creativecommons.org/licenses/by/4.0/).
Share and Cite
Wang, X.; Sedaghati, R.; Rakheja, S.; Shangguan, W. Rubber Fatigue Revisited: A State-of-the-Art Review Expanding on Prior Works by Tee, Mars and Fatemi. Polymers 2025, 17, 918. https://doi.org/10.3390/polym17070918
Wang X, Sedaghati R, Rakheja S, Shangguan W. Rubber Fatigue Revisited: A State-of-the-Art Review Expanding on Prior Works by Tee, Mars and Fatemi. Polymers. 2025; 17(7):918. https://doi.org/10.3390/polym17070918
Chicago/Turabian StyleWang, Xiaoli, Ramin Sedaghati, Subhash Rakheja, and Wenbin Shangguan. 2025. "Rubber Fatigue Revisited: A State-of-the-Art Review Expanding on Prior Works by Tee, Mars and Fatemi" Polymers 17, no. 7: 918. https://doi.org/10.3390/polym17070918
APA StyleWang, X., Sedaghati, R., Rakheja, S., & Shangguan, W. (2025). Rubber Fatigue Revisited: A State-of-the-Art Review Expanding on Prior Works by Tee, Mars and Fatemi. Polymers, 17(7), 918. https://doi.org/10.3390/polym17070918