Using Light Scattering to Screen Polyelectrolytes (PEL) Performance in Flocculation
Abstract
: Flocculation of precipitated calcium carbonate (PCC) was monitored using light diffraction spectroscopy (LDS). Four cationic polyacrylamides of high molar mass and with different degrees of branching, all copolymers of acrylamide (AM) and acryloyloxyethyltrimethyl ammonium chloride (Q9), were tested. LDS supplied information about the kinetic curves for flocs growth and also for the flocs structure evolution. Flocculation kinetics, flocs size and structure, flocs resistance and reflocculation capacity could be correlated with the degree of branching of the polyelectrolytes (PEL). Furthermore, PEL with different degrees of branching corresponded to different values for the intrinsic viscosity, indicating differences in the polymer conformation, which explained well the performance differences in flocculation.1. Introduction
Polyelectrolytes (PEL) are widely used to achieve efficient solid-liquid separation in many industries [1-4]. In the case of papermaking, flocculation is the most important phenomena of the wet-end stage since it affects process efficiency (e.g., retention, drainage and runnability) and the quality of the final product (e.g., formation, strength and porosity) [5]. However, to control the flocculation process it is necessary to know and understand how chemical additives act during the whole process.
Various processes occur simultaneously during flocculation: adsorption of polymer molecules at the particles surface; re-arrangement (or re-conformation) of adsorbed polymeric chains; collisions between destabilized particles to form aggregates (flocs); and break-up of flocs [1-3]. The importance of each process depends on the flocculant characteristics, like chain architecture, molar mass, charge density; on the characteristics of the suspended particles, like size and surface charge; on the characteristics of the suspending medium, like pH, conductivity and ionic strength; and, finally, on the PEL concentration, contact time and turbulence intensity, among others [2,6,7].
The macromolecular characteristics of the polyelectrolyte determine the conformation when adsorbed on the particle surface and, therefore, the predominant flocculation mechanism [6]. In general, if molar mass is high and the charge density is low, the polymer adsorbs on the particle surface in such a way that tails and loops are extended far beyond the electric double layer of the particle and can interact with the polymer adsorbed on other particles—in this case the flocculation process is dominated by bridging bonds [3,7]. When the charge density is high, the bridging capability is reduced because there is a tendency for the polymer chains to adopt a flatter conformation on the particle surface, which results in the formation of cationic patches that attract the polymer free oppositely charged surfaces of other particles [7]. On the other hand, the introduction of branches in the polymer chain can alter the PEL conformation on the particle surface and, again, influence the aggregation mechanism. Studies have shown that the degree of branching of the polymer affects the flocculation kinetics and the aggregates properties [8].
The concentration of the flocculant is another key parameter, since the rate of adsorption depends on the amount of polymer per unit area of the particle surface and, thus, on the number of polymer molecules available in solution. Moreover, the flocculant concentration also affects the conformation rate: polymer re-arrangement is relatively fast at low surface concentration but rather slow on crowded surfaces since neighboring molecules interfere with the re-arrangement [3,9].
Another important feature is the flocs resistance and their reflocculation capacity. In fact, in many industrial processes, flocculated suspensions are subjected to high shear forces [10]. Under these shear conditions, the initial flocs are usually broken up but the suspension partially reflocculates when the shear forces decrease [11]. The stability of the flocs depends on the nature of the interaction between particles and on the floc density [12]. Reflocculation depends on the predominant flocculation mechanism [7,13]. The fundamental understanding of both the flocculation and reflocculation processes will greatly benefit the control and optimization of industrial processes.
The methods used to evaluate flocculation are numerous. Firstly, methods such as titration, zeta potential and turbidity measurements were used to determine the optimum flocculant dosage. Optimum flocculant dosage by titration and zeta potential determination is based on the DLVO theory which relates the optimum flocculant dosage to the zero zeta potential (“isoelectric point”). This theory is valid when flocculation occurs by charge neutralization but does not fit when medium or high molar mass polymers are used and the bridging or patching mechanisms dominate [6,14]. Consequently, the methods based on electrokinetic parameters or polyelectrolytes titration must be used with caution.
More recent studies have been focused on monitoring the complete flocculation process to evaluate flocculation kinetics and flocs structure. Recent studies have shown that laser diffraction spectroscopy (LDS) is a useful technique to monitor the dynamics of flocculation and to evaluate the influence of the flocculant characteristics and dosage [15]. LDS not only allows the determination of the aggregates mean size and size distribution, but gives also the mass fractal dimension of the flocs as a function of time [3,15-17]. Mass fractal dimension provides a mean of expressing the degree to which primary particles fill the space within the nominal volume occupied by an aggregate according to Equation 1: for solid non-porous particles dF = 3 and for porous particles 1 < dF < 3 [17].
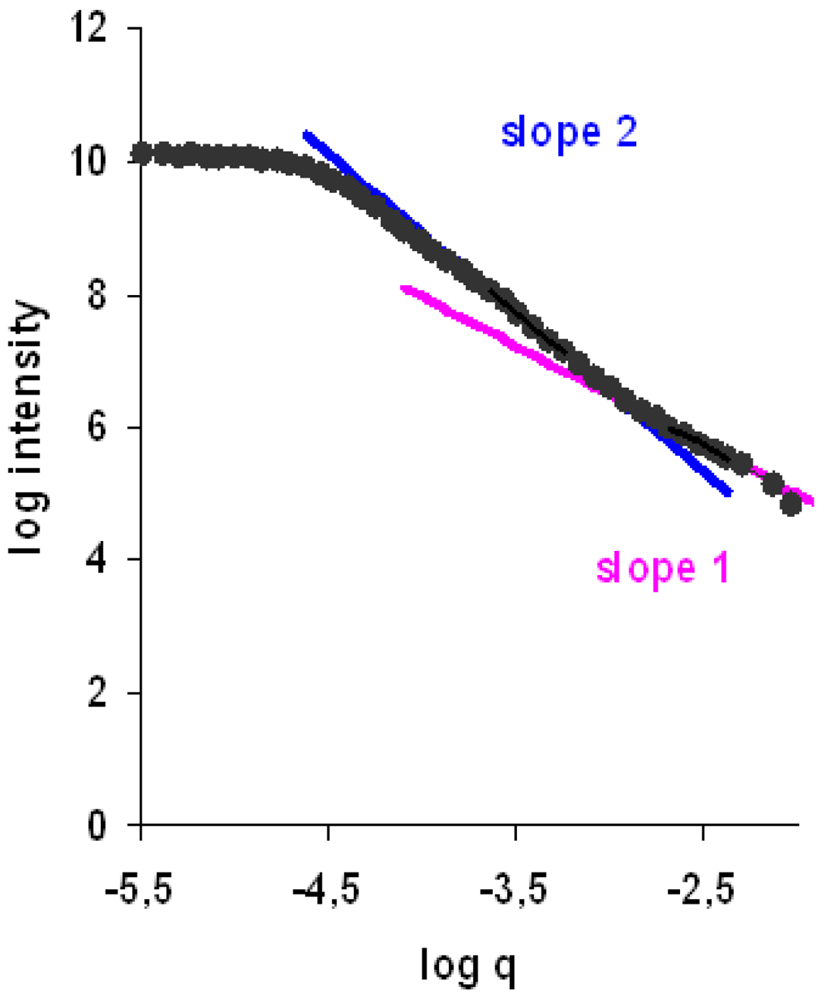
In addition, when aggregate restructuring occurs the aggregate structure is no longer fractal as restructuring takes place at large length scales. Information about the flocs structure must then be provided by the so called scattering exponent, SE, which is also obtained from the scattering pattern as shown in Figure 1 [17]. Biggs et al. [3] indicate that scattering patterns at small length scales refer to the light scattered from primary aggregates, whereas at large length scales they correspond to the light scattered from secondary aggregates that resulted from the aggregation of the primary ones. Rasteiro et al. [18] also demonstrated that LDS can be used to evaluate the deflocculation and reflocculation processes, when flocs are submitted to mechanical forces (sonication) or to hydrodynamic shearing.
In this study we will report how the LDS technique can be used to monitor the flocculation process of precipitated calcium carbonate (PCC) particles induced by cationic polyacrylamides of very high molar mass but with different chain architecture (degree of branching). The objective is to study the effect of the flocculant properties and concentration, on the flocculation kinetics, flocs resistance, reflocculation capacity and flocs structure. Moreover, the influence of the flocculant characteristics on the optimum flocculant dosage has been investigated. The above mentioned flocculation parameters, namely the flocculation kinetics, will be qualitatively correlated to the flocculant properties, in particular to their intrinsic viscosity (IV). The flocculants were selected having in mind their potential to be used in papermaking. The information obtained is of great importance to understand and predict the flocculation mechanism induced by polyelectrolytes, and thus, to optimize this process. LDS proved to be a convenient tool for the integrated evaluation of flocculant performance in a single test, under turbulent conditions [18].
2. Experimental
2.1. Materials
The flocculation tests were carried out on a commercial scalenohedral PCC suspension. The PCC suspension was prepared at 1% (w/w) in distilled water and, in order to obtain a good dispersion of the particles, the suspensions were first magnetically stirred for 20 minutes and then submitted to sonication at 50 kHz during 15 minutes. After this treatment, the median size of the particles was approximately 2.05 urn and the suspension pH 8.5. The zeta potential of the particles was −32 mV in distilled water.
Four cationic polyacrylamides (C-PAM) emulsions of very high molar mass with a cationic monomer content between 45 and 50 w/w%, all copolymers of acrylamide (AM) and acryloyloxyethyltrimethyl ammonium chloride (Q9), developed and supplied by AQUA+TECH [19-21], were used in this study. The main characteristics of the polyelectrolytes are summarized in Table 1. Flocculant solutions were prepared with distilled water at 0.1% (w/w). The diluted solutions were prepared every day. The synthesis was further described in detail in [22].
2.2. Methodology
PCC flocculation was monitored by measuring the aggregate size using light diffraction spectroscopy (LDS) in a Malvern Masterziser 2000 (Malvern Instruments). The PCC suspension was added to 700 mL of distilled water in the equipment dispersion unit until a certain, fixed level of obscuration was obtained corresponding to an average PCC concentration of 0.05% (w/w). The tests were carried out setting the pump speed to 1,400 rpm, corresponding to an average shear rate of 312 s−1 in the flow tubes. Obscuration was always kept above 5% to assure a good signal quality [15]. As obscuration decreases pronouncedly during the flocculation test due to floc growth, the tests have to be initiated with a higher obscuration than usually to guarantee that, at the end of flocculation, obscuration was always higher than 5%.
Flocculants were tested for a range of concentrations close to the optimum dosage, which is defined as the PEL dosage leading to larger flocs and fastest kinetics. The interval of concentrations containing the optimum was previously determined following the methodology developed by Blanco et al. [7].
To determine the flocculation kinetics curve, a predetermined amount of flocculant was added at once to the suspension and the floc size distribution was measured every minute during 14 minutes, i.e., until the floc size stabilized. The particle size distribution of the PCC was measured before adding the flocculant to the suspension. In this study three concentrations have been tested for each PEL: the optimum flocculant dosage and two other concentrations one above (excess PEL) and another one below the optimum (PEL shortage). Sometimes the optimum dosage determined by LDS is slightly different from the one determined using Blanco et al. methodology, because, in this case, the PEL is progressively added to the suspension. The optimum flocculant dosages experimentally obtained for each polymer are also summarized in Table 1.
The reported values of the median particle size (dp50) represent an average of at least four replications. Simultaneously, the values of the floc average diameter (weight average d4,3) can also be obtained, and the kinetic curves can be presented either in terms of the evolution of the median floc size with time or in terms of the evolution with time of the average floc size.
The flocs resistance was evaluated by submitting the flocs to sonication at 20 kHz during 30 seconds. This mechanical shear force was directly applied to the suspension in the LDS dispersion unit, after the flocculation stage. This test supplies information about the flocs resistance to breakage. After the shearing tests, the shear force was restored to the initial value to allow for the reflocculation process to take place, which was then monitored during 5 minutes.
The mass fractal dimension of the flocs during the flocculation process was also computed from the scattering pattern used to determine the particles size. The individual particles could be considered to follow the Rayleigh-Gans-Debye approximation [17]. Additionally, since secondary aggregates resulting from the aggregation of primary aggregates can be formed, the scattering exponent, SE, [17], corresponding to the larger particles, was also computed from the scattering pattern, as a function of time. Thus, the kinetics of the flocs structure evolution could be computed off-line, through the mathematical processing of the scattering matrix.
3. Results and Discussion
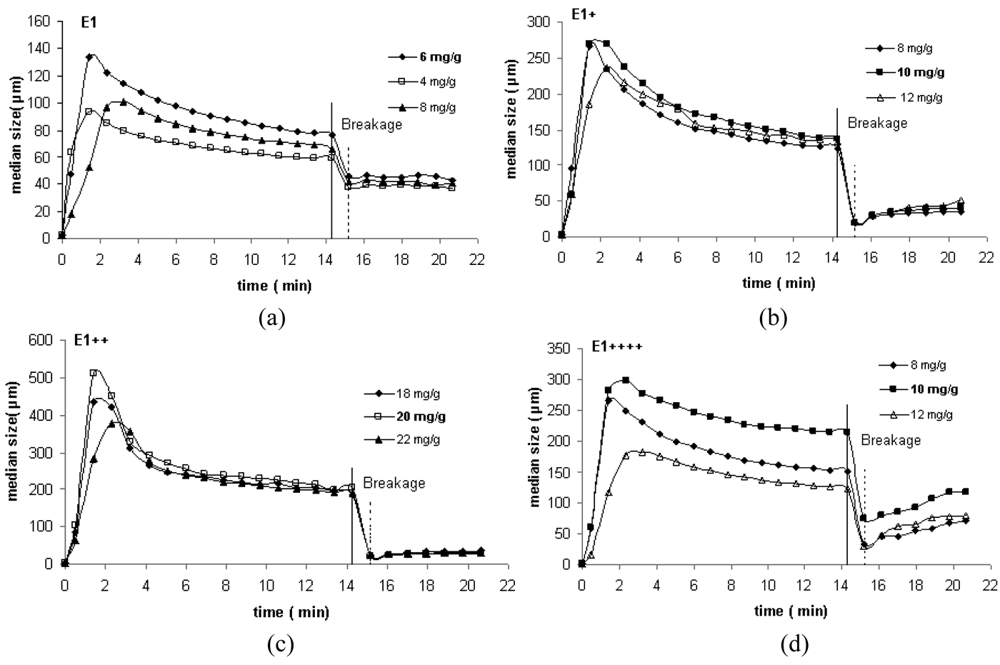
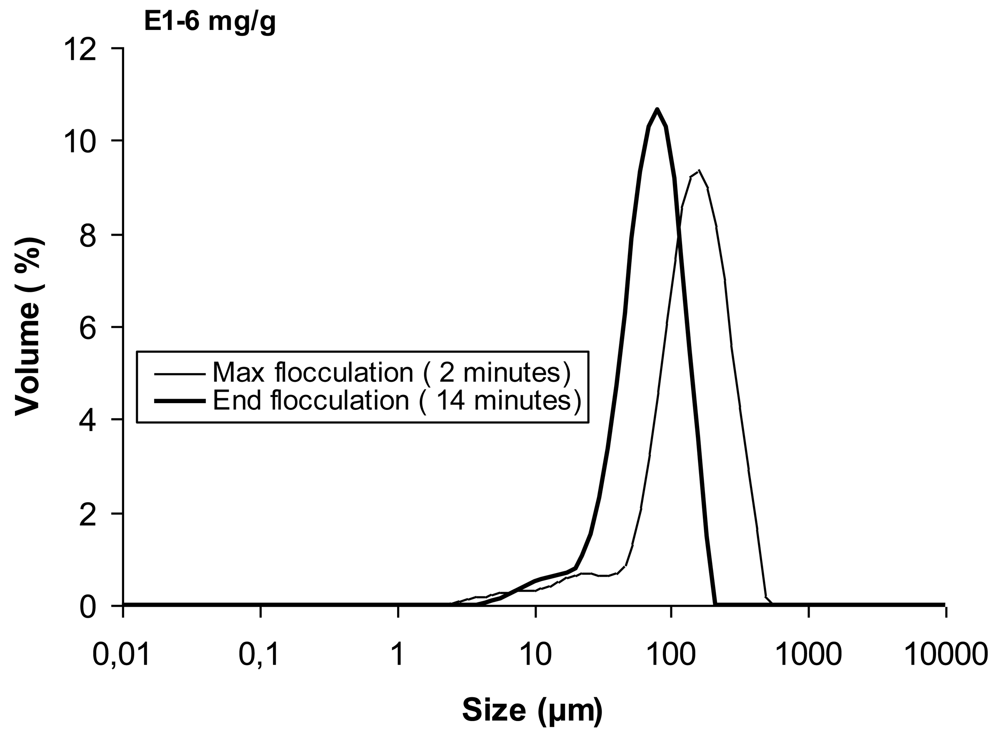
In Figure 2 the kinetic curves obtained by LDS for the four polymers studied (three concentrations for each PEL) are presented. The curves shown in that figure are expressed in terms of the evolution with time of the median floc size, taken from the size distribution for each instant. Figure 3 presents an example of the size distribution of the flocs obtained with the linear polymer E1, for two different instants.
In a previous paper [23] the authors have shown that the median of the size distribution obtained by LDS, for each instant, is similar to the value obtained by optical microscopy coupled with image analysis, if a large enough number of flocs (above one hundred) is evaluated by microscopy.
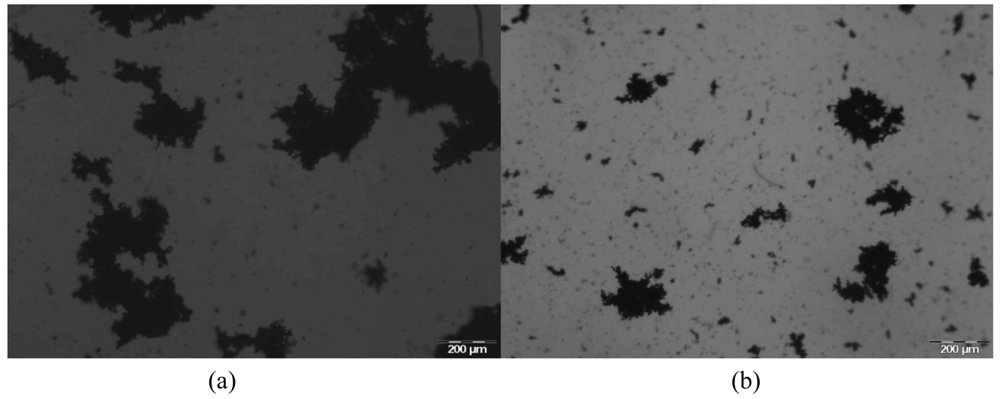
Figure 4 gives an example of images of the aggregates obtained with E1 for two different moments: for the maximum in the flocculation kinetics curve (Figure 4(a)) and after floc stabilization (Figure 4(b)). It is obvious that the flocs size decreases from the maximum in the kinetic curve to the end of the flocculation process, when floc stabilization is reached.
From Figure 2 it is obvious that the degree of branching influences both the floc size and the flocculation kinetics. For the linear polymer, smaller flocs are obtained and, simultaneously, flocs reorganization is less pronounced. When branching is introduced in the polymer chain, the floc size increases and flocs restructuring becomes more apparent (see Figure 2(b–d)). However, for the polymer with the highest degree of branching, the floc size decreases again and reorganization during the second stage of flocculation becomes, less pronounced. Apparently, there seems to be an optimal degree of branching leading to the largest flocs, if the molar mass is kept constant. For the polymer architectures tested in this study this happened for E1++.
Regarding the optimum concentration (see Table 1) the influence of the degree of branching of the polymer on this parameter is also evident. The optimum concentration which, obviously, has to be dependent on the PEL architecture, increases as branching increases up to 2 (corresponding also to the larger flocs) and decreases after that for the polymer E1++++. This behavior must be, on the whole, related to the polymer conformation on the particle surface. The polymer with a higher degree of branching adopts a more coiled conformation thus producing smaller flocs. Moreover, a lower PEL dosage is required, in this case, to cover the surface of the particles, than when the polymer adopts a more extended and protruding conformation.
3.1. Flocculation Kinetics
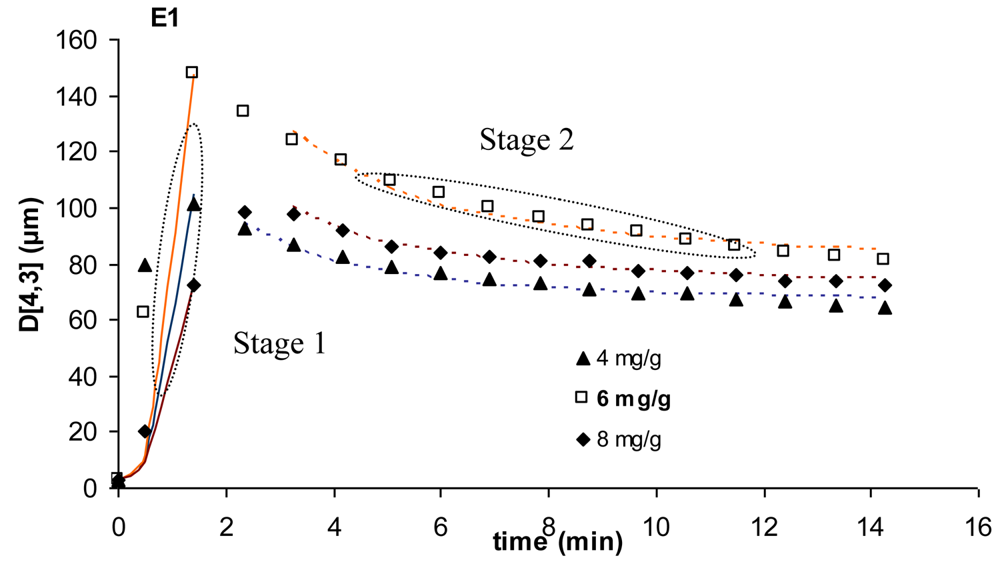
For all the kinetic curves obtained experimentally, it was possible to identify two different stages in the flocculation process, as shown in Figure 5. A first stage dominated by particle aggregation, which can be described by Equation 2, and a second stage where breakage starts playing a role, enabling polymer reconformation on the particle surface and aggregate restructuring, which is described by Equation 3. During the second stage, breakage and re-aggregation eventually balance out and the aggregates reach a stable size and structure. In these equations, A is a pre-exponential factor (μm), t is time (min) and k1 and k2 are the kinetic constants. The kinetic equations are written in terms of d4,3 because, by doing so, it is easier to relate the growth of the aggregates with the decrease of the number of particles in the system, as is often done when describing flocculation kinetics [7].
Figure 5 shows an example of the fitting of Equations 2 and 3 to the kinetic curves obtained for the flocculation with E1.
In Table 2 the values of the kinetic constants for the two stages, k1 and k2, respectively, for the four PELs studied, are summarized.
The first stage of aggregation is faster with the branched polymers (larger k1) decreasing slightly for the polymer E1++++. This behavior must be related with the more compact conformation of the branched PELs, explaining also the larger concentrations required for those polymers, as referred to previously, which call for a larger amount for surface coverage. This agrees with the lower intrinsic viscosity of the branched PELs.
Moreover, for the optimum PEL concentration for each polymer (highlighted in grey in Table 2) flocculation, during the first stage, is always faster (larger k1).
Regarding the second stage of flocculation, rearrangement of the aggregates is more difficult for the linear polymer (higher k2), due to its more extended conformation which favors a crowding effect, that is the polymer chains have less free space to reconform. For E1++++, k2 increases slightly. The effect of PEL concentration on the kinetics of the second stage of flocculation is not as evident as in the case of the first stage.
3.2. Structure of the Flocs
Figure 6 shows the evolution of the flocs structure, fractal dimension dF and scattering exponent SE, with time, for all the flocculants studied and for the various concentrations tested for each PEL.
As discussed earlier, the scattering exponent reflects the structure of the secondary aggregates while the fractal coefficient is related to the primary aggregates structure. The influence of the polymer concentration on the values of dF is negligible. However, as far as the secondary aggregates are concerned, in general, higher PEL concentration leads to more porous aggregates, that have lower values of SE. Another important feature about the secondary aggregates is that, for all the polymers tested, they become more compact as time elapses, reaching a stable compactness at the end of flocculation. It is also apparent that the flocs obtained with the linear PEL (E1) are more compact than the ones obtained with the branched polymers, more so when the secondary aggregates are considered. This difference is more obvious if one looks at the first stages of flocculation (up to two minutes). In general, when flocculation is slower, flocs reach a more compact structure earlier because the polymer chains have got more time to reach a stable conformation on the particle surface. Regarding the primary aggregates, the opposite tendency is observed, these aggregates being initially more compact (larger dF) when branched polymers are used, due to the more coiled conformation of these polymers.
In fact, for a fixed type of particles, PEL concentration and process conditions, two other factors can be identified which influence the aggregates structure: the polymer structure and the flocculation rate. The structure of the primary aggregates strongly depends on the macromolecular characteristics of the polymer and on its conformation in solution. A more dense conformation of the polymer chain must lead to more compact aggregates. This is the case with the branched polymers. On the other hand, the arrangement of the secondary aggregates strongly depends on the rate of flocculation: a very fast aggregation during the first stage of flocculation leads to less structured aggregates which, only at a later stage, after breakage and re-aggregation, reach a more compact structure. Thus, the branched PELs, that achieve faster flocculation kinetics (first stage), give rise to more open secondary aggregates, mainly during the first moments of flocculation.
At the end of the flocculation process, when stabilization is reached, there is not much difference between the flocs structure obtained with the different PELs, namely considering the primary aggregates (see the graphs in Figure 6). It can be observed, however, that the secondary aggregates obtained with the linear PEL are slightly more compact (larger SE). This is closely related with the flocs size. Usually, smaller flocs are also more compact.
3.3. Flocs Resistance and Refloculation Ability
Sonication is applied to the aggregates to evaluate flocs resistance to high shearing. When the flocs are submitted to sonication their size decreases rapidly as shown in Figure 2. Breakage of flocs indicates that the polymer chains detach from the particle surfaces resulting in rupture of bonds between the particles in the aggregate.
The break-up of the flocs is summarized in Table 3 for the four polymers studied. The percentage of flocs break-up was calculated as the ratio of the difference between the initial and final floc size after shearing and the size of the flocs at the end of flocculation. In Table 3, the values of the refloculation percentage, calculated as the ratio of the difference between the flocs size five minutes after breakage and just after breakage and the value of flocs size before breakage, are also given.
The results show that, in general, when the polymer is in excess, the flocs break up decreases, confirming that flocs strength can increase if the polymer dosage is higher than the optimum one [14]. Size seems to be the factor that most affects the resistance to breakage, since the main difference between the flocs produced with the different polymers, at the end of flocculation, is the floc size. As a consequence, when the floc size increases, flocs strength decreases. Thus, breakage is less pronounced in the case of the flocs produced with E1, while the less resistant flocs are produced with E1++ (larger flocs). Moreover, it is obvious, both from Table 3 and from the graphs in Figure 2, that reflocculation was very low for all PELs. The linear PEL (E1) exhibits the lowest reflocculation ability, while the highly branched PEL has the highest reflocculation capacity.
If the flocs are formed by bridging, the break up of the flocs can lead to polymer degradation and the reflocculation process becomes more difficult [10,14]. As described in the literature, the covalent polymer bonds are not able to reform, and, moreover, the polymer chains at the particle surface reconform, increasing coverage of the surface and inhibiting reflocculation with fresh polymer [10,14]. For the range of high molar mass polymers studied, this is altogether more obvious in the case of the linear polymer due to its extended conformation on the particle surface which favors the bridging mechanism, whereas with E1++++ the bridging and patching mechanisms may coexist which can justify the increase of the reflocculation ability. Regarding the influence of the PEL concentration, in general, reflocculation increases as the concentration increases. Excess of polymer, which has not previously been degraded due to bond rupture, favors reflocculation.
4. Conclusions
The results highlight the advantages of using LDS to monitor flocculation processes. It was possible to obtain, in a single test, information on the evolution with time of the flocs dimensions and structure, as well as the evaluation of the flocs resistance and flocculation kinetics, in a turbulent environment.
The methodology used enables assessment of the influence of the polyelectrolyte structure on the flocculation kinetics, flocs size and structure and also on the flocs resistance to breakage and on the reflocculation capacity. The kinetic curves for both the aggregates size and structure are influenced by the PEL configuration. The branched PELs yield kinetic curves exhibiting a high degree of aggregates rearrangement (second stage of flocculation). Simultaneously, the structure of the aggregates evolves more slowly to a stable and more compact arrangement.
It has been proved that branched polymers yield faster kinetics and larger and more open flocs which are, on the other hand, less resistant to shearing, though exhibiting a higher reflocculation ability. This behavior can be explained in terms of the more coiled conformation of the branched polymers, consistent with the lower intrinsic viscosity exhibited by the branched PELs. It could be observed that the floc size reached a maximum when moderately branched polymers, such as E1++, were used.

| Alpine Floc™ | Intrinsic viscosity —IVa (mL/g) | Cationic content (w/w%) | Level of branchingb | Optimum dosage (mg PEL/g PCC) |
|---|---|---|---|---|
| E1 | 2,308 | 45.5 | Linear | 6 |
| E1+ | 1,817 | 48.8 | 1 | 10 |
| E1++ | 1,771 | 46.6 | 2 | 20 |
| E1++++ | 1,775 | 42.8 | 4 | 10 |
aSchulz-Blaschke in 0.05 M NaCl;bthe numbers refer to the equivalent of crosslinker added during the synthesis [22].
| Alpine Floc™ | Dosage (mg/g) | k1 | k2 |
|---|---|---|---|
| E1 | 4 | 2.53 | 1.0 |
| 6 | 2.76 | 1.0 | |
| 8 | 2.24 | 1.49 | |
| E1+ | 8 | 3.16 | 0.38 |
| 10 | 3.33 | 0.40 | |
| 12 | 3.09 | 0.40 | |
| E1++ | 18 | 3.64 | 0.50 |
| 20 | 3.86 | 0.54 | |
| 22 | 3.52 | 0.54 | |
| E1++++ | 8 | 3.20 | 0.49 |
| 10 | 3.50 | 0.79 | |
| 12 | 2.53 | 0.80 |
| Alpine Floc™ | Dosage (mg/g) | Break up (%) | Refloculation (%) |
| E1 | 4 | 36 | 0 |
| 6 | 40 | 0 | |
| 8 | 36 | 0 | |
| E1+ | 8 | 84 | 13 |
| 10 | 85 | 15 | |
| 12 | 85 | 23 | |
| E1++ | 18 | 87 | 7 |
| 20 | 90 | 3 | |
| 22 | 87 | 4 | |
| E1++++ | 8 | 78 | 24 |
| 10 | 65 | 20 | |
| 12 | 75 | 40 |
agrey lines refer to the optimum flocculant dosage.
Acknowledgments
The authors thank COMPETE—“Programa Operacional de Factores de Competitividade” FEDER—“Fundo Europeu de Desenvolvimento Regional” and FCT (Fundação para a Ciência e Tecnologia, Portugal) for the financial support, contract PTDC/EQU-EQU/66669/2006, AQUA+TECH Specialties SA (La Plaine, Geneve, Switzerland) for supplying the flocculants samples, OMYA for supplying the PCC samples and C. Wandrey from EPFL, Switzerland, for characterizing the PELs.
References
- Gregory, J. The action of polymeric flocculants in flocculation, sedimentation and consolidation. Proceedings of the Engineering Foundation Conference 1985, Sea Island, GA, USA, 27 January–1 February 1985; Moudgil, B.M., Somasundaran, P., Eds.; pp. 125–137.
- Berlin, A.A.; Kislenko, V.N. Kinetic model of suspension flocculation by polymers. Colloids Surf. 1995, 104, 67–72. [Google Scholar]
- Biggs, S.; Habgood, M.; Jameson, G.J.; Yan, Y.-D. Aggregate structures formed via a bridging flocculation mechanism. Chem. Eng J. 2000, 80, 13–22. [Google Scholar]
- Heath, A.R.; Parisa, A.B.; Fawell, P.D.; Farrow, J.B. Polymer flocculation of calcite: Relating the aggregate size to the settling rate. AIChE J. 2006, 52, 1987–1993. [Google Scholar]
- Eklund, D.; Lindström, T. Paper Chemistry: An Introduction; DT Paper Science Publication: Grankulla, Finland, 1991. [Google Scholar]
- Bremmell, K.E.; Jameson, G.J.; Biggs, S. Kinetic Polyelectrolyte adsorption at the solid/liquid interface interaction forces and stability. Colloids Surf. 1998, 139, 199–211. [Google Scholar]
- Blanco, A.; Fuente, E.; Negro, C.; Tijero, J. Flocculation monitoring: Focused beam reflectance measurement as a measurement tool. Can. J. Chem. Eng. 2002, 80, 734–740. [Google Scholar]
- Antunes, E.; Garcia, F.A.P.; Ferreira, P.; Blanco, A.; Negro, C.; Rasteiro, M.G. Effect of water cationic content on flocculation, flocs resistance and reflocculation capacity of PCC induced by polyelectrolytes. Ind. Eng. Chem. Res. 2008, 47, 6006–6013. [Google Scholar]
- van de Ven, T.G.M.; Alince, B. Heteroflocculation by asymmetric polymer bridging. J. Colloid Interface Sci. 1996, 181, 73–78. [Google Scholar]
- Norell, M.; Johansson, K.; Persson, M. Retention and drainage. In Papermaking Science and Technology, Book 4: Papermaking Chemistry; Neimo, L., Ed.; Tappi Press: Jyväskylä, Finland, 1999. [Google Scholar]
- Yoon, S.; Deng, Y. Flocculation and reflocculation of clay suspension by different polymer systems under turbulent conditions. J. Colloid Interface Sci. 2004, 278, 139–145. [Google Scholar]
- Tang, S.; Ma, Y.; Shiu, C. Modelling the mechanical strength of fractal aggregates. Colloids Surf. 2001, 180, 7–16. [Google Scholar]
- Spicer, P.T.; Pratsinis, S.; Raper, J.; Amal, R.; Bushell, G.; Meesters, G. Effect of shear schedule on particle size, density, and structure during flocculation in stirred tanks. Powder Technol. 1998, 97, 26–34. [Google Scholar]
- Blanco, A.; Negro, C.; Fuente, E.; Tijero, J. Effect of shearing forces and flocculant overdose on filler flocculation mechanisms and flocs properties. Ind. Eng. Chem. Res. 2005, 44, 9105–9112. [Google Scholar]
- Rasteiro, M.G.; Garcia, F.A.P.; del Mar Peréz, M. Applying LDS to monitor flocculation in papermaking. Particulate Sci. Technol. 2007, 25, 303–308. [Google Scholar]
- Bushell, G. Forward light scattering to characterise structure of flocs composed of large particles. Chem. Eng. J. 2005, 111, 145–149. [Google Scholar]
- Liao, J.Y.H.; Selomulya, C.; Bushell, G.; Bickert, G.; Amal, R. On different approaches to estimate the mass fractal dimension of coal aggregates. Part. Part. Syst. Charact. 2005, 22, 299–309. [Google Scholar]
- Rasteiro, M.G.; Garcia, F.A.P.; Ferreira, P.; Blanco, A.; Negro, C.; Antunes, E. Evaluation of flocs resistance and reflocculation capacity using the LDS technique. Powder Technol. 2008, 183, 231–238. [Google Scholar]
- Hernandez Barajas, J.; Wandrey, C.; Hunkeler, D.J. Polymer Flocculants with Improved Dewatering Characteristics. U.S. Patent 6,667,374 B1, 12 March 2003. [Google Scholar]
- Hernandez Barajas, J.; Wandrey, C.; Hunkeler, D.J. Polymer Flocculants with Improved Dewatering Characteristics. U.S. Patent 6,617,402 B2, 9 September 2003. [Google Scholar]
- Hernandez Barajas, J.; Wandrey, C.; Hunkeler, D.J. Polymer Flocculants with Improved Dewatering Characteristics. U.S. Patent 6,294,622 B1, 25 September 2001. [Google Scholar]
- Rasteiro, M.G.; Garcia, F.A.P.; Ferreira, P.; Antunes, E.; Hunkeler, D.; Wandrey, C. Flocculation by cationic polyelectrolytes: Relating eficiency with polyelectrolyte characteristics. J. Appl. Polym. Sci. 2010, 116, 3603–3612. [Google Scholar]
- Rasteiro, M.G.; Garcia, F.A.P.; Ferreira, P.; Blanco, A.; Negro, C.; Antunes, E. The use of LDS as a tool to evaluate flocculation mechanisms. Chem. Eng. Process. 2008, 47, 1329–1338. [Google Scholar]
© 2011 by the authors; licensee MDPI, Basel, Switzerland. This article is an open access article distributed under the terms and conditions of the Creative Commons Attribution license (http://creativecommons.org/licenses/by/3.0/).
Share and Cite
Rasteiro, M.G.; Pinheiro, I.; Garcia, F.A.P.; Ferreira, P.; Hunkeler, D. Using Light Scattering to Screen Polyelectrolytes (PEL) Performance in Flocculation. Polymers 2011, 3, 915-927. https://doi.org/10.3390/polym3020915
Rasteiro MG, Pinheiro I, Garcia FAP, Ferreira P, Hunkeler D. Using Light Scattering to Screen Polyelectrolytes (PEL) Performance in Flocculation. Polymers. 2011; 3(2):915-927. https://doi.org/10.3390/polym3020915
Chicago/Turabian StyleRasteiro, Maria G., Ineide Pinheiro, Fernando A. P. Garcia, Paulo Ferreira, and David Hunkeler. 2011. "Using Light Scattering to Screen Polyelectrolytes (PEL) Performance in Flocculation" Polymers 3, no. 2: 915-927. https://doi.org/10.3390/polym3020915
APA StyleRasteiro, M. G., Pinheiro, I., Garcia, F. A. P., Ferreira, P., & Hunkeler, D. (2011). Using Light Scattering to Screen Polyelectrolytes (PEL) Performance in Flocculation. Polymers, 3(2), 915-927. https://doi.org/10.3390/polym3020915


