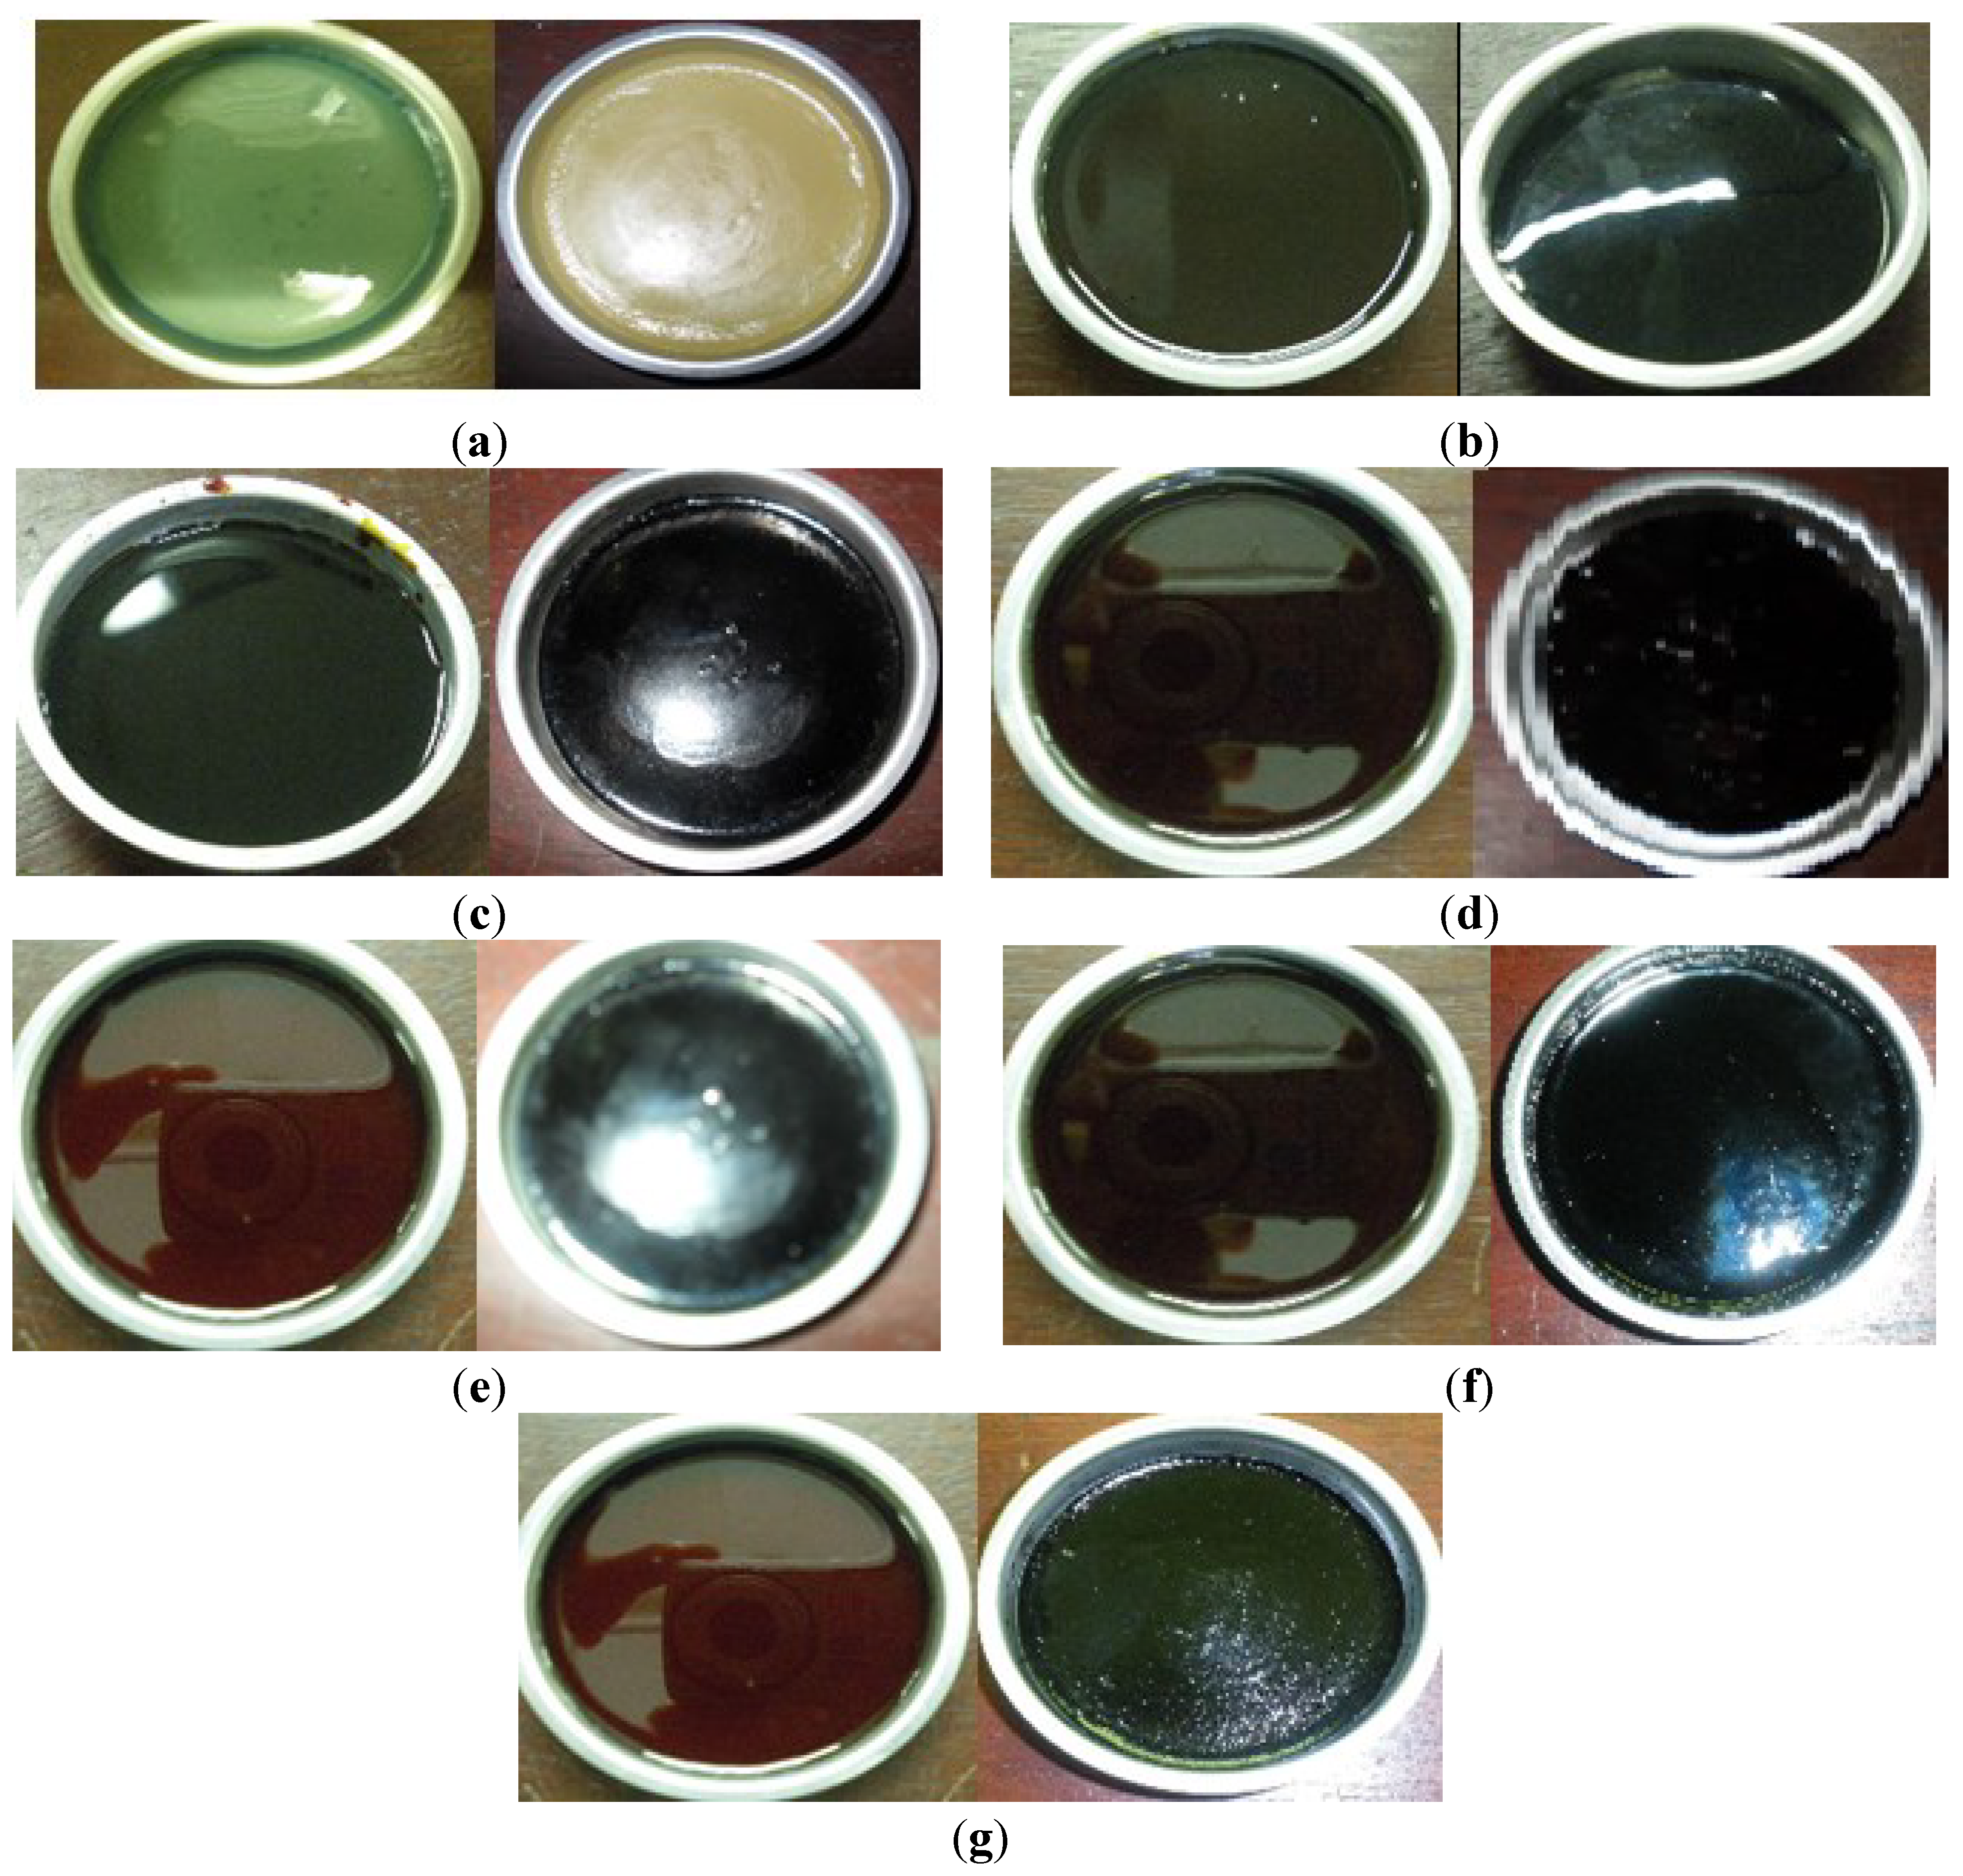
3.1. Physical Appearances of Cured Resins and Resin Blends
Digital images of uncured, optimally cured and postcured samples of resins and resin blends are shown in
Figure 1a–g, with the image on the left in each pair being of the uncured sample, and that on the right being of the cured and postcured sample.
All three pure resins cured to produce plaques of homogeneous appearance and with smooth, glossy surfaces. In the case of FL and FB, as can be seen from the photographs, there was considerable darkening on curing suggesting that some conjugated unsaturation arises during curing.
Figure 1.
Digital images of uncured and cured samples of (a) UP; (b) FL; (c) FB; (d) 50/50 UP/FL; (e) 70/30 UP/FL; (f) 50/50 UP/FB and (g) 70/30 UP/FB.
Figure 1.
Digital images of uncured and cured samples of (a) UP; (b) FL; (c) FB; (d) 50/50 UP/FL; (e) 70/30 UP/FL; (f) 50/50 UP/FB and (g) 70/30 UP/FB.
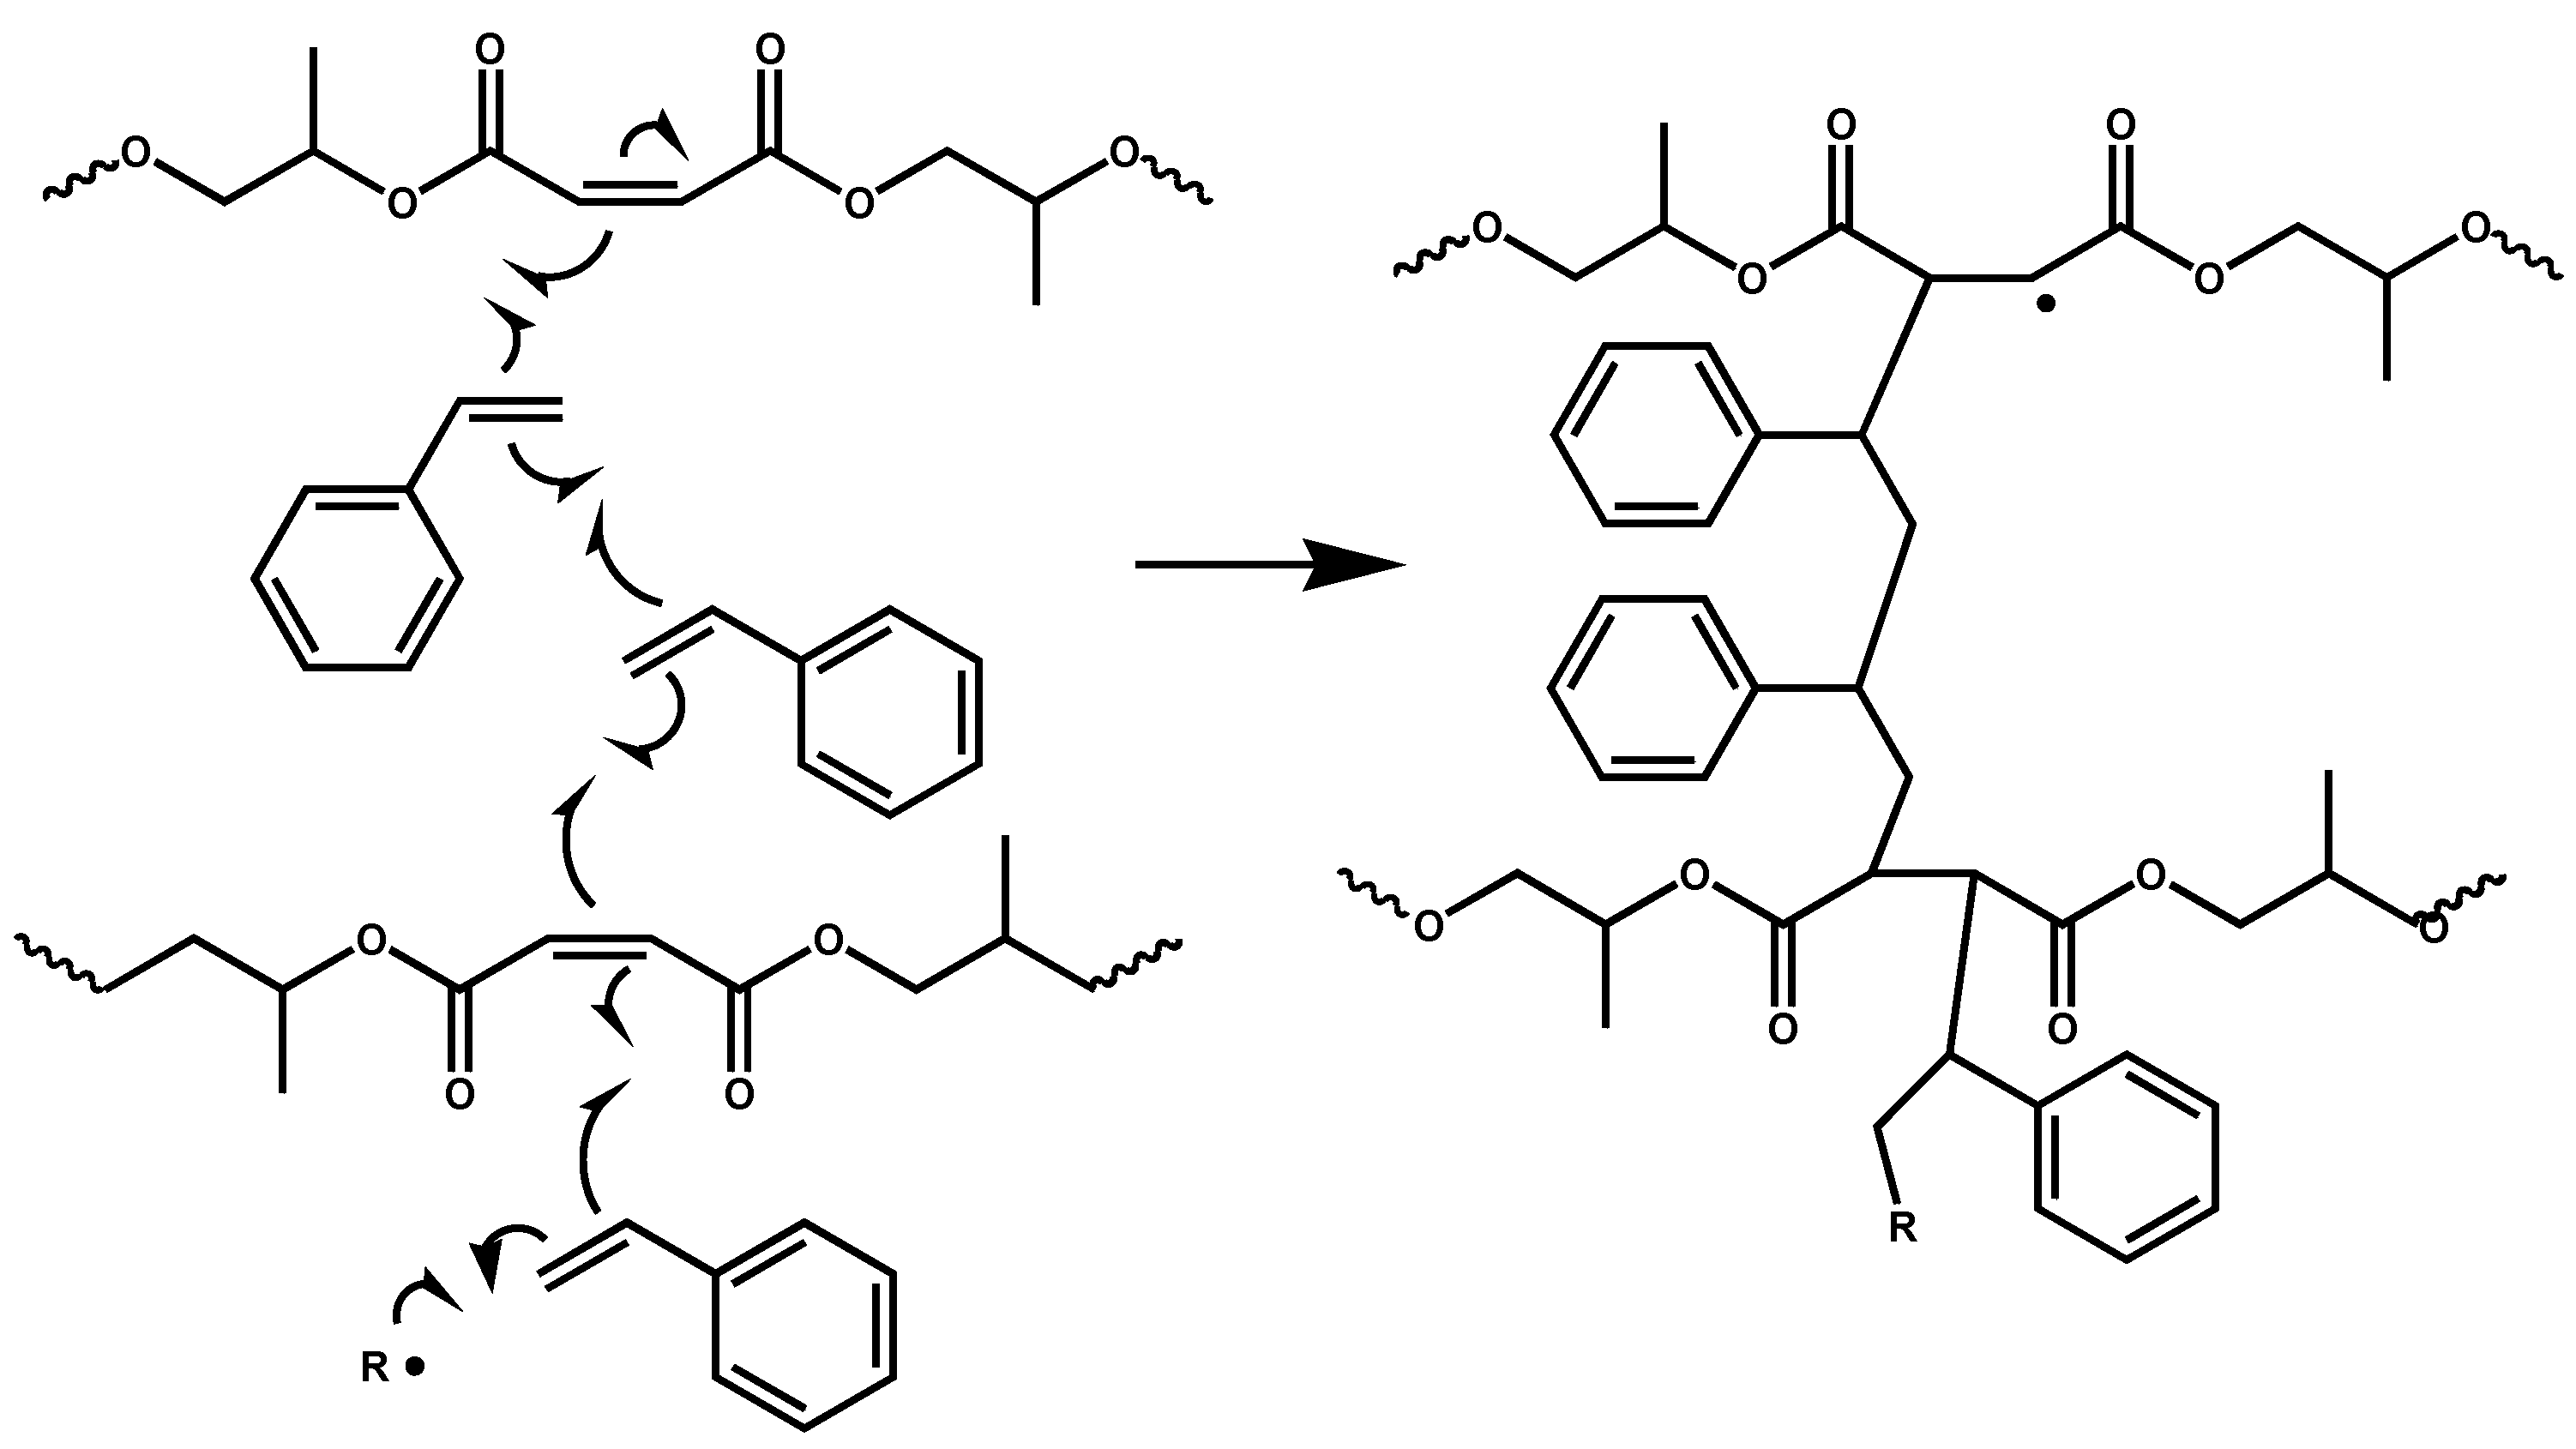
The crosslinking mechanism of UP with styrene is well understood and involves copolymerization of styrene with the multiple maleate C=C double bonds in the unsaturated polyester chains [
20]. Hydrolysis of the crosslinked structure to break the polyester chains of a typical unsaturated polyester and release the oligostyrene crosslinks, separation of these fragments by size exclusion chromatography and characterization of them by Carbon-13 NMR spectroscopy have shown that the lengths of the styrene crosslinking sequences typically range from one to three units, depending on the styrene to unsaturated polyester ratio, assuming that short crosslinks are formed early in the crosslinking process when the system is reasonably mobile and longer crosslinks when the system has become more viscous (
i.e., later in the crosslinking process, when the mobility of the polyester chains is much reduced) [
21]. The crosslinking of an unsaturated polyester with styrene is illustrated in
Scheme 1.
Scheme 1.
An early stage in the crosslinking of an unsaturated polyester (UP), based on the condensation of maleic anhydride and phthalic anhydride with propylene glycol, via a free-radical chain reaction of the maleate double bonds in the UP with styrene. R• represents a primary radical arising from the decomposition of the free-radical initiator (in this work, MEK peroxide). Note that phthalate units are not involved in the crosslinking reaction and therefore are not shown in the interests of clarity.
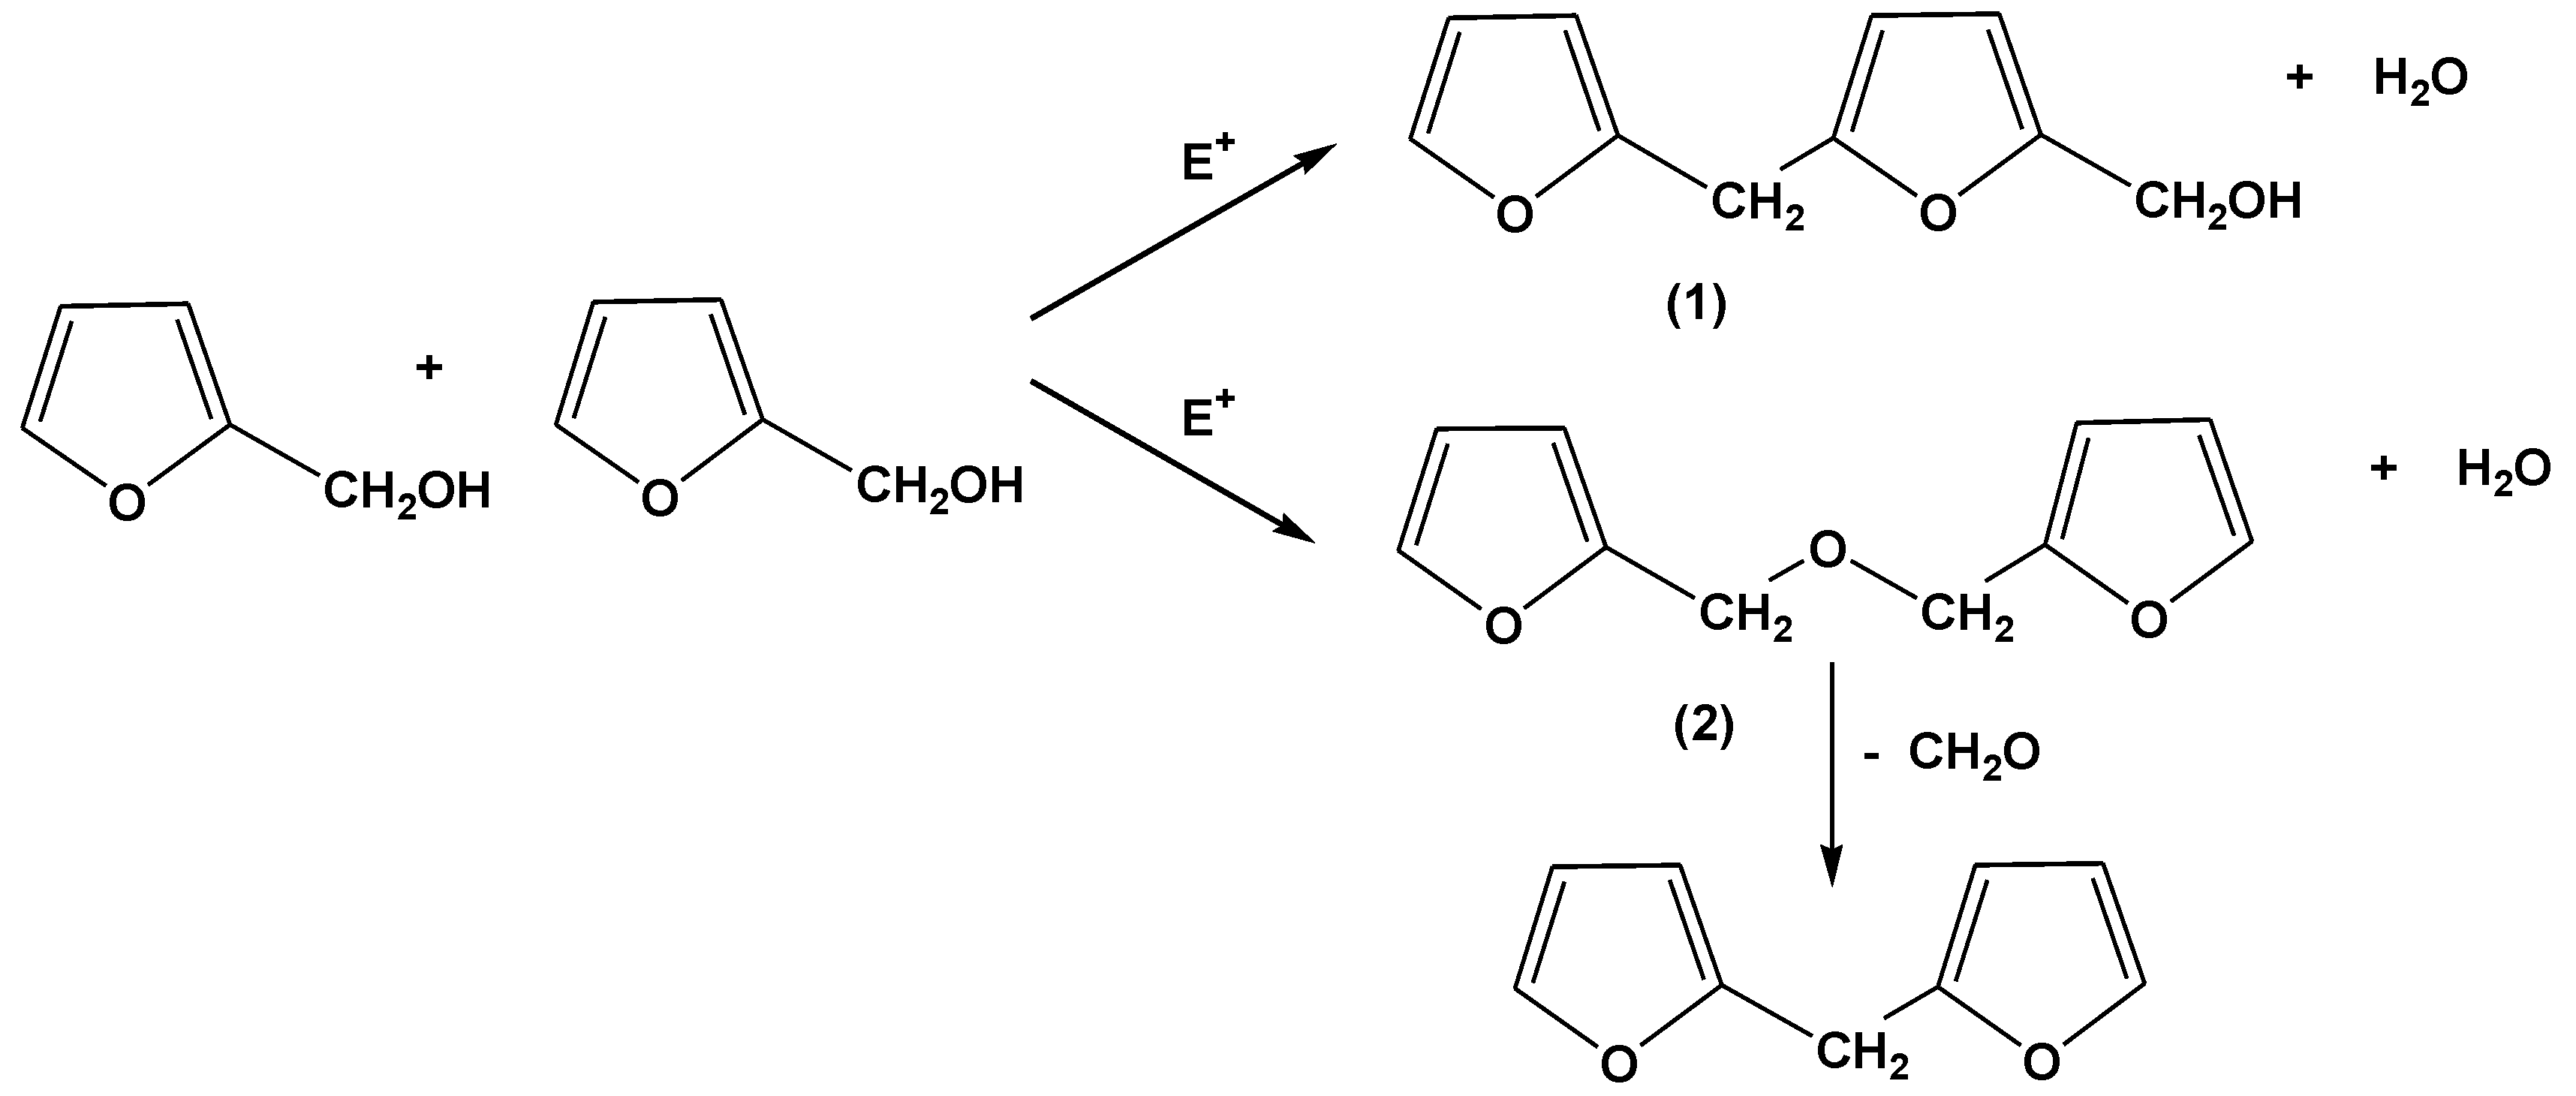
It is generally accepted that the principal reactions involved in the acid-catalyzed polymerization of furfuryl alcohol (and by analogy the acid-catalyzed chain extension of –CH
2OH ended furfuryl alcohol oligomers) are those originally proposed by Dunlop and Peters [
22], namely reaction of methylol groups with the C5 carbon of a neighbouring furfuryl alcohol moiety (Reaction (1) in
Scheme 2) to produce methylene linked species, plus mutual reaction of methylol groups to produce methylene ether links (Reaction (2) in
Scheme 2), in both cases with the elimination of water. Methylene ether linkages are not particularly stable, but decompose with the elimination of formaldehyde to produce methylene links, especially at the high temperatures employed in our curing of FL and FB based resins (see also
Scheme 2).
Scheme 2.
Reactions proposed for the polymerization and chain extension of furfuryl alcohol resins in the presence of acids and other electrophiles (adapted from [
22]).
Scheme 2.
Reactions proposed for the polymerization and chain extension of furfuryl alcohol resins in the presence of acids and other electrophiles (adapted from [
22]).
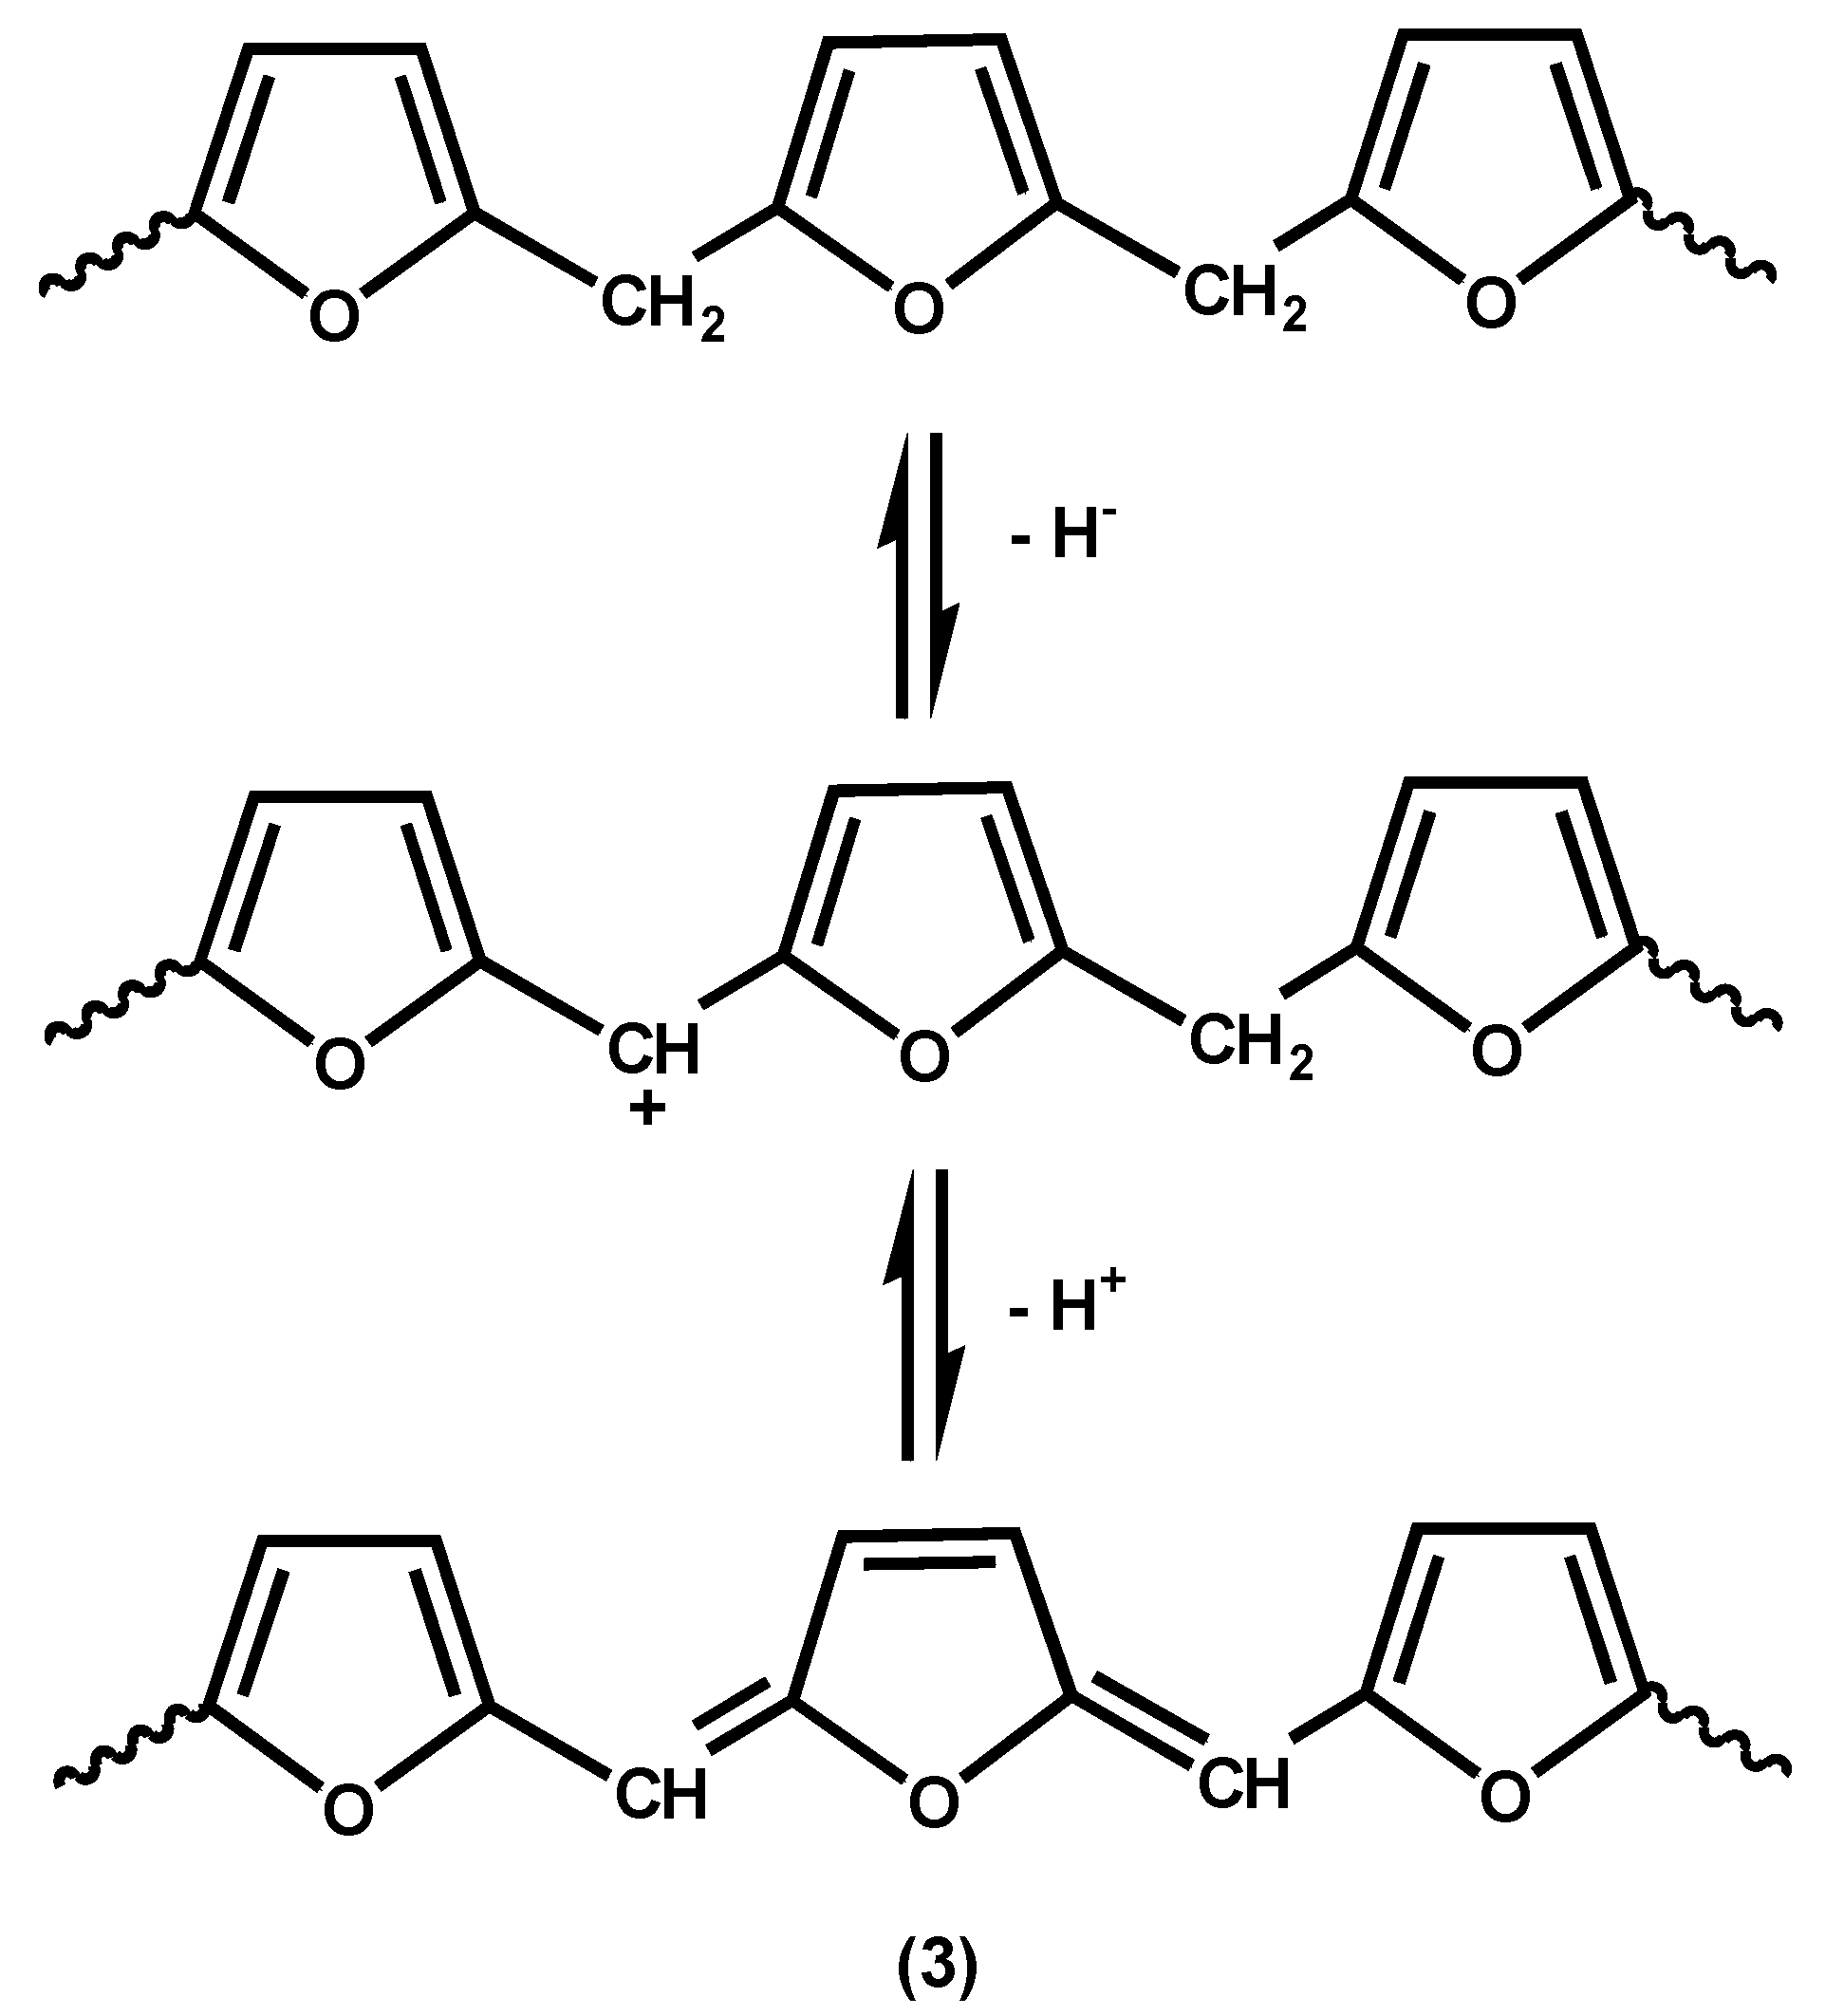
The simple reactions shown in
Scheme 1 result only in linear structures and do not explain the highly coloured and crosslinked materials obtained when polyfurfuryl alcohol is fully cured. The colour can only be explained by the development of intra- and/or inter-chain conjugation. Choura
et al. have published the most extensive investigation of both colour formation and crosslinking based on studies of reactions of model compounds [
23]. Their proposed reactions for the development of conjugation are shown, in simplified form, in
Scheme 3, Reaction (3). It will be seen that this scheme involves successive hydride ion and proton eliminations. However, whilst this proposal seems reasonable for reactions catalyzed by reagents such as Ph
3CAsF
6 in aprotic organic solvents in which the Ph
3C
+ ion can act as a hydride acceptor, in our systems, which are catalyzed by
p-toluene sulfonic acid with eliminations of water, no such hydride acceptor is present, unless one considers possible hydride abstractions from one chain by a carbocationic centre on another.
Scheme 3.
Reaction suggested for the development of conjugated unsaturation, and hence colour, in polyfurfuryl alcohols [
23].
Scheme 3.
Reaction suggested for the development of conjugated unsaturation, and hence colour, in polyfurfuryl alcohols [
23].
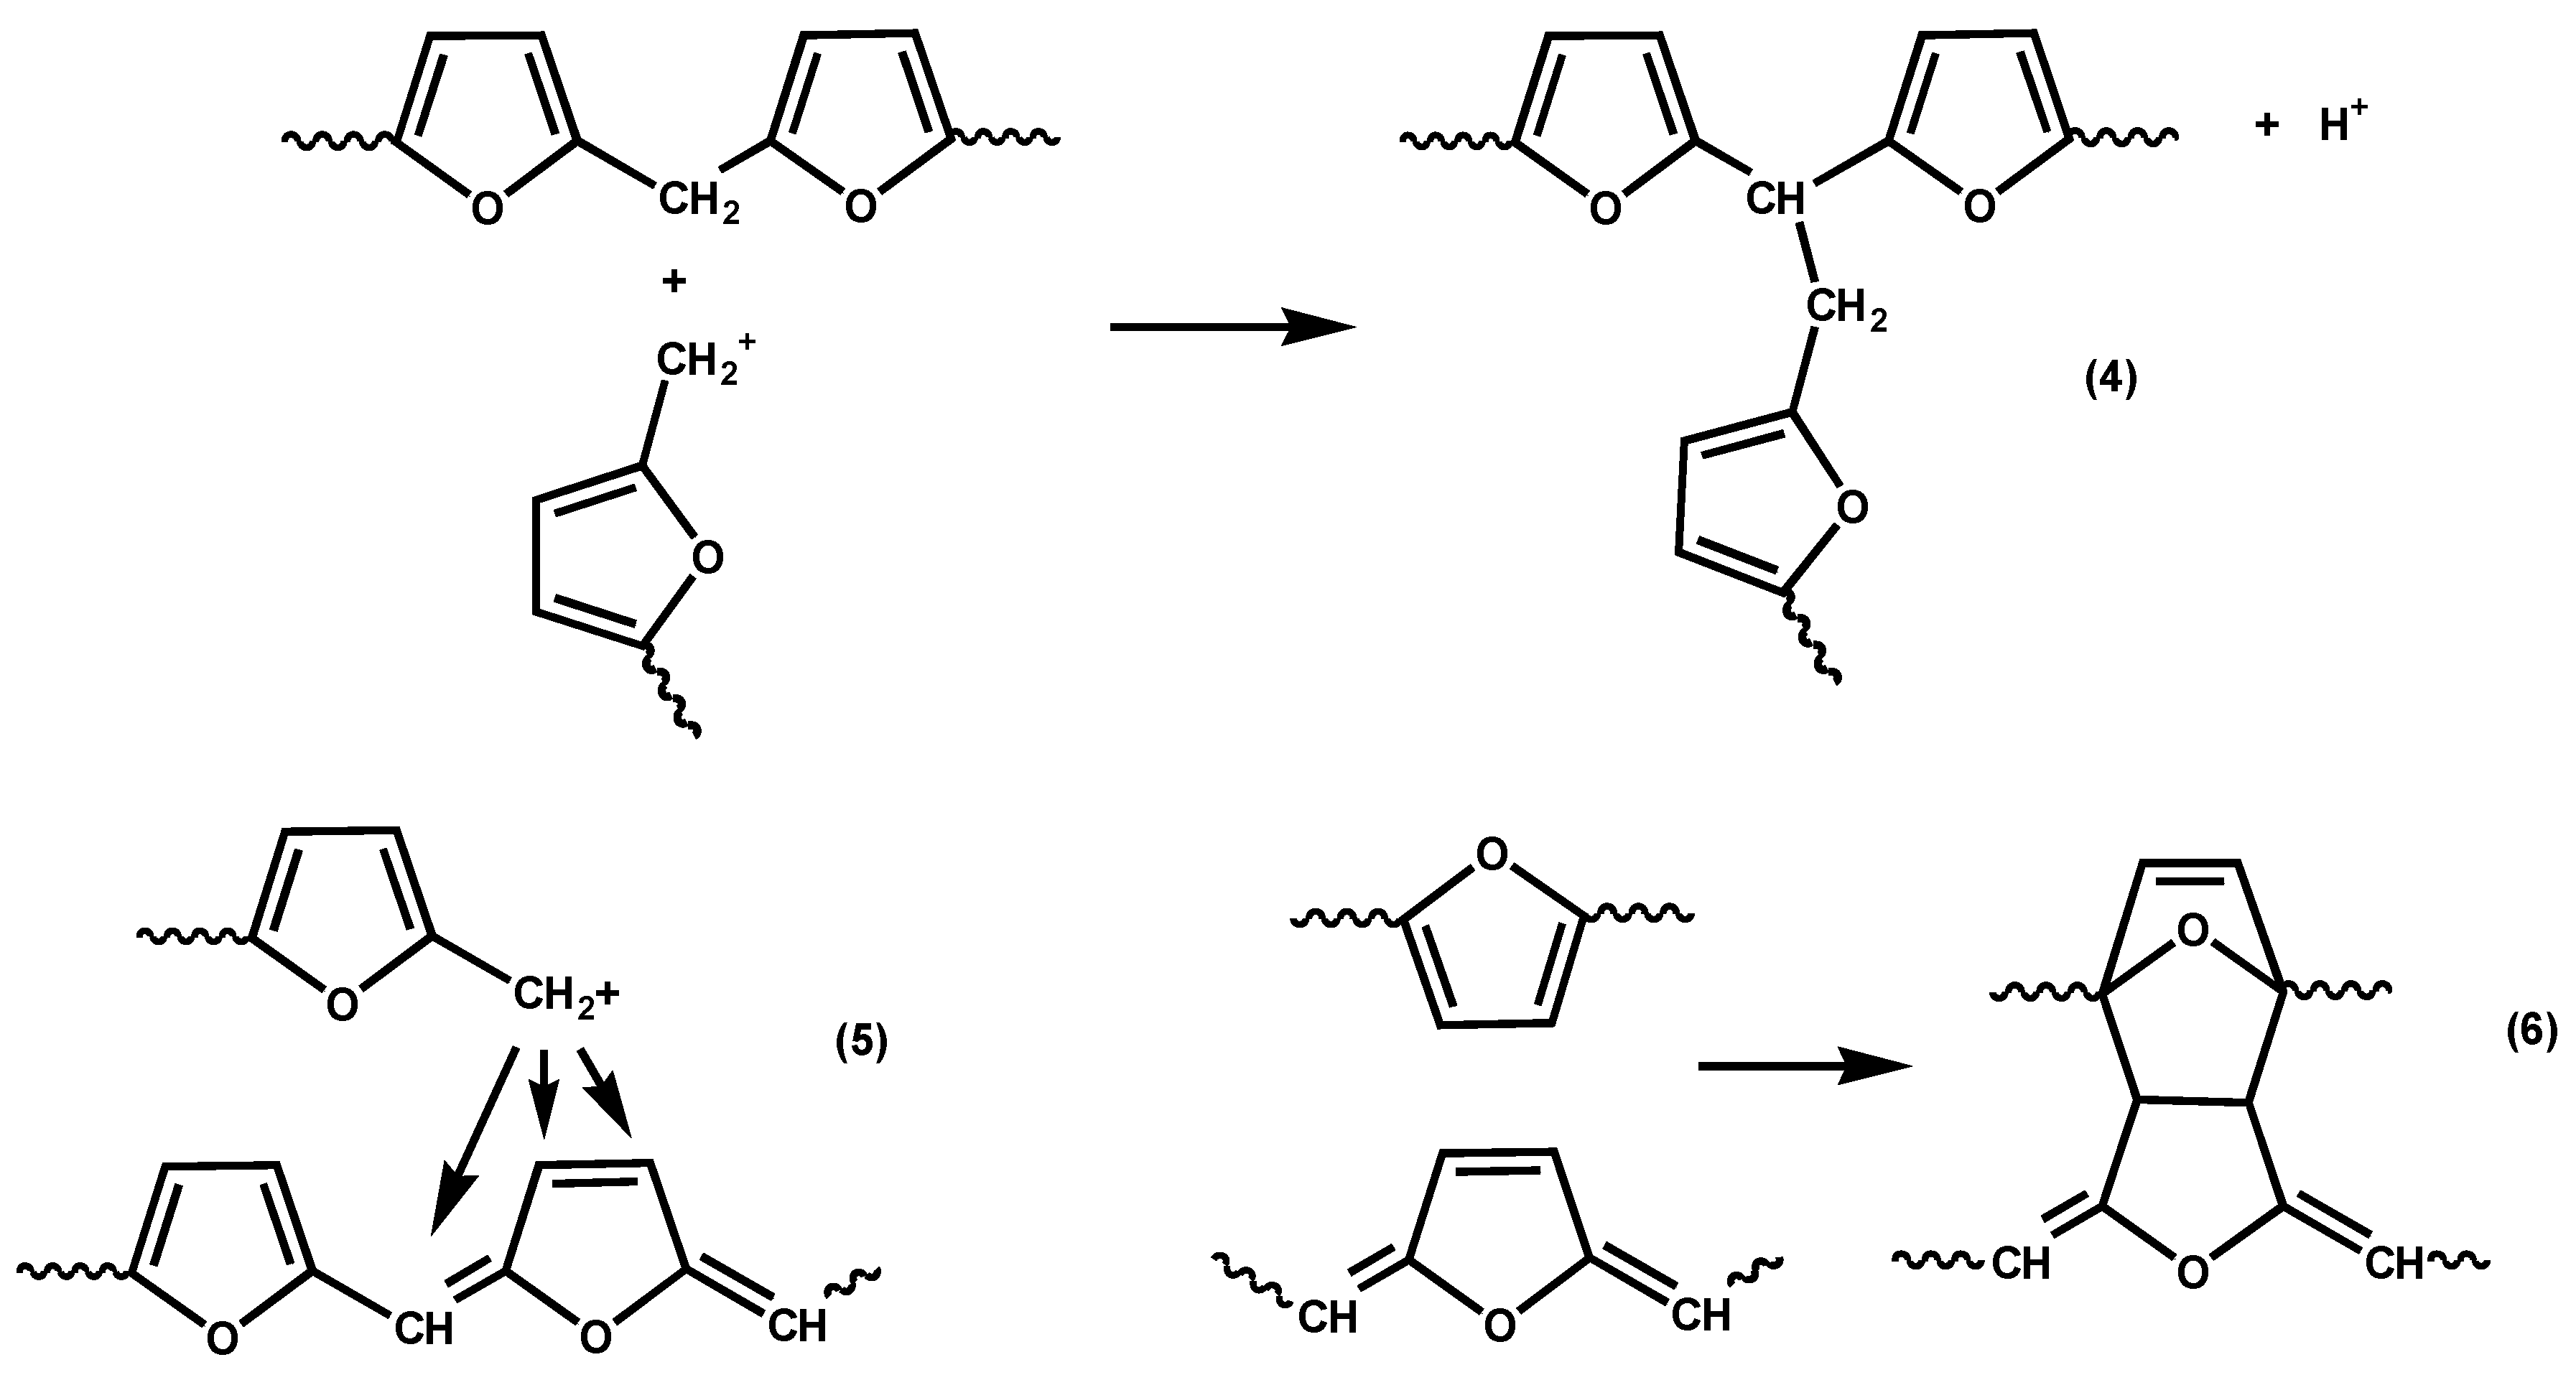
Various reactions have been proposed for the crosslinking of fufuryl alcohol resins [
24,
25,
26], including reaction of carbocationic chain ends with preformed methylene links; see
Scheme 4, Reaction (4). However, Choura
et al. found no evidence for Reaction (4) when tested with model compounds. Instead they suggested Reactions (5) and (6), also shown in
Scheme 4. Of these various reactions, we believe Reaction (6) to be the least likely contributor to crosslinking since, being a Diels-Alder reaction, it would be thermally reversible (unless followed by some sort of rearrangement or elimination) and there is no evidence of thermoreversibility in the crosslinking of furfuryl alcohol resins. However, crosslinking in furfuryl alcohol polymerization is clearly a topic that would reward further investigation.
Scheme 4.
Reactions suggested for the crosslinking of furfuryl alcohol resins [
24,
25,
26].
Scheme 4.
Reactions suggested for the crosslinking of furfuryl alcohol resins [
24,
25,
26].
Although appearances (clear viscous liquids of uniform appearance) suggest that the blends are homogeneous mixtures prior to curing, after curing and postcuring the samples are at best translucent and have rough surfaces, suggesting that some slight phase separation has taken place, or that curing has not been uniform throughout the samples (see, for example,
Figure 1f,g). SEM and/or TEM examinations of some of these samples might be informative in any future work, provided of course that phase separation gives rise to domains of at least micron dimensions.
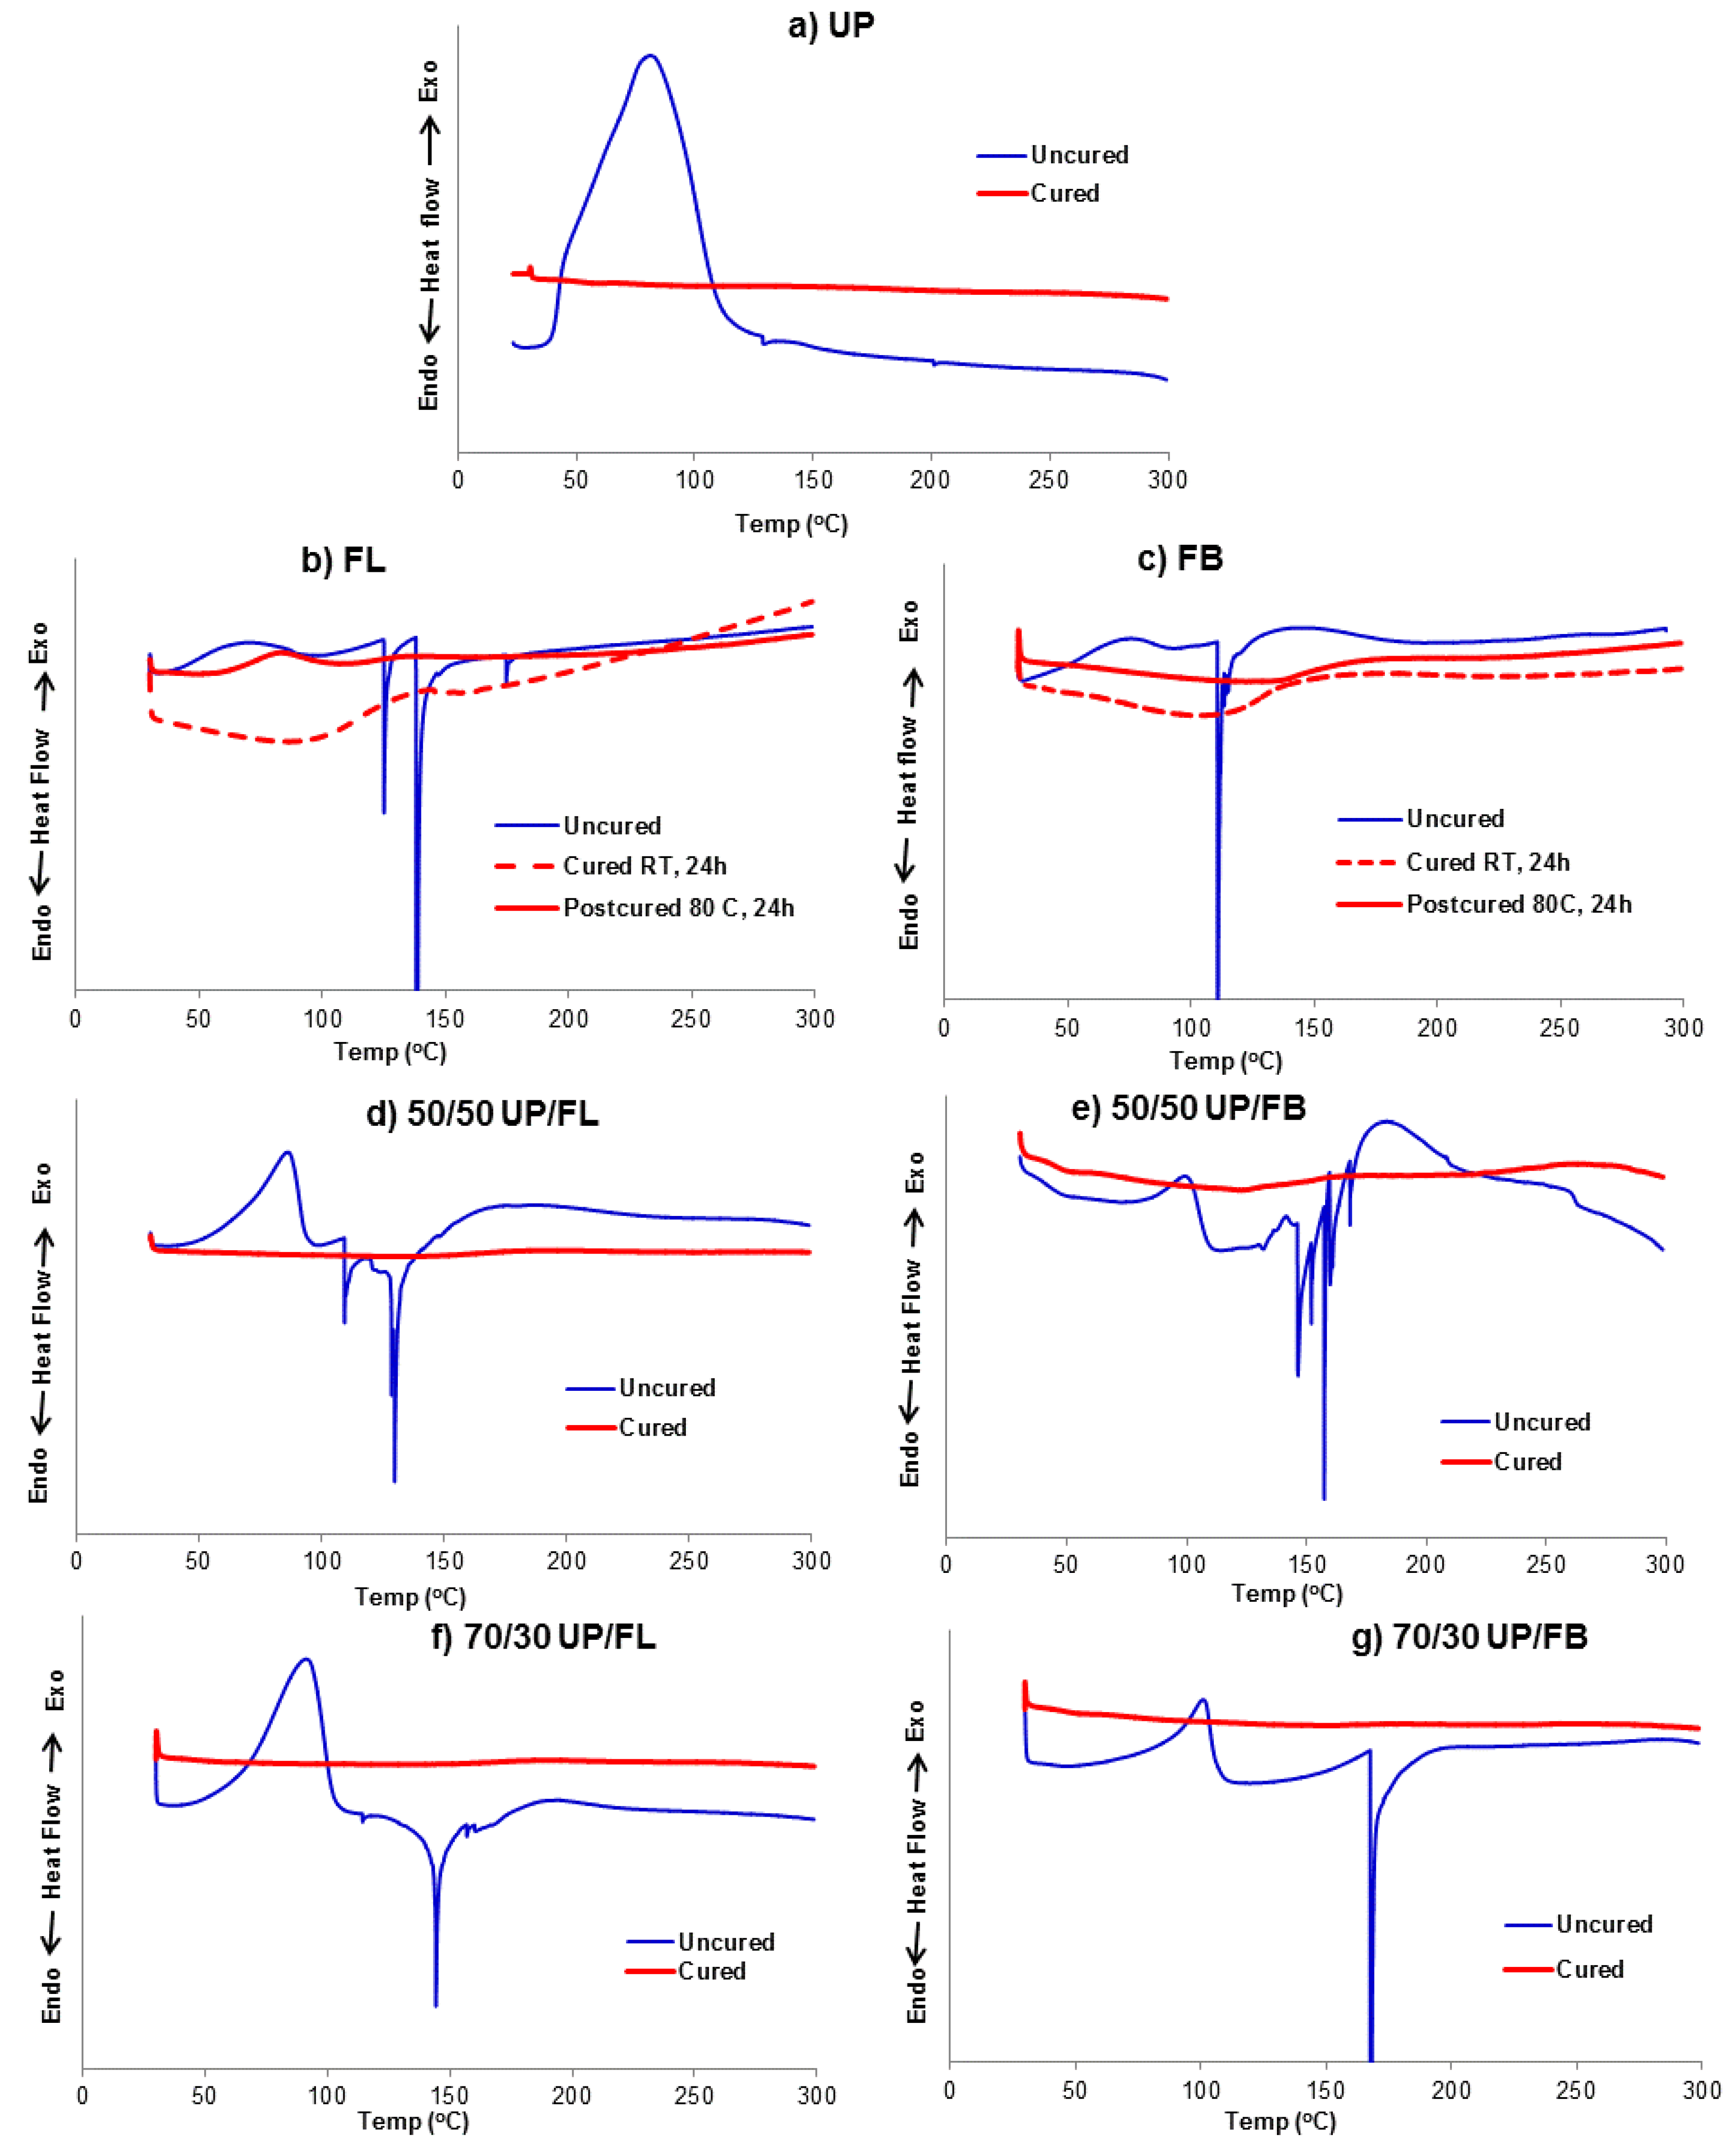
3.2. Curing Behaviour of Resins and Resin Blends Investigated by DSC
UP: DSC traces recorded at a heating rate of 5 °C/min on a sample of uncured UP and a sample cured following the curing and postcuring procedure outlined for UP above are shown in
Figure 2a. The run on uncured UP shows a pronounced exotherm between
ca. 40 and 140 °C with a maximum at about 80 °C arising from the thermal curing of the sample. The run on the cured and postcured sample gives essentially a flat trace, indicating that cure was complete.
FL: The DSC trace recorded on uncured FL,
Figure 2b, shows an exothermic transition starting from room temperature, which is then masked by a sharp endothermic peak between
ca. 120 and 150 °C. Furan resins cure with the release of water (
Scheme 1) and we assume that the endotherm observed here arises from evaporation of this water, possibly with evaporation of residual methanol solvent. The curing was conducted at room temperature for 24 h, followed by post curing at 80 °C for 24 h. The DSC trace of the cured and postcured sample, like that of cured UP, is featureless, indicating that cure was complete.
FB: The DSC traces for FB before and after curing and postcuring,
Figure 2c, are similar to those for FL except in that the shallow curing exotherm between
ca. 60 and 180 °C is masked by an endotherm for the uncured sample.
UP/FL and UP/FB blends: The DSC traces for 50/50 and 70/30 blends of UP with FL and FB, before and after curing and postcuring, are given in
Figure 2d–g. The traces for the uncured blends are essentially combinations of those for the separate uncured components, as might be expected, except that for the 50/50 compositions more than one endothermic peak is observed, possibly indicating release of several volatile species during cure, or delayed release of some volatiles caused by the rapidly increasing viscosity of the curing system because the UP network cures first during the DSC runs (40–140 °C) ahead of the furan resin network (120–150 °C). For all blends, the DSC traces of the cured and postcured samples show no endotherms or exotherms, indicating that the curing of both components was complete.
Figure 2.
DSC traces for uncured and cured samples of (a) UP; (b) FL; (c) FB; (d) 50/50 UP/FL; (e) 70/30 UP/FL; (f) 50/50 UP/FL and (g) 70/30 UP/FB recorded at 5 °C/min under N2.
Figure 2.
DSC traces for uncured and cured samples of (a) UP; (b) FL; (c) FB; (d) 50/50 UP/FL; (e) 70/30 UP/FL; (f) 50/50 UP/FL and (g) 70/30 UP/FB recorded at 5 °C/min under N2.
3.3. DMTA Analysis of Cured Resins and Resin Blends
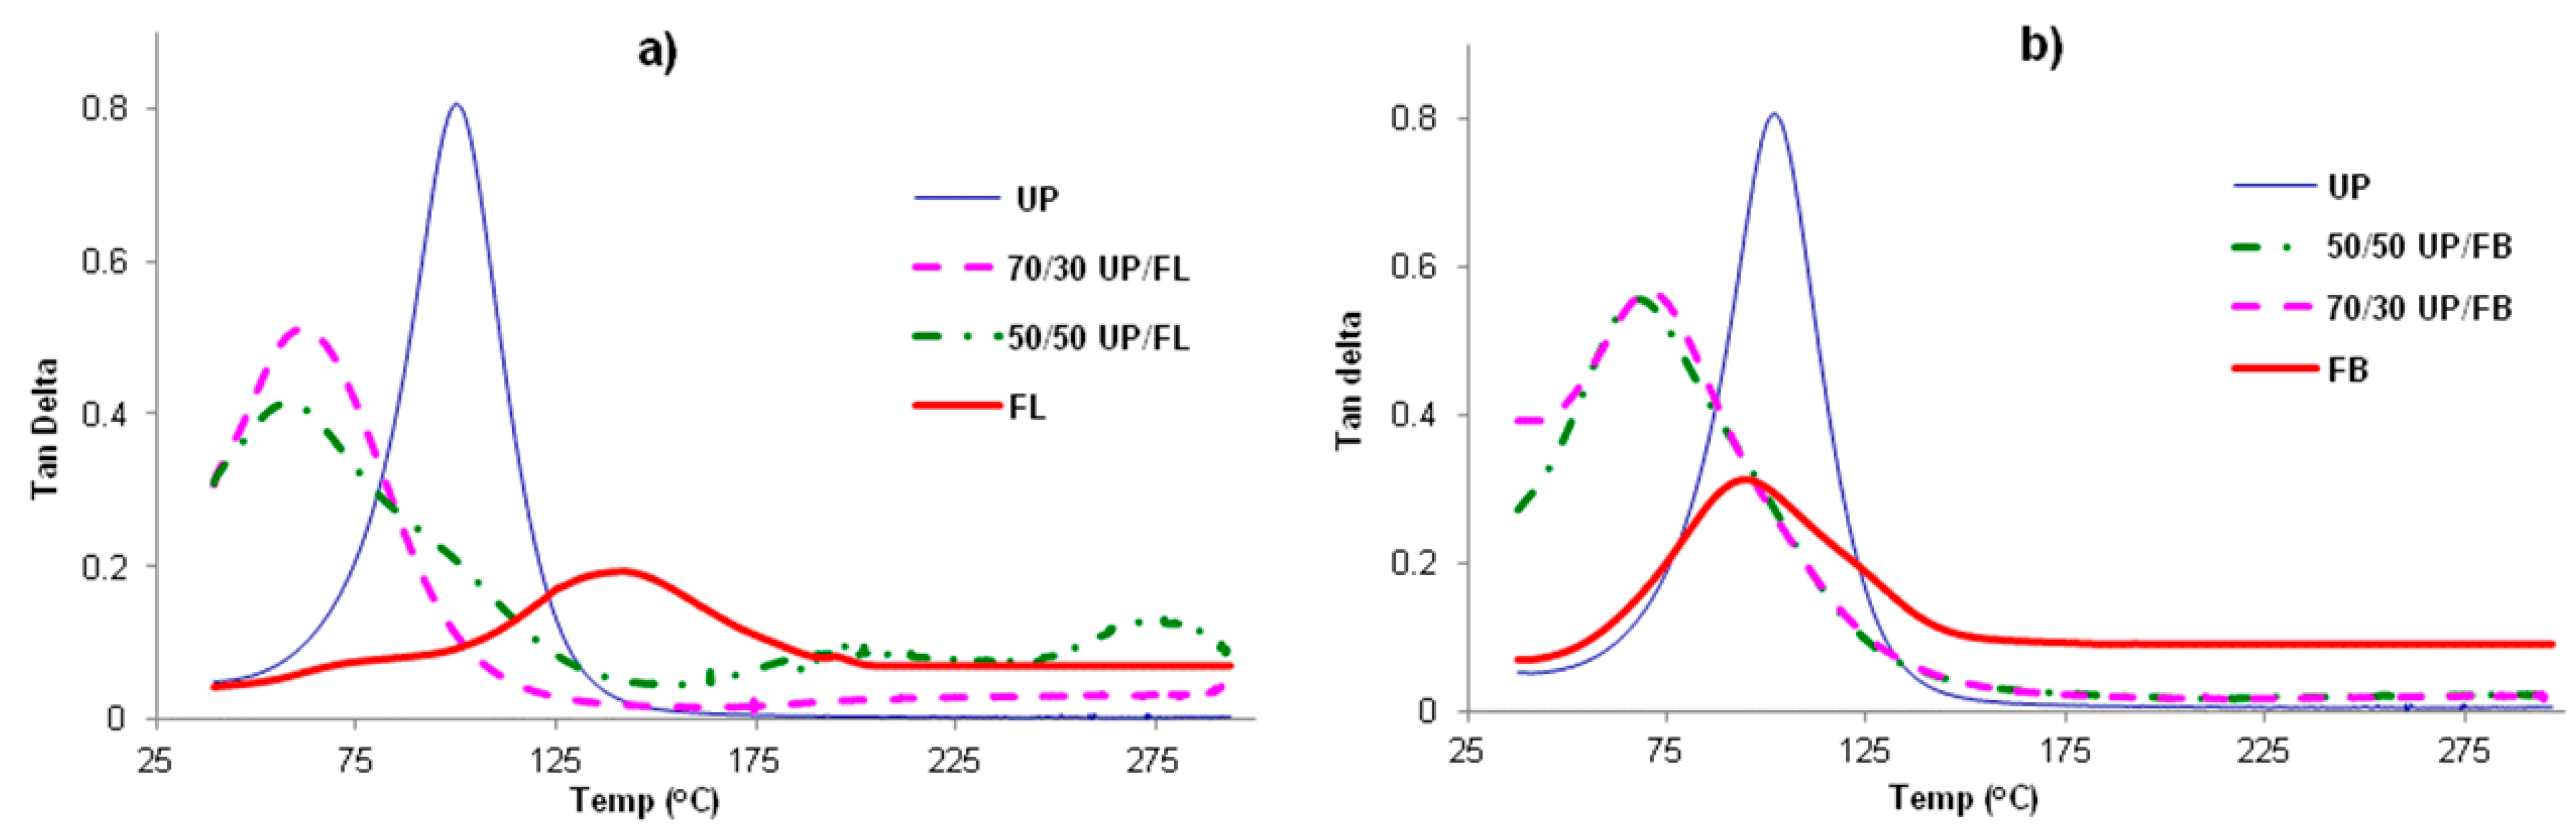
Plots of tanδ for cured samples of UP, FL, FB and blends of UP with FL and FB are given in
Figure 3a,b. For all samples, including the blends, single tanδ maxima are observed, indicating that all samples are homogeneous materials displaying single α transitions (
Tg). The values of
Tg obtained from the figures are given in
Table 1. Also included in the table are values of the loss and storage moduli at RT (
i.e., below
Tg) The notable feature is that
Tgs of the cured blends are lower than those of the separately cured components, as are the storage moduli below
Tg, whereas the loss moduli of the blends are greater than those of either of the pure components below
Tg. This finding is disappointing in that it provides no evidence of mutual reinforcement of the networks formed by the two resins in the blends, but rather that network formation is less complete (looser) in both the components in the cured blends than it is in the cured pure components. The significance of this is that high temperature mechanical properties of the cured blends are likely to be poorer than those of the cured individual resins.
Figure 3.
Tanδ vs. T for (a) cured UP, FL and UP/FL blends and (b) for cured UP, FB and UP/FB blends.
Figure 3.
Tanδ vs. T for (a) cured UP, FL and UP/FL blends and (b) for cured UP, FB and UP/FB blends.
Table 1.
Tg and moduli for cured resins and resin blends.
Table 1.
Tg and moduli for cured resins and resin blends.
| Resin | Tg/°C | Storage modulus at RT/MPa | Loss modulus at RT/MPa |
|---|
| UP | 100 | 2200 | 100 |
| 70/30 UP/FL | 65 | 600 | 180 |
| 50/50 UP/FL | 61 | 500 | 120 |
| FL | 144 | 1400 | 80 |
| 70/30 UP/FB | 68 | 600 | 210 |
| 50/50 UP/FB | 68 | 800 | 220 |
| FB | 94 | 1200 | 80 |
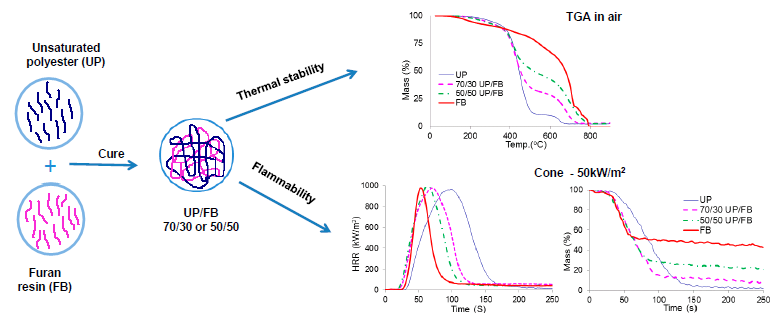
3.4. Thermal Degradation of Cured Resins and Resin Blends Studied by TGA
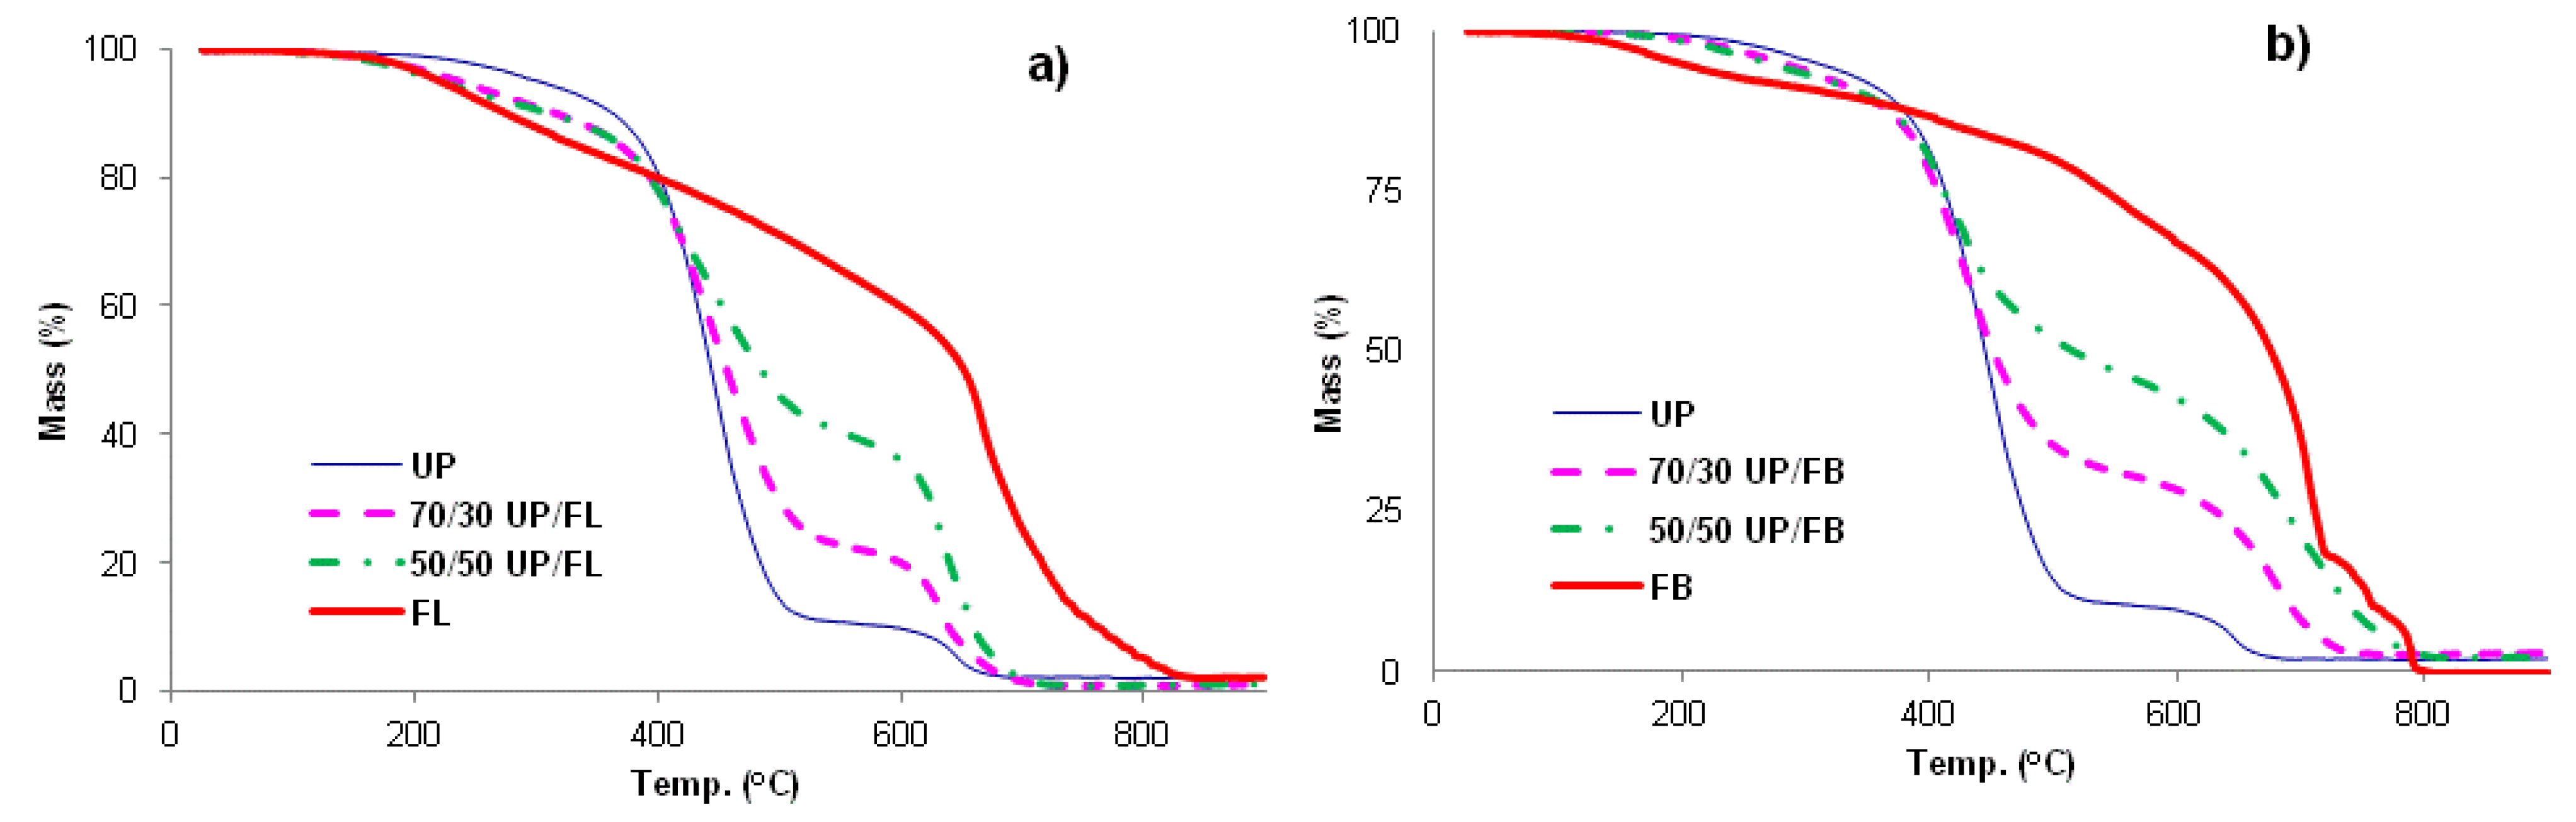
The TGA traces for UP, FL, FB and blends of UP with FL and FB are given in
Figure 4a,b. UP and the resin blends are seen to degrade in two main stages, with the first complete at about 500 °C. Above this temperature, more stable intermediate products are formed (chars) which proceed to oxidize above about 600 °C, leaving no residue at 800 °C and beyond. The thermal degradation behaviours of FL and FB are rather more complex with probably more than two stages involved, although for these resins too, there appear to be initial stages corresponding to pyrolysis followed by a char oxidation stage. In all significant respects, the TGA traces for the UP/FL and UP/FB blends are intermediate in character between those of the pure resin components in that, like FL, UP/FL blends are initially less thermally stable than UP, whereas above about 400 °C, the blends are more thermally stable than UP. The same pattern of behaviour is observed also for the UP/FB blends. Salient details of degradation behaviour extracted for the TGA traces are listed in
Table 2.
Figure 4.
TGA traces for (a) cured UP, FL and UP/FL blends and (b) cured UP, FB and UP/FBblends.
Figure 4.
TGA traces for (a) cured UP, FL and UP/FL blends and (b) cured UP, FB and UP/FBblends.
Table 2.
Some parameters of degradation extracted from the TGA data plotted in
Figure 4.
Table 2.
Some parameters of degradation extracted from the TGA data plotted in Figure 4.
| Resin | Onset T of degradation (°C) | Mass remaining at 600 °C (wt%) | Calculated mass remaining at 600 °C (wt%) * |
|---|
| UP | 165 | 10 | - |
| 70/30 UP/FL | 90 | 20 | 25 |
| 50/50 UP/FL | 110 | 37 | 35 |
| FL | 85 | 60 | - |
| 70/30 UP/FB | 120 | 28 | 27 |
| 50/50 UP/FB | 125 | 43 | 39 |
| FB | 85 | 67 | - |
The onset temperatures of thermal degradation listed in
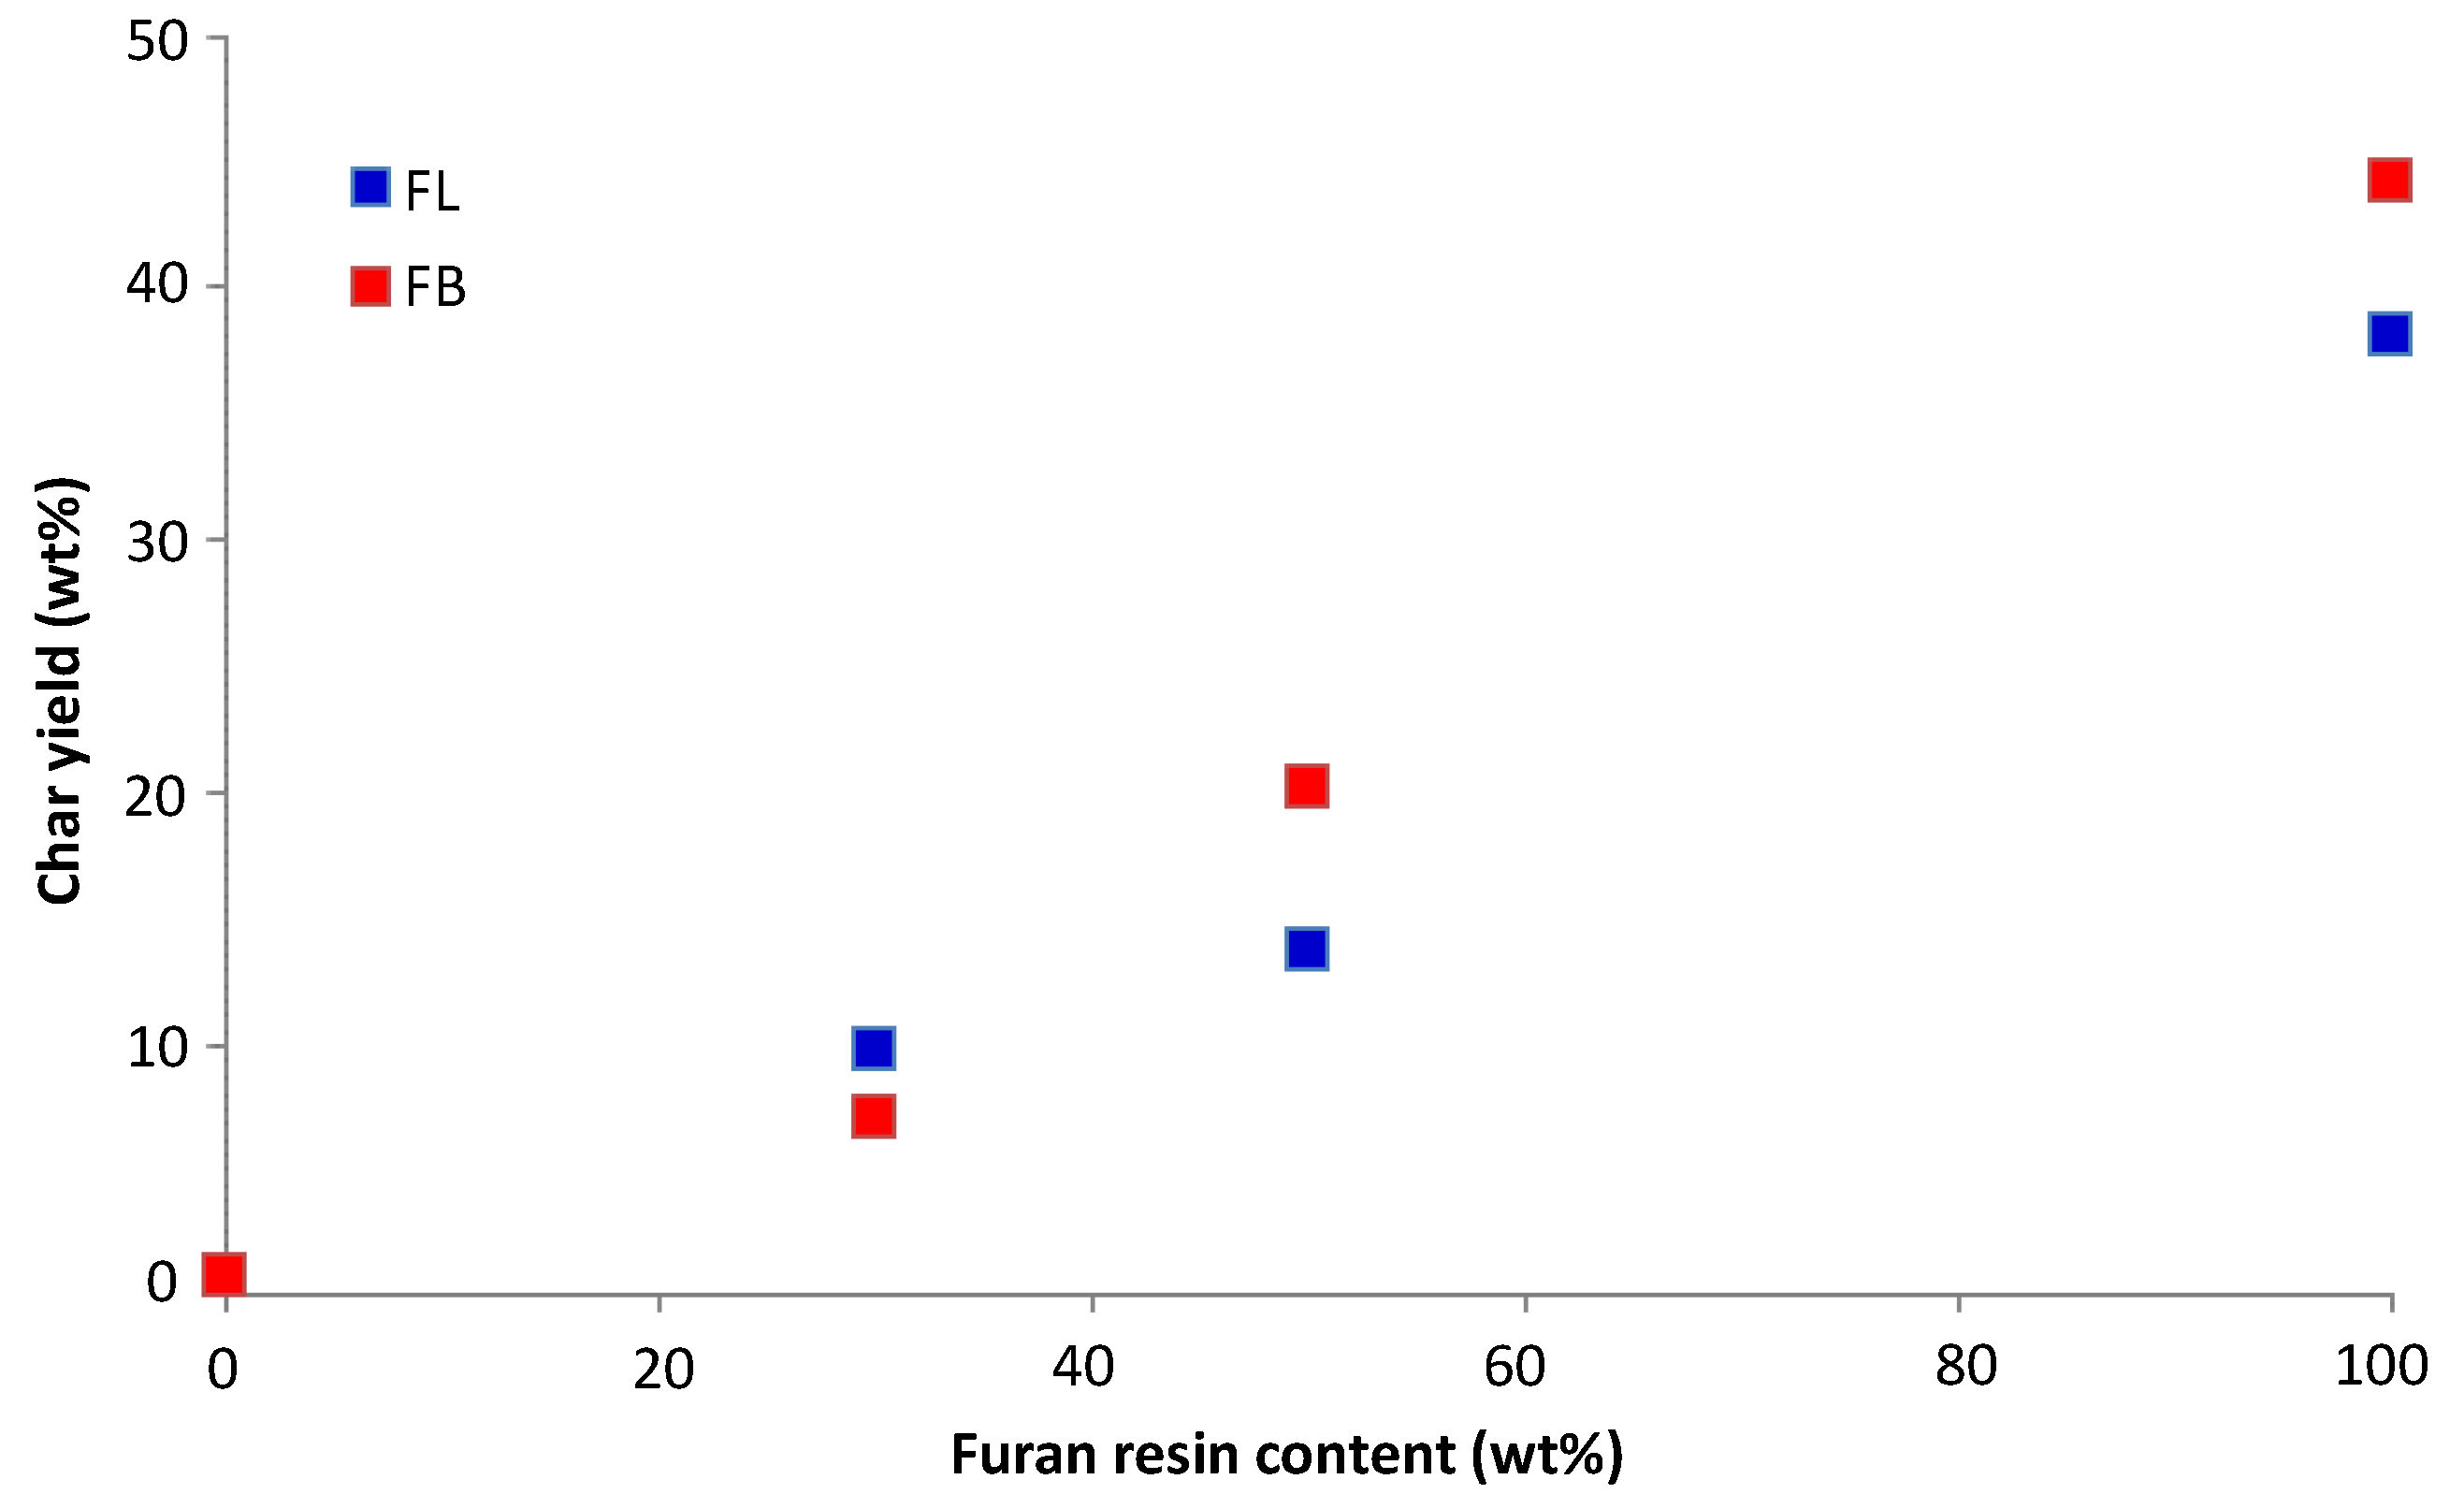
Table 2 would be expected to have some bearing on the time to ignition of the polymers; this aspect is discussed later, as is the bearing that char yields (mass remaining at 600 °C) might have upon total heat released in cone calorimetry experiments. We have taken the char yield to be the mass remaining at 600 °C, which is the temperature at which there is a point of inflection in the mass loss curves and beyond which char oxidation becomes significant.
Table 2 also lists mass average residual masses at 600 °C calculated from the residual masses of the pure components at this temperature. For example, for a 50/50 UP/FL blend, the mass average residual mass at 600 °C is calculated as 50% of residual mass of UP at 600 °C plus 50% of residual mass of FL at 600 °C. It can be seen that for the UP/FL and UP/FB blends, the calculated residual masses at 600 °C are similar to those measured, indicating that from the pyrolysis point of view, both blends behave very much like simple mixtures of UP and FL or FB and that there is probably no chemical interaction between them leading to changes in pyrolysis mechanism.
3.6. Cone Calorimetry
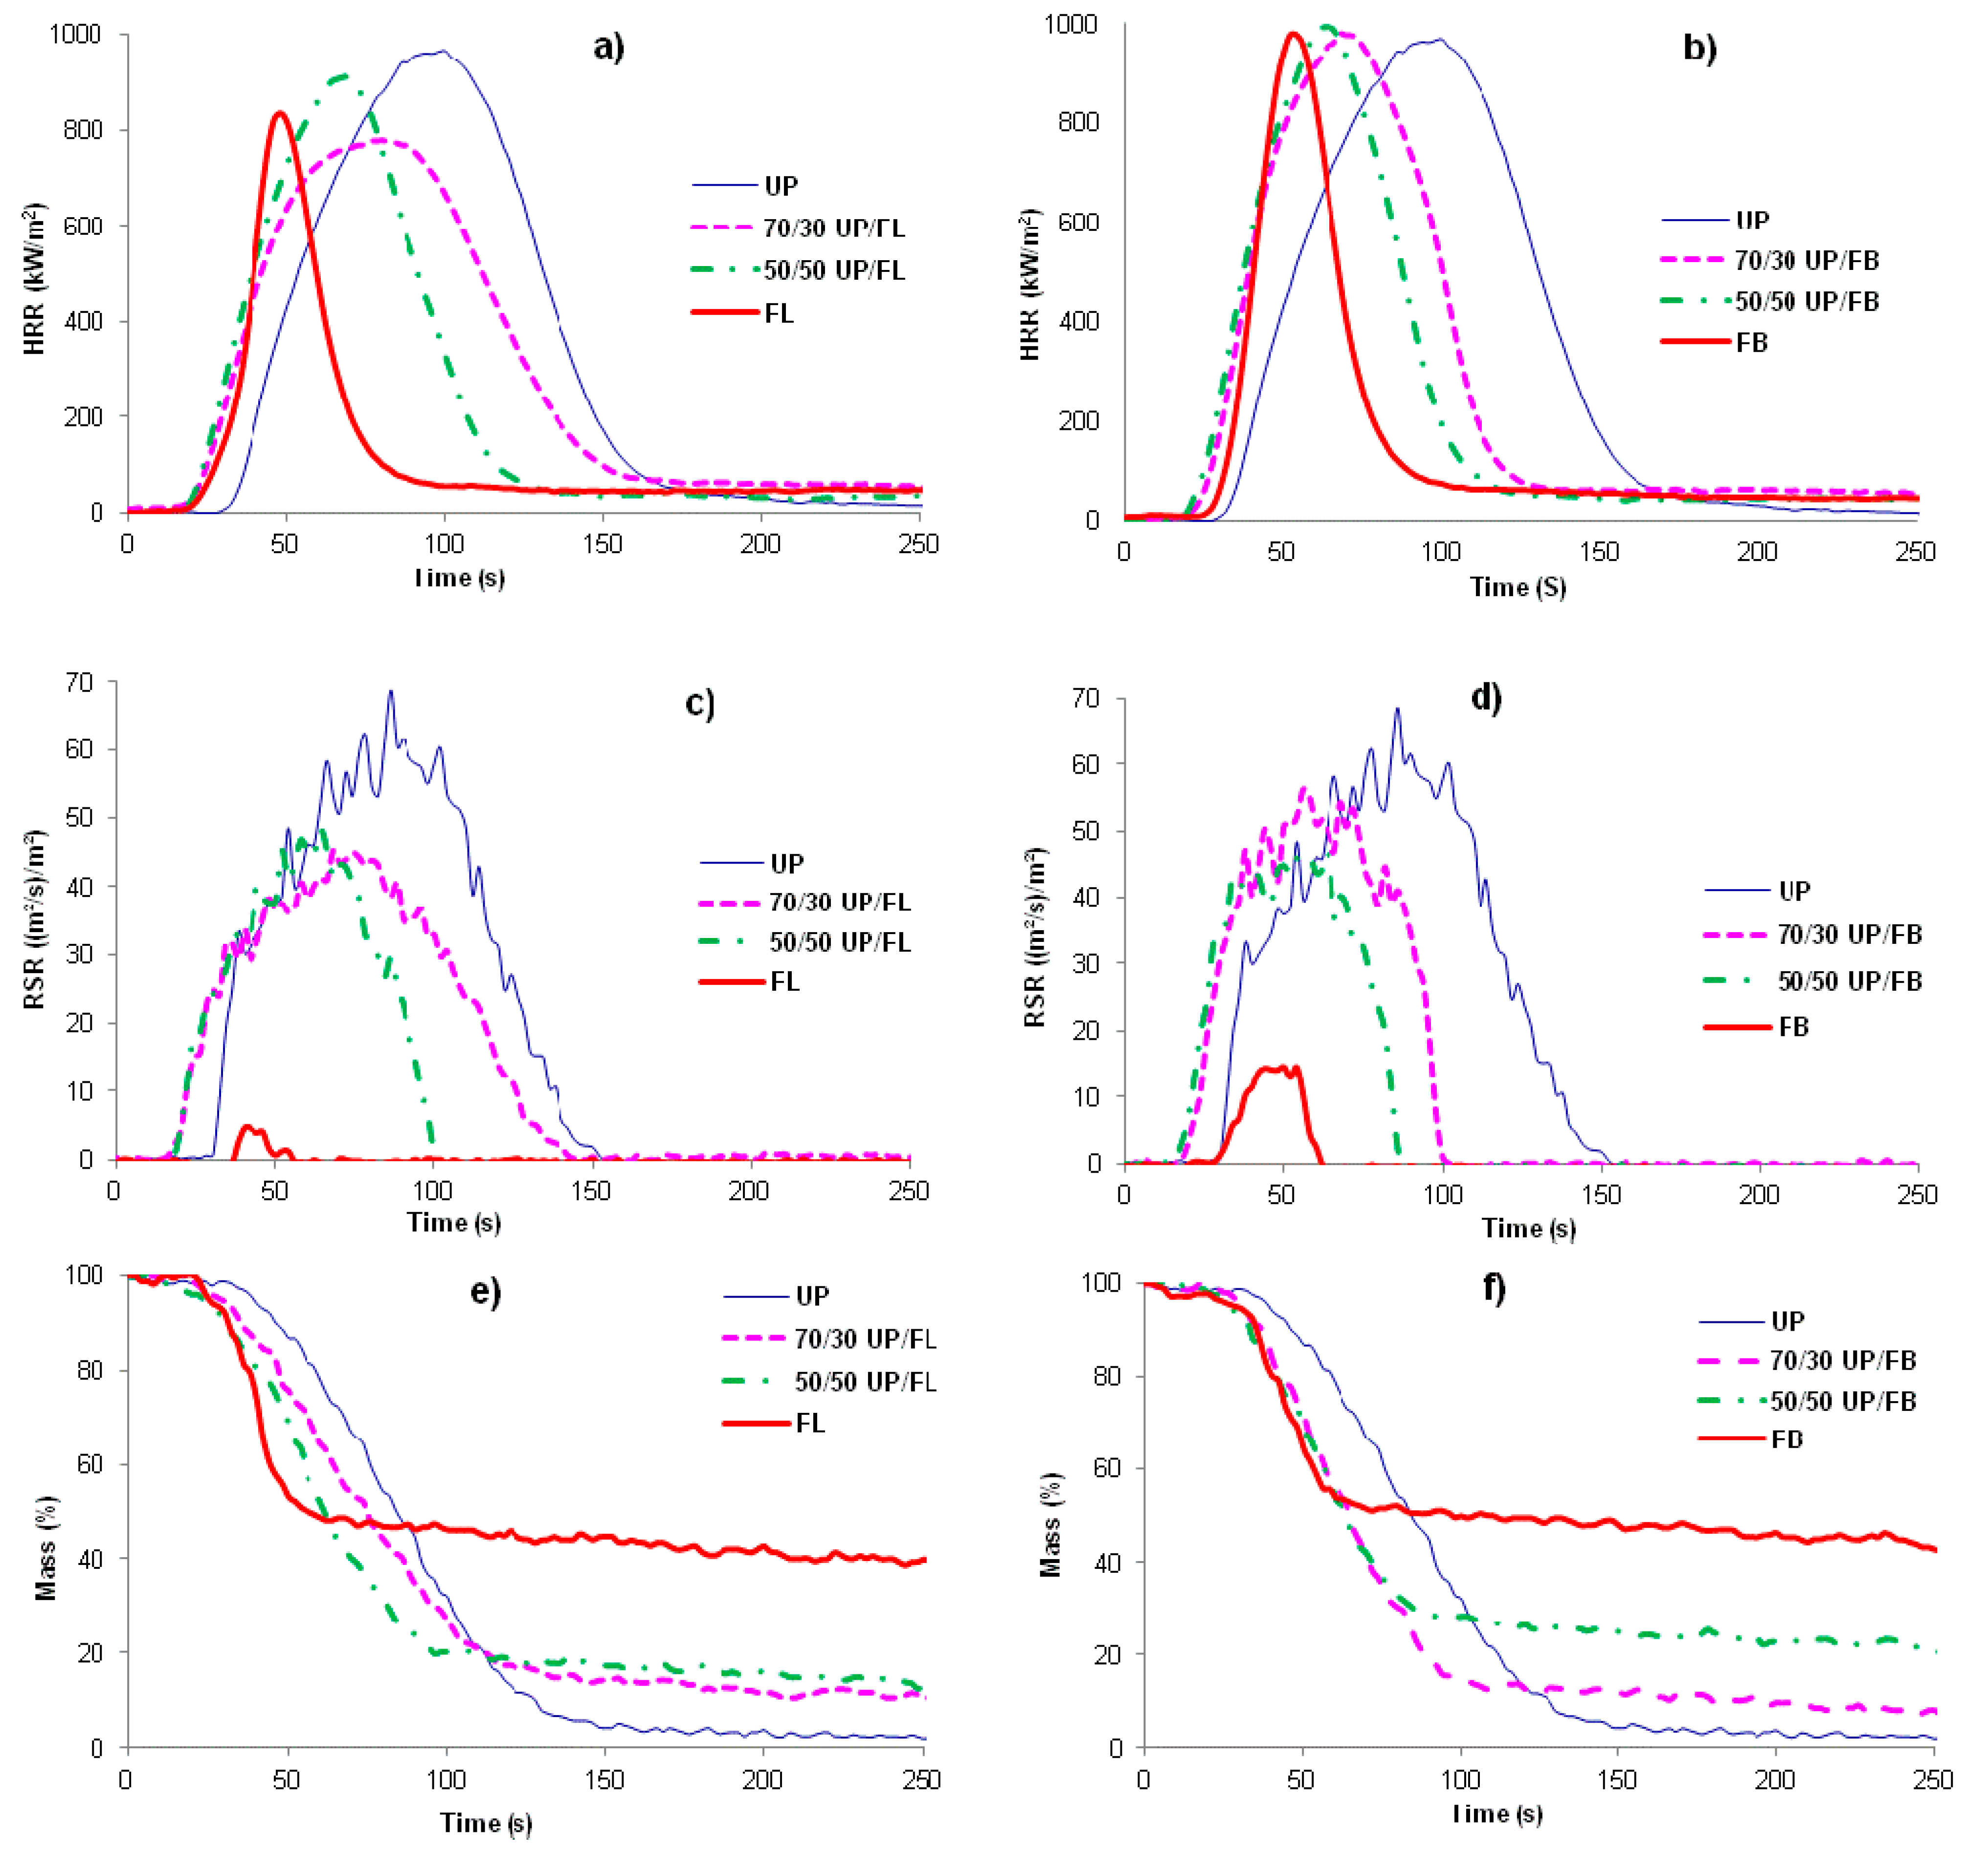
Plots of heat release rate (HRR)
vs. time (
t) for the various cured resins and resin blends are given in
Figure 5a,b, whilst
Figure 5c,d show plots of rate of smoke release (RSR)
vs.
t, and
Figure 5e,f plots of mass
vs.
t.
It can be seen from
Figure 5a,b that the total heat released (THR) from FL and FB (areas under the HRR
vs.
t curves) are both less than that released from UP, but that times to ignition (TTI) are shorter. The cured blends show behaviors in these respects intermediate between those of the pure components with no obvious signs of any synergistic or antagonistic behaviour between the components in the blends. Smoke production is significantly less for FB and FL than for UP, with the blends again showing behaviours intermediate between those of the component resins,
Figure 5c,d. The mass
vs.
t curves also indicate the earlier ignition of FL, FB and the blends compared with UP and also that char formation in FL and FB and UP/FL and UP/FB blends is significant, whereas UP alone produces very little char,
Figure 5e,f. Cone calorimetric data are summarized in
Table 4.
Table 4.
Cone calorimetric data for cured resins and resin blends *.
Table 4.
Cone calorimetric data for cured resins and resin blends *.
| Resin | TTI/s | FO/s | PHRR (kW m−2) | THR (MJ m−2) | EHC (MJ kg−1) | TSR (m2 m−2) | Char (wt%) |
|---|
| UP | 28 | 148 | 967 | 78 | 19.3 | 4660 | 0.8 |
| 70/30 UP/FL | 17 | 142 | 796 | 71 | 19.4 | 3525 | 9.8 |
| 50/50 UP/FL | 16 | 117 | 911 | 57 | 16.8 | 2520 | 13.6 |
| FL | 19 | 103 | 854 | 32 | 16.0 | 95 | 38.0 |
| 70/30 UP/FB | 19 | 101 | 979 | 67 | 18.9 | 3140 | 7.0 |
| 50/50 UP/FB | 18 | 102 | 993 | 39 | 18.1 | 2330 | 20.2 |
| FB | 25 | 118 | 981 | 39 | 17.3 | 290 | 44.2 |
Figure 5.
HRR vs. time for (a) UP/FL cured resins and resin blends and (b) for UP/FB cured resins and resin blends; (c) and (d) are RSR vs. time plots for the same systems and (e) and (f) plots of mass vs. time plots obtained by cone calorimetry.
Figure 5.
HRR vs. time for (a) UP/FL cured resins and resin blends and (b) for UP/FB cured resins and resin blends; (c) and (d) are RSR vs. time plots for the same systems and (e) and (f) plots of mass vs. time plots obtained by cone calorimetry.
It is clear from these data that whilst not as flame retardant as cured FL and cured FB, cured blends of UP with both FL and FB are significantly more flame retardant than UP alone. Of particular note is that although times to ignition for the blends are shorter than for UP, duration of flaming combustion (FO–TTI) is also shorter, whilst although PHR is little altered, both THR and EHC are significantly reduced. The increased char yields for the blends together with no increase in smoke (in fact smoke output is reduced), indicate that the effects of FL and FB in increasing the flame retardance of UP/FL and UP/FB blends compared with UP alone arise from a condensed phase mechanism in which both FL and FB contribute to significantly increased char formation. The structures of these chars have not been investigated in detail but appear to be largely carbonaceous.
It is interesting to investigate to what extent the thermal degradation behaviors of these polymers (
i.e., the TGA data) are consistent with the fire performance as assessed by cone calorimetry. For example, one would expect the temperature of onset of thermal degradation,
Tonset (
i.e., temperature at which volatiles begin to be released) to have a bearing on the time to ignition, TTI. These data are plotted in
Figure 6.
Figure 6.
Plot of Tonset from TGA data vs. TTI from cone calorimetric data for cured resins and resin blends.
Figure 6.
Plot of Tonset from TGA data vs. TTI from cone calorimetric data for cured resins and resin blends.
With the exception of the data for FL and FB, it can be seen from
Figure 7 that the correlation between
Tonset and TTI is reasonable, with those resins that have low
Tonset having low TTI and
vice versa. It is possible that both
Tonset and TTI are low for FL and FB owing to the presence of some occluded solvent left over from the mixing and curing stage. Another correlation between TGA and cone calorimetric data that might be expected is one between mass of material degraded prior to the char formation and oxidation stage (
i.e., mass loss below 600 °C) and total heat released. A plot of these parameters is shown in
Figure 7.
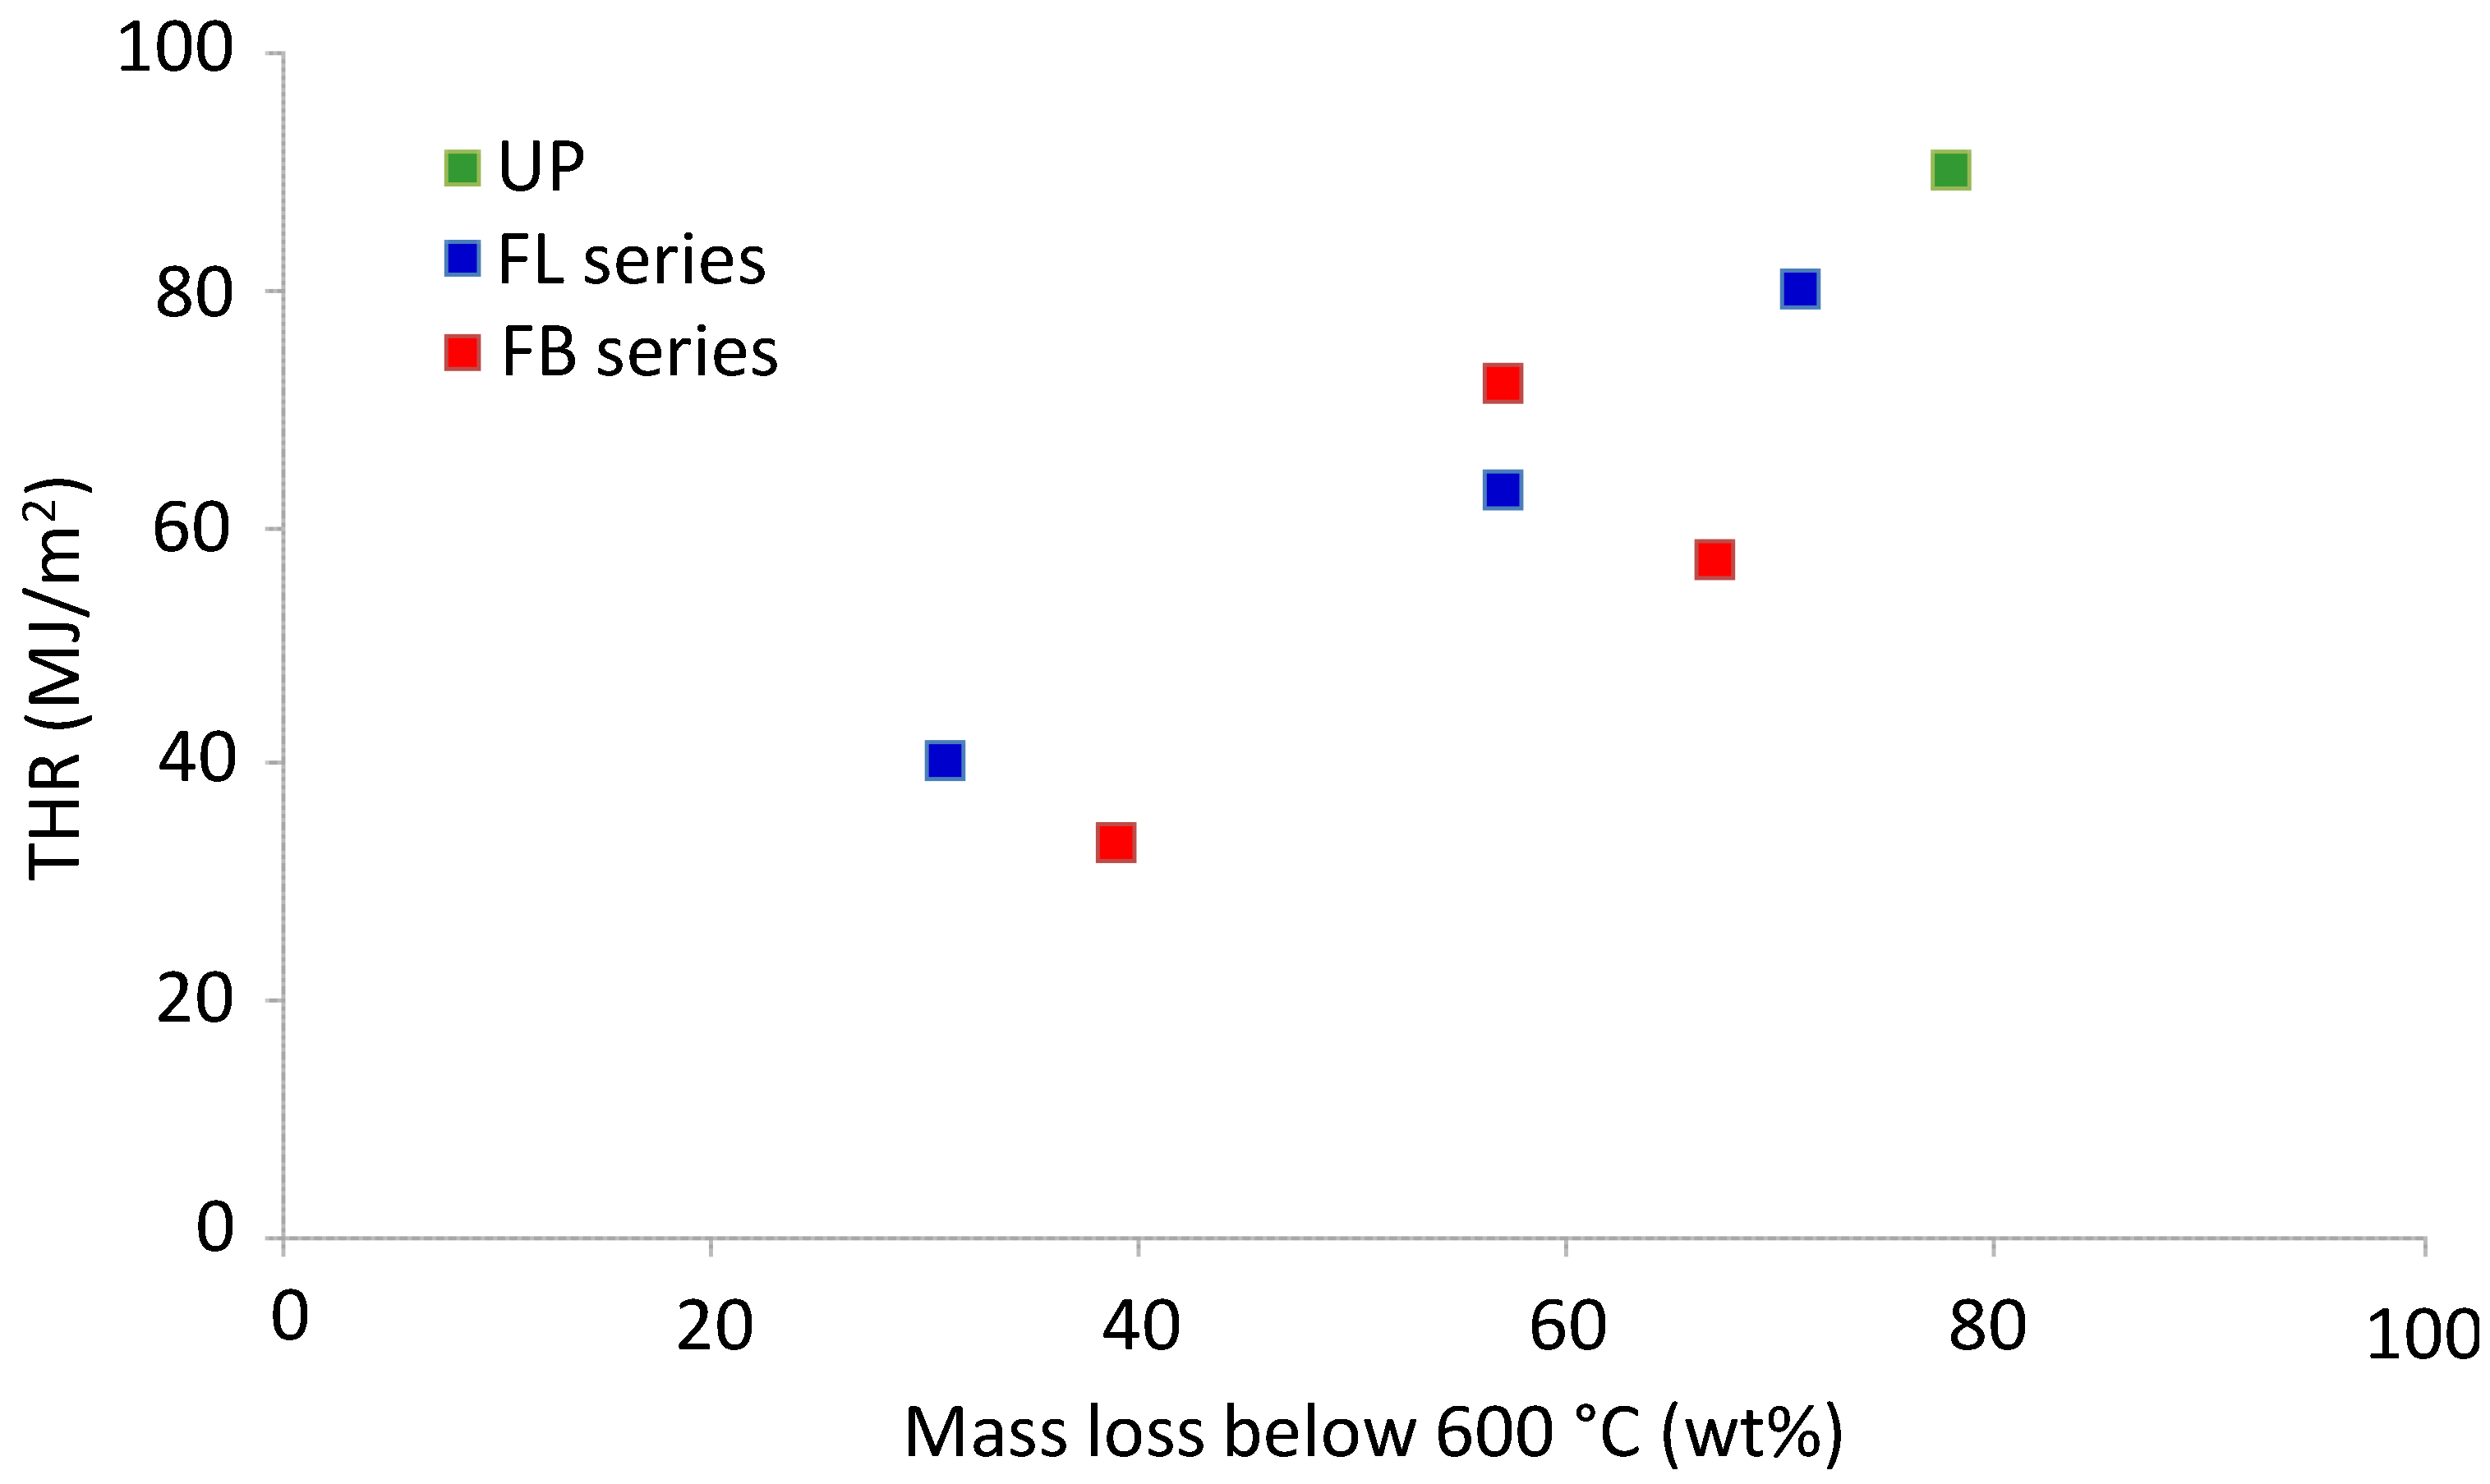
Figure 7.
THR vs. mass loss below 600 °C for cured resins and resin blends.
Figure 7.
THR vs. mass loss below 600 °C for cured resins and resin blends.
The correlation between THR and TGA mass loss below 600 °C is a good indication that the majority of the gases released during the pyrolysis of the polymers are flammable fragments and not non-combustible species such as CO and CO
2. In future work these gases will be quantitatively characterized by TGA-FTIR and Pyrolysis-GCMS. Although no plots are shown here, it is worth noting that, as expected, there is a reasonable correlation between char yields obtained in the TGA experiments (
i.e., mass remaining at 600 °C) and final char yields in the cone calorimetric tests (see
Table 2 and
Table 4).


