Article

Evolution of NH3 Concentrations in Weaner Pig Buildings Based on Setpoint Temperature

1
Department of Agroforestry Engineering, University of Santiago de Compostela, 27002 Lugo, Spain
2
Xunta de Galicia, Consellería de Educación e Ordenación Universitaria, 27370 Rábade, Spain
3
Xunta de Galicia, Consellería do Medio Rural, 36500 Lalín, Spain
*
Author to whom correspondence should be addressed.
Agronomy 2020, 10(1), 107; https://doi.org/10.3390/agronomy10010107
Submission received: 28 December 2019 / Revised: 7 January 2020 / Accepted: 9 January 2020 / Published: 11 January 2020
(This article belongs to the Special Issue Selected Papers from 10th Iberian Agroengineering Congress)

Abstract

:
Ammonia (NH3) concentration has seldom been used for environmental control of weaner buildings despite its impact on environment, animal welfare, and workers’ health. This paper aims to determine the effects of setpoint temperature (ST) on the daily evolution of NH3 concentration in the animal-occupied zone. An experimental test was conducted on a conventional farm, with ST between 23 °C and 26 °C. NH3 concentrations in the animal-occupied zone were dependent on ST insofar as ST controlled the operation of the ventilation system, which effectively removed NH3 from the building. The highest NH3 concentrations occurred at night and the lowest concentrations occurred during the daytime. Data were fitted to a sinusoidal model using the least squares setting (LSS) and fast Fourier transform (FFT), which provided R2 values between 0.71 and 0.93. FFT provided a better fit than LSS, with root mean square errors (RMSEs) between 0.09 ppm for an ST of 23 °C and 0.55 ppm for an ST of 25 °C. A decrease in ST caused a delay in the wave and a decrease in wave amplitude. The proposed equations can be used for modeling NH3 concentrations and implemented in conventional controllers for real-time environmental control of livestock buildings to improve animal welfare and productivity.

Graphical Abstract

1. Introduction

Ammonia (NH3) release in livestock buildings originates from the nitrogen content in the urine and feces deposited in pits or on the building floor surfaces with or without bedding material [1]. Currently, NH3, together with hydrogen sulfide (H2S) is one of the most critical pollutants for pig production [2,3,4] because of its direct relationship with animal and workers’ welfare and health [3,4,5,6]. Accordingly, many authors have analyzed the effects of NH3 concentration on animal behavior, health, and productivity [7,8,9,10,11,12,13,14]. Generally, the negative effects of NH3 concentrations on the physiological state of pigs in terms of growth and health have been acknowledged, but no consistent experimental results have been obtained. Actually, whereas some authors have claimed that high NH3 concentrations have physiological effects on pigs [10,13], other authors have not found a clear influence on hepatic gene expression [7] or pig growth performance [11,13].
In accordance with Directive 91/630/EEC, gas concentrations must be kept within limits that are not harmful to pigs through building insulation, ventilation, and heating. Yet, the directive does not establish any numerical limits [15]. Likewise, there is no consensus on the maximum allowable NH3 levels. Whereas the International Commission of Agricultural and Biosystems Engineering, CIGR, (2002) [16] recommended a maximum concentration of 20 ppm, Bottcher et al. [17] were more cautious and considered concentrations below 15 ppm as adequate. They also recommended caution at levels between 15 and 25 ppm, and considered levels above 25 ppm as dangerous. More strict and safe exposure limits were proposed by Cargill et al. [18] and Donham [19], with 10 and 11 ppm, respectively.
Drummond et al. [9] found much higher NH3 levels than usual in closed swine buildings, which depressed pig growth by 12% to 30%. However, there was evidence that 20 ppm atmospheric NH3 may have an adverse influence on the well-being of growing pigs. [11]. Similarly, NH3 concentrations between 0.6 and 37 ppm showed no direct effects on the growth, food conversion efficiency [14], or respiratory health of weaned pigs [8].
From an environmental perspective, odor and NH3 show a strong impact on animal production [2,20]. NH3 emissions and deposition play a critical role in the acidification and eutrophication of ecosystems and contribute to indirect emissions of nitrous oxide [21]. Adverse effects such as the acidification and eutrophication of ecosystems [22] lead to a loss of biodiversity [23] and contribute to a high share to the total mass of particulate matter smaller than 2.5 μm and 10 μm [24,25,26]. Furthermore, significant air concentrations of NH3 have been found around swine farms [27,28,29]. Time-average concentrations of NH3 outside a pig farm ranged from 38.4 µg m−3 at a distance of 10 m to 14.0 µg m−3 at a distance of 650 m [29]. Actually, the highest concentrations and depositions of more than 5 µg NH3−Nm−3 were seen around point sources (animal houses and manure storages) in Denmark [27]. Similarly, the highest estimated annual average concentrations of NH3 exceeded 7 µg m−3 for 5 km × 5 km grid squares and were found in the area of emissions originating from pigs and cattle breeding in Poland [28].
NH3 contributes significantly to animal well-being and to the extension of the useful life of equipment and facilities [30]. For these reasons, NH3 emissions are one of the concerns related to environmental control. Actually, most European countries have stressed the importance of reducing NH3 and odor emissions in order to limit their negative impact on local communities and the environment [3].
NH3 concentrations in swine buildings show large variations and are related to a number of factors, including animal age, activity and density, outdoor temperature, ventilation control, time of day or time of year [5,31,32]. For example, daily mean NH3 concentrations in swine finishing buildings on slatted floors where flushing was applied ranged from 14.20 to 16.90 ppm in the control barn [33], and similar daily average values (12.10 to 18.20 ppm) were reported in Northern Europe [34]. For experimental rooms with partial pit ventilation systems, NH3 concentrations decreased down to 6.50 ppm [3], or even 2.10 to 3.40 ppm in summer and 4.20 to 4.30 ppm in winter [35].
The decrease in ventilation rates caused by the decrease in outdoor temperature has led to seasonal variations in NH3 concentrations, with generally higher values in winter than in summer [5,28,35,36]. However, some authors have reported higher values in the summer period, stressing that the conditions that lead to an increase in NH3 generation rates, such as building management, hygiene or volume, affect NH3 concentrations more strongly than the factors that reduce concentration rates [37]. NH3 concentrations do not show an evident daily pattern, but the lowest peaks tend to be during the middle of the night [38]. Likewise, many authors have reported higher NH3 concentrations during the night or early in the morning and between 16:00 and 20:00 [5,32]. Contrary to the general belief that NH3 concentrations are closely associated with ventilation rates, NH3 levels are more closely associated to evaporation levels that are at the maximum at higher temperatures [38]. After weaning, the thermal requirements of pigs are 26–28 °C [34] and then they decrease by 10 °C throughout the cycle [39,40,41], and are generally controlled by conventional systems composed of heating and ventilation systems regulated by at least one temperature sensor [42] that does not directly control parameters such as relative humidity or other pollutants [43]. This paper aims to determine the patterns of daily NH3 concentrations in the animal-occupied zone of a weaner building and the variations in the setpoint temperature defined in climate control systems. By finding these patterns, NH3 concentration can be incorporated in conventional control systems with temperature as the single input variable by applying a simple algorithm based on the variables used by the climate control system. As a result, environmental control systems will contribute to decreasing the environmental impact of livestock production [44] and improving animal welfare status [45] while maintaining productivity.
Our results add to the results reported in previous research on NH3 concentrations and emissions in buildings for rearing various species and their influencing factors, which were aimed at determining pollution levels and designing NH3 reduction strategies [46,47,48,49,50,51,52].

2. Materials and Methods

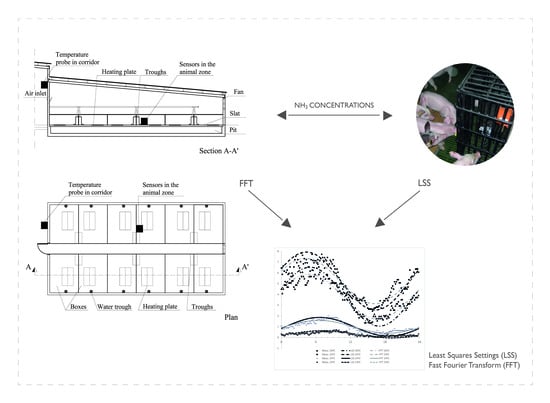
2.1. Experimental Test

The study was carried out on a conventional intensive pig farm with an authorized farm size of 4895 sows, where piglets were reared to a live weight of 20 kg in 2013. The farm is located in Abegondo, A Coruña, NW Spain (43°10′12″ N, 8°19′30″ W), where temperatures are mild and frost is unusual. In 2013, mean annual temperature was 13.20 °C, mean annual relative humidity was 86.67%, and there were 17 frost days, according to the public network of weather stations, Meteogalicia [53]. The experimental test was conducted in a weaning room, where piglets were reared from 6 to 20 kg live weight. The inside dimensions of the weaning room, with polypropylene slat floors, were 11.82 m in length by 5.86 m in width and 2.50 to 2.25 m in height (Figure 1). The room contained six 2.53 m × 1.97 m pens on each side of a central aisle and housed 50 piglets per pen, up to a maximum of 300 piglets. The manure pit was empty at the beginning of the production cycle and manure was removed at the end of the cycle.
In the experimental test, we used the climate control system of the farm, which was composed of a ventilation system and a hydronic radiant floor heating system. The environmental conditions of the building were controlled by a temperature probe that did not alter the farm management. The ventilation system was composed of a 500 mm helical extractor fan with the following specifications: 230 V AC, 50 Hz, 1330 rpm, 480 W power, and cos φ = 0.96, 8746 m3 h−1. Fan minimum flow was 20% and acceleration was 3 °C. In addition, the fan incorporated a system to reduce the section of the air inlet duct, the diameter of which could be adjusted between 0.30 m and 0.50 m. The radiant floor heating system was composed of two 1.20 × 0.40 m polyester spreader plates for hot water, each with a capacity of 2.90 L. The temperatures of the heating fluid ranged from 37 °C to 41 °C. The flow rate of the heating fluid was adjusted manually on the dates on which setpoint temperature (ST) was changed for ventilation purposes. The ST defined for the environmental control was in the range of 26–23 °C (Table 1) and decreased with the increase in animal age and weight. Fresh air entered the room through two 1.50 × 0.70 m windows with air deflectors installed on the wall opposite to the fan, at both sides of the entry room door.
The environmental variables measured inside the building and the measurement sensors and dataloggers used were as follows:
  • NH3 concentration in the animal-occupied zone ( C N H 3 ): ST–IAM IP66 electrochemical detector (Murco Ltd, Dublin, Ireland) with splash guard, 0–100 ppm detection range, 5% accuracy, temperature correction and auto-zero factory calibration before installation, implemented with a particulate filter made of wire cloth with 0.168 mm aperture width and 0.110 mm wire diameter.
  • Relative humidity ( RH az ) and temperature ( T az ) in the animal-occupied zone: temperature/relative humidity sensor, model S-THB-M008 sensor (Onset Computer Corporation, Bourne, MA, USA), with 40–75 °C temperature measurement range, ± 0.21 °C accuracy over the range 0–50 °C, and 0%–100% relative humidity range, and ± 2.50% accuracy from 10% to 90% RH.
  • Fresh air temperature at air inlets ( T ac ): negative temperature coefficient type sensors, model 107 sensor (Campbell Scientific Ltd., Loughborough, United Kingdom), with −35–50 °C measurement range and a thermistor interchangeability error of < ± 0.20 °C over the range 0–50 °C.
  • Average temperatures measured with temperature probe model 107 were stored in a CR-10X datalogger (Campbell Scientific Ltd., Loughborough, United Kingdom).
  • Average C NH 3 , RH az , T az , and the voltage and intensity supplied to the fan were stored in one HOBO H-22 datalogger (Onset Computer Corporation, Bourne, MA, USA).
All the variables were sampled at 1-s intervals and stored every 600 s.
The sensors used to measure relative humidity ( RH az ), NH3 concentration ( C NH 3 ) and temperature in the animal-occupied zone ( T az ) were installed in a central pen at 0.40 m height inside a metal structure that protected the equipment against aggressions from animals (Figure 1). The sensor used to measure air temperature at the corridor outside the room ( T ac ) was installed in the air inlet at 2.40 m height (Figure 1). Air temperature at the corridor outside the room ( T ac ) and outdoor temperature ( T ao ) were the variables used to characterize outdoor climate. Outdoor temperature data were provided by Meteogalicia public weather station network, particularly by Abegondo weather station (43°24′14″ N, 8°26′22″ W; elevation: 94 m).

2.2. Mathematical Analysis

We estimated the average NH3 concentration at each setpoint temperature every ten minutes, which provided an average daily evolution pattern that was fitted by least squares setting (LSS) using the following equation:
C N H 3 ( t ) = A s i n ( ω t + φ ) + B
where:
C N H 3 : NH3 concentration (ppm)
A: amplitude (ppm)
ω: angular frequency (rad min−1)
φ: initial phase angle (rad)
B: independent variable or vertical shift (ppm)
To fit the series of values of NH3 concentrations to Equation (1), we derived the characteristic values of A, ω, φ, and B from the following equations:
A = C N H 3 M A X C N H 3 M I N 2
ω = 2 π T = 4.36 E 3
φ = ω t 0
B = C N H 3 A V E = 1 n C N H 3 i n
where:
C N H 3 M A X : maximum NH3 concentration in the animal-occupied zone (ppm)
C N H 3 M I N : minimum NH3 concentration in the animal-occupied zone (ppm)
T: period of the wave, 1440 min
t0: time during which the wave takes the average value (min)
B = C N H 3 A V E : daily average NH3 concentration in the animal-occupied zone (ppm)
Time, t0, was considered positive if the wave was advanced or negative if the wave was delayed. Initial time was obtained from experimental data, which was used to maximize the coefficient of determination R2 for fitting data to the sine wave function.
The goodness of fit was defined by the coefficient of determination (R2), the root mean square error (RMSE), and the standard deviation of the error (SDE), in ppm. The equations for RMSE and SDE can be written as:
R M S E = ( 1 N 1 N ( C N H 3 C C N H 3 M ) 2 ) 0.5
S D E = [ 1 N ( 1 N ( C N H 3 C C N H 3 M ) 2 ( 1 N ( C N H 3 C C N H 3 M ) ) 2 ) ] 0.5
where:
N: number of observations
C N H 3 C : estimated NH3 concentration (ppm)
C N H 3 M : measured NH3 concentration (ppm)
In addition, fast Fourier transform (FFT) was used for harmonic analysis. Before applying the FFT, the additive time series was decomposed into the trend, seasonal, and random components. FFT was applied only to the seasonal component of the series, which provided a good representation of the average of the analyzed days. The trend component was determined by using a moving average and was then subtracted from the series. The seasonal part was computed by averaging for each time of the day over all days. Finally, the random component was the remaining part of the original time series.

3. Results

We analyzed the daily evolution of NH3 concentrations in the animal-occupied zone of a weaner building where pigs were reared for 44 days, from 5.36 kg to 20.34 kg average live weight. Since thermal requirements during this phase are strict and changing, setpoint temperature was modified according to the usual production process. The days in which setpoint temperature was changed were not considered in the analysis insofar as two different temperatures were used during the same day to control the heating and ventilation systems.
The analyzed days were grouped according to setpoint temperature (Table 2). Overall, average NH3 concentrations decreased with the decrease in setpoint temperature and ranged between 3.79 and 0.30 ppm for 26 and 23 °C, respectively. However, at a setpoint temperature of 25 °C, the average NH3 concentration was 5.24 ppm. A sharp decrease in NH3 concentrations was observed when setpoint temperature decreased from 25 to 24 °C. Such a decrease was caused by a change in setpoint temperature that was related to the increase in the ventilation rate. NH3 concentrations were within the established limits [20,21,22,23].
Relative humidity and average NH3 concentration showed an inverse behavior at all setpoint temperatures, which was fitted by the least squares method to a potential function (Figure 2).
The daily evolution of NH3 concentration (Figure 3) was fitted to a sine wave function by the least squares method and FFT method. In the fast Fourier transform, a decomposition of the additive time series (Figure 4) was performed, and only the seasonal component was considered. The FFT determined the amplitude (A), the initial phase angle (φ), and the average value (B) of the sine wave. Table 3 summarizes the values obtained at every setpoint temperature (Figure 5).
The amplitude of the sine wave function decreased with the decrease in setpoint temperature because of the lower NH3 levels. However, the values obtained at setpoint temperatures of 26 °C and 25 °C were almost identical, whereas amplitude decreased dramatically at lower setpoint temperatures. The LSS model showed a greater wave amplitude than the FFT model at all setpoint temperatures. Moreover, air temperature in the animal-occupied zone was higher than the setpoint temperature in all cases, with values above 1.50 °C (Table 2).
The initial phase angle was positive for setpoint temperatures of 26 °C and 25 °C, and negative for 24 °C and 23 °C. For 26 °C and 25 °C, the initial NH3 concentration was higher than the average NH3 concentration by 19% and 22%, respectively. For setpoint temperatures of 24 °C and 23 °C, the initial concentrations were 15% and 34% lower than the average concentrations, respectively.
The statistics included in Table 4 show the goodness of fit of the sine wave pattern to the daily evolution of NH3 concentrations in weaner buildings based on setpoint temperature, using LSS and FFT.
The goodness of fit of the data to a sinusoidal function was characterized by the coefficient of determination, R2, which showed reasonable values, in the range 0.71–0.93 at setpoint temperatures of 23 and 26 °C, respectively. R2 values increased with ST, which suggest a better fit and greater variations for high NH3 concentrations. These findings were supported by other statistics, such as the standard deviation of the error (SDE), which was in the range 0.70–0.09. As SDE and RMSE were identical, mean errors were null. The values of R2 were almost identical in both methods, whereas SDE and RMSE values suggest a better estimation of NH3 evolution by FFT.

4. Discussion

The air temperatures recommended for weaned piglets housed in pens with plastic slatted floors range between 30–32 °C for 5 kg live weight and 19–25 °C for 20 kg live weight [40,41]. Many authors [5,32,52] have related the effect of setpoint temperature on NH3 concentration with the influence of setpoint temperature on ventilation and, consequently, on NH3 extraction from the building. During approximately the first two weeks of weaning, which correspond to the critical period [39], the setpoint temperatures were 26 °C and 25 °C and ventilation was highly restricted by reducing the fan air inlet section due to the strict thermal requirements for pig growth and the sensitivity of weaners to air currents. The highest NH3 concentrations occurred during this period. During the postcritical period, when regular food intake was already established [39], setpoint temperatures decreased to 24 and 23 °C, and ventilation restrictions were lower, which led to a substantial decrease in average NH3 concentration, from 5.24 ppm (critical period) to 1.00 ppm (postcritical period) for setpoint temperatures of 25 °C and 24 °C, respectively, as shown in Table 2. In addition, air temperature in the animal-occupied zone (Taz) was always above setpoint temperature, with variations between 2.07 and 1.56 °C for setpoint temperatures of 26 and 23 °C, respectively, which shows the thermal inertia of the heating system. These findings suggest a better performance of the environmental control system at lower setpoint temperatures.
Since NH3 density is lower than air density, NH3 settled in the upper areas of the room and was easier to extract than other gases such as CO2, which concentrated in the lowest areas. Accordingly, NH3 concentration patterns were strongly influenced by ventilation, which, in turn, was affected by setpoint temperatures, which were in the range 26–23 °C and decreased with the increase in animal age and weight.
Average NH3 concentration and relative humidity showed an inverse behavior (Figure 2). This is in agreement with Banhazi [38], who demonstrated that NH3 levels are more closely related to evaporation levels than to ventilation rates and that evaporation levels are at the maximum at higher temperatures. However, the small margins of relative humidity in this study (57%–61%) and the sensor accuracy (± 2.50%) do not allow a strong relationship to be established between the relative relationship and the NH3 concentration.
Many authors have reported higher measured NH3 concentrations than the concentrations reported here due to factors such as animal age and weight [32,38,50], ventilation system [35], cleaning system [32], location, climate [34,38], or season of the year [35,38]. The values reported by other authors were above the values obtained during the last phase of our research, during which the conditions for pigs with a weight of approximately 20 kg came nearer to the conditions that are usual for finishing pigs, with NH3 levels of 0.30 ± 0.48 ppm at 23 °C setpoint temperature.
The daily evolution of NH3 concentrations observed in our research differs considerably from the pattern observed under laboratory conditions for finishing pigs in rooms ventilated with negative pressure systems [32]. Such differences may be due mainly to the use of dissimilar ventilation and cleaning systems. In the experimental test conducted, the forced ventilation system effectively removed NH3 at midday, thus avoiding a trend of NH3 concentration parallel to that of air temperature. In addition, daily manure removal abruptly affected the daily evolution of NH3 concentration [32], which did not happen in our study.
The results of our experimental test suggest a sinusoidal response of the daily evolution of NH3 concentration, which is in agreement with the results reported for rabbits [47]. Likewise, a sinusoidal response was found for daily NH3 concentration, which was directly related to odor and pollutant emission from finishing pigs [31]. Saha et al. [50] incorporated the daily activity of pigs into the model as a sine wave equation to predict NH3 emissions from dairy livestock with natural ventilation and found that including the sine and cosine of circular variables such as the hours of the day, days of the year, and wind direction improved the dynamic nature of the models used to predict NH3 emissions. Similarly, clear sine patterns were found for the daily emission of NH3 for broilers [48].
The daily evolution of NH3 concentration in weaner buildings showed a similar pattern to the pattern obtained by Calvet et al. [47], with maximum values at night, when ventilation rates were minimum and minimum values during the day, when ventilation rates were maximum. Therefore, the sinusoidal response was strongly conditioned by the ventilation rates inside the building, which was controlled exclusively by indoor temperature. This pattern affected NH3 emission, which followed the opposite trend to NH3 concentration and increased with the increase in ventilation rates. As a result, NH3 emission was higher during the daytime [48,50].
Overall, a decrease in setpoint temperature caused a decrease in the amplitude of the modeled sine wave function and a delay in the wave. However, we observed only a small difference in amplitude when fitting the model to temperatures of 26 °C and 25 °C, around 2.70 ppm. Yet, amplitude sharply decreased at lower setpoint temperatures (0.33 ppm at 23 °C), when higher ventilation rates are allowed because of the lower sensitivity of weaners to air currents. This is in agreement with high temperatures leading to considerable NH3 emissions, which increase when combined with high pH levels in bedding material [54], although this not the case.
SDE was the main component of the error because the bias was null insofar as the mean of the experimental data coincided with the mean of the sinusoidal curve obtained in one period (1440 min). From among the two methods used, FFT showed a better sine fit than LSS, probably because the FFT used only the seasonal component of the series and neglected the trend component (Figure 4). Figure 5 shows the better fit of FFT, confirmed by statistics.

5. Conclusions

The following conclusions can be drawn:
  • NH3 concentration in the animal-occupied zone varies with the temperature setpoint defined for the climate control system. At night, when air temperature is lower, the ventilation rate decreases, which causes an increase in NH3 concentration. The increase in outdoor temperature during the daytime causes an increase in the ventilation rate and, consequently, in the rate of gas removal.
  • The daily sine wave for NH3 concentrations provides a reliable pattern at every setpoint temperature, with R2 values between 0.93 and 0.71 for the two methods used, LSS and FFT. The FFT method showed a better sine fit, with RMSE values below 0.55 ppm as compared to 0.70 ppm in the LSS method. This occurs because the trend component of the series is neglected and only the seasonal component is considered. With the decrease in setpoint temperature, the amplitude of the wave diminishes and, generally, the sine wave is delayed. These sine waves were obtained by using inexpensive electrochemical sensors that could be easily incorporated in livestock farms. Our results show that these sensors, if maintained properly, can accurately represent the daily evolution of NH3 concentration.
  • The use of sine wave equations to estimate NH3 concentrations can be beneficial for farmers, insofar as sine wave equations provide a reliable pattern for real-time estimation of NH3 concentration and can be included as a parameter in control strategies considering daytime. In addition, sine wave equations can be implemented in many conventional controllers because of their simplicity. Sine wave equations based on setpoint temperatures could be useful for real-time environmental control, which would substantially improve animal welfare.

Author Contributions

Conceptualization, M.R.R. and M.D.F.; methodology, M.R.R., E.L., and R.B.; formal analysis, M.D.F., J.A.O., and T.A.; investigation, R.V., M.R.R., and M.D.F.; writing—original draft preparation, review, and editing, M.R.R. and M.D.F. All authors have read and agreed to the published version of the manuscript.

Funding

This research was funded by Xunta de Galicia, grant number GPC-ED431B 2018/012.

Conflicts of Interest

The authors declare no conflicts of interest.

References

  1. Bjerg, B.; Norton, T.; Banhazi, T.; Zhang, G.; Bartzanas, T.; Liberati, P.; Cascone, G.; Lee, B.; Marucci, A. Modelling of ammonia emissions from naturally ventilated livestock buildings. Part 1: Ammonia release modelling. Biosyst. Eng. 2013, 116, 232–245. [Google Scholar] [CrossRef]
  2. Blanes–Vidal, V.; Nadimi, E.S.; Ellermann, T.; Andersen, H.V.; Løfstrøm, P. Perceived annoyance from environmental odors and association with atmospheric ammonia levels in non–urban residential communities: A cross–sectional study. Environ. Health 2012, 11, 11–27. [Google Scholar] [CrossRef] [Green Version]
  3. Saha, C.K.; Zhang, G.; Kai, P.; Bjerg, B. Effects of a partial pit ventilation system on indoor air quality and ammonia emission from a fattening pig room. Biosyst. Eng. 2010, 105, 279–287. [Google Scholar] [CrossRef]
  4. Ye, Z.; Zhang, G.; Li, B.; Strøm, J.S.; Dahl, P.J. Ammonia emissions affected by airflow in a model pig house: Effects of ventilation rate, floor slat opening, and headspace height in a manure storage pit. Trans. ASABE 2008, 51, 2113–2122. [Google Scholar] [CrossRef]
  5. Ni, J.Q.; Heber, A.J.; Lim, T.T. Ammonia and hydrogen sulphide in swine production. In Air Quality and Livestock Farming; CRC Press: Florida, FA, USA, 2018; pp. 69–88. [Google Scholar]
  6. Zhang, G.; Strøm, J.S.; Li, B.; Rom, H.B.; Morsing, S.; Dahl, P.; Wang, C. Emission of ammonia and other contaminant gases from naturally ventilated dairy cattle buildings. Biosyst. Eng. 2005, 92, 355–364. [Google Scholar] [CrossRef]
  7. Cheng, Z.; O’Connor, E.A.; Jia, Q.; Demmers, T.G.M.; Wathes, C.M.; Wathes, D.C. Chronic ammonia exposure does not influence hepatic gene expression in growing pigs. Animal 2014, 8, 331–337. [Google Scholar] [CrossRef] [PubMed] [Green Version]
  8. Done, S.H.; Chennells, D.J.; Gresham, A.C.J.; Williamson, S.; Hunt, B.; Taylor, L.L.; Bland, V.; Jones, P.; Armstrong, D.; White, R.P.; et al. Clinical and pathological responses of weaned pigs to atmospheric ammonia and dust. Vet. Rec. 2005, 157, 71–80. [Google Scholar] [CrossRef] [PubMed]
  9. Drummond, J.G.; Curtis, S.E.; Simon, J.; Norton, H.W. Effects of aerial ammonia on growth and health of young pigs. J. Anim. Sci. 1980, 50, 1085–1091. [Google Scholar] [CrossRef] [Green Version]
  10. Hamilton, T.D.C.; Roe, J.M.; Hayes, C.M.; Webster, A.J.F. Effects of ammonia inhalation and acetic acid pretreatment on colonization kinetics of toxigenic Pasteurella multocida within upper respiratory tracts of swine. J. Clin. Microbiol. 1998, 36, 1260–1265. [Google Scholar] [CrossRef] [Green Version]
  11. O’Connor, E.A.; Parker, M.O.; McLeman, M.A.; Demmers, T.G.; Lowe, J.C.; Cui, L.; Davey, E.L.; Owen, R.C.; Wathes, C.M.; Abeyesinghe, S.M. The impact of chronic environmental stressors on growing pigs, Sus scrofa (Part 1): Stress physiology, production and play behaviour. Animal 2010, 4, 1899–1909. [Google Scholar] [CrossRef] [Green Version]
  12. Parker, M.O.; O’Connor, E.A.; McLeman, M.A.; Demmers, T.G.M.; Lowe, J.C.; Owen, R.C.; Davey, E.L.; Wathes, C.M.; Abeyesinghe, S.M. The impact of chronic environmental stressors on growing pigs, Sus scrofa (Part 2): Social behaviour. Animal 2010, 4, 1910–1921. [Google Scholar] [CrossRef] [PubMed] [Green Version]
  13. Von Borell, E.; Özpinar, A.; Eslinger, K.M.; Schnitz, A.L.; Zhao, Y.; Mitloehner, F.M. Acute and prolonged effects of ammonia on hematological variables, stress responses, performance, and behavior of nursery pigs. J. Swine Health Prod. 2007, 15, 137–145. [Google Scholar]
  14. Wathes, C.M.; Demmers, T.G.M.; Teer, N.; White, R.P.; Taylor, L.L.; Bland, V.; Jones, P.; Armstrong, D.; Greshan, A.C.J.; Hartung, J.; et al. Production responses of weaned pigs after chronic exposure to airborne dust and ammonia. Anim. Sci. 2004, 78, 87–97. [Google Scholar] [CrossRef]
  15. COUNCIL DIRECTIVE of 19 November 1991 laying down minimum standards for the protection of pigs (91/630/EEC). Off. J. Eur. Comm. 1991, L340, 33–38.
  16. International Commission of Agricultural and Biosystems Engineering. CIGR 4th Report of working group climatization of animal houses: Heat and moisture production. In The International Commission of Agricultural Engineering, Section II; Research Centre Bygholm: Horsens, Denmark; Danish Institute of Agricultural Sciences: Tjele, Denmark, 2002. [Google Scholar]
  17. Bottcher, R.; Mathis, S.; Roberts, J. Monitoring air quality with instruments. In Proceedings of the North Carolina Healthy Hogs Seminar; North Carolina Cooperative Extension Service: Raleigh, NC, USA, 2001; p. 10. [Google Scholar]
  18. Cargill, C.; Murphy, T.; Banhazi, T. Hygiene and air quality in intensive housing facilities in Australia. Animal Prod. Aust. 2002, 24, 387–393. [Google Scholar]
  19. Donham, K.; Thorne, P.; Breuer, G.; Powers, W.; Marquez, S.; Reynolds, S. Exposure limits related to air quality and risk assessment. In Iowa Concentrated Animal Feeding Operations Air Quality Study; Iowa State University and The University of Iowa Study Group: Ames, IA, USA, 2002; p. 164. [Google Scholar]
  20. Krupa, S.V. Effects of atmospheric ammonia (NH3) on terrestrial vegetation: A review. Environ. Pollut. 2003, 124, 179–221. [Google Scholar] [CrossRef]
  21. Schauberger, G.; Piringer, M.; Mikovits, C.; Zollitsch, W.; Hörtenhuber, S.J.; Baumgartner, J.; Niebuhr, K.; Anders, I.; Andre, K.; Hennig–Pauka, I.; et al. Impact of global warming on the odour and ammonia emissions of livestock buildings used for fattening pigs. Biosyst. Eng. 2018, 175, 106–114. [Google Scholar] [CrossRef]
  22. Liu, X.; Zhang, Y.; Han, W.; Tang, A.; Shen, J.; Cui, Z.; Vitousek, P.; Erisman, J.W.; Goulding, K.; Christie, P.; et al. Enhanced nitrogen deposition over China. Nature 2013, 494, 459–462. [Google Scholar] [CrossRef]
  23. Clark, C.M.; Tilman, D. Loss of plant species after chronic low–level nitrogen deposition to prairie grasslands. Nature 2008, 451, 712–715. [Google Scholar] [CrossRef]
  24. Backes, A.; Aulinger, A.; Bieser, J.; Matthias, V.; Quante, M. Ammonia emissions in Europe, part I: Development of a dynamical ammonia emission inventory. Atmos. Environ. 2016, 131, 55–66. [Google Scholar] [CrossRef] [Green Version]
  25. Backes, A.M.; Aulinger, A.; Bieser, J.; Matthias, V.; Quante, M. Ammonia emissions in Europe, part II: How ammonia emission abatement strategies affect secondary aerosols. Atmos. Environ. 2016, 126, 153–161. [Google Scholar] [CrossRef] [Green Version]
  26. Hendriks, C.; Kranenburg, R.; Kuenen, J.; van Gijlswijk, R.; Kruit, R.W.; Segers, A.; van der Gon, H.D.; Schaap, M. The origin of ambient particulate matter concentrations in the Netherlands. Atmos. Environ. 2013, 69, 289–303. [Google Scholar] [CrossRef]
  27. Geels, C.; Andersen, H.V.; Ambelas, S.C.; Christensen, J.H.; Ellermann, T.; Løfstrøm, P.; Gyldenkærne, S.; Brandt, J.; Hansen, J.B.; Frohn, L.M.; et al. Improved modelling of atmospheric ammonia over Denmark using the coupled modelling system DAMOS. Biogeosciences 2012, 9, 2625–2647. [Google Scholar] [CrossRef] [Green Version]
  28. Kryza, M.; Dore, A.J.; Błaś, M.; Sobik, M. Modelling deposition and air concentration of reduced nitrogen in Poland and sensitivity to variability in annual meteorology. J. Environ. Manag. 2011, 92, 1225–1236. [Google Scholar] [CrossRef] [PubMed]
  29. Xu, W.; Zheng, K.; Liu, X.; Meng, L.; Huaitalla, R.M.; Shen, J.; Hartung, E.; Gallmann, E.; Roelcke, M.; Zhang, F. Atmospheric NH3 dynamics at a typical pig farm in China and their implications. Atmos. Pollut. Res. 2014, 5, 455–463. [Google Scholar] [CrossRef] [Green Version]
  30. Webb, J.; Menzi, H.; Pain, B.F.; Misselbrook, T.H.; Dämmgen, U.; Hendriks, H.; Döhler, H. Managing ammonia emissions from livestock production in Europe. Environ. Pollut. 2005, 135, 399–406. [Google Scholar] [CrossRef] [PubMed]
  31. Schauberger, G.; Piringer, M.; Petz, E. Diurnal and annual variation of odour emission from animal houses: A model calculation for fattening pigs. J. Agric. Eng. Res. 1999, 74, 251–259. [Google Scholar] [CrossRef]
  32. Wang, K.; Wei, B.; Zhu, S.; Ye, Z. Ammonia and odor emitted from deep litter and fully slatted floor systems for growing–finishing pigs. Biosyst. Eng. 2011, 109, 203–210. [Google Scholar] [CrossRef]
  33. Heber, A.J.; Tao, P.C.; Ni, J.Q.; Lim, T.T.; Schmidt, A.M. Air emissions from two swine finishing building with flushing: Ammonia characteristics. In Livestock Environment VII; American Society of Agricultural and Biological Engineers: Saint Joseph, MI, USA, 2005; pp. 436–443. [Google Scholar]
  34. Koerkamp, P.G.; Metz, J.H.M.; Uenk, G.H.; Phillips, V.R.; Holden, M.R.; Sneath, R.W.; Short, J.L.; White, R.P.; Hartung, J.; Seedorf, J.; et al. Concentrations and emissions of ammonia in livestock buildings in Northern Europe. J. Agric. Eng. Res. 1998, 70, 79–95. [Google Scholar] [CrossRef]
  35. Zong, C.; Li, H.; Zhang, G. Ammonia and greenhouse gas emissions from fattening pig house with two types of partial pit ventilation systems. Agric. Ecosyst. Environ. 2015, 208, 94–105. [Google Scholar] [CrossRef]
  36. Raynor, P.C.; Engelman, S.; Murphy, D.; Ramachandran, G.; Bender, J.B.; Alexander, B.H. Effects of gestation pens versus stalls and wet versus dry feed on air contaminants in swine production. J. Agromed. 2018, 23, 40–51. [Google Scholar] [CrossRef] [PubMed]
  37. Banhazi, T.; Seedorf, J.; Rutley, D.; Pitchford, W. Identification of risk factors for sub-optimal house conditions in Australian piggeries: Part 2. Airborne Pollutants. J. Agric. Saf. Health 2008, 14, 21–39. [Google Scholar] [CrossRef] [PubMed] [Green Version]
  38. Banhazi, T.M. Seasonal, diurnal and spatial variations of environmental variables in Australian livestock buildings. Aust. J. Multi Discip. Eng. 2013, 10, 60–69. [Google Scholar] [CrossRef]
  39. Le Dividich, J.; Herpin, P. Effects of climatic conditions on the performance, metabolism and health–status of weaned piglets: A review. Livestock Prod. Sci. 1994, 38, 79–90. [Google Scholar] [CrossRef]
  40. Müirhead, M.R.; Alexander, T.J.L. Managing health and disease. In Managing Pig Health and de Treatment of Disease: A Reference for the Farm; 5M Enterprises: Sheffield, UK, 1997; pp. 55–104. [Google Scholar]
  41. Rinaldo, D.; Le Dividich, J. Assessment of optimal temperature for performance and chemical body composition of growing pigs. Livest. Prod. Sci. 1991, 29, 61–75. [Google Scholar] [CrossRef]
  42. Van Wagenberg, A.V.; Metz, J.H.M.; den Hartog, L.A. Methods for evaluation of the thermal environment in the animal–occupied zone for weaned piglets. Trans. ASABE 2005, 48, 2323–2332. [Google Scholar] [CrossRef] [Green Version]
  43. Park, J.H.; Peters, T.M.; Altmaier, R.; Sawvel, R.A.; Renée Anthony, T. Simulation of air quality and cost to ventilate swine farrowing facilities in winter. Comput. Electron. Agric. 2013, 98, 136–145. [Google Scholar] [CrossRef] [Green Version]
  44. Van Ransbeeck, N.; Van Langenhove, H.; Van Weyenberg, S.; Maes, D.; Demeyer, P. Typical indoor concentrations and emission rates of particulate matter at building level: A case study to setup a measuring strategy for pig fattening facilities. Biosyst. Eng. 2012, 111, 280–289. [Google Scholar] [CrossRef]
  45. Hamon, L.; Andrès, Y.; Dumont, E. Aerial pollutants in swine buildings: A review of their characterization and methods to reduce them. Environ. Sci. Technol. 2012, 46, 12287–12301. [Google Scholar] [CrossRef]
  46. Blanes–Vidal, V.; Hansen, M.N.; Pedersen, S.; Rom, H.B. Emissions of ammonia, methane and nitrous oxide from pig houses and slurry: Effects of rooting material, animal activity and ventilation flow. Agric. Ecosyst. Environ. 2008, 124, 237–244. [Google Scholar] [CrossRef]
  47. Calvet, S.; Cambra–López, M.; Estellés, F.; Torres, A.G. Characterization of the indoor environment and gas emissions in rabbit farms. World Rabbit. Sci. 2011, 19, 49–61. [Google Scholar] [CrossRef]
  48. Calvet, S.; Cambra–López, M.; Estellés, F.; Torres, A.G. Characterization of gas emissions from a Mediterranean broiler farm. Poult. Sci. 2011, 90, 534–542. [Google Scholar] [CrossRef] [PubMed]
  49. Philippe, F.X.; Cabaraux, J.F.; Nicks, B. Ammonia emissions from pig houses: Influencing factors and mitigation techniques. Agric. Ecosyst. Environ. 2011, 141, 245–260. [Google Scholar] [CrossRef]
  50. Saha, C.K.; Ammon, C.; Berg, W.; Fiedler, M.; Loebsin, C.; Sanftleben, P.; Brunsch, R.; Amon, T. Seasonal and diel variations of ammonia and methane emissions from a naturally ventilated dairy building and the associated factors influencing emissions. Sci. Total Environ. 2014, 468, 53–62. [Google Scholar] [CrossRef]
  51. Takai, H.; Nimmermark, S.; Banhazi, T.; Norton, T.; Jacobson, L.D.; Calvet, S.; Hassouna, M.; Bjerg, B.; Zhang, G.Q.; Pedersen, S.; et al. Airborne pollutant emissions from naturally ventilated buildings: Proposed research directions. Biosyst. Eng. 2013, 116, 214–220. [Google Scholar] [CrossRef] [Green Version]
  52. García-Ramos, F.J.; Aguirre, A.J.; Barreiro, P.; Horcas, E.; Boné, A.; Vidal, M. Applicability of Ammonia Sensors for Controlling Environmental Parameters in Accommodations for Lamb Fattening. J. Sens. 2018, 8. [Google Scholar] [CrossRef] [Green Version]
  53. MeteoGalicia. Available online: https://www.meteogalicia.gal/observacion/estacions/estacions.action?request_locale=gl# (accessed on 8 January 2019).
  54. Andersson, M. Performance of bedding materials in affecting ammonia emissions from pig manure. J. Agric. Eng. Res. 1996, 65, 213–222. [Google Scholar] [CrossRef]
Figure 1. Location of sensors used to measure the study variables.
Agronomy 10 00107 g001
Figure 2. Exponential fit of NH3 concentration and relative humidity (RH) in the animal-occupied zone.
Agronomy 10 00107 g002
Figure 3. Daily evolution of average NH3 concentration in the animal-occupied zone at 26, 25, 24, and 23 °C setpoint temperatures.
Agronomy 10 00107 g003
Figure 4. Decomposition of additive time series.
Agronomy 10 00107 g004
Figure 5. Measured (Meas.) and modeled sine fit using least squares setting (LSS) and fast Fourier transform (FFT) for daily evolution of NH3 concentration at different setpoint temperatures.
Agronomy 10 00107 g005
Table 1. Setpoint temperatures for environmental control and measurement periods.
Setpoint Temperatures (ST) (°C)
26252423
Onset date2 March8 March19 March27 March
End date6 March17 March25 March7 April
No. of days510712
Fan air inlet section (m2)0.07070.09620.12560.1963
Table 2. Statistical values of environmental variables for different setpoint temperatures.
ST (°C)CNH3 (ppm)RHaz (%) AVETaz (°C)Tac (°C) AVETao (°C) AVE
AVESDMAXMINAVEMAXMIN
263.792.486.841.385828.0729.4326.8514.5111.74
255.242.557.822.455727.8828.6225.7210.748.33
241.000.782.000.255926.5628.0224.9410.9710.69
230.300.480.720.056124.5626.3322.8711.0510.88
where:
ST: setpoint temperature
CNH3: NH3 concentration
RHaz: relative humidity in the animal-occupied zone
Taz: temperature in the animal-occupied zone
Tac: temperature at the corridor outside the room
Tao: outdoor air temperature
AVE: average
SD: standard deviation
MAX: maximum
MIN: minimum
Table 3. Characteristic values of the sinusoidal curve at different setpoint temperatures. LSS: least squares setting; FFT: fast Fourier transform.
ST (°C)MethodA (ppm)B (ppm)φ (Rad)Wave Onset Time
26LSS FFT2.73 2.083.790.26 0.3323:00 22:44
25LSS FFT2.69 2.105.240.44 0.4722:19 22:13
24LSS FFT0.87 0.601.00−0.17 −0.1400:39 00:31
23LSS FFT0.33 0.220.30−0.31 −0.3201:11 01:12
where:
ST: setpoint temperature
A: amplitude
B: independent variable or vertical variation obtained as the average daily NH3 concentration in the animal-occupied zone.
φ: initial phase angle
Table 4. Goodness of fit of the daily evolution of NH3 concentrations to a sinusoidal curve at different setpoint temperatures.
ST (°C)MethodR2SDE (ppm)RMSE (ppm)
26LSS FFT0.93 0.920.64 0.420.64 0.42
25LSS FFT0.88 0.880.70 0.550.70 0.55
24LSS FFT0.84 0.840.26 0.190.26 0.19
23LSS FFT0.71 0.710.13 0.090.13 0.09
where:
R2: coefficient of determination
ST: setpoint temperature
SDE: standard deviation of the error
RMSE: root mean square error

