Article

CitrusVol Validation for the Adjustment of Spray Volume in Treatments against Tetranychus urticae in Clementines

1
Centro de Agroingeniería, Instituto Valenciano de Investigaciones Agrarias (IVIA), CV-315, km 10.7, 46113 Moncada, Spain
2
Centro de Protección Vegetal y Biotecnología, Instituto Valenciano de Investigaciones Agrarias (IVIA), CV-315, km 10.7, 46113 Moncada, Spain
*
Author to whom correspondence should be addressed.
Agronomy 2020, 10(1), 32; https://doi.org/10.3390/agronomy10010032
Submission received: 22 November 2019 / Revised: 20 December 2019 / Accepted: 22 December 2019 / Published: 24 December 2019
(This article belongs to the Special Issue Selected Papers from 10th Iberian Agroengineering Congress)

Abstract

:
The optimization of the water volume used to apply pesticides with airblast sprayers is key to reducing water footprint, costs, operational time and drift of pesticides. This study evaluated a new tool (CitrusVol) that adjusts the spray volume to the characteristics of the vegetation and the pesticide used to control the two-spotted spider mite Tetranychus urticae in clementine trees. This mite is one of the main citrus pests because it damages fruit before harvest. For this aim, a total of 20 applications against T. urticae were evaluated during two consecutive years in seven commercial orchards. In these orchards, we evaluated: (i) the distribution of the spray in tree canopies, (ii) pest density before and after the treatment, and (iii) fruit damage at harvest when conventional volumes and volumes adjusted with CitrusVol were applied. On average, CitrusVol reduced 36% the water volume used to control T. urticae in the 20 applications. This reduction in the spray volume involved a decrease in the coverage in some parts of the canopy. However, T. urticae density and fruit damage at harvest were similar in trees treated with the adjusted volume calculated with CitrusVol and the volume used by the owners of the orchard. Therefore, the spray volume recommended by CitrusVol is adequate to control T. urticae in clementines.

1. Introduction

The two-spotted spider mite Tetranychus urticae Koch (Acari: Tetranychidae) is one of the most important citrus pests in Mediterranean citrus [1,2]. Among the different citrus varieties, clementines (Citrus clementina Hort. ex Tan.) are the most heavily affected [3]. Tetranychus urticae colonies are preferably located on the underside of the citrus leaves, where they are protected with silk threads in summer. The mite feeds on the content of the epidermal and parenchyma cells of the leaf. This feeding causes chlorotic spots (yellow) and bulging in the upperside [4]. If the infestation is high, the tree can become defoliated. At the end of the summer and fall, the mite migrates from the leaves to the fruits where it can produce scars. This cosmetic damage is considered the main damage produced by T. urticae in clemetines [3]. Although different biological control strategies have been tested during the last few years [2], acaricides are still widely used to control the mite in the Mediterranean basin [5]. Tetranychus urticae, however, is well-known for its ability to develop resistance to acaricides due to its high fertility, short life cycle, reproduction by arrhenotokous parthenogenesis, abundant food resources and high degree of polyphagy [6,7]. In addition, it has been demonstrated that tetraniquid mites develop resistance faster than predatory phytoseiids [8], which aggravates the problem, leading to outbreaks of spider mite populations when pest management is not correctly conducted.
In citrus, plant protection products (PPP) are applied with airblast sprayers and high volumes of water to cover the dense vegetation of citrus trees [9]. Higher volumes of water are generally used for pests, such as T. urticae, that feed and develop in the underside of the leaves. However, the high volumes used to control these pests are not always supported by field studies as has been demonstrated by Garcerá et al. [10].
On the other hand, even under good agricultural practices, only 45% of the spray volume is deposited in target trees while the rest is deposited in adjacent trees or lost in the ground and the atmosphere as a result of drift, evaporation and/or runoff [11]. Therefore, the use of these high volume rates may increase the risk of run-off and drift. Moreover, overuse can also lead to an increase in pest resistance to PPP, reducing their efficacy [12].
The adjustment of the water volume is a way to make rational use of PPPs and optimize applications. In Spain, as in many other countries, the quantity of PPP to be used as recommended in labels is expressed by the concentration of pesticide. Therefore, a reduction of the spray application volume results in a reduction of applied dose of pesticide per unit area because concentration is constant. Nevertheless, this reduction affects both the amount and the distribution of pesticide in the canopy, and then it is necessary to ensure that an adequate control of the pest is maintained. In this sense, several studies have shown that reducing spray volume does not decrease the efficacy of the application against citrus pests with different biology: citrus rust mite Phyllocoptruta oleivora (Ashmead) [13,14], citrus mealybug Planococcus citri Risso [15], California red scale Aonidiella aurantii Maskell [15,16], citricola scale Coccus pseudomagnoliarum (Kuwana) [17], Asian citrus psyllid Diaphorina citri Kuwayama and citrus leafminer Phyllocnistis citrella Stainton [18]. It has also been demonstrated that it is possible to reduce the volume of applications without affecting the control of fungal (citrus black spot caused by Phyllosticta citricarpa [19]) and bacterial (citrus canker (Xanthomonas citri subsp. Citri [20]) diseases.
The Valencian Institute of Agricultural Research (Instituto Valenciano de Investigaciones Agrarias, IVIA) has developed a tool (CitrusVol) to optimize the water volume of the applications with an airblast sprayer [21]. This tool adjusts the volume according to the characteristics of the vegetation (canopy volume, planting pattern, vegetation density and pruning level), the target pest and to the PPP. This tool is freely available online for citrus producers [22]. CitrusVol calculates the minimum volume necessary to deposit on the target organ of the citrus tree (leaf, trunk or fruit) to obtain the maximum efficacy. This minimum deposit was calculated from previous models determined under laboratory conditions [23,24]. The main objective of this work was to validate the CitrusVol tool for the control of the two-spotted spider mite in clementine trees under field conditions. For this aim, the efficacy of water volumes recommended by CitrusVol was compared with the efficacy of volumes used by farmers in seven orchards and during two consecutive years.

2. Materials and Methods

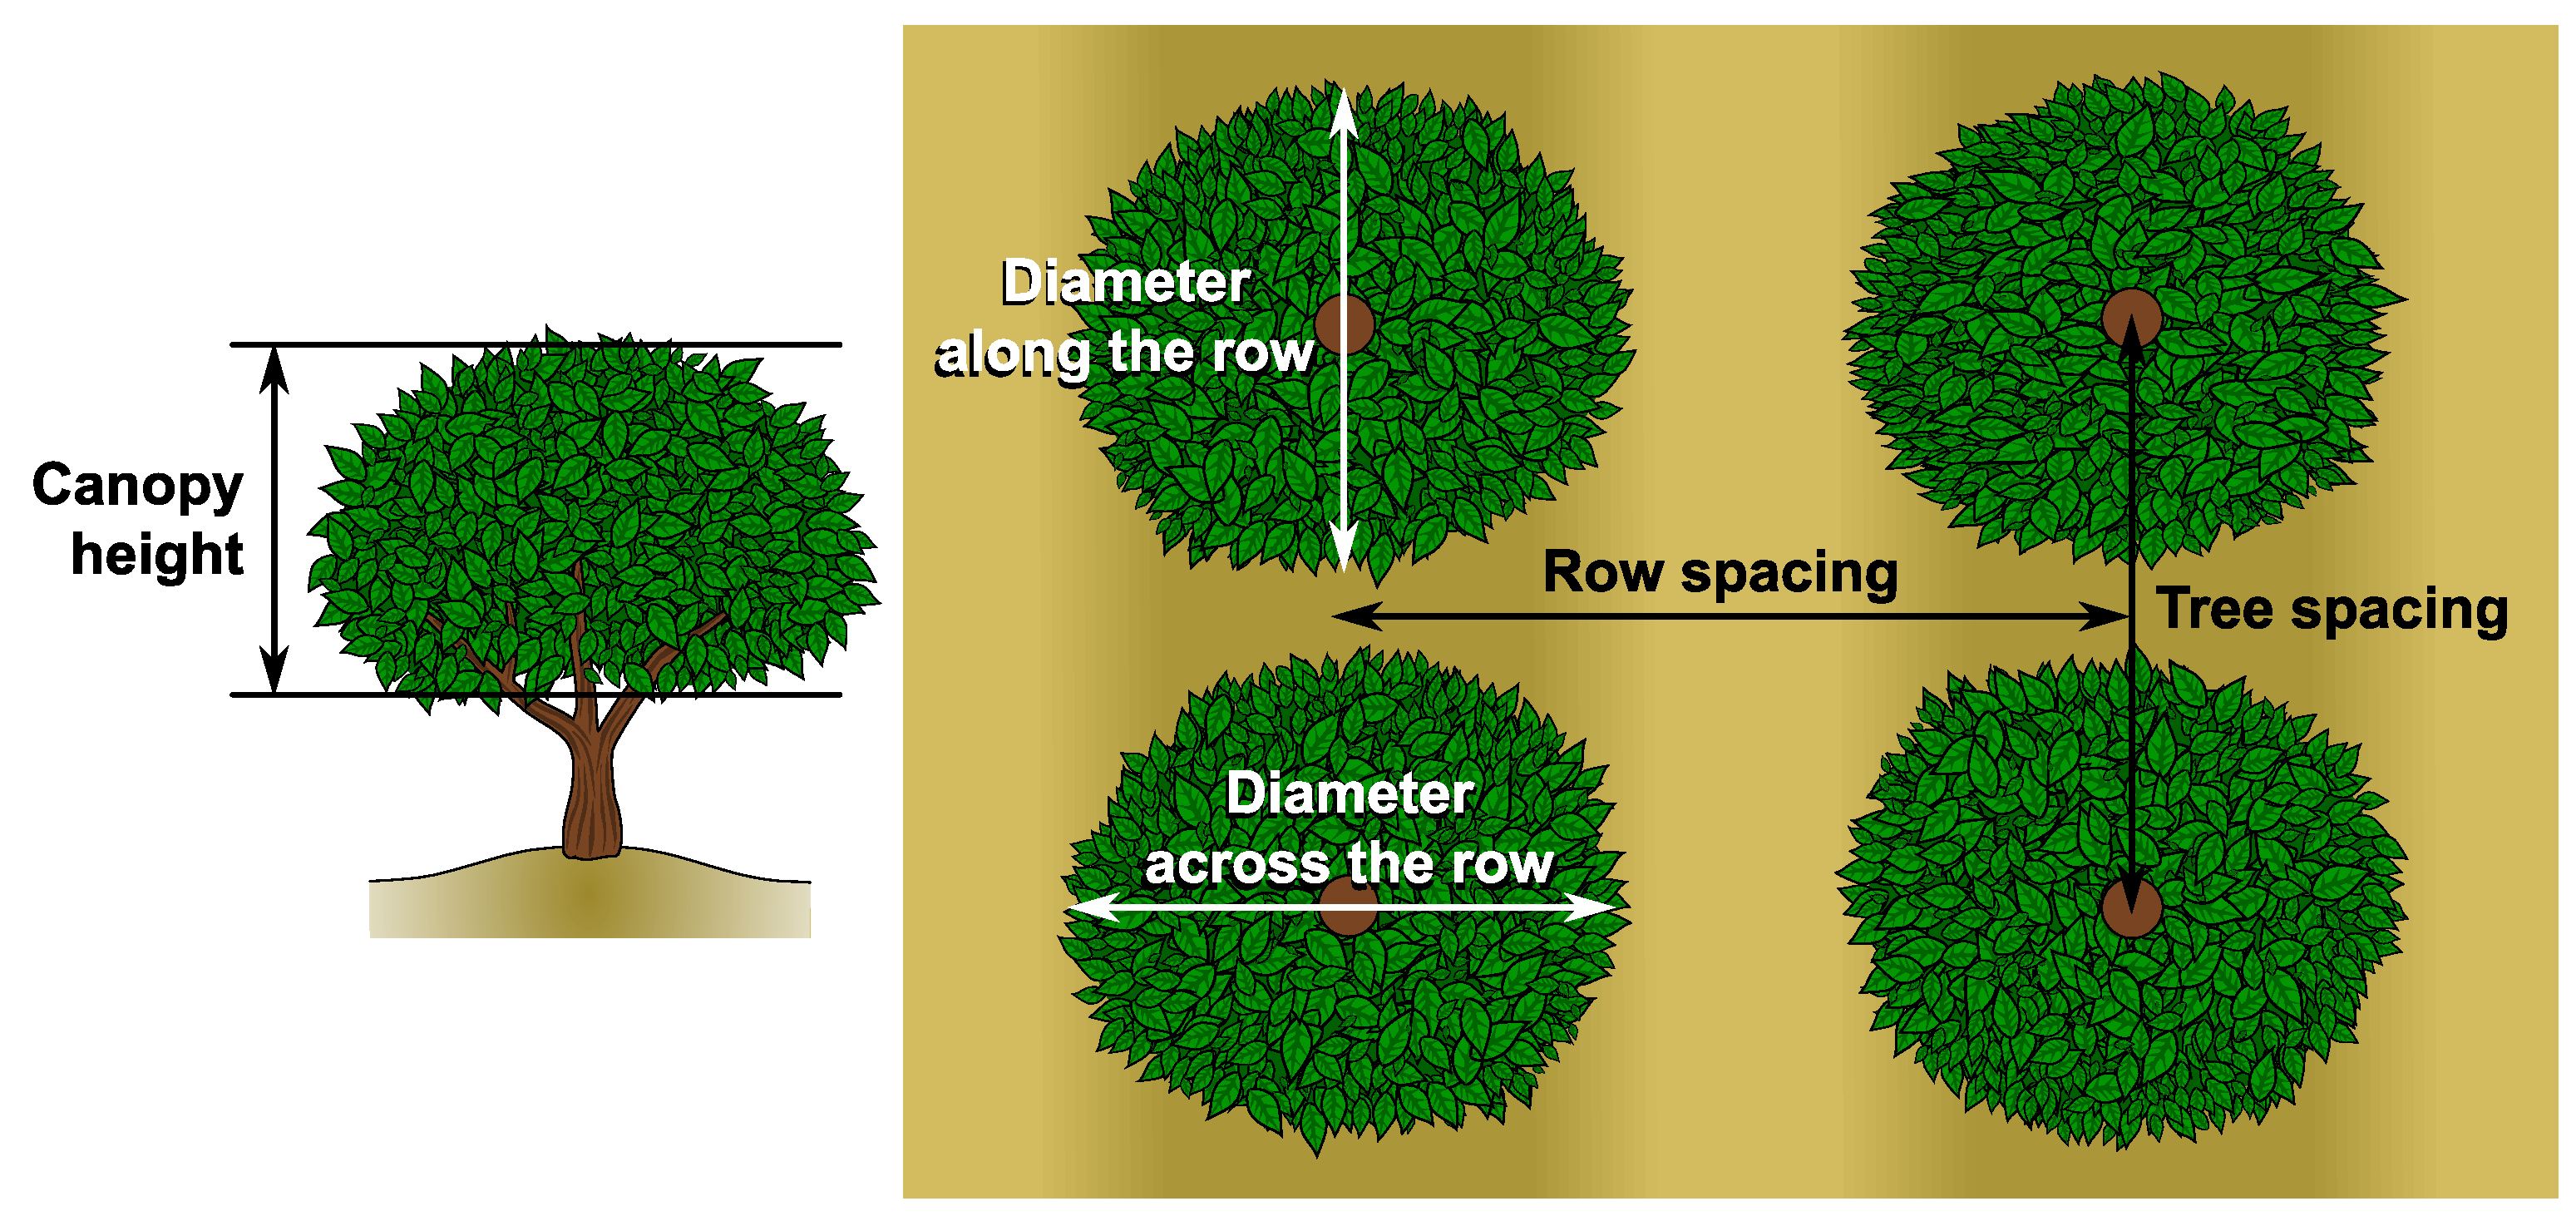
2.1. Orchards and Characterization of Vegetation

Assays were carried out in seven commercial clementine (Citrus clementina Hort. ex Tan.) orchards located in Valencia province (Spain) during two consecutive years (2016 and 2017) (Table 1). Six orchards were clementines of “Clemenules” variety and one was “Oronules” (Plot P2 in Table 1).
The size of the vegetation of each plot was estimated at the beginning of the season and after pruning. For this, 10 representative trees per plot were randomly selected and the height of the canopy, the diameter of the tree along the row, and the diameter across the row were measured (Figure 1).
The volume of vegetation was calculated considering the tree canopy as an ellipsoid according to the Equation (1).
Canopy   volume   ( m 3 ) = 1 6 π × canopy   height   ( m ) × Ø   across   the   row   ( m ) × Ø   along   the   row   ( m ) ,
In addition, vegetation density was estimated in three trees per plot. Given that they were commercial orchards, a whole tree was not defoliated, but different areas were defoliated in different trees. The defoliation zones were 18 and were the result of dividing the canopy into three heights (top, middle and bottom), two depths (inside and outside) and three widths (Figure 2). In each zone a 0.125 m3 cube was defoliated and the total amount of leaves was weighed. From each zone, a random sample of 30 leaves was weighed and digitized with the Food-Color Inspector software [25] to calculate the leaf area. In this way, the weight/leaf area ratio was determined, and the density of vegetation in each canopy zone was calculated. Averaging the value of each zone, the density of vegetation per tree was obtained. In Plot 3, only two heights were considered due to the small size of the canopies and the severe pruning.

2.2. Experimental Design

An experimental design of one factor (the spray volume) was carried out with two levels: (1) conventional volume (VC), spray volume used by the farmer; and (2) adjusted volume (VA), spray volume recommended by CitrusVol based on vegetation characteristics.
A total of 20 PPP applications against T. urticae were evaluated (five applications in 2016 and 15 in 2017). Each application was considered a replicate.
Each citrus orchard was divided into two blocks of similar size (between 0.4 and 1.35 ha, depending on the plot size). In one block, PPP were applied with the VC and in the other with the VA.
The response variables studied were: (1) the distribution of the spray in the tree canopy (percentage of coverage); (2) pest density measured as percentage of symptomatic leaves occupied by T. urticae seven, 14 and 21 days after application (DAA); and (3) fruit damage at harvest measured as the percentage of fruits with damage of T. urticae. Pest density and fruit damage is explained in detail in Section 2.4 and Section 2.5.

2.3. Description of Sprayers and Plant Protection Products (PPP) Applications

To apply the PPP in the different plots, a total of five tractors and five airblast sprayers were used (Table 2). Previous to the PPP applications, the equipment was calibrated.
The operative characteristics in terms of working pressure, forward speed and air flow rate for the different PPP applications in each plot were established based on good agricultural practices [26]. These conditions were the same in each plot and for both treatments (VA and VC) except in the application of P7 (30 June 2017) in which a different pressure was used (Table 3). The water volume used in VA applications was recommended by CitrusVol, selecting the following parameters in the web page [22]:
  • Foliar density: Medium.
  • Pruning level: Normal, except in P3 where was considered Severe (Table 1).
  • Pest/disease: Tetranychid mites.
  • Product: the active ingredient used (see Table 3).
In both treatments (VA and VC), the same trade and model of nozzles was used in each plot. To reduce the water volume in VA applications different sizes of the nozzle model and different numbers of nozzles were used (Table 3). Furthermore, the spray cloud was adjusted to the vegetation in VA. For this purpose, the nozzles were oriented and those that were not necessary were closed in order to reduce drift and product losses to the soil.
In both treatments (VA and VC) of each application, the same PPPs were used. The PPPs were selected by the technicians of the orchards. The concentration of the products was the recommended in the label (Table 3).
To determine the optimal moment to apply PPP against T. urticae, its density was monitored weekly or fortnightly (depending on the density) between June and September in the seven plots. The sampling protocol of the Spanish Citrus Integrated Pest Management guide [27] was followed. Some of the PPP applications were carried out before the treatment threshold was reached by decision of the technicians.
The meteorological conditions during the PPP applications are shown in the Appendix A (Table A1).

2.4. Distribution of the Spray in the Tree Canopy

To evaluate the distribution of the spray in the tree canopy, the percentage of coverage in different parts of the vegetation (height, depth and side of the leaf) was estimated in one PPP application of each combination of plot and year. This resulted in nine evaluations; however, one more evaluation in P2 was carried out due to the significant change in the decision of VC by the grower. Therefore, a total of 10 evaluations of the spray distribution were performed.
For this, before spraying, 72 water-sensitive papers (WSP) with a surface area of 76 × 26 mm (TeeJet, Spraying Systems Co. Wheaton, IL, USA) were placed per tree, in three trees per treatment (VA and VC). WSP were placed in the 18 zones in which the canopy was divided (Figure 2). Four WSPs were randomly placed in each zone: two in the upperside and two in the underside of the leaves. The airblast sprayer advanced spraying the trees from Width 1 to 3 on the side that the WSPs were placed, and from Width 3 to 1 on the side that there were no WSPs as shown in Figure 2.
Once the application was completed and the WSPs had dried, they were collected and kept in the proper conditions to transport them to the laboratory. After that, WSPs were digitized with a Canon EOS 700D camera (Canon Inc., Tokyo, Japan) under steady light conditions and were analyzed using a self-developed software based on Food-Color Inspector [25] to obtain the percentage of coverage. Previously the program was trained to assign some colours of the image as drops (blue) and other colours as background (yellow or green), then the program counts the number of pixels assigned as drops. Different training was used depending on the coloration of the WSPs, because when the ambient humidity was high the background of the WSP was green instead of yellow.
Coverage in each canopy zone (combination of height, depth and side of the leaf) was calculated as the average of the three widths of each zone.
The meteorological conditions during the coverage evaluations are shown in the Appendix A (Table A1).

2.5. Evaluation of Tetranychus urticae Density and Fruit Damage

2.5.1. Tetranychus urticae Density

Tetranychus urticae density was measured before and 7, 14 and 21 days after application (DAA), in both blocks of each plot in order to determine the effect of both volumes in its density levels. Tetranychus urticae density was measured as the percentage of occupied symptomatic leaves (yellowish marks). They were considered occupied when two or more adult females of T. urticae were presented in the leave. This method was selected because it is used to determine the economic threshold [28]. Forty trees were sampled in each block. In each tree, two symptomatic leaves from the middle zone of the canopy were sampled, one from the outside and another from the inside of the canopy. Trees of the contour of the plot and the rows of separation between treatment blocks were discarded.

2.5.2. Fruit Damage by Tetranychus urticae

Before harvest, the percentage of fruits with T. urticae damage was determined in each plot and in the two years of the experiment. In total, nine samplings were made (two in 2016 and seven in 2017).
For this, 10 random trees were sampled per treatment block and 40 fruits per tree were observed. In each space orientation (north, south, east and west), 10 fruits were sampled, half of them from the outside of the canopy and the other half from the inside. Three levels of damage were considered in each fruit: (1) without damage; (2) light damage (Figure 3A–C) or localized damage, mainly in the area of the apex or peduncle (sometimes at the point in contact with another fruit), this damage does not mean the fruit cannot be commercialised; and (3) severe damage (Figure 3D–F), that implies cull fruit, and can range from extensive damage in the apex and peduncle areas to damage to the entire clementine.

2.6. Data Analysis

All statistical analyses were performed with Statgraphics Centurion XVI (Manugistics Inc., Rockville, MD, USA) and Microsoft Office Excel 2016 (Microsoft Corporation, Redmond, WA, USA).
As general considerations, in all multivariate analysis of variance (MANOVA) and one-way analysis of variance (ANOVA), it was verified that the assumptions of homoscedasticity (through the Levene test) and normality (normal probability plot of the residuals) were fulfilled.
When significant differences were found, the least significant difference (LSD) test was applied for the separation of the means. The level of confidence that was considered in all the analyses was 95%.

2.6.1. Percentage of Coverage

To study the effect of spray volume two analysis were carried out, one considering the whole three canopy and the other analysing each canopy zone.
For the whole canopy tree, a MANOVA was performed to study the effect of spray volume, height, depth and leaf side on the coverage.
To study the effect of spray volume on coverage for each canopy zone (12 canopy zones combination of three heights, two depths and two sides of the leaf) an ANOVA was carried out for each canopy zone for each evaluation and considering all the evaluations.

2.6.2. Percentage of Symptomatic Leaves Occupied

To determine the effect of the spray volume on the percentage of symptomatic leaves occupied by T. urticae for the average of 20 PPP applications, an ANOVA was carried out for each sampling day at both depths of the canopy. It was necessary to transform the data with the square root of the arcsine for the normality hypothesis to be satisfied.
To study the effect of the spray volume on symptomatic leaves occupied of each application date per orchard a chi-square test with p = 0.05 was performed per each sampling day at both depths of the canopy.

2.6.3. Percentage of Fruits Damaged

The percentage of fruits damaged by T. urticae per canopy depth and level of damage for each orchard and year and considering all the orchards together was compared between treatments by using ANOVA. The arcsine square root transformation was applied to the data.

3. Results

3.1. Percentage of Coverage

In the analysis of the mean percentage of coverage considering the whole tree canopy, coverage was significantly higher for VC (67.32%) than for VA (54.56%) (F = 40.67; df = 1, 231; p < 0.001). When height, depth and leaf side were introduced as factors in the analysis, they affected the coverage through the interactions between them but not with the spray volume (Figure 4). The interaction between height and depth was significant (F = 6.41; df = 2, 231; p = 0.002). The outer part of the canopy obtained more coverage than the inner part, but in the outer part the higher coverage was obtained in the middle part followed by the bottom and finally the top part, meanwhile in the inside of the canopy the bottom part received higher coverage than the middle and the top part. The interaction between height and leaf side was also significant (F = 3.79; df = 2, 231; p = 0.024). The upperside of the leaf presented higher coverage than the underside, but in the bottom part of the canopy these differences were much higher than in the top and middle zone. Finally, the interaction between depth and leaf side was also significant (F = 11.12; df = 1, 231; p = 0.001). The differences in coverage between the upperside and underside of the leaves were higher inside the canopy than on the outside.
In the analysis of the mean percentage of coverage in each of the 12 canopy zones studied (combination of three height, two depth and two side of the leaf), considering all the evaluations, it was observed that, in all zones the percentage of coverage was higher with the VC in comparison with VA, although the differences were only significant in four zones: Top × Outside × Upperside (F = 9.03; df = 1, 19; p = 0.008), Top × Outside × Underside (F = 7.67; df = 1, 19; p = 0.013), Top × Inside × Upperside (F = 5.11; df = 1, 19; p = 0.036) and Bottom × Inside × Underside (F = 4.93; df = 1, 19; p = 0.04) (Figure 5).
The results of coverage broken down for each of the 10 evaluations (combination of plot and year) and in the different canopy zones are shown in the Appendix A (Figure A1). It can be observed than coverage higher than 20% were obtained in all canopy zones except in Top × Inside × Underside for VA in P1 (2017) (19.64%), Top × Inside × Underside for VC in P2 (2016-1) (18.69%), Middle × Inside × Underside (15.53%) and Bottom × Inside × Underside (11.99%) for VA in P2 (2017), Middle × Inside × Underside for both volumes in P5 (2017) (VA: 17.31%; VC: 16.93%) and Top × Inside × Underside for both volumes in P6 (2017) (VA: 10.09%; VC: 17.98%).

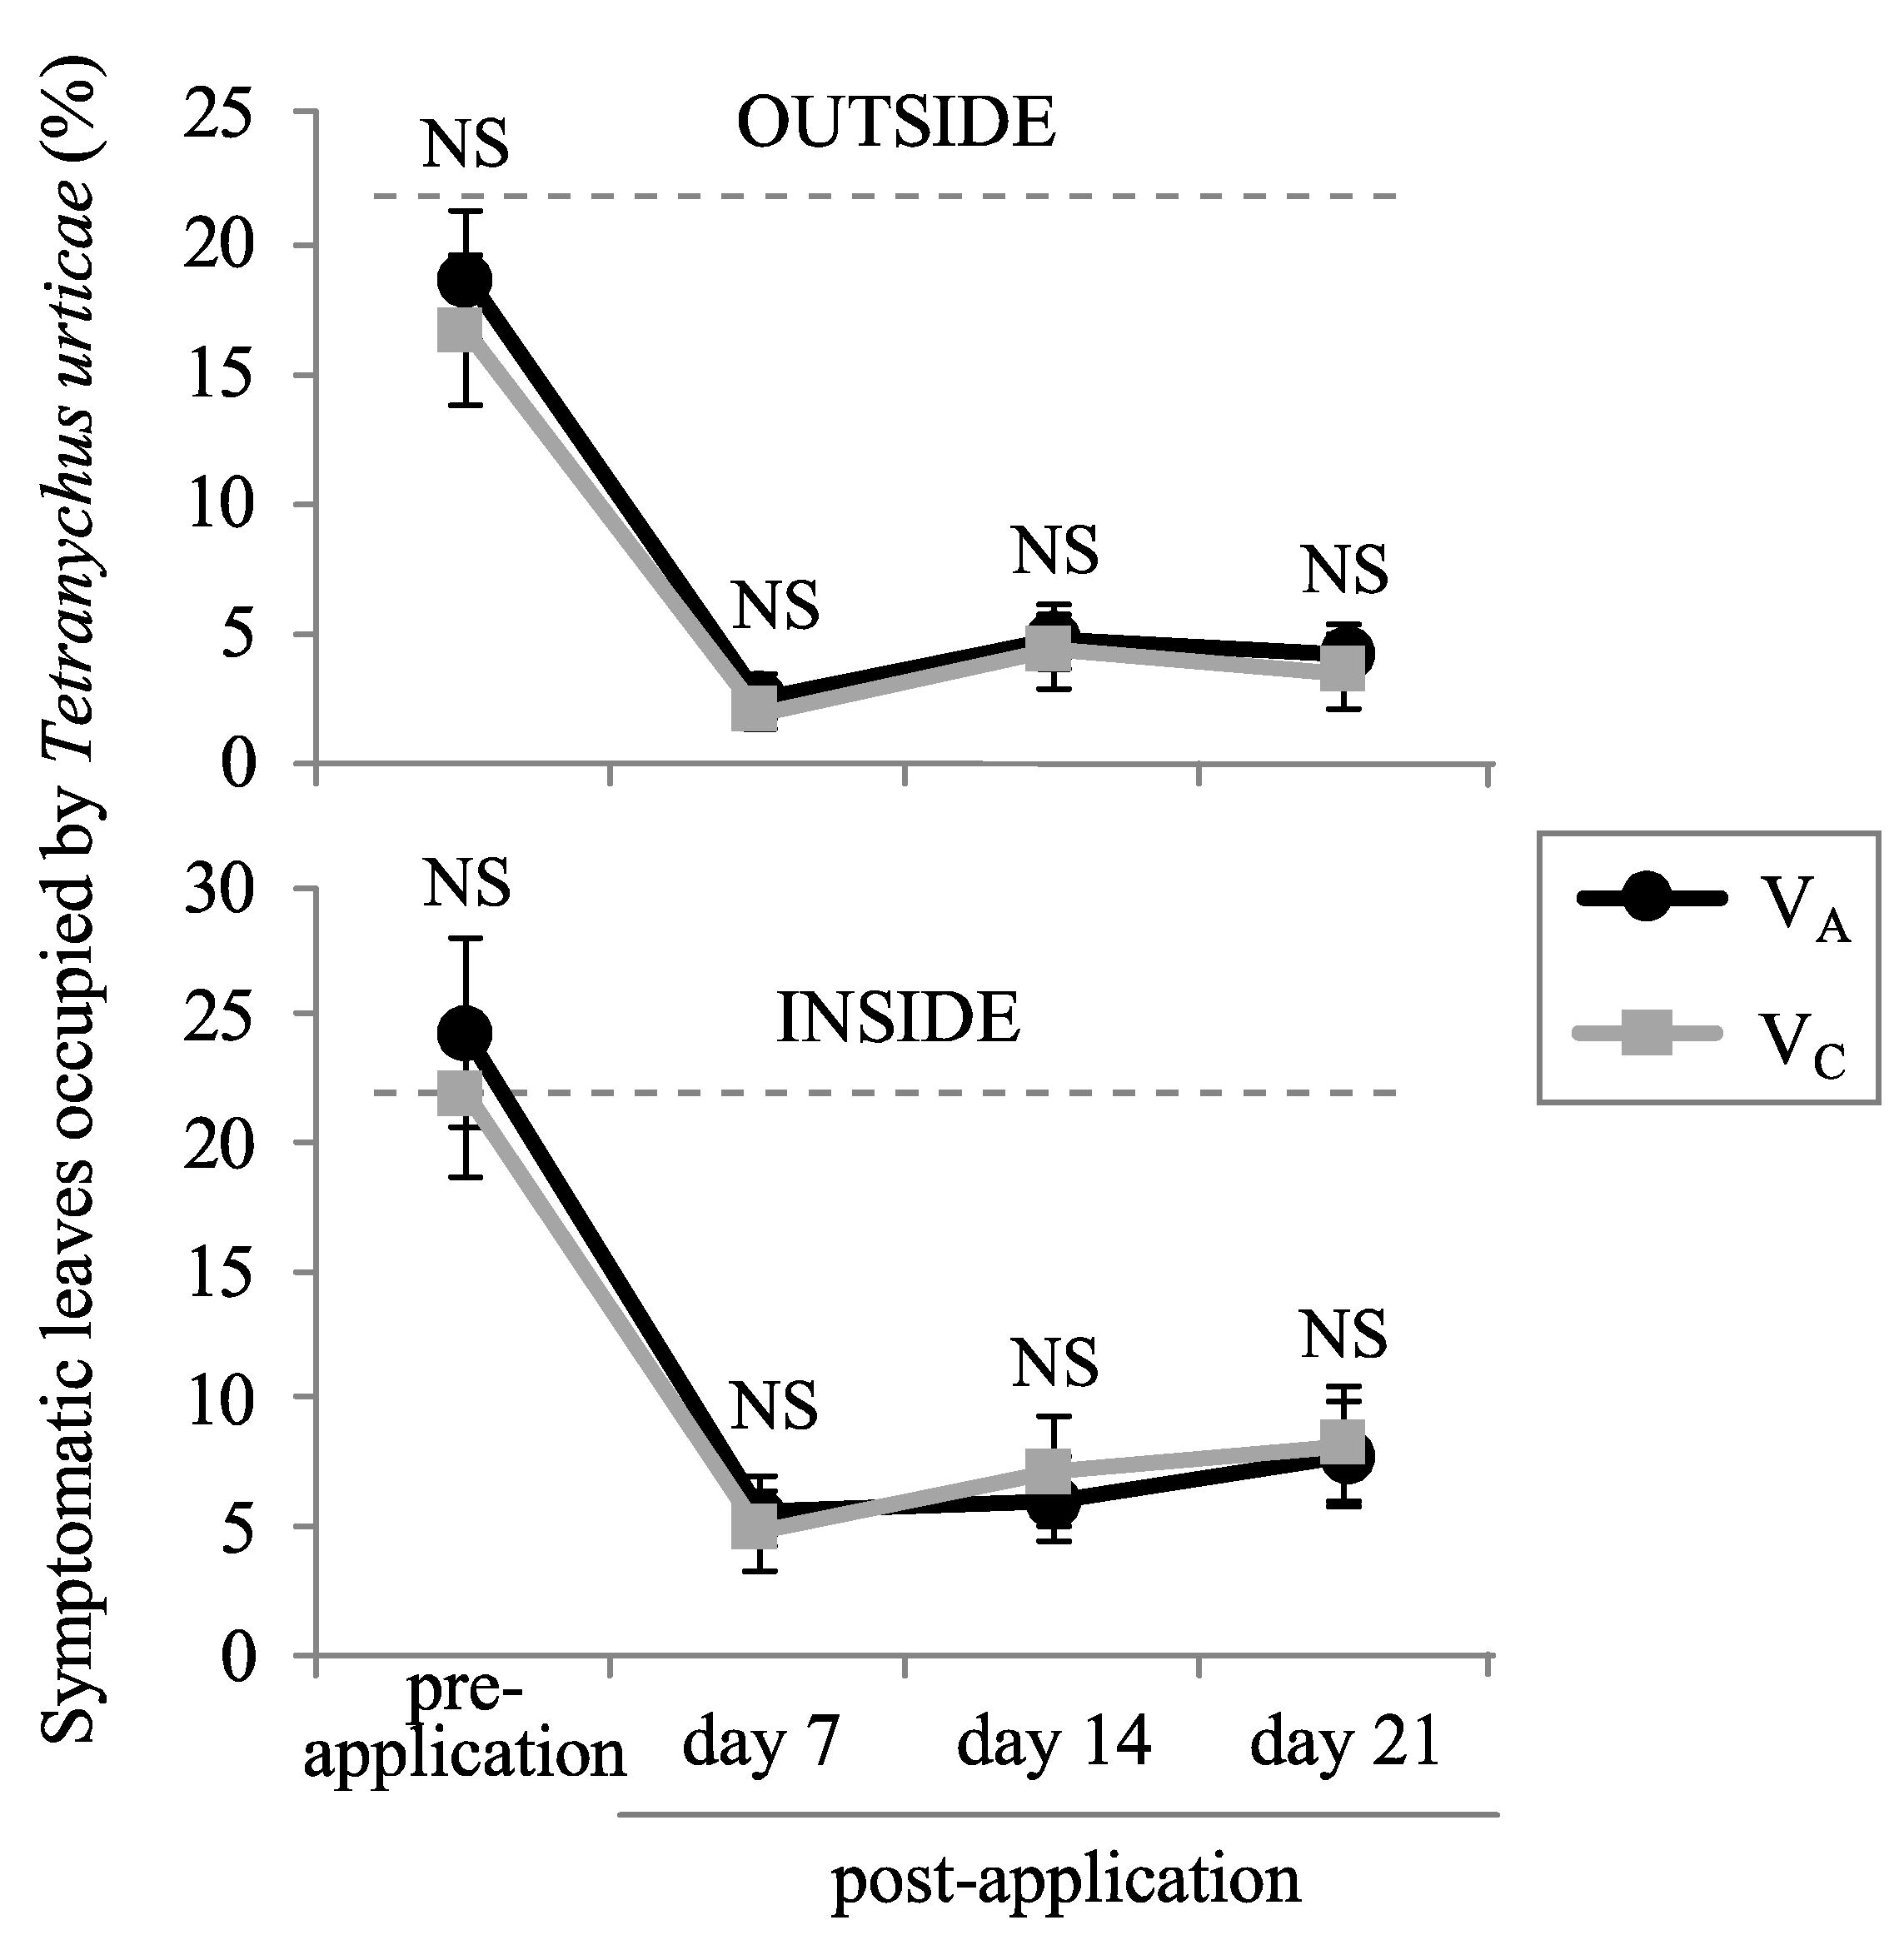
3.2. Tetranychus urticae Density

Before PPP applications, Tetranychus urticae density, measured as percentage of symptomatic leaves occupied by the mite, was similar in trees treated with the conventional and adjusted volumes on the outside of (F = 0.71; df = 1, 39; p = 0.406) and inside the canopy (F = 0.28; df = 1, 39; p = 0.602) (Figure 6).
After PPP applications, T. urticae density decreased 7 DAA in all the orchards and in both treatments. 14 and 21 DAA, mite density remained constant or increased slightly (Figure 6). T. urticae density was similar between treatments on the outside of (7 DAA: F = 0.38; df = 1, 39; p = 0.541; 14 DAA: F = 0.17; df = 1, 39; p = 0.683; 21 DAA: F = 0.67; df = 1, 37; p = 0.419) and inside the canopy (7 DAA: F = 0.08; df = 1, 39; p = 0.784; 14 DAA: F = 0.01; df = 1, 39; p = 0.924; 21 DAA: F < 0.001; df = 1, 37; p = 0.999) throughout the assay. These results are presented by plot and year in the Appendix A (Figure A2) and it can be observed that in the majority of samplings of each application, no significant differences in the percentage of symptomatic leaves occupied by T. urticae between both spray volumes were found, and when significant differences were found, in some cases there was more spider mite in VA and in others cases in VC.

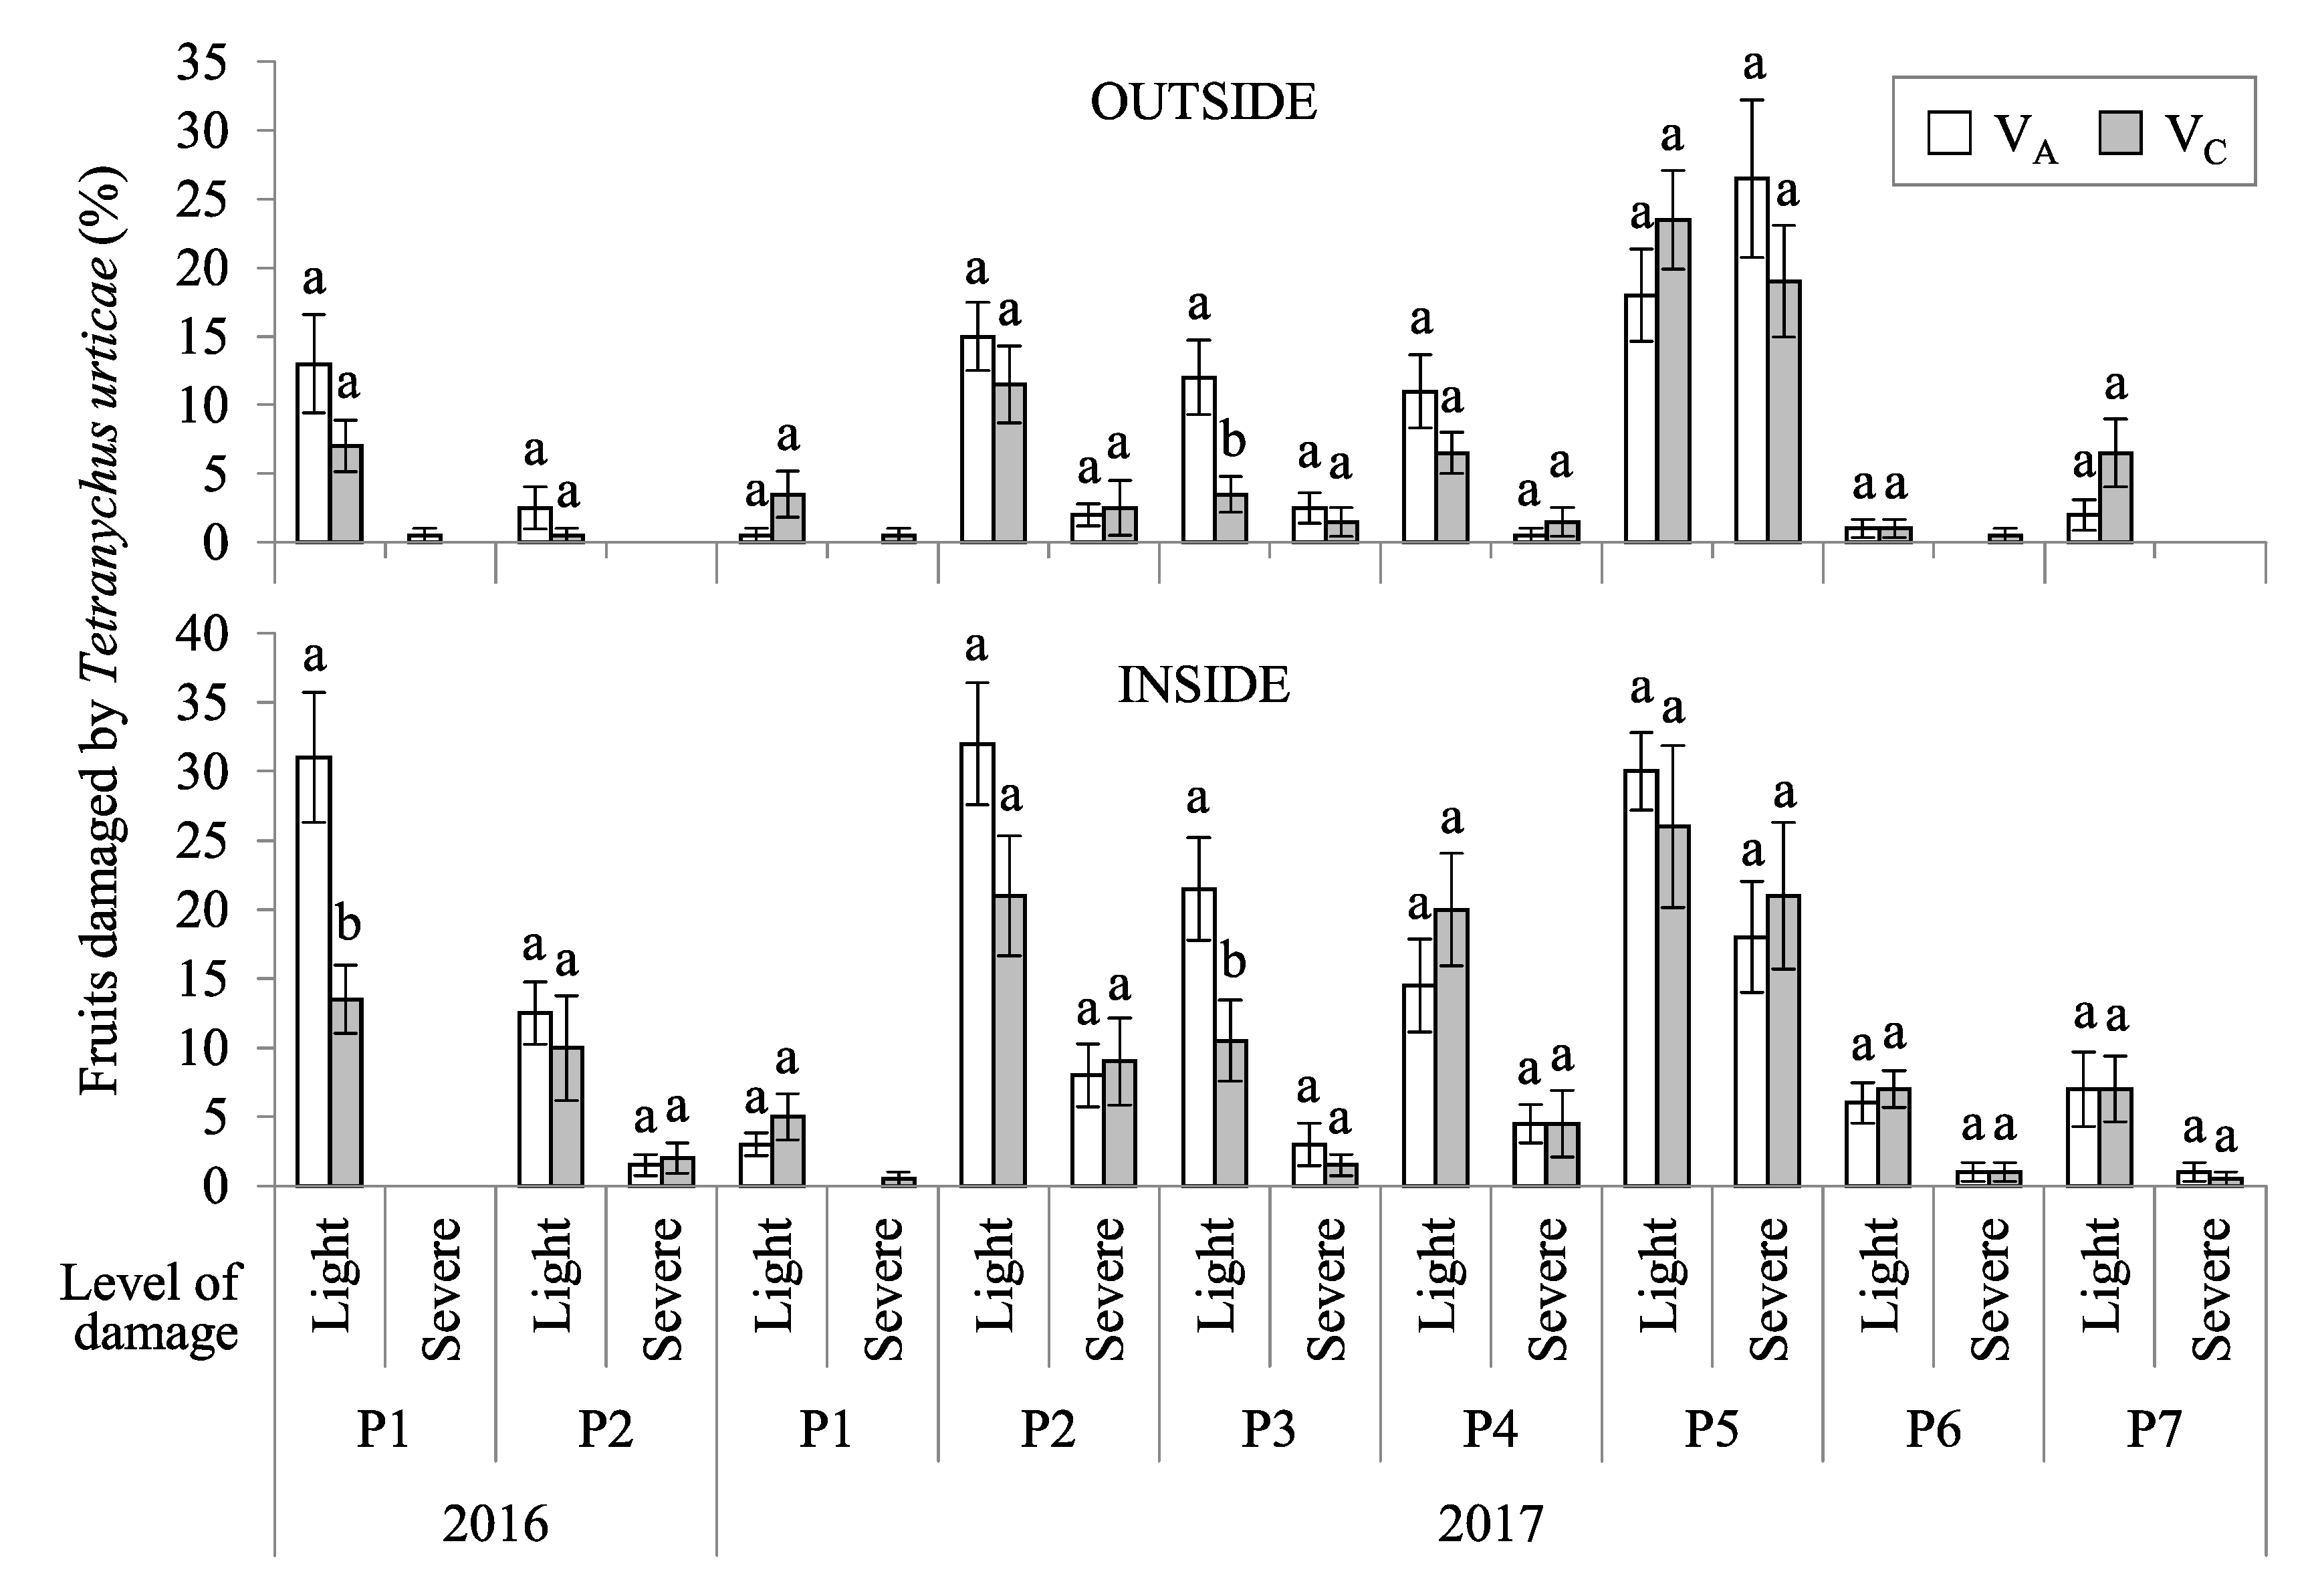
3.3. Fruit Damage by Tetranychus urticae

The mean percentage of fruits with light damage was similar in trees treated with the conventional and adjusted volume in the inside (F = 0.55; df = 1, 17; p = 0.469) and on the outside part of the canopy (F = 0.1; df = 1, 17; p = 0.754) (Figure 7). Similarly, the mean percentage of fruits with severe damage was similar in trees treated with the conventional and adjusted volume in the inside (F = 0.01; df = 1, 17; p = 0.916) and on the outside part of the canopy (F < 0.001; df = 1, 17; p = 0.984). These results are presented by plot and year in the Appendix A (Figure A3).

4. Discussion

CitrusVol reduced the spray volume used by citrus producers between 12.30% and 56.96%. On average, the reduction in seven orchards and two consecutive years was 35.71%. CitrusVol calculates the volume according to the amount of vegetation it is required to protect. This reduction in the spray volume involved a decrease in the coverage in some parts of the canopy. However, T. urticae density and fruit damage at harvest were similar in trees treated with the adjusted volume calculated with CitrusVol and the volume used by the owners of the orchard. Therefore, CitrusVol reduced the volume without affecting the efficacy of the applications. These results are based on seven orchards sampled during two consecutive years. This is in accordance with other authors who have not found differences in control levels when analysing the effect of the spray application rate on the efficacy of pesticides used in citrus [14,18,29,30,31]. Moreover, other authors who studied the influence of the application rate both on the efficacy and the distribution and coverage of the spray in the canopy at the same time, found that increasing the spray application rate did not have a significant effect on mean deposition or on the control of pest, but this approach did increase coverage uniformity [13,17].
Regardless of the spray volume used, coverage was higher on the outside of the canopy than on the inside at three heights and in both sides of the leaf. The top part of the canopy had less coverage than the middle and bottom zone. Similarly, the upperside of the leaves had more coverage than the underside. These results agree with those obtained by other authors using axial fan airblast sprayers [32,33,34,35,36,37] and with handgun hydraulic sprayers [10,37] and also indicate the necessity to improve the equipments to obtain more homogeneous coverage in all the canopy.
In general, PPP applications managed to control T. urticae in all the plots throughout the three weeks sampled. 21 DAA the percentage of symptomatic leaves occupied by T. urticae still remained below the treatment threshold. As exceptions, the applications in P1 (7 June 2017), in P3 (23 June 2017) and in P6 (10 June 2017) failed to control the spider mite independently of the volume. In these three applications, the active ingredients were abamectin, etoxazole and abamectin, respectively. Abamectin and spirodiclofen were the most used acaricides in this study. Spider mite populations remained always below the threshold when spirodiclofen was used. Wu et al. [38] found that the levels of resistance of T. urticae to etoxazole and abamectin are higher than to spirodiclofen in hop crops. In addition, it has been demonstrated that abamectin resistance correlates with the number of applications [39]. In some of plots, abamectin had been commonly used the previous years (pers. observations). This overuse of abamectine might explain why some treatments were not effective independently of the spray volume applied.
In general, the percentage of symptomatic leaves occupied by T. urticae was similar in the outside and inside part of the canopy before acaricides were sprayed. This result matches previous studies in clementines [40]. However, the percentage of fruits damaged by T. urticae was higher inside the canopy than outside. The lower coverage in the interior part of the canopy than on the exterior, independent of the volume, might explain this result. Further studies are necessary to reduce the percentage of fruits damaged in the interior part of the canopy.
When the dose expression in labels of PPP is mainly expressed as concentration, that is the case for vertical crops in EPPO (European and Mediterranean Plant Protection Organization) South of Europe zone [41], a reduction of spray volume implies a reduction of PPP. Also, it implies a reduction on the number of tank refills, and therefore a reduction of operational time and fuel consumption [21]. On the other hand, a reduction of spray volume entails a reduction in the losses of PPP to the environment (drift, soil, water) [42].
In conclusion, this work demonstrates that CitrusVol is an adequate tool for the recommendation of spray volumes to control T. urticae in clementines. It reduced the spray volume and the amount of PPP without affecting the efficacy of the applications. Consequently, CitrusVol provides a reduction of water footprint, PPP costs and operational time and the environmental impacts of pesticides.

Author Contributions

Conceptualization, C.G., A.T. and P.C.; methodology, C.G., A.T. and P.C.; validation, A.F., C.G., A.T. and P.C.; formal analysis, A.F., C.G., A.T. and P.C.; investigation, A.F.; resources, A.T. and P.C.; data curation, A.F.; writing—original draft preparation, A.F.; writing—review and editing, C.G., A.T. and P.C.; visualization, A.F.; supervision, P.C.; project administration, P.C.; funding acquisition, A.T. and P.C. All authors have read and agreed to the published version of the manuscript.

Funding

This research was funded by IVIA (internal project numbers 51422 and 51918) and by the contribution of LIFE financial instrument of the EU (Project PERFECT LIFE ref. LIFE17/ENV/ES/000205). A.F. was beneficiary of an employment contract as a part of the National Youth Guarantee System of Spain financed by the European Social Fund (ESF) and the Youth Employment Initiative (YEI).

Acknowledgments

We thank Agrimarba, S.A., Fontestad, S.A., Peiró Camaró, S.L. and Revacitrus, S.L. for the use of their citrus orchards; and Bru, P., Carrillo, I., Catalán, J. and Mateu, G. (IVIA) for the help supplied during the experiments.

Conflicts of Interest

The authors declare no conflict of interest.

Appendix A

Table A1. Meteorological conditions during the PPP applications and coverage evaluations. The precipitation was 0 mm in all cases, except for P4 26 June 2017 VA, where it was 0.02 mm. The meteorological conditions were taken from the weather stations of the Spanish SIAR (“Servicio de Información Agroclimática para el Regadío”, Agroclimatic Information Service for Irrigation) network [43].
PlotCoverage Evaluation PPP ApplicationDateTemperature (°C)Relative Humidity (%)Solar Irradiance (W/m2)Wind Speed (km/h)Wind Direction
VCVAVCVAVCVAVCVAVCVA
P1P1 (2016) 27 May 20162324575973189349SE-SE
27 July 20162527636733747425NW-N-NEN
11 October 20162520315967845658W-SWW
P1 (2017)7 June 20172321628159020861NENW-SE
24 July 20172726537336426332SE-NE-ENW-N-NE
8 September 2017242279892658922N-ENW-W-SE
P2P2 (2016-2) 26 May 20162222666881160977EE
P2 (2016-1)22 June 20162524515873057553ESE
9 August 20163128263169049954SESE
9 September 20162626717525120111NNW
P2 (2017)22 August 20172824526454631041SEW
P3P3 (2017)23 June 20172927505071235351SESE-E
3 August 20172726555620419672NNW-SW
P4P4 (2017)26 June 20172430775424184616SE-EE-NE-N
18 September 20172823274873229334SW-NW-WS-SW-W
P5 27 June 20173030505560439525SE-EE-NE
P5 (2017)19 September 20172519518869420952E-NESE-E
P6P6 (2017)10 July 20172826424866543032SE-SS-SW
23 August 20172518516835613421SW-NE-W
14 September 20172720447147023162NW-WE-NE-NW
P7 30 June 20172621223286348483WSW-NW
P7 (2017)4 August 20172729554029543824SE-N-SWE-SE-S
VC: conventional volume; VA: adjusted volume; PPP: plant protection product.
Figure A1. Mean (± standard error) coverage (%) per treatment (VA: adjusted volume, VC: conventional volume) at each height (top, middle, bottom) and depth (inside, outside) of the canopy, and side of the leaf (upperside, underside), in the different evaluations (combination of plot and year). The water volume is indicated in L/m3vegetation. Different letters above the bars within each height × depth × side combination indicate significant differences (LSD test, p < 0.05).
Agronomy 10 00032 g0a1aAgronomy 10 00032 g0a1bAgronomy 10 00032 g0a1c
Figure A2. Symptomatic leaves occupied by Tetranychus urticae (%, mean) at two depths of the canopy (outside, inside), pre-application and after the applications (at 7, 14 and 21 DAA) with two different spray volumes (VA: adjusted, VC: conventional) and in different plots (P1–P7). The water volume is indicated in L/ha and L/m3vegetation. The dotted line indicates the treatment threshold: 22% of symptomatic leaves occupied. The percentage of symptomatic leaves occupied by Tetranychus urticae in VA and VC treatments groups was compared with a chi-square test. The asterisk (*) indicates significant differences between volumes (chi-square test; p = 0.05).
Agronomy 10 00032 g0a2aAgronomy 10 00032 g0a2bAgronomy 10 00032 g0a2c
Figure A3. Fruits damaged by Tetranychus urticae (%, mean ± standard error) per treatment (VA: adjusted volume, VC: conventional volume), at two depths of the canopy (outside, inside) and in different plots (P1–P7) and years (2016 and 2017). Different letters above the bars indicate significant differences (LSD test, p < 0.05).
Agronomy 10 00032 g0a3

References

  1. Tena, A.; Garcia-Marí, F. Current situation of citrus pests and diseases in the Mediterranean basin. IOBC Bull. 2011, 62, 365–368. [Google Scholar]
  2. Jaques, J.A.; Aguilar-Fenollosa, E.; Hurtado-Ruiz, M.A.; Pina, T. Food web engineering to enhance biological control of Tetranychus urticae by phytoseiid mites (Tetranychidae: Phytoseiidae) in Citrus. In Prospects for Biological Control of Plant Feeding Mites and Other Harmful Organisms. Progress in Biological Control; Carrillo, D., de Moraes, G.J., Peña, J.E., Eds.; Springer International Publishing: Cham, Switzerland, 2015; Volume 19, pp. 251–269. ISBN 978-3-319-15042-0. [Google Scholar]
  3. Aucejo, S.; Foó, M.; Ramis, M.; Troncho, P.; Gómez-Cadenas, A.; Jacas, J.A. Evaluación de la eficacia de algunos acaricidas contra la araña roja, Tetranychus urticae Koch (Acari: Tetranychidae), en clementino. Boletín de Sanidad Vegetal Plagas 2003, 29, 453–459. [Google Scholar]
  4. Soler-Salcedo, E.; Rodrigo, E.; Ferragut, F. Colonización, comportamiento alimenticio y producción de daños en las arañas rojas Tetranychus urticae y T. turkestani (Acari, Tetranychidae). Boletín de Sanidad Vegetal Plagas 2006, 32, 523–534. [Google Scholar]
  5. Urbaneja, A.; Pascual-Ruiz, S.; Pina, T.; Abad-Moyano, R.; Vanaclocha, P.; Montón, H.; Dembilio, O.; Castañera, P.; Jacas, J.A. Efficacy of five selected acaricides against Tetranychus urticae (Acari: Tetranychidae) and their side effects on relevant natural enemies occurring in citrus orchards. Pest Manag. Sci. 2008, 64, 834–842. [Google Scholar] [CrossRef]
  6. Van Leeuwen, T.; Vontas, J.; Tsagkarakou, A.; Dermauwa, W.; Tirry, L. Acaricide resistance mechanisms in the two-spotted spider mite Tetranychus urticae and other important Acari: A review. Insect Biochem. Mol. Biol. 2010, 40, 563–572. [Google Scholar] [CrossRef] [Green Version]
  7. Dermauw, W.; Wybouw, N.; Rombauts, S.; Menten, B.; Vontas, J.; Grbic, M.; Clark, R.M.; Feyereisen, R.; Van Leeuwen, T. A link between host plant adaptation and pesticide resistance in the polyphagous spider mite Tetranychus urticae. Proc. Natl. Acad. Sci. USA 2013, 110, E113–E122. [Google Scholar] [CrossRef] [Green Version]
  8. Schmidt-Jeffris, R.A.; Beers, E.H. Potential impacts of orchard pesticides on Tetranychus urticae: A predator-prey perspective. Crop Prot. 2018, 103, 56–64. [Google Scholar] [CrossRef]
  9. Cunha, J.P.; Chueca, P.; Garcerá, C.; Moltó, E. Risk assessment of pesticide spray drift from citrus application with air-blast sprayers in Spain. Crop Prot. 2012, 42, 116–123. [Google Scholar] [CrossRef]
  10. Garcerá, C.; Moltó, E.; Chueca, P. Factors influencing the efficacy of two organophosphate insecticides in controlling California red scale, Aonidiella aurantii (Maskell). A basis for reducing spray application volume in Mediterranean conditions. Pest Manag. Sci. 2014, 70, 28–38. [Google Scholar] [CrossRef]
  11. Garcerá, C.; Moltó, E.; Chueca, P. Spray pesticide applications in Mediterranean citrus orchards: Canopy deposition and off-target losses. Sci. Total Environ. 2017, 599–600, 1344–1362. [Google Scholar] [CrossRef]
  12. Insecticide Resistance Action Committee (IRAC). General Principles of Insecticides Resistance Management from IRAC; 2013; 2p, Available online: http://www.irac-online.org/documents/principles-of-irm/ (accessed on 18 November 2019).
  13. Salyani, M.; McCoy, C.W.; Hedden, S.L. Spray volume effects on deposition and citrus rust mite control. In Pesticide Formulations and Application Systems; Hovde, D., Beestman, G., Eds.; ASTM International: West Conshohocken, PA, USA, 1989; Volume 8, pp. 254–263. [Google Scholar]
  14. McCoy, C.W.; Lye, B.H.; Salyani, M. Spray volume and acaricide rate effects on the control of the citrus rust mite. Proc. Fla. State Hort. Soc. 1989, 102, 36–40. [Google Scholar]
  15. Cunningham, G.P.; Harden, J. Sprayers to reduce spray volumes in mature citrus trees. Crop Prot. 1999, 18, 275–281. [Google Scholar] [CrossRef]
  16. Garcerá, C. Racionalización de las aplicaciones de productos fitosanitarios para el control de Aonidiella aurantii Maskell (Hemiptera: Diaspididae) en cítricos. Ph.D. Thesis, Universitat Politécnica de València, Valencia, Spain, July 2013; p. 262. [Google Scholar]
  17. Chueca, P.; Grafton-Cardwell, E.E.; Moltó, E. Influence of spray equipment and water volume on coverage of citrus and control of citricola scale, Coccus pseudomagnoliarum (Hemiptera: Coccidae) with mineral oil. J. Econ. Entomol. 2009, 102, 296–303. [Google Scholar] [CrossRef] [PubMed]
  18. Stansly, P.A.; Qureshi, J.A.; Kostyk, B.C. Effect of spray volume and sprayer type on efficacy of insecticides for control of Asian citrus psyllid and citrus leafminer on oranges: 2010. Arthrop. Manag. Tests 2011, 36, D16. [Google Scholar] [CrossRef]
  19. Silva Junior, G.J.; Scapin, M.S.; Silva, F.P.; Silva, A.R.P.; Behlau, F.; Ramos, H.H. Spray volume and fungicide rates for citrus black spot control based on tree canopy volume. Crop Prot. 2016, 85, 38–45. [Google Scholar] [CrossRef]
  20. Scapin, M.S.; Behlau, F.; Scandelai, L.H.M.; Fernandes, R.S.; Silva Junior, G.J.; Ramos, H.H. Tree-row-volume-based sprays of copper bactericide for control of citrus canker. Crop Prot. 2015, 77, 119–126. [Google Scholar] [CrossRef]
  21. Garcerá, C.; Fonte, A.; Moltó, E.; Chueca, P. Sustainable use of pesticide applications in citrus: A support tool for volume rate adjustment. Int. J. Environ. Res. Public Health 2017, 14, 715. [Google Scholar] [CrossRef] [Green Version]
  22. Moltó, E.; Chueca, P.; Garcerá, C. Tratamientos fitosanitarios. Calculadora de recomendación de volumen. In Gestión Integrada de Plagas de Cítricos; Urbaneja, A., Catalán, J., Tena, A., Jacas, J.A., Eds.; IVIA: Moncada, Spain, 2019; Available online: http://gipcitricos.ivia.es/recomendacion-de-volumen (accessed on 18 November 2019).
  23. Garcerá, C.; Moltó, E.; Chueca, P. Effect of spray volume of two organophosphate pesticides on coverage and mortality of Aonidiella aurantii Maskell. Crop Prot. 2011, 30, 693–697. [Google Scholar] [CrossRef]
  24. Garcerá, C.; Moltó, E.; Zarzo, M.; Chueca, P. Modelling the spray deposition and efficacy of two mineral oil-based products for the control of California red scale, Aonidiella aurantii (Maskell). Crop Prot. 2012, 31, 78–84. [Google Scholar] [CrossRef]
  25. Albert, F.; Aleixos, N.; Blasco, J.; Cubero, S. Food Color Inspector. 2013. Available online: http://www.cofilab.com/registered-software/ (accessed on 18 November 2019).
  26. Moltó, E.; Chueca, P.; Garcerá, C. Tratamientos fitosanitarios. Recomendaciones. In Gestión Integrada de Plagas de Cítricos; Urbaneja, A., Catalán, J., Tena, A., Jacas, J.A., Eds.; IVIA: Moncada, Spain, 2019; Available online: http://gipcitricos.ivia.es/area/tratamientos-fitosanitarios/recomendaciones (accessed on 18 November 2019).
  27. MAGRAMA. Ministerio de Agricultura, Alimentación y Medio Ambiente. In Gestión Integrada de Plagas de Cítricos; Centro de Publicaciones del MAGRAMA: Madrid, Spain, 2014; p. 159. ISBN 978-84-491-1411-3. [Google Scholar]
  28. Urbaneja, A.; Catalán, J.; Tena, A.; Jacas, J.A. Plagas y Enfermedades. Tetraníquidos. Araña Roja. In Gestión Integrada de Plagas de Cítricos; Urbaneja, A., Catalán, J., Tena, A., Jacas, J.A., Eds.; IVIA: Moncada, Spain, 2019; Available online: http://gipcitricos.ivia.es/area/plagas-principales/tetraniquidos/arana-roja (accessed on 18 November 2019).
  29. Grafton-Cardwell, E.E.; Reagan, C. Efficacy of Movento to control California red scale, 2006. Arthropod Manag. Tests 2007, 32, D6. [Google Scholar] [CrossRef]
  30. Grafton-Cardwell, E.E.; Reagan, C. California red scale insecticide efficacy trial, 2007. Arthropod Manag. Tests 2009, 34, D3. [Google Scholar] [CrossRef]
  31. Liang, W.; Meats, A.; Beattie, G.A.C.; Spooner-Hart, R.; Jiang, L. Conservation of natural enemy fauna in citrus canopies by horticultural mineral oil: Comparison with effects of carbaryl and methidathion treatments for control of armored scales. Insect Sci. 2010, 17, 414–426. [Google Scholar] [CrossRef]
  32. Derksen, R.C.; Zhu, H.; Fox, R.D.; Brazee, R.D.; Krause, C.R. Coverage and drift produced by air induction and conventional hydraulic nozzles used for orchard applications. Trans. ASABE 2007, 50, 1493–1501. [Google Scholar] [CrossRef]
  33. Garcerá, C.; Román, C.; Moltó, E.; Abad, R.; Insa, J.A.; Torrent, X.; Planas, S.; Chueca, P. Comparison between standard and drift reducing nozzles for pesticide application in citrus: Part II. Effects on canopy spray distribution, control efficacy of Aonidiella aurantii (Maskell), beneficial parasitoids and pesticide residues on fruit. Crop Prot. 2017, 94, 83–96. [Google Scholar] [CrossRef] [Green Version]
  34. Salyani, M.; McCoy, C.W. Deposition of different spray volumes on citrus trees. Proc. Fla. State Hort. Soc. 1989, 102, 32–36. [Google Scholar]
  35. Whitney, J.; Salyani, M.; Churchill, D.; Knapp, J.; Whiteside, J. A field investigation to examine the effects of sprayer type, ground speed, and volume rate on spray deposition in Florida citrus. J. Agric. Eng. Res. 1989, 42, 275–283. [Google Scholar] [CrossRef]
  36. Hoffmann, W.C.; Salyani, M. Spray deposition on citrus canopies under different meteorological conditions. Trans. ASAE 1996, 39, 17–22. [Google Scholar] [CrossRef]
  37. Bayat, A.; Zeren, Y.; Ulusoy, M.R. Spray deposition with conventional and electrostatically-charged spraying in citrus trees. Agric. Mech. Asia Afr. Lat. Am. 1994, 25, 35–39. [Google Scholar]
  38. Wu, M.; Adesanya, A.W.; Morales, M.A.; Walsh, D.B.; Lavine, L.C.; Lavine, M.D.; Zhu, F. Multiple acaricide resistance and underlying mechanisms in Tetranychus urticae on hops. J. Pest Sci. 2019, 92, 543–555. [Google Scholar] [CrossRef]
  39. Campos, F.; Krupa, D.; Dybas, R. Susceptibility of populations of twospotted spider mites (Acari: Tetranychidae) from Florida, holland, and the Canary Island to abamectin and characterization of abamectin resistance. J. Econ. Entomol. 1996, 89, 594–601. [Google Scholar] [CrossRef]
  40. Martínez-Ferrer, M.T.; Jacas, J.A.; Ripollés-Moles, J.L.; Aucejo-Romero, S. Approaches for sampling the twospotted spider mite (Acari: Tetranychidae) on clementines in Spain. J. Econ. Entomol. 2006, 99, 1490–1499. [Google Scholar] [CrossRef] [PubMed]
  41. EPPO. Workshop on Harmonized Dose Expression for the Zonal Evaluation of Plant Protection Products in High Growing Crops; Austrian Agency for Health and Food Safety (AGES): Vienna, Austria, 2016; Available online: https://www.eppo.int/MEETINGS/2016_meetings/wk_dose_expression (accessed on 18 November 2019).
  42. Cunningham, G.P.; Harden, J. Reducing spray volumes applied to mature citrus trees. Crop Prot. 1998, 17, 289–292. [Google Scholar] [CrossRef]
  43. SIAR. Sistema de Información Agroclimática para el Regadío de la Conselleria Valenciana d’Agricultura, Pesca, Alimentació i Aigua y el Ministerio de Agricultura, Pesca y Alimentación; IVIA: Moncada, Spain; Available online: http://riegos.ivia.es/ (accessed on 17 December 2019).
Figure 1. Required parameters to obtain the adjusted volume in the CitrusVol calculator.
Agronomy 10 00032 g001
Figure 2. Quadrants of the canopy. (A) Side view and (B) top view of a standard citrus tree. Arrows indicate the forward sense of the sprayer.
Agronomy 10 00032 g002
Figure 3. Fruits with damage caused by Tetranychus urticae (indicated by arrows). (AC) Light damage and (DF) severe damage.
Agronomy 10 00032 g003
Figure 4. Interactions between height, depth and leaf side. Mean percentage of coverage and 95% Fisher’s least significant difference (LSD) intervals.
Agronomy 10 00032 g004
Figure 5. Mean (± standard error) coverage (%) per water volume (VA: adjusted, VC: conventional) at each height (top, middle, bottom) and depth (inside, outside) of the canopy, and side of the leaf (upperside, underside), of the 10 evaluations. Different letters above the bars within each height × depth × side combination indicate significant differences (LSD test, p < 0.05).
Agronomy 10 00032 g005
Figure 6. Symptomatic leaves occupied by Tetranychus urticae (%, mean ± standard error) at two depths of the canopy (outside, inside) and per treatment (VA: adjusted volume; VC: conventional volume). The dotted line indicates the treatment threshold: 22% of symptomatic leaves occupied. NS stands for not statistically significant (LSD test, p < 0.05).
Agronomy 10 00032 g006
Figure 7. Fruits damaged by Tetranychus urticae (%, mean ± standard error) at two depths of the canopy (outside, inside) and for both treatments (VA: adjusted volume; VC: conventional volume). Different letters above the bars indicate significant differences between VA and VC (LSD test, p < 0.05).
Agronomy 10 00032 g007
Table 1. Characteristics of trial orchards.
PlotLocationArea (ha)Planting Pattern 1 (m)Vegetation Density 2 (m2/m3)YearCanopy Dimensions 3 (m)Canopy Volume 4 (m3)Pruning Level
TownGeographic Coordinates
P1Chiva39°26′32″ N
0°33′23″ W
1.66 × 313.5620162.51 × 4.33 × 3.0817.53Normal
20172.60 × 4.03 × 3.0516.73
P2Aldaia39°26′43″ N
0°32′18″ W
0.87 × 211.5620162.12 × 4.26 × 2.3010.88Normal
20172.04 × 3.70 × 2.198.66
P3Sagunto39°39′14″ N
0°18′26″ W
1.76.5 × 510.3620171.93 × 3.10 × 3.169.90Severe
P4Alfauir38°56′46″ N
0°14′15″ W
25.5 × 514.5520172.19 × 4.17 × 4.4020.99Normal
P5Alfauir38°56′56″ N
0°14′32″ W
2.26 × 213.4620172.08 × 2.85 × 2.106.50Normal
P6Llíria39°43′43″ N
0°35′28″ W
16.5 × 2.515.0920172.54 × 3.56 × 2.5712.16Normal
P7Llíria39°43′58″ N
0°35′33″ W
2.76.5 × 3.517.9420172.43 × 4.74 × 3.7222.49Normal
1 Row spacing × tree spacing. 2 Calculated considering the two sides of the leaves. 3 Canopy height × diameter across the row × diameter along the row. 4 Calculated considering citrus canopy as an ellipsoid.
Table 2. Tractors and sprayers used in the applications.
PlotTractorAirblast SprayerTank Capacity (L)Number of Nozzles
P1 P2Landini REX 110 FIlemo-Hardi Arrow XF90150038
P3New Holland TN 95 FAMañez y Lozano Twister200030
P4 P5SAME Frutteto3 100 ClassicFede Futur100026
P6 1Massey Ferguson 3655 FFede Futur300026
John Deere 5090 GFFede Futur300026
John Deere 5090 GFFede Futur200026
P7Massey Ferguson 3655 FFede Futur300026
1 In Plot 6, three combinations of tractor + sprayer were used in the three PPP applications chronologically: 10 July, 23 August and 14 September.
Table 3. Operative characteristics of plant protection products (PPP) applications.
PlotApplication DatePressure (bar)Forward Speed (km/h)Water Volume (L/ha)Water Volume Reduction (%)Air Flow Rate (m3/h)Number of Open NozzlesPPP Concentration (%)PPPActive Ingredient of PPP
VCVAVCVAVCVA
P127 July 201681.324905325533.6455,34238300.100Cal-ExAbamectin
0.040Movento 150 O-TeqSpirotetramat
0.023EnvidorSpirodiclofen 1
11 October 201681.324905325533.6455,34238300.100Cal-ExAbamectin 1
7 June 201781.324899348728.8274,89438300.267Dursban 48Chlorpyrifos
0.100StygmaAbamectin 1
24 July 201781.324899315335.6474,89438300.100Abasi ECAbamectin
0.023EnvidorSpirodiclofen 1
8 September 201781.324899315335.6474,89438300.400Reldan EChlorpyrifos-methyl
0.100DauparexAbamectin
0.023EnvidorSpirodiclofen 1
P222 June 201681.733215247622.9955,34238300.100Cal-ExAbamectin
0.023EnvidorSpirodiclofen 1
9 August 201681.324204280033.4055,34238280.100Cal-ExAbamectin
0.040Movento 150 O-TeqSpirotetramat
0.023SentoClofentezine 1
9 September 201681.733215247622.9955,34238300.100Stygma/Cal-ExAbamectin
0.023EnvidorSpirodiclofen 1
22 August 201781.324199207050.7074,89438300.100DauparexAbamectin
0.050Movento 150 O-TeqSpirotetramat
0.023EnvidorSpirodiclofen 1
P323 June 2017132.013395146256.9446,46726180.050Movento 150 O-TeqSpirotetramat
0.030BorneoEtoxazole 1
3 August 2017132.012950150249.0846,46726180.025EnvidorSpirodiclofen 1
P426 June 2017101.964262299829.6669,38526180.060Movento GoldSpirotetramat
0.035Comanche PlusTebufenpyrad 1
18 September 2017101.964262299829.6669,38526180.020EnvidorSpirodiclofen 1
P527 June 2017101.963674181150.7169,38524160.060Movento GoldSpirotetramat
0.035Comanche PlusTebufenpyrad 1
19 September 2017101.963674181150.7169,38524160.020EnvidorSpirodiclofen 1
P610 July 2017101.244275256739.9582,64426220.100Abasi ECAbamectin 1
23 August 2017111.263910249336.2482,64422220.100DauparexAbamectin
0.025EnvidorSpirodiclofen 1
14 September 201791.054590251445.2377,51224220.100DauparexAbamectin
0.035Comanche PlusTebufenpyrad 1
P730 June 20171181.423932329016.3382,64426260.067Comanche PlusTebufenpyrad 1
0.050Movento 150 O-TeqSpirotetramat
4 August 2017101.433701324612.2982,64426260.100DauparexAbamectin
0.023EnvidorSpirodiclofen 1
VC: conventional volume; VA: adjusted volume; PPP: plant protection product. 1 Main active ingredient for the application against two-spotted spider mite. It is the one that has been used in CitrusVol to calculate the adjusted volume.

