Article

AquaCrop-Simulated Response of Sorghum Biomass and Grain Yield to Biochar Amendment in South Sudan

1
Department of Forest Sciences, University of Helsinki, (Latokartanonkaari 7), P.O. Box 27, FI-00014 Helsinki, Finland
2
Department of Agricultural Sciences, University of Helsinki, (Latokartanonkaari 5), P.O. Box 27, FI-00014 Helsinki, Finland
*
Author to whom correspondence should be addressed.
Agronomy 2020, 10(1), 67; https://doi.org/10.3390/agronomy10010067
Submission received: 31 October 2019 / Revised: 17 December 2019 / Accepted: 22 December 2019 / Published: 2 January 2020
(This article belongs to the Section Soil and Plant Nutrition)

Abstract

:
The dependency on rainfed agriculture and weak adaptability of the agricultural sector to climate change threaten food security in Sub-Saharan Africa (SSA). Biochar has widely been touted as a relatively easy means of increasing the soil water storage capacity of soils and thereby improving or maintaining crop yields. In this study we simulated the effect of biochar amendment on sorghum aboveground biomass and grain yield at a site in South Sudan. We used the model AquaCrop parameterized using site, soil, and cropping management data from a field experiment carried out at the site in 2011 and 2012, which were both wet years. Changes in soil hydraulic properties due to biochar were based on a published meta-analysis study. In order to investigate whether the response to biochar differed in dry years, simulations were also carried out for 1990, which was the driest year during the period 1979–2014. Measured and modelled biomass and yields with and without biochar for 2011 and 2012 were compared. Simulated and measured yields depended on growing season rainfall and distribution. The simulations showed that biochar amendment had an effect on rooting zone soil water content and sorghum biomass and grain yield in 1990, but not in 2011 and 2012. In view of expected climate change, the results have important implications for sorghum production and the potential use of biochar in SSA. Given the limited response of grain yield to biochar shown in our simulations, careful selection of sorghum variety and cultivar and consideration of planting date may be a more effective means of improving yields than applying biochar.

1. Introduction

Water stress and loss of soil fertility are the most liming factors affecting agricultural production and livelihoods in drylands of Asia and Sub-Saharan Africa (SSA) [1]. The impact is particularly great for rainfed agricultural systems such as in SSA, where rainfall anomalies causes crop failure and food insecurity [2]. Climate change projections for SSA indicate increases in temperature and a reduction, but increased variability, in rainfall, which will have important negative implications for agriculture and livelihoods [3,4].
Sorghum (Sorghum bicolor L. Moench) is an important staple food, feed, and biofuel crop, and a main source of protein for millions of people in Asia and Africa [5]. In 2017, Asia accounted for 14.5% of global sorghum grain production (57.6 Tg) and Africa 47.3% [6]. Although sorghum is an indigenous cereal crop of Africa, its cultivation is spreading rapidly to other continents and it is currently cultivated in the tropics, subtropics, and temperate regions [6,7]. Sorghum is the second main staple food crop in SSA and is the main food crop in South Sudan after maize [8]. Although there is potential to increase sorghum production, yields are very low and variable in SSA where cultivation is rainfed and both soils and agronomic management are poor. There is therefore a need to explore the use of soil amendments to improve soil fertility and increase crop yields, especially in the face of impending climate change [9].
Biochar is biomass that has been heated in the absence of or with limited air to above 250 °C (pyrolysis), a process that results in an enrichment of C, phosphorus (P), calcium (Ca), and magnesium (Mg) and is porous, thus having considerable water-holding properties [10]. As a result of its perceived benefits for crop productivity, biochar is being increasingly used in agriculture worldwide, including in the tropics. Biochar-related increases in crop productivity have been attributed to improvements in soil fertility and storage of plant-available water, as presented in a number of meta-analysis studies [11,12,13]. These reviews show that the effects of biochar vary with biochar dose, source material, and production process; soil texture and baseline hydraulic properties; baseline soil fertility; whether the study was conducted in the field or in the lab (greenhouse); and whether the study is carried out in a temperate zone or in the tropics. However, as noted in each of the reviews, the effect of biochar on crop productivity is not universally beneficial and biochar can indeed have negative effects. The main benefit of applying biochar in SSA [14], where much of the agriculture is rainfed, may be expected to be its effect on increasing the water-holding capacity of the soil, but the results have been contradictory. Nyambo et al. [15] reported that the application of biochar made from maize residues significantly improved soil physicochemical properties in a study carried out in South Africa. Kätterer et al. [16] reported that biochar produced from Acacia species slightly increased soil pH, plant-available phosphorus, porosity, and soil water-holding capacity of clay soils in Kenya, and considerably increased yields of maize and soybean. On the other hand, Deng et al. [17] found that the addition of Acacia seyal biochar, while potentially increasing soil water storage by 30%, resulted in no detectable improvement in sorghum biomass and grain yield in South Sudan. In a companion paper in which the same sorghum cultivar was grown in a greenhouse pot experiment under differing drought stresses, the same biochar and dosage resulted in no significant increase in biomass and grain yields [18].
Our objectives in this paper were to (1) simulate the effect of biochar amendment on soil moisture contents and sorghum water-use (transpiration) at a site in South Sudan, (2) simulate the effect of biochar amendment on sorghum biomass and grain yield and compare with measured values at the site, and (3) determine whether the above responses to biochar amendment differed between dry and wet years. We hypothesized that changes in soil hydraulic properties brought about by the application of biochar would increase soil moisture contents, crop water-use, and aboveground biomass production and grain yield of sorghum, and that the effect would be greater in drier years. For this purpose, we used the crop water productivity model AquaCrop, developed by the FAO [7,19], to simulate the effect of meta-analysis-reported changes in soil hydraulic properties brought about by the application of biochar [12] on biomass production and grain yield for one extremely dry (1990) and two extremely wet (2011 and 2012) years. The results are compared to experimentally determined sorghum biomass and grain yield data for 2011 and 2012 from the same site [17].

2. Materials and Methods

2.1. Field Site and Experiment

The study was carried out for a location 15 km north of the town of Renk in South Sudan (11.97 °N, 32.76 °E, 380 m a.s.l.). The area has a semi-arid climate with a distinct wet season generally occurring between May and October, and the dominant soil type in the area is Vertisol. However, the clay is covered by a 30 cm thick layer of silt loam at the site.
In 2011 and 2012, an agroforestry field experiment looking into the effects of Acacia seyal tree density and biochar on sorghum production and grain yield was carried out [17]. The experiment had a split-plot design with two factors, namely, tree-cropping tree density (0 trees ha−1, 100 trees ha−1, and 400 trees ha−1) and biochar treatment (0 Mg ha−1 and 10 Mg ha−1). There were three replicates of each combination of tree-cropping tree density and biochar treatment arranged in three blocks. The biochar used consisted of crushed Acacia seyal charcoal produced locally in traditional mound kilns. The biochar was applied once at the beginning of the experiment (30 July 2011) by spreading it evenly over the surface of the selected subplots by hand and mixing it into soil to a depth of approximately 10 cm using hand hoes. Seeds of the sorghum cultivar “Wad Ahmed” were sown on 3 August 2011 and 5 August 2012 at spacings of 0.7 m between rows and 0.3 m between plants. After germination, the plants were thinned to one plant per seeded spot, resulting in 47,619–46,800 plants ha−1 depending on whether there were trees or not. No chemical fertilizer or insecticides were applied, but 2,4-D herbicide was applied once (29 August 2011) to control broadleaved weeds, and grass weeds were manually removed twice during the growing season in both years. The experiment was rainfed. At harvest-time (6 November 2011 and 10 November 2012) the aboveground biomass and grain yield were determined. For the purposes of this paper, we used the measured sorghum aboveground biomass and grain yield values from the no-tree–sorghum-only treatment plots to compare with the AquaCrop-simulated values as the treed treatments had a dominating effect compared to that of the biochar treatment.

2.2. The AquaCrop Model

AquaCrop is a water-driven model that simulates aboveground biomass production and yields of herbaceous crops as a function of water consumption in water-limiting environments [7,19]. AquaCrop has a daily time step and uses the linear relationship between biomass production and water-use (transpiration (Tr)), defined by the so-called water productivity parameter (WP), to calculate aboveground biomass from Tr. If WP is normalized for potential evapotranspiration demand (ETo) and atmospheric CO2 concentrations it becomes nearly constant for a specific crop and is therefore conservative. The proportion of grain yield is calculated from aboveground biomass using a harvesting index (HI), i.e., the ratio of yield to aboveground biomass, which is specific for a particular crop. The development of crop canopy cover determines Tr and thereby aboveground biomass production and, also, through HI, grain yield. The crop response to water and nutrient stress is taken into account using various stress coefficients (Ks), which typically take a convex form, to modify various model parameters.
The input data are weather data (daily air temperature, rainfall, wind speed, relative humidity, solar radiation, and atmospheric CO2 concentrations), various crop and soil characteristics, and management practices that affect the environment in which the crop grows. The most important crop characteristics are planting density, canopy cover and phenological development, and the harvest index for the crop grown under optimal conditions (HIo). Soil profile properties include thickness, volumetric water content at field capacity (θFC), permanent wilting point (θPWP), saturation (θSAT), saturated hydraulic conductivity (Ksat), stone content, and root penetrability. The hydraulic properties θFC, θPWP, θSAT, and Ksat are those soil properties that are affected by biochar amendment (see below). Soil water storage capacity increases over time as a result of root deepening over the growing season. Rooting depth starts from a minimum effective depth, the depth from which the germinating seed extracts water, and then deepens exponentially to the maximum effective rooting depth. If the depth to the groundwater table and the soil texture is such that water is brought into the rooting zone by capillary rise, that can then be taken into account, as can the salinity of the groundwater. Surface runoff is calculated using the surface runoff curve number (CN) method. Infiltration is taken as the difference between rainfall and surface runoff. Drainage from the soil profile is based on an exponential function of soil water content held between saturation and field capacity. Management practices are divided into field management practices which alter the runoff CN value (i.e., weeding, mulches, and soil bunding practices) and irrigation practices (irrigation or rainfed). The structure and algorithms used in AquaCrop are fully described in Raes et al. [20,21]. We used the latest version of AquaCrop (6.1) in this study.

2.3. AquaCrop-Simulated Effect of Biochar on Sorghum Production and Yield

2.3.1. Model Input Data and Parameters

Parameter values used in the simulations are given in Table S1. The date of seeding in 2011 and 2012 was taken to be that used in the field experiment and that for 1990 to be 5/8 so as to correspond to that of the field experiment dates for 2011 and 2012.

2.3.2. Climate Data

Climate data was obtained from the National Centers for Environmental Prediction’s Climate Forecast System Reanalysis (CFRS) dataset [22,23,24]. Daily CFRS data for the pixel having a north-east corner located at 12.0248 °N, 32.8133 °E and south-west corner at 11.9093 °N, 32.7007 °E (field experiment site located in the center) for the period 1979–2014 was downloaded [25] and data for the years 1990, 2011, and 2012 extracted. Simulating the effect of biochar amendment for each of these three years enabled us to compare simulated yields with observed values (2011 and 2012) and also to determine if the yield response to biochar differed between very dry years (1990) and very wet years (2011 and 2012). The CFRS data consists of daily maximum and minimum air temperature, rainfall, relative humidity, wind speed, and net solar radiation, which therefore enabled a reliable calculation of daily Penman-Monteith reference ETo values [26]. Default Angström equation coefficient values (a = 0.25 and b = 0.50) were used. Mauna Luo atmospheric CO2 concentration data provided by AquaCrop was used (Table S2).

2.3.3. Crop Growth and Development Parameters

Tuning of the crop parameters was performed as described in reference manual [21] and then AquaCrop was run in the Growing Degree-Days (GDD) mode, that is, crop development and phenology were determined by the daily temperatures of each year (Table S2). The default base and upper temperatures (Tbase and Tupper, respectively), 8 °C and 30 °C, respectively, were used. The sowing date and planting density were the only field experiment crop data included in AquaCrop simulations. The harvesting date corresponds to the date when the crop reaches maturity.
In order to simulate biomass and grain yield values which were similar to those measured in the field experiment we had to invoke a soil fertility stress in all simulations. The parameter values used for this stress are included in Table S1 and are the values that resulted in the closest match to the 2011 and 2012 measured aboveground biomass and grain yields with and without biochar.

2.3.4. Field Management

The simulations were set to rainfed as no irrigation was carried out at the experiment site and no mulches were applied or bunds constructed. However, as herbicide and weeding were carried out in the experiment (see earlier), weeding management was set to very good, i.e., weeds accounted for only 5% of the canopy cover over the season. While this weeding setting had no effect on canopy cover (CC) in the simulations, we assumed that it would affect surface runoff and infiltration. The runoff curve number (CN) was therefore reduced by 15% (Annex I).

2.3.5. Soil Profile Properties and Biochar Amendment Treatments

We assumed that the effects of the biochar were confined to the upper 30 cm silty loam layer since the biochar in the field experiment was mixed into the upper silty loam soil layer only to a depth of 10 cm. The underlying clay was assumed to be >2 m thick and to limit root penetration by 50%. This resulted in a maximum rooting depth of 1.2 m. The depth to groundwater in the area is anecdotally known to be several meters, and we therefore set groundwater depth to a constant 4 m so that the soil profile was not affected by capillary rise.
The baseline hydraulic property values of the silty loam and underlying clay representing no biochar amendment (BC0) were taken from the AquaCrop reference manual [21]. Particle size analysis of the 0–30 cm layer showed that it had mean sand and silt contents of 39% and 61%, respectively [17]. To simulate the effect of biochar amendment on soil hydraulic properties, we used values derived from a meta-analysis study by Omondi et al. [12] on the effect of biochar on soil hydraulic properties. In the study by Omondi et al. [12] the effects of biochar amendment (doses ranging from <20 Mg ha−1 to >80 Mg ha−1) on soil porosity (corresponding to saturation water content), Ksat, and available water capacity (AWC) (i.e., the difference between the amount of water held at field capacity (FC) and permanent wilting point (PWP)) were reported as the mean of the percentage change from the experiment’s control values. However, separate values for FC and PWP were not reported. Most of the studies included were greenhouse pot experiments but results from field-based studies were also included, some of which were from the tropics. For the purposes of our study, four biochar amendment scenarios (BC1, BC2, BC3, and BC4) representing the range in percentage changes in hydraulic properties for medium textured soils (loam, silt loam, and silt) brought about by biochar amendment reported by Omondi et al. [12] were considered (Table 1).

3. Results

3.1. Climate and the Water Balance

The annual rainfall amount for 1990 (207 mm) was about a fifth of that in the 2011 (836 mm) and 2012 (899 mm). The higher rainfall in 2011 and 2012 was mainly the result of a few days of very heavy rainfall (Figure 1).
The maximum daily rainfall in 1990 was 21 mm while in 2011 it was 146 mm and in 2012 124 mm. The number of rainfall days (>0.1 mm day−1) in 1990 was 92 while it was 111 in 2011 and 109 in 2012. However, the distribution of the rainfall in 2011 and 2012 differed. While most of the annual rainfall in 2011 fell during the first half of the growing season, most of the annual rainfall in 2012 fell before sowing, but during the growing season the rainfall was more evenly distributed. This clearly affected soil water contents during the growing season of the two years (see below). Most of the daily rainfall infiltrated the soil, but a considerable amount of surface runoff was generated in 2011 and 2012. Reflecting the distribution in the heavy rainfall days, much of the surface runoff in 2011 occurred during the growing season, while in 2012 most of runoff occurred before the growing season. Daily ET, as could be expected, largely mimicked the distribution of rainfall.

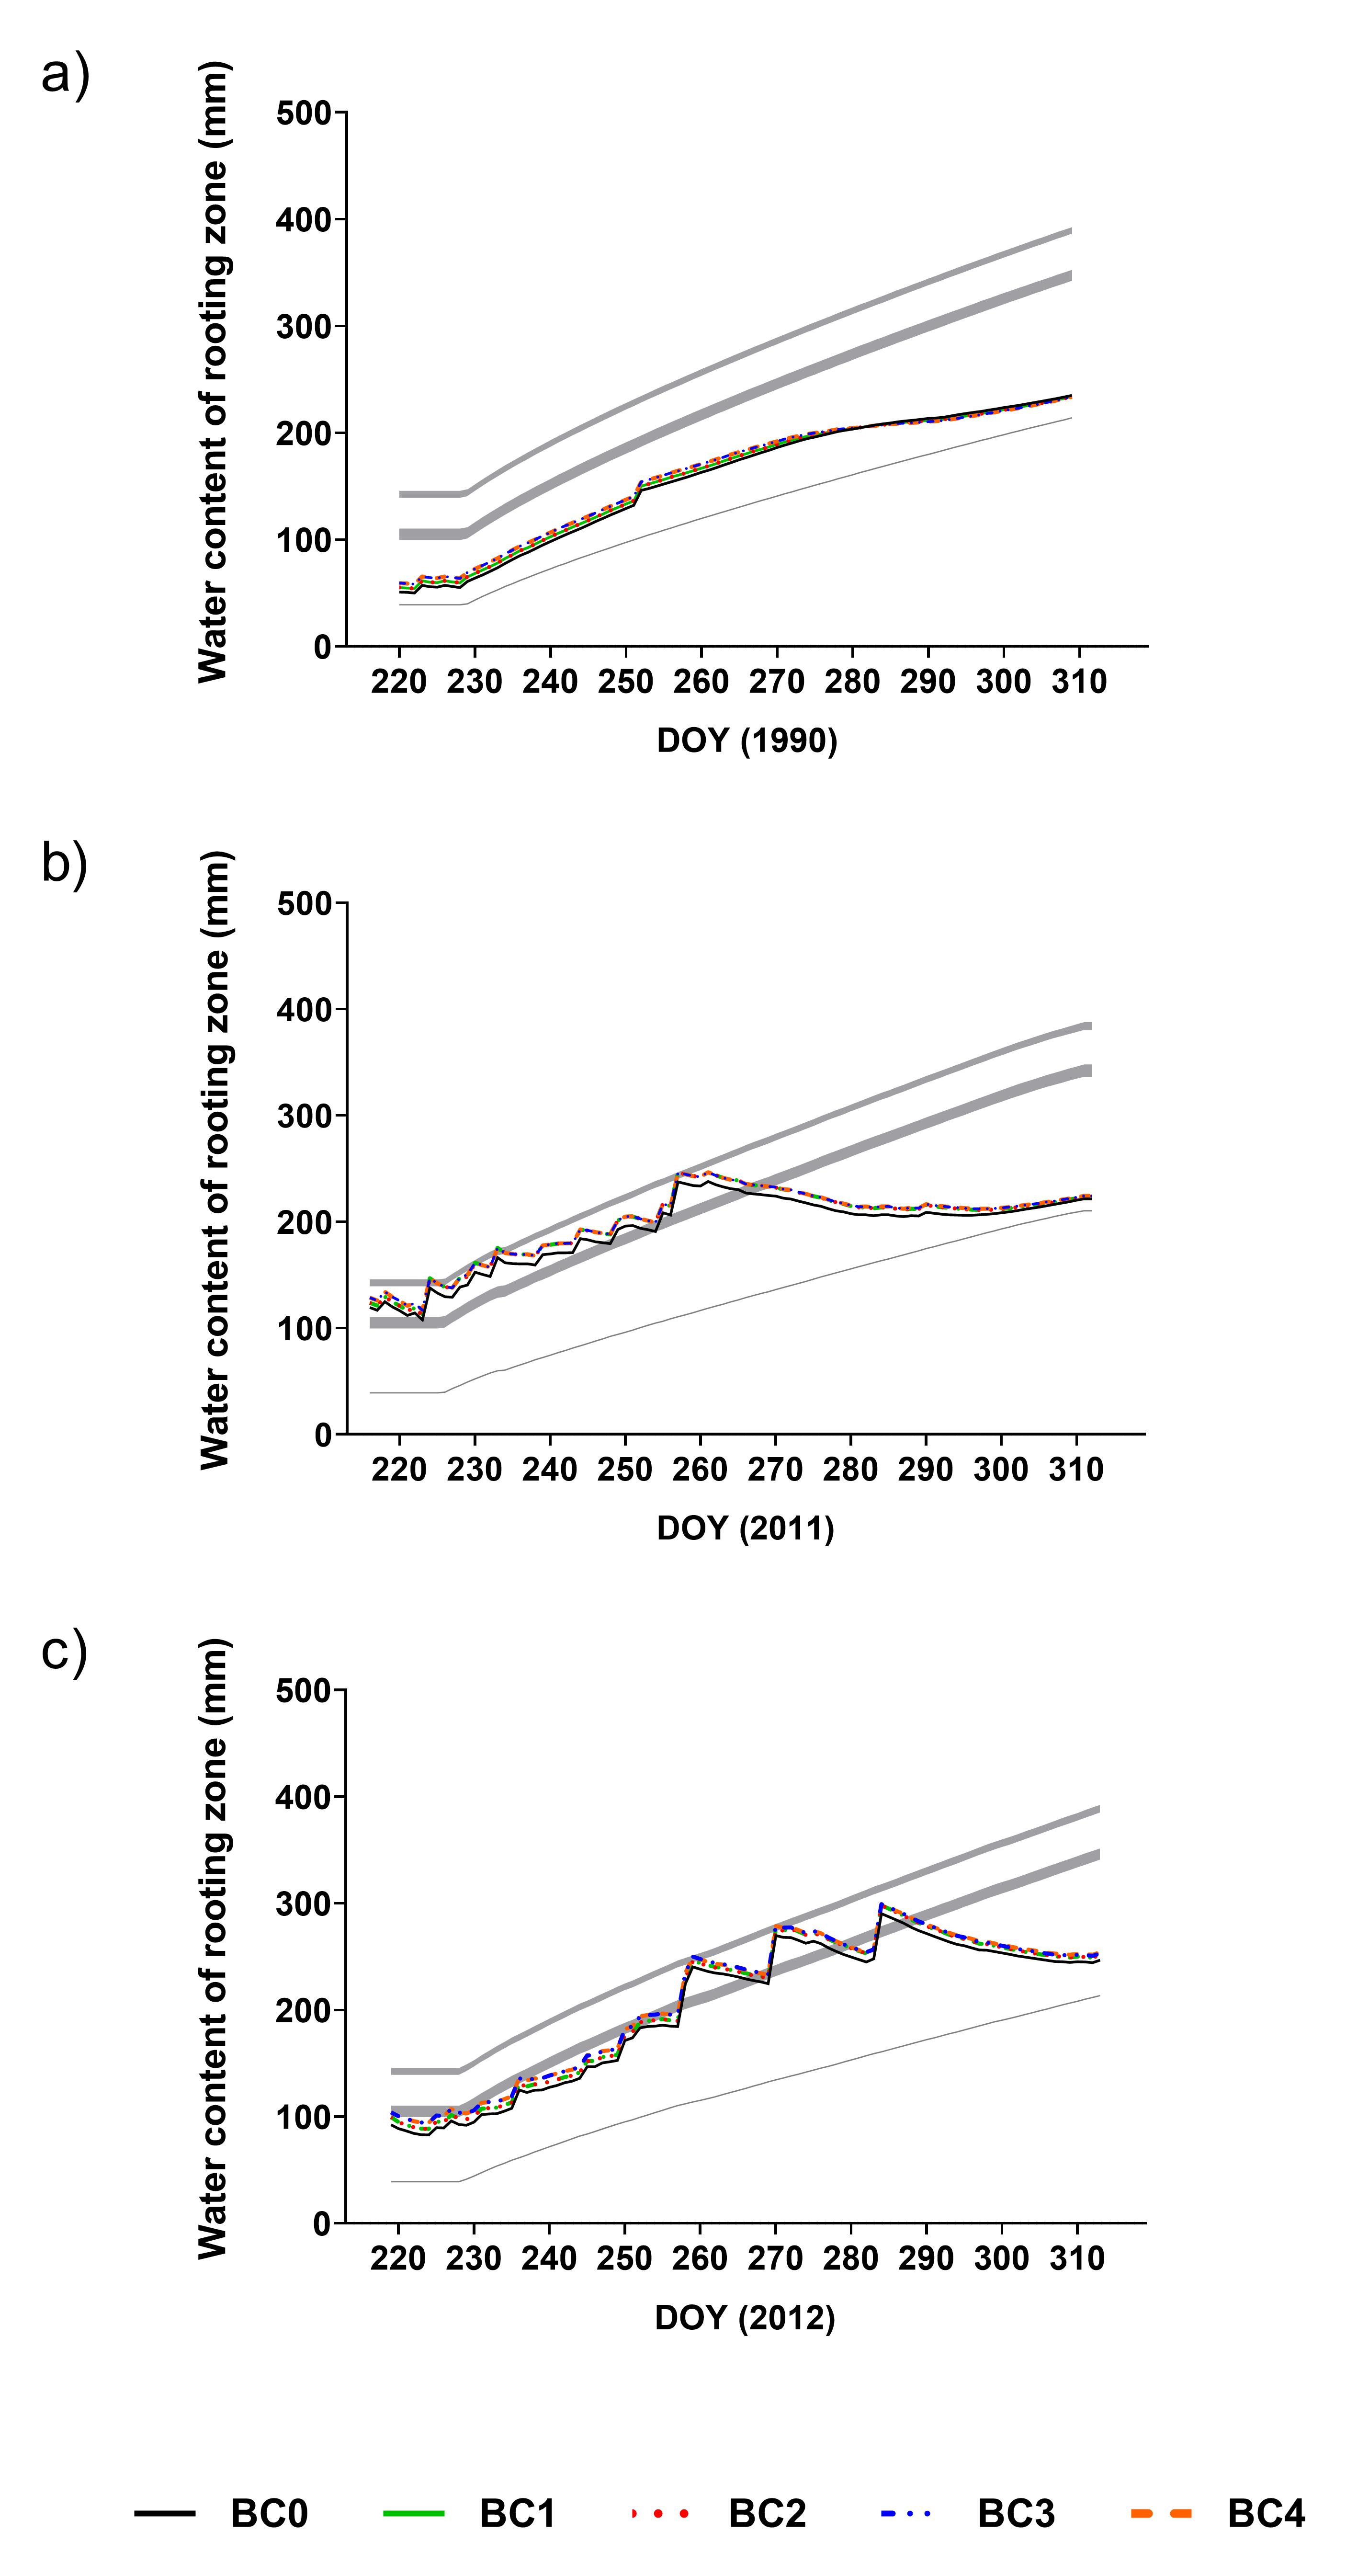
3.2. Simulated Rooting Zone Soil Water Contents and Transpiration

Simulated soil water contents of the rooting zone in 1990 were close to permanent wilting point contents at the beginning of the growing season and remained considerably below field capacity contents for the entire growing season (Figure 2). By contrast, simulated soil water contents of the rooting zone were near to saturation contents at the beginning of the growing season in 2011 and near FC contents in 2012. The peaks in simulated soil water contents in 2011 and 2012 were clearly associated with heavy daily rainfall events. However, later in the season simulated soil water contents in both years fell below FC and approached PWP at the end of the season in response to the declining rainfall but continuous high ET demand.
The effect of biochar amendment was to increase simulated soil water contents of the rooting zone, but the increase compared to the no-biochar treatment (BC0) was small and differed little between the treatments BC1–BC4. For 1990 and 2011, simulated soil water contents belonging to the biochar treatments BC1 and BC2 did not differ from each other and neither did those of the BC3 and BC4 treatments, but the simulated soil water contents of the two pairs of biochar treatments did differ from each other. For 2012, BC1 and BC2 treatments differed from each other as well from BC0. In 1990, the absolute difference in soil water contents between the no-biochar (BC0) and biochar treatments averaged 3 mm for both BC1 and BC2 and 6 mm for BC3 and BC4. For 2011, the corresponding differences were 7 mm and 8 mm, and for 2012, the values were 6 mm and 9 mm. The maximum difference in rooting zone soil water contents between the BC0 treatment and biochar treatments occurred at the beginning of the growing season. In 1990, the maximum difference was 5 mm for both BC1 and BC2 and 9 mm for both BC3 and BC4. The corresponding values for 2011 were 9 mm and 10 mm, and for 2012, 8 mm and 12 mm.
Simulated daily cumulative Tr in 1990 was clearly lower (approximately half the amount) than that in 2011 and 2012 (Figure 3). However, the differences in Tr between the biochar treatments were similar across all 3 years; namely, there was no difference in Tr between BC1 and BC2 treatments nor between BC3 and BC4 treatments, but Tr for both pairs of biochar treatments did differ from each other and from BC0.

3.3. Simulated Sorghum Biomass and Grain Yields

Simulated sorghum aboveground biomass and grain yields clearly differed between the dry year (1990) and wet years (2011 and 2012) (Figure 4). Averaged across the biochar treatments, biomass production in 1990 was 67% of that in 2011 and 71% of that in 2012. The effect of the drought year on grain yield was, however, less. The yield in 1990 averaged across the biochar treatments was 72% of the yield in 2011 and 81% of the yield in 2012.
The effect of biochar amendment on biomass and grain yield was only discernible in 1990. The increase in both biomass and grain yield in 1990 was 33% with treatments BC3 and BC4 compared to BC0 and only 14% for treatments BC1 and BC2. For 2011 and 2012, the effect of the biochar amendment treatment was minor, with increases of only 2% or less. The HI for 1990 was 54% for all biochar treatments. For 2011, the HI was 51% for BC0, 49% for BC1 and BC2, and 50% for BC3 and BC4; for 2012, it was 42% for all treatments. The HI values for the field experiment sorghum-only plots were 69% in 2011 and 74% in 2012.

4. Discussion

Compared to maize and other cereals, sorghum is drought-tolerant and can adapt to water stress during different growth stages by reducing transpiration and maximizing water use efficiency [27]. Nevertheless, in our research we found a direct relationship between simulated biomass and grain yield and annual rainfall for the three years included in our study. However, rather than simply the amount of rainfall being significant, rainfall variability during the growing season may be more important. For example, Msongaleli et al. [4], using the Agricultural Production Systems Simulator, APSIM [28] model, showed that the length and timing of dry spells during the growing season determined sorghum grain yields in semiarid central Tanzania. Our field experiment and AquaCrop-simulated grain yield results are somewhat contradictory in this respect, with the field experiment grain yield for 2012 being greater than that for 2011, while AquaCrop-simulated grain yields showed the opposite result. The relatively high grain yields obtained from our field experiment in 2012 may be due to the more even distribution of rainfall, and consequently the soil water content of the rooting zone, during the growing season compared to 2011, while the higher AquaCrop-simulated grain yields for 2011 may be the response of the model to the relatively wet first half of the growing season. The growth response and phenology of crops is, however, a complex combination of the effects of both the amount and distribution of rainfall [7,29].
AquaCrop has successfully simulated crop biomass and grain yields in a number of African studies [30,31,32,33]. We were able to calculate FAO Penman-Monteith daily ETo values using a full set of daily weather data, thereby maximizing the reliability of the ETo values. θFC and θPWP values for untreated soil (BC0) were taken from the soil textural class table provided by AquaCrop [21], the texture classes having been confirmed by measured particle size analysis [17]. The changes in soil hydraulic properties due to biochar amendment we used were based on an extensive meta-analysis study [12] and were therefore considered appropriate and able to give a realistic account of the effects of biochar. The initial water content of the soil at the start of the simulation run (1 January) was assumed to be at PWP. This assumption is reasonable considering the semi-arid nature of the site and distribution of rainfall. We have no information on local rooting depth and deepening rate but considered the values we used appropriate for the two soil layers forming the rooting zone. For sorghum, a C4 crop, the default canopy growth coefficient value of 0.013 is greater than that for most C3 species [7], and therefore was considered appropriate. The initial canopy cover value was based on the actual planting density used in the field experiment. The HIo value 45%, the default value suggested for sorghum by AquaCrop (Table S1), is at the middle high end of reported HI values. Sorghum HI values are frequently low, being 30% to 40% [7], and therefore the HIo value we used may have been too high. We are unaware of HI values for the particular cultivar used in this study (“Wad Ahmed”), but Ahmed et al. [34] report HI values for several local sorghum genotypes grown in North Kordofan, Sudan as ranging from 2.5% to 25%. Our AquaCrop-simulated HI values were clearly higher but similar to values derived from the field experiment, indicating that the AquaCrop HI values were reasonable. We therefore consider the parameter values we have used fit for purpose and AquaCrop simulations and results reliable.
Although biochar can affect crop yields through a number of mechanisms, for example, release or immobilization of nutrients, release of other chemicals, soil aeration, and changes in albedo and soil temperature [10], yields in SSA are probably mostly affected by its effect on soil hydraulic properties and particularly on water-holding capacity. The effect of biochar on soil hydraulic properties varies with soil texture. For example, biochar applied to a sandy soil did not affect Ksat in a study carried out by Jeffery et al. [35] while biochar added to a loamy soil increased not only Ksat but also pore volume, saturation water content, and AWC in a study performed by Xiao et al. [36], and the effect of biochar on improving the hydraulic properties of clayey soils was uncertain [15,37]. However, in a meta-analysis study carried out by Omondi et al. [12], biochar addition was found to significantly improve all soil hydraulic properties across all soil textures, but it was also found that the changes were greater in coarse-textured soils than in fine-textured soils. We assumed that the biochar-related increases in AWC as reported by Omondi et al. [12] were due to an increase in FC, i.e., an increase in the amount of larger pores. While some of the studies included in Omondi et al. [12] did believe the observed biochar-related increase in porosity to be due to increases in meso- and macro-pores, the increase was more generally attributed to an increase in micro-porosity because of the many micro-pores that biochar contains. However, in order to explain the increase in AWC the increase in FC must be greater than the increase in PWP. In a study performed on a sandy loam soil, Chen et al. [38] found biochar that increased field capacity; the authors attributed this to a decrease in intergranular pore size and to the porosity of the biochar. However, in any case, it is the amount of available soil water that drives biomass production and grain yield in AquaCrop, not the separate values of FC and PWP.
Although biochar amendment was found to increase the simulated soil water content of the effective rooting zone, the increase was relatively small regardless of biochar treatment and year (growing season average differences ranged between 3% and 6%). Nevertheless, the increase in soil water contents during 1990 apparently enabled the sorghum biomass and grain yield to increase, unlike in the wet years 2011 and 2012. The simulated daily cumulative Tr at the end of the growing season in 1990 was approximately half that in 2011 and 2012, clearly a result of the lower rainfall in 1990. Similarly, differences in cumulative Tr between biochar treatments were found, but the differences at the time of harvest were small (3–5 mm in 1990 and <1 mm in 2011 and 2012), indicating that biochar had little effect on sorghum transpiration. The lack of a response in transpiration to biochar amendment has also been found in a greenhouse pot experiment using the same cultivar of sorghum as in this study [18]. In this study, the simulated effect of biochar on biomass and grain yield was the greatest in 1990. This result supports our hypothesis that biochar amendment has a greater impact on crop production and grain yield in dry years. As the increase was greater with BC3 and BC4 treatments, the beneficial effect of biochar would appear to be bought about through increasing soil water storage rather than through increasing permeability (note that biochar-treatment-related increases in Ksat had no effect on biomass and grain yields).
Because sorghum is largely grown by farmers on marginal land in an unirrigated fashion and with low input practices and using local landraces, grain yields in Africa are typically low, being 0.5–0.9 Mg ha−1 [7]. Sorghum grain yields in Sudan are often especially low. In a paper by Ahmed et al. [34], yields were reported as ranging between 0.25 and 0.48 Mg ha−1, and in a study by Bahar et al. [39], grain yields of “Wad Ahmed” grown in Central Darfur State were 0.113 Mg ha−1. For South Sudan, the average sorghum yield in 2012 was estimated at 0.77 Mg ha−1 [6]. Our “Wad Ahmed” measured and simulated grain yields were somewhat higher than these, probably the result of better practices being carried out in our experiments compared to local farming practices.
Studies in the region have shown considerable intra-specific variation in sorghum yields. In a study carried out in North Kordofan [34], the coefficient of variation (cv) for grain yield among 19 sorghum genotypes was 9%. In our study, the cv for the measured grain yield of “Wad Ahmed” sorghum across biochar and no biochar treatments was 5.4% in 2011 and 4.8% in 2012; that is, nearly half the cv due to genotype of that reported in the Kordofan study [34]. This would suggest that a selection of sorghum variety would give greater scope for improving grain yields than using biochar. In another Sudanese study [39], while no difference in grain yield among four sorghum genotypes (which included “Wad Ahmed”) was found, there was a difference in the number of leaves per plant, leaf area, and susceptibility to disease, and these parameters were affected by sowing date. The authors concluded that the growth parameters of sorghum are determined more by genetic factors than by environmental factors. The growth response of sorghum to biochar may therefore vary with variety and cultivar.

5. Conclusions

Using the crop water productivity model AquaCrop we were able in this work to simulate the effect of biochar applied to soil in doses that are generally used in practice and which cover the range of changes in soil hydraulic properties that can bring about sorghum aboveground biomass production and grain yield. Overall, our results showed that although increases in rooting zone soil water contents related to biochar amendment are small, they can be enough to considerably increase the biomass and grain yield of sorghum in dry years. Although yields were higher in wetter years, they were unaffected by biochar treatment. This has important implications for sorghum production and potential use of biochar in view of expected changes in rainfall amount and variability in SSA. Given the limited response of grain yield to biochar in our simulations, careful selection of sorghum variety and cultivar and consideration of planting date may be a more effective means of improving yields than applying biochar. However, given the inherent limitations of the modeling approach, further empirical studies on the effects of biochar on crop yields in SSA, especially in view of expected climate change impacts on the water cycle, are needed.

Supplementary Materials

The following are available online at https://www.mdpi.com/2073-4395/10/1/67/s1, Table S1: AquaCrop parameters applied in all simulations. Table S2: Atmosphere CO2 concentrations (Mauna Luo, ppm) and AquaCrop derived growing season related crop phenology parameters (number of days from day 1 after sowing) for each study year.

Author Contributions

B.D.: planning the study, data collection, data analysis, and joint manuscript preparation; M.S.: planning the study, data collection, data analysis, and joint manuscript preparation; J.H.: planning the study and contribution to manuscript preparation. All authors have read and agreed to the published version of the manuscript.

Funding

This research received no external funding.

Acknowledgments

The authors wish to acknowledge the comments and improvements suggested by the reviewers.

Conflicts of Interest

The authors declare no conflict of interest.

References

  1. Bantilan, M.C.S.; Anand Babu, P.; Anupama, G.V.; Deepthi, H.; Padmaja, R. Dryland Agriculture: Dynamics, Challenges and Priorities; Research Bulletin No. 20; International Crops Research Institute for the Semi-Arid Tropics: Andhra Pradesh, India, 2006; p. 32. ISBN 92-9066-496-7. [Google Scholar]
  2. Fjelde, H.; von Uexkull, N. Climate triggers: Rainfall anomalies, vulnerability and communal conflict in Sub-Saharan Africa. Polit. Geogr. 2012, 31, 444–453. [Google Scholar] [CrossRef]
  3. Kotir, J.H. Climate change and variability in Sub-Saharan Africa: A review of current and future trends and impacts on agriculture and food security. Environ. Dev. Sustain. 2011, 13, 587–605. [Google Scholar] [CrossRef]
  4. Msongaleli, B.M.; Tumbo, S.D.; Kihupi, N.I.; Rwehumbiza, F.B. Performance of sorghum varieties under variable rainfall in central Tanzania. Int. Sch. Res. Not. 2017, 2017, 2506946. [Google Scholar] [CrossRef] [Green Version]
  5. Ratnavathi, C.V.; Patil, J.V. Sorghum utilization as food. J. Nutr. Food Sci. 2013, 4, 247. [Google Scholar] [CrossRef] [Green Version]
  6. FAOSTAT Crops. Available online: http://www.fao.org/faostat/en/#home (accessed on 23 October 2019).
  7. Steduto, P.; Hsiao, T.C.; Fereres, E.; Raes, D. Crop Yield Response to Water; Irrigation and Drainage Paper No. 66; Food and Agricultural Organization: Rome, Italy, 2012; p. 500. Available online: http://www.fao.org/3/a-i2800e.pdf (accessed on 29 October 2019).
  8. FAO/WFP. Crop and Food Security Assessment Mission to South Sudan; Special Report; Food and Agriculture Organization World Food Programme: Rome, Italy, 2018; p. 69. Available online: http://www.fao.org/3/I8702EN/i8702en.pdf (accessed on 17 December 2019).
  9. Gichangi, E.M.; Gatheru, M.; Njiru, E.N.; Mungube, E.O.; Wambua, J.M.; Wamuongo, J.W. Assessment of climate variability and change in semi-arid eastern Kenya. Clim. Chang. 2015, 130, 287–297. [Google Scholar] [CrossRef]
  10. Lehmann, J.; Joseph, S. (Eds.) Biochar for Environmental Management; Routledge: London, UK, 2015; p. 976. ISBN 9780203762264. [Google Scholar] [CrossRef]
  11. Liu, X.; Zhang, A.; Ji, C.; Joseph, S.; Bian, R.; Li, L.; Pan, G.; Paz-Ferreiro, J. Biochar’s effect on crop productivity and the dependence on experimental conditions—A meta-analysis of literature data. Plant Soil 2013, 373, 583–594. [Google Scholar] [CrossRef]
  12. Omondi, M.O.; Xia, X.; Nahayo, A.; Liu, X.; Korai, P.K.; Pan, G. Quantification of biochar effects on soil hydrological properties using meta-analysis literature data. Geoderma 2016, 274, 28–34. [Google Scholar] [CrossRef]
  13. Jeffery, S.; Abalos, D.; Prodana, M.; Bastos, A.C.; van Groenigen, J.W.; Hungate, B.A.; Verheijen, F. Biochar boosts tropical but not temperate crop yields. Environ. Res. Lett. 2017, 12, 053001. [Google Scholar] [CrossRef]
  14. Gwenzi, W.; Chaukura, N.; Mukome, F.N.D.; Machado, S.; Nyamasoka, B. Biochar production and applications in sub-Saharan Africa: Opportunities, constraints, risks and uncertainties. J. Environ. Manag. 2015, 150, 250–261. [Google Scholar] [CrossRef]
  15. Nyambo, P.; Taeni, T.; Chiduza, C.; Araya, T. Effects of maize residue biochar amendments on soil properties and soil loss on acidic Hutton soil. Agronomy 2018, 8, 256. [Google Scholar] [CrossRef] [Green Version]
  16. Kätterer, T.; Roobroeck, D.; Andrén, O.; Kimutai, G.; Karltun, E.; Kirchmann, H.; Nyberg, G.; Vanlauwe, B.; de Nowina, K.R. Biochar addition persistently increased soil fertility and yields in maize-soybean rotations over 10 years in sub-humid regions of Kenya. Field Crop. Res. 2019, 235, 18–25. [Google Scholar] [CrossRef]
  17. Deng, B.; Tammeorg, P.; Luukkanen, O.; Helenius, J.; Starr, M. Effects of Acacia seyal and biochar on soil properties and sorghum yield in agroforestry systems in South Sudan. Agrofor. Syst. 2017, 91, 137–148. [Google Scholar] [CrossRef] [Green Version]
  18. Deng, B.; Bada, B.; Tammeorg, P.; Helenius, J.; Luukkanen, O.; Starr, M. Drought stress and Acacia seyal biochar effects on sorghum gas exchange and yield: A greenhouse experiment. Agric. Nat. Resour. 2019, 53, 573–580. [Google Scholar]
  19. Steduto, P.; Hsiao, T.C.; Raes, D.; Fereres, E. AquaCrop—The FAO crop model to simulate yield response to water: I. Concepts and underlying principles. Agron. J. 2009, 101, 426–437. [Google Scholar] [CrossRef] [Green Version]
  20. Raes, D.; Steduto, P.; Hsiao, T.C.; Fereres, E. AquaCrop—The FAO crop model to simulate yield response to water: II. Main algorithms and software description. Agron. J. 2009, 101, 438–447. [Google Scholar] [CrossRef] [Green Version]
  21. Raes, D.; Steduto, P.; Hsiao, T.C.; Fereres, E. AquaCrop Reference Manual (Version 6.0–6.1), Chapter 3 Calculation Procedures; Food and Agriculture Organization: Rome, Italy, 2018; Chapter 3; p. 141. Available online: http://www.fao.org/3/br267e/BR267E.pdf (accessed on 29 October 2019).
  22. Saha, S.; Moorthi, S.; Pan, H.-L.; Wu, X.; Wang, J.; Nadiga, S.; Tripp, P.; Kistler, R.; Woollen, J.; Behringer, D.; et al. The NCEP Climate Forecast System Reanalysis. Bull. Am. Meteorol. Soc. 2010, 91, 1015–1057. [Google Scholar] [CrossRef]
  23. Dile, Y.T.; Srinivasan, R. Evaluation of CFSR climate data for hydrologic prediction in data-scarce watersheds: An application in the Blue Nile River Basin. J. Am. Water Resour. Assoc. 2014, 50, 1226–1241. [Google Scholar] [CrossRef]
  24. Fuka, D.R.; Walter, M.T.; MacAllister, C.; Degaetano, A.T.; Steenhuis, T.S.; Easton, Z.M. Using the Climate Forecast System Reanalysis dataset to improve weather input data for watershed models. Hydrol. Process. 2014, 28, 5613–5623. [Google Scholar] [CrossRef]
  25. Global Weather Data for SWAT. Available online: https://globalweather.tamu.edu/ (accessed on 20 March 2019).
  26. Allen, R.G.; Pereira, L.S.; Raes, D.; Smith, M. Crop Evapotranspiration: Guidelines for Computing Crop Water Requirements; Irrigation and Drainage Paper No. 56; Food and Agriculture Organization: Rome, Italy, 1998; p. 300. Available online: http://www.fao.org/docrep/x0490e/x0490e00.htm (accessed on 29 October 2019).
  27. Pinheiro, C.; Chaves, M.M. Photosynthesis and drought: Can we make metabolic connections from available data? J. Exp. Bot. 2011, 62, 869–882. [Google Scholar] [CrossRef] [Green Version]
  28. Holzworth, D.P.; Huth, N.I.; deVoil, P.G.; Zurcher, E.J.; Herrmann, N.I.; McLean, G.; Chenu, K.; van Oosterom, E.J.; Snow, V.; Murphy, C.; et al. APSIM – Evolution towards a New Generation of Agricultural Systems Simulation. Environ. Modell. Softw. 2014, 62, 327–350. [Google Scholar] [CrossRef]
  29. Vadez, V.; Kholova, J.; Medina, S.; Kakkera, A.; Anderberg, H. Transpiration efficiency: New insights into an old story. J. Exp. Bot. 2014, 65, 6141–6153. [Google Scholar] [CrossRef] [PubMed] [Green Version]
  30. Wamari, J.O.; Sijali, I.; Kheng, L.; Miriti, J.; Obutiati, E. Use of AquaCrop model to predict maize yields under varying rainfall and temperature in a semi-arid environment in Kenya. J. Meteorol. Relat. Sci. 2012, 6, 26–35. [Google Scholar] [CrossRef]
  31. Hadebe, S.T.; Modi, A.T.; Mabhaudhi, T. Calibration and testing of AquaCrop for selected sorghum genotypes. Water SA 2017, 43, 209–221. [Google Scholar] [CrossRef] [Green Version]
  32. Bello, Z.A.; Walker, S. Calibration and validation of AquaCrop for pearl millet (Pennisetum glaucum). Crop Pasture Sci. 2016, 67, 948–960. [Google Scholar] [CrossRef]
  33. Mibulo, T.; Kiggundu, N. Evaluation of FAO AquaCrop model for simulating rainfed maize growth and yields in Uganda. Agronomy 2018, 8, 238. [Google Scholar] [CrossRef] [Green Version]
  34. Ahmed, A.A.; Hassan, M.S.M.; El Naim, A.M. Evaluation of some local sorghum genotypes in North Kordofan of Sudan semi-arid agro-ecological environment. Int. J. Agric. For. 2016, 6, 54–57. [Google Scholar] [CrossRef]
  35. Jeffery, S.; Meinders, M.B.J.; Stoof, C.R.; Bezemer, T.M.; van de Voorde, T.F.J.; Mommer, L.; van Groenigen, J.W. Biochar application does not improve the soil hydrological function of a sandy soil. Geoderma 2015, 251, 47–54. [Google Scholar] [CrossRef]
  36. Xiao, Q.; Zhu, L.; Shen, Y.; Li, S. Sensitivity of soil water retention and availability to biochar addition in rainfed semi-arid farmland during a three-year field experiment. Field Crop. Res. 2016, 196, 284–293. [Google Scholar] [CrossRef]
  37. Castellini, M.; Giglio, L.; Niedda, M.; Palumbo, A.D.; Ventrella, D. Impact of biochar addition on the physical and hydraulic properties of a clay soil. Soil Tillage Res. 2015, 154, 1–13. [Google Scholar] [CrossRef]
  38. Chen, C.; Wang, R.; Shang, J.; Liu, K.; Irshad, M.K.; Hu, K.; Arthur, E. Effect of biochar application on hydraulic properties of sandy soil under dry and wet Conditions. Vadose Zone J. 2018, 17. [Google Scholar] [CrossRef] [Green Version]
  39. Bahar, A.H.; Adam, K.I.; Mohamed Ali, S.A. Performance of some sorghum (Sorghum Bicolor L. Moench) varieties under rain-fed condition at Zalingei Area, Sudan (growth, yield, pests and diseases). Agric. Biol. Sci. J. 2015, 1, 162–166. [Google Scholar]
Figure 1. Daily rainfall (CFRS) and AquaCrop-simulated Penman-Montieth reference evapotranspiration (ETo), evapotranspiration (ET), and infiltration for day of the year (DOY) 100 to 350 in 1990, 2011, and 2012. Shaded area covers the growing season. Note the different y-axis scales used for 1990 rainfall and infiltration compared to 2011 and 2012. ET and infiltration values are for the no biochar scenario (BC0) (simulated biochar amendments had little effect on ET and infiltration).
Agronomy 10 00067 g001
Figure 2. AquaCrop-simulated daily water content (mm) of effective rooting zone for no biochar (BC0) and biochar amendments (BC1, BC2, BC3, and BC4: see Table 1 for explanation) during the (a) 1990, (b) 2011, and (c) 2012 growing seasons. DOY = 1 August–30 November. Grey lines = water content of root zone at saturation (upper line), at field capacity (middle line), and at permanent wilting point (lower line).
Agronomy 10 00067 g002
Figure 3. AquaCrop-simulated daily cumulative transpiration (mm) for no biochar (BC0) and biochar amendments (BC1, BC2, BC3 and BC4—see Table 1 for explanation) during the 1990, 2011, and 2012 growing seasons. DOY = 1 August–30 November.
Agronomy 10 00067 g003
Figure 4. AquaCrop-simulated cumulative aboveground biomass and grain yield for the 1990 (a,b), 2011 (c,d), and 2012 (e,f) growing seasons by biochar amendment (see Table 1). Values in parentheses are the values at the time of harvesting. Field experiment measured values for 2011 and 2012 are the mean of sorghum only plots [17].
Agronomy 10 00067 g004
Table 1. Hydraulic properties of the upper 30 cm layer of silty loam according to the biochar amendments based on Omondi et al. [12] and those of the underlying clay used in the AquaCrop simulations.
Soil Layer and Biochar AmendmentSoil Hydraulic Property b
θSAT, %θFC, %θPWP, %θTAW, %Ksat, mm day−1Change in Properties Due to Biochar Amendment Compared to BC0
Silty Loam
BC0 a46331320575
BC149351322690θFC 10% increase, θSAT 7%, Ksat 20% increase
BC249351322730θFC 10% increase, θSAT 7%, Ksat 27% increase
BC349371324690θFC 20% increase, θSAT 7%, Ksat 20% increase
BC449371324730θFC 20% increase, θSAT 7%, Ksat 27% increase
Clay a5554391535
a Values for silty loam and clay soil texture classes [20]. b Increases in θTAW, total available water content (=θFC − θPWP), are assumed to be due to an increase in θFC. Legend: θSAT, saturation; θFC, volumetric water content at field capacity; θPWP, permanent wilting point; Ksat, saturated hydraulic conductivity; BC0, baseline hydraulic property values of the silty loam and underlying clay representing no biochar amendment.

