End-Of-Day LED Lightings Influence the Leaf Color, Growth and Phytochemicals in Two Cultivars of Lettuce
Abstract
1. Introduction
2. Materials and Methods
2.1. Plant Materials
2.2. Light Treatments
2.3. Growth Measurements
2.4. Color Measurements
2.5. Chlorophyll and Carotenoids Measurements
2.6. Total Anthocyanins Measurement
2.7. Phytochemical Measurement
2.8. Data Analysis
3. Results
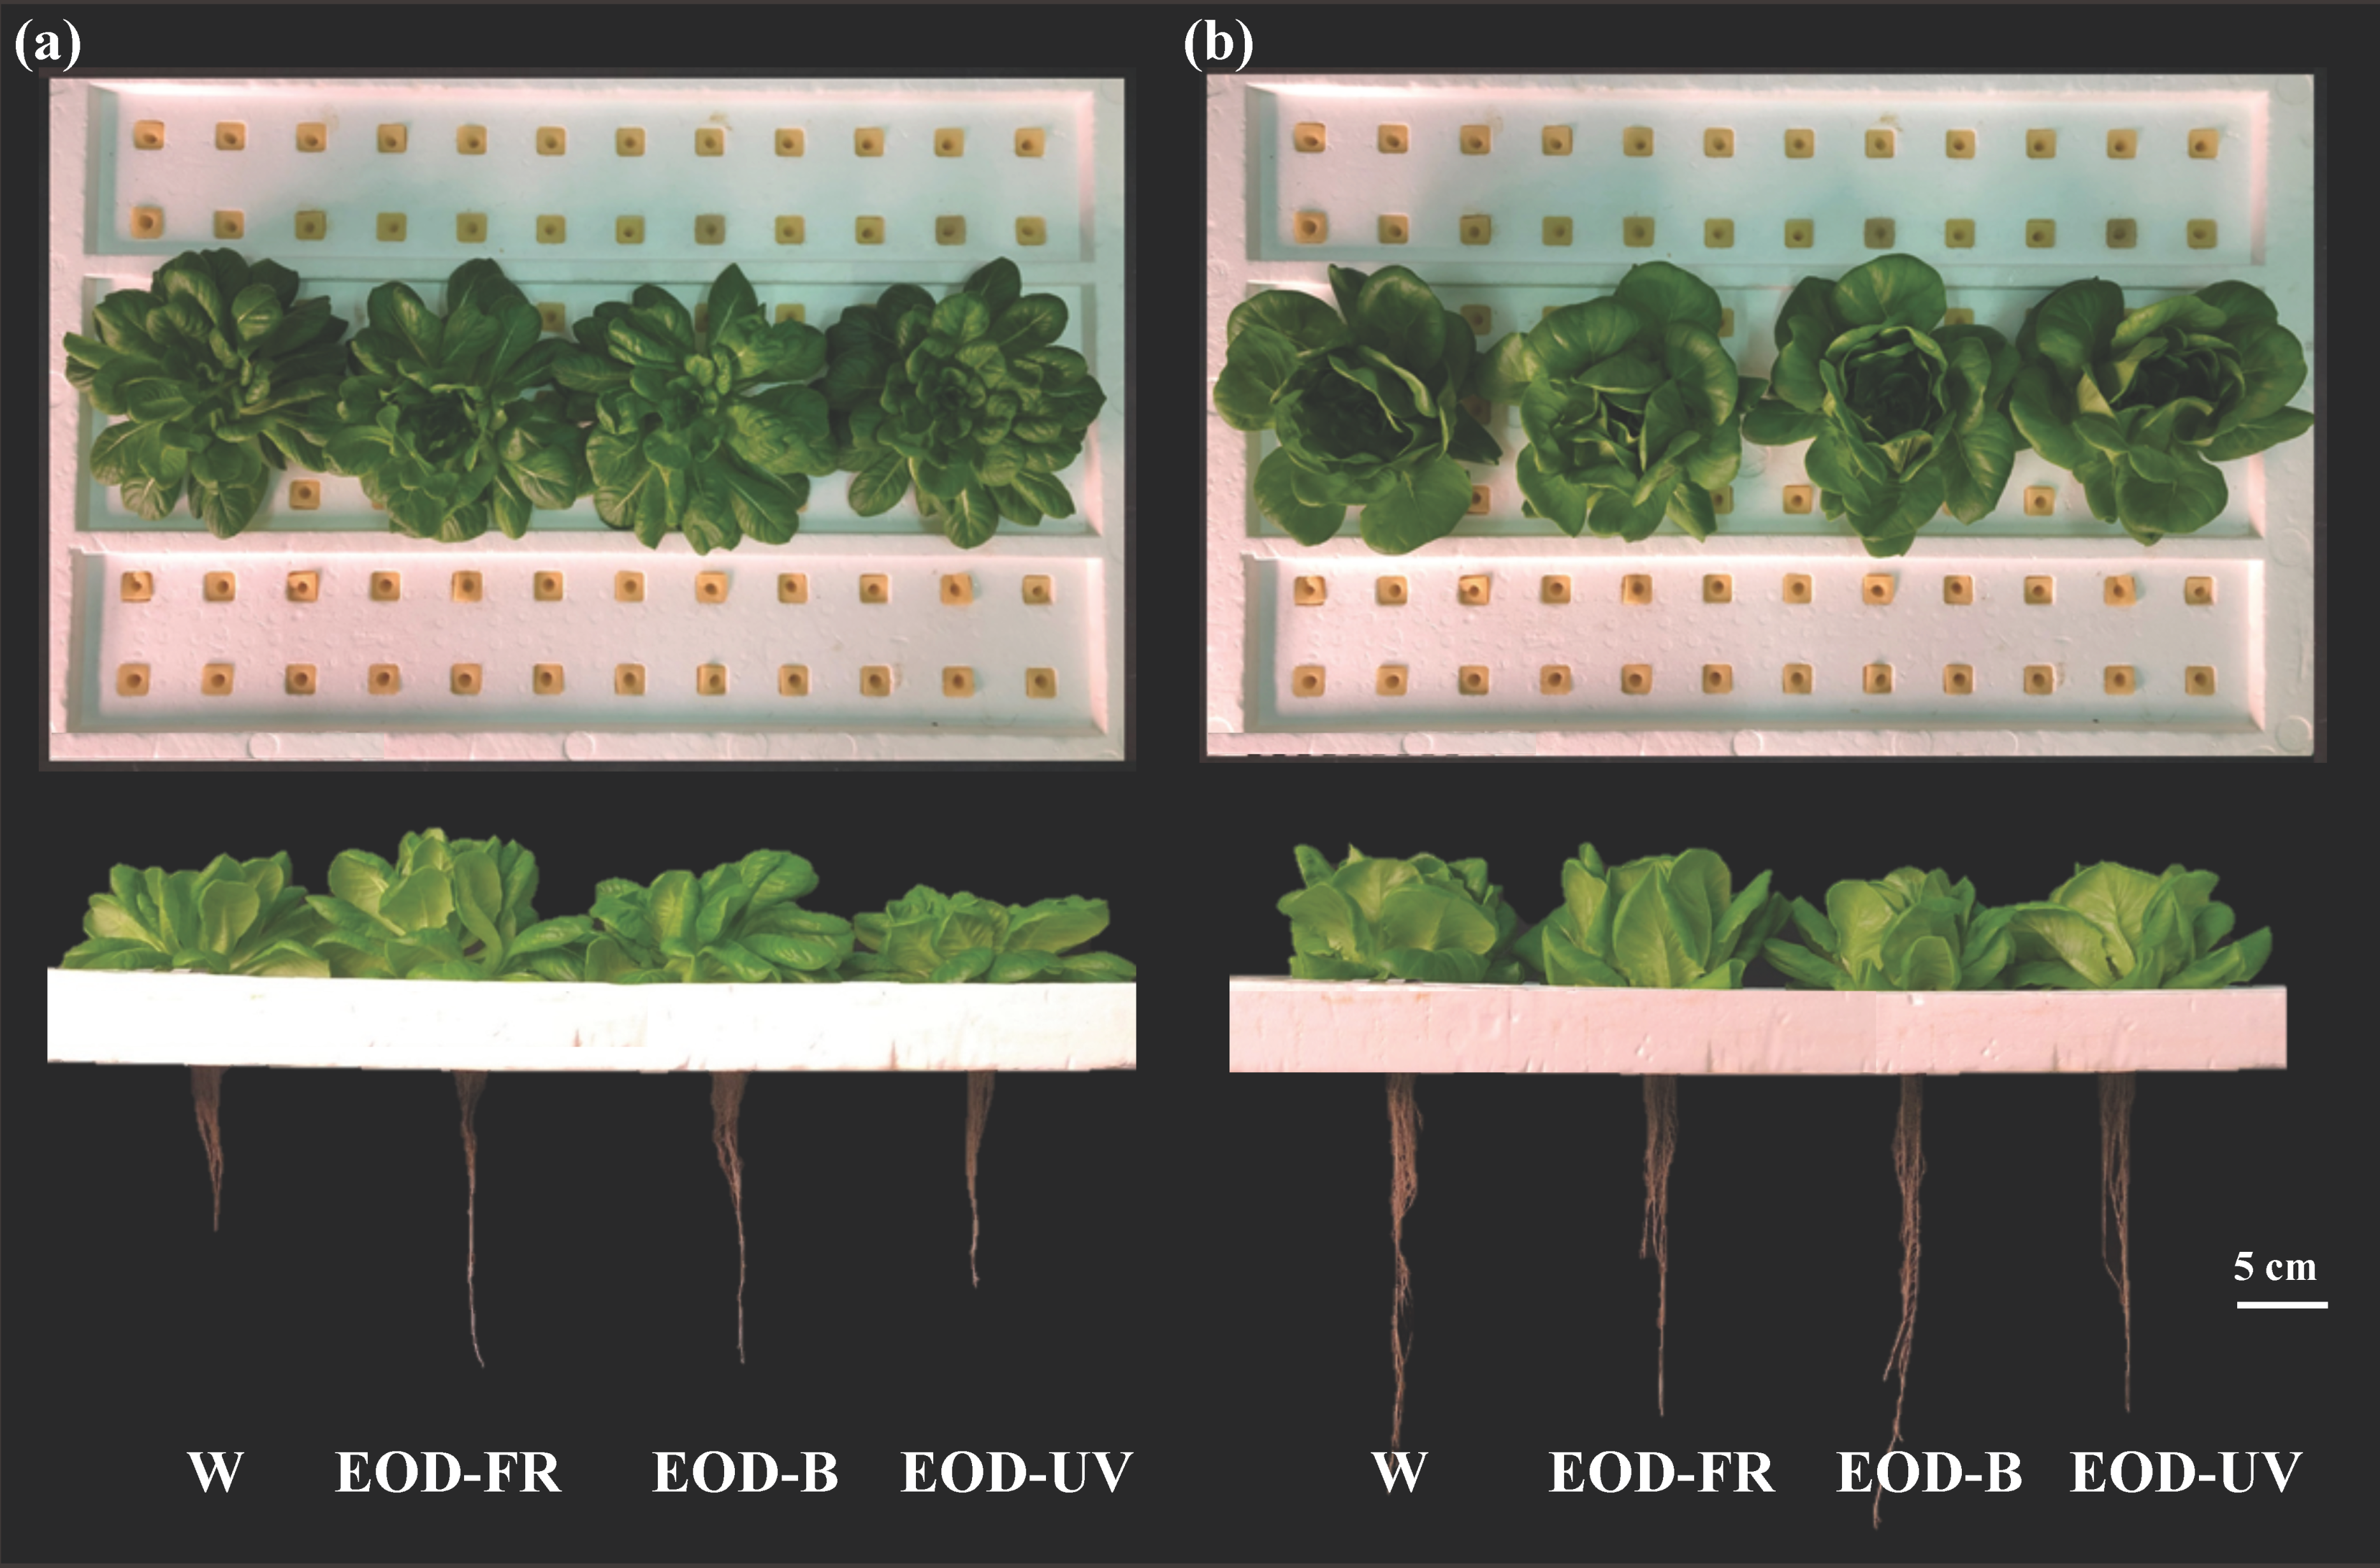
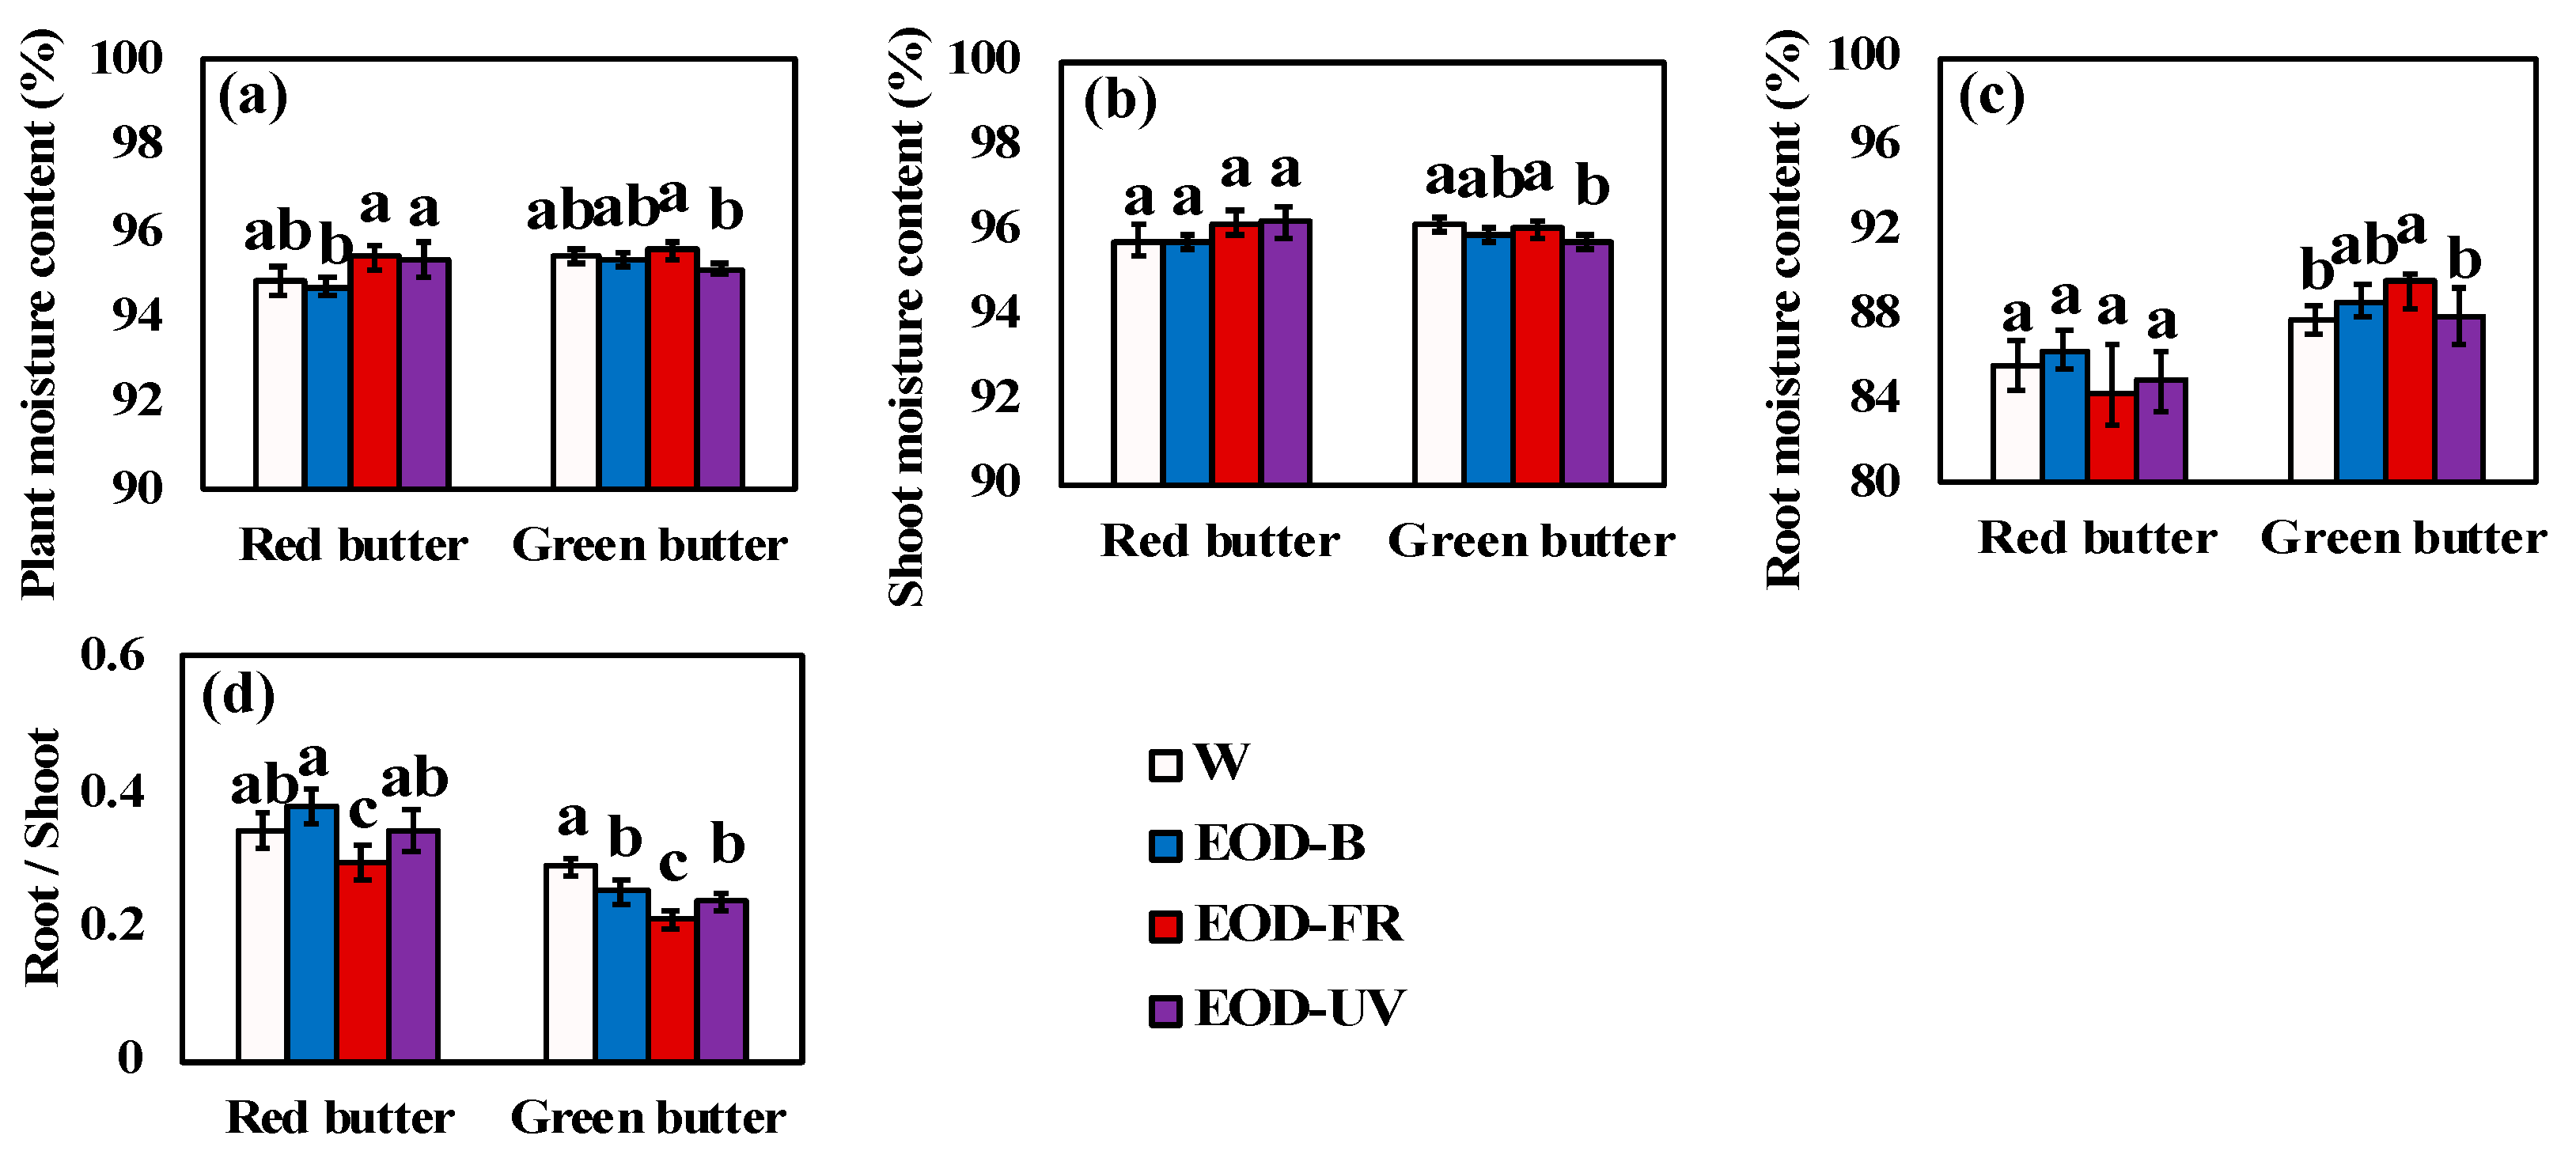
3.1. Growth and Biomass
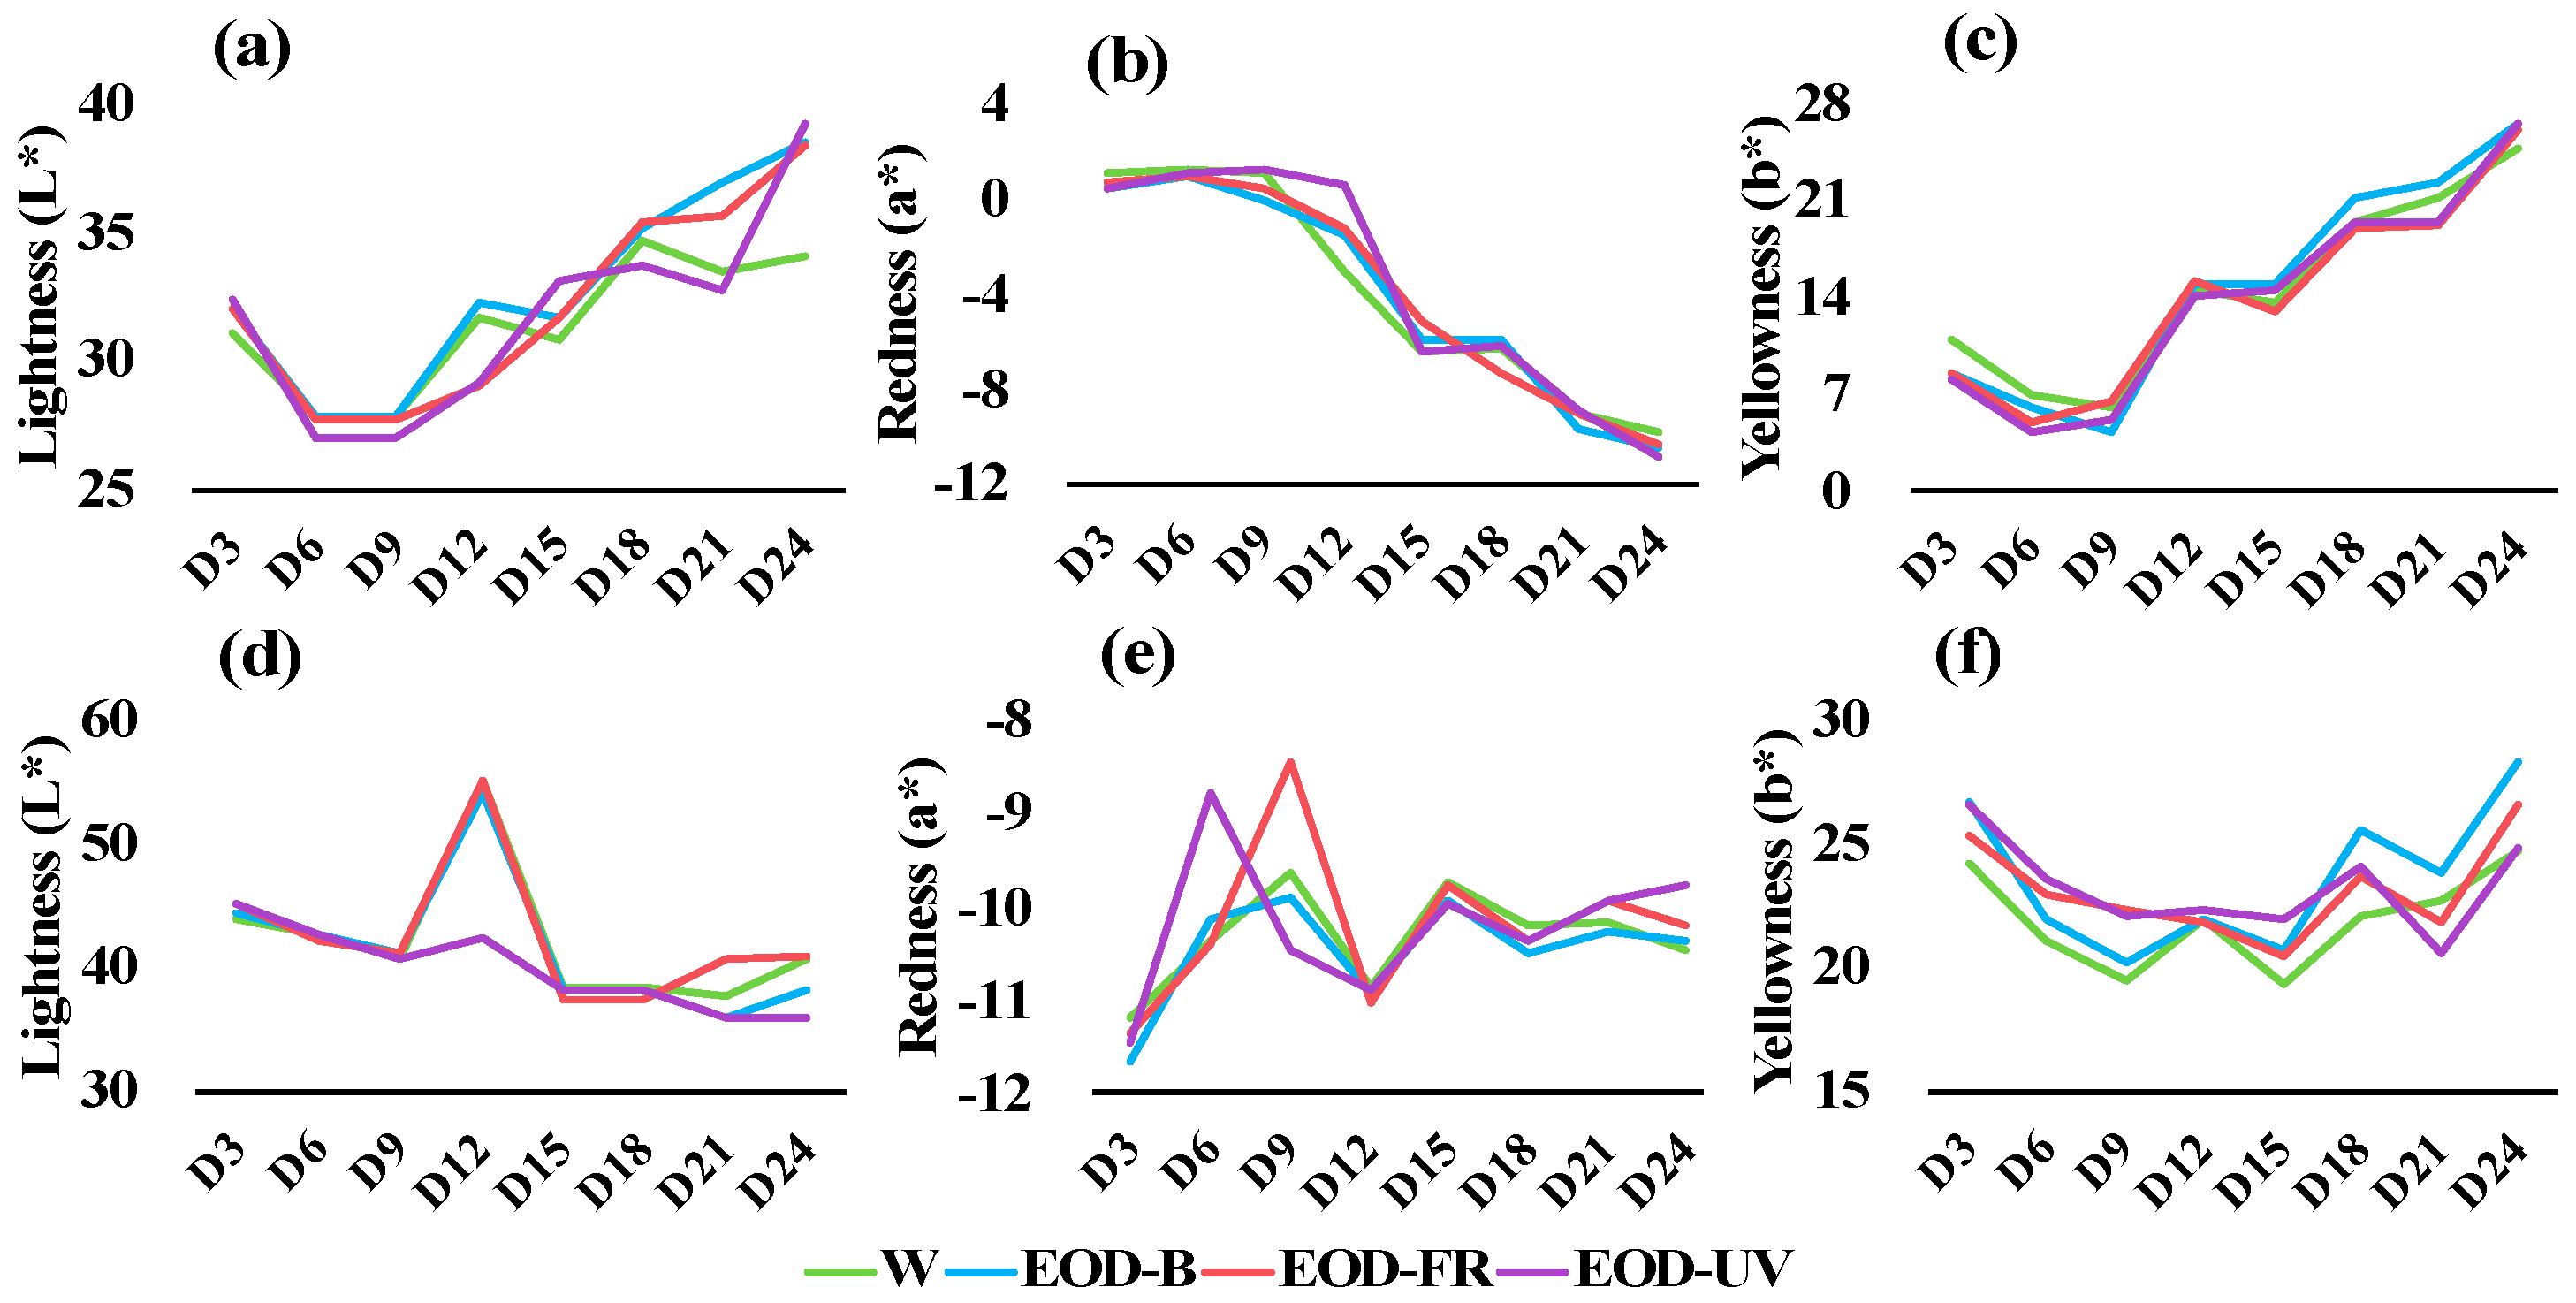
3.2. Leaf Color Transformation and Pigment Content
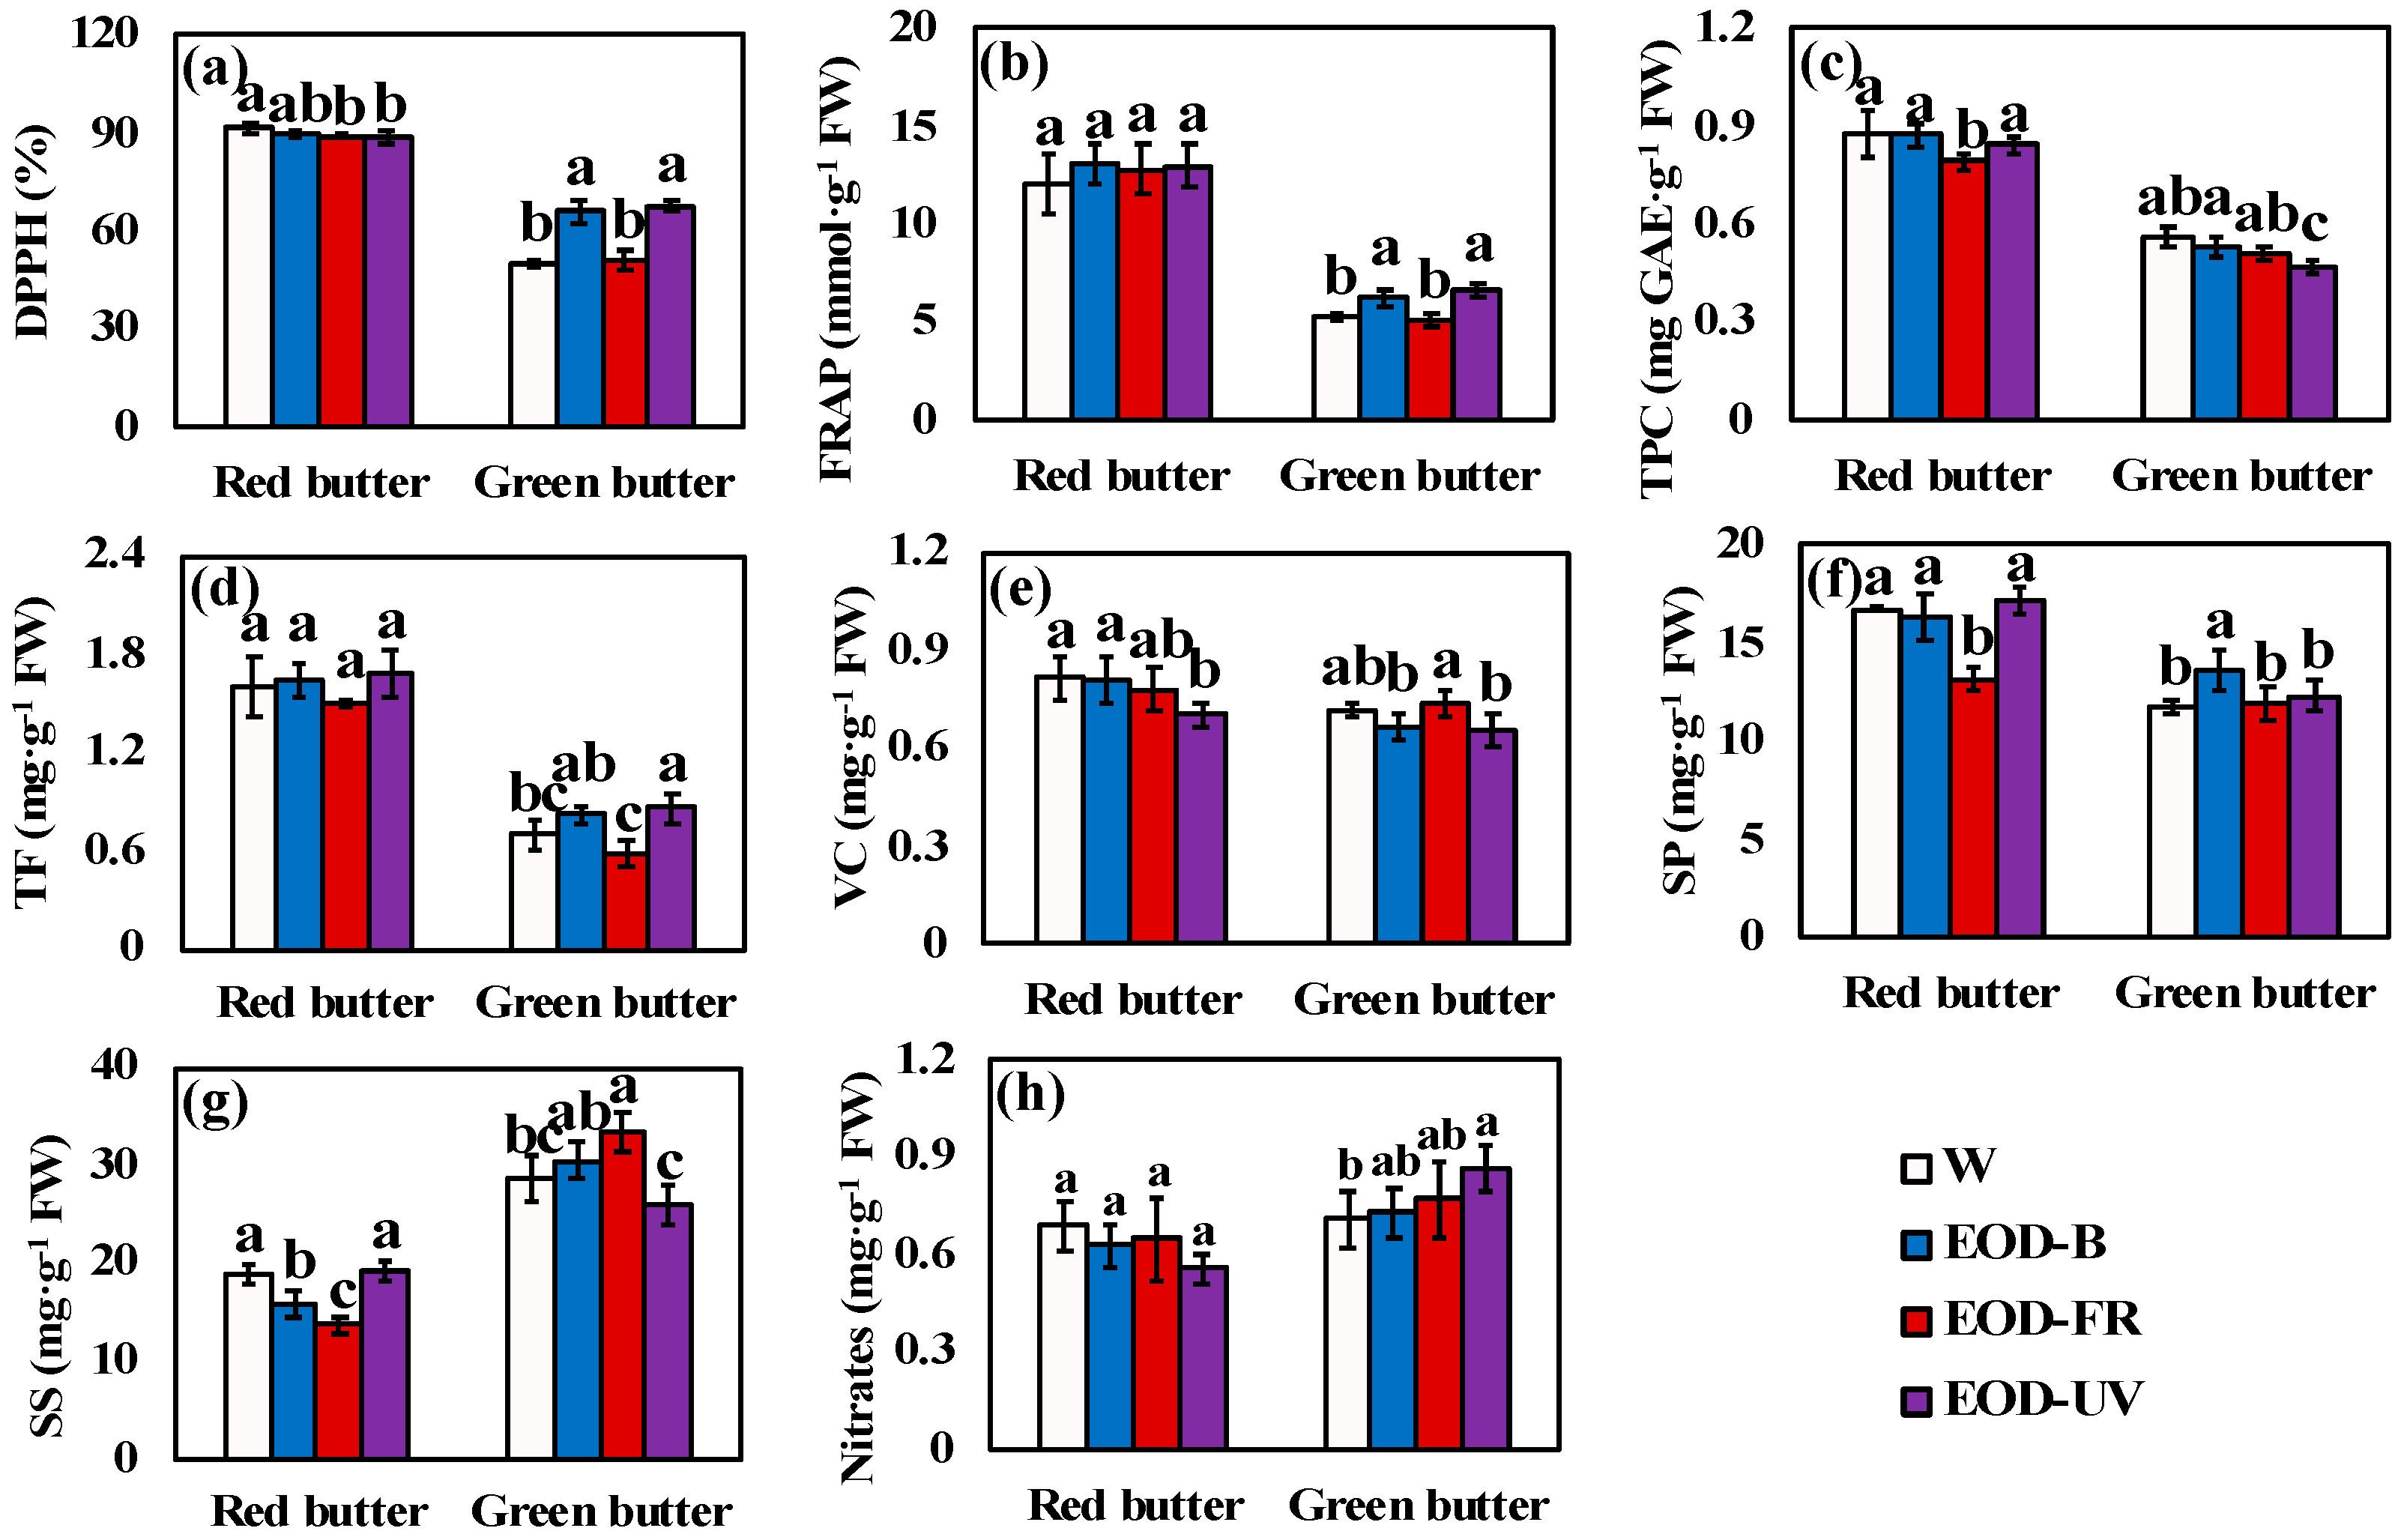
3.3. Phytochemical Profiles
3.4. Multivariate Principal Component Analysis
3.5. Heatmap Analysis
4. Discussion
4.1. Lettuce Biomass in Response to End-Of-Day Lightings Growth and Biomass
4.2. Leaf Color Responds to End-Of-Day Lightings
4.3. Lettuce Phytochemical Profiles in Relation to End-Of-Day Lightings
5. Conclusions
Author Contributions
Funding
Conflicts of Interest
References
- Song, J.; Huang, H.; Song, S.; Zhang, Y.; Su, W.; Liu, H. Effects of photoperiod interacted with nutrient solution concentration on nutritional quality and antioxidant and mineral content in lettuce. Agronomy 2020, 10, 920. [Google Scholar] [CrossRef]
- Song, J.; Huang, H.; Hao, Y.; Song, S.; Zhang, Y.; Su, W.; Liu, H. Nutritional quality, mineral and antioxidant content in lettuce affected by interaction of light intensity and nutrient solution concentration. Sci. Rep. 2020, 10, 2796. [Google Scholar] [CrossRef] [PubMed]
- Massa, G.D.; Kim, H.H.; Wheeler, R.M.; Mitchell, C.A. Plant productivity in response to LED lighting. HortScience 2008, 43, 1951–1956. [Google Scholar] [CrossRef]
- Ohashi-Kaneko, K.; Tarase, M.; Noya, K.O.N.; Fujiwara, K.; Kurata, K. Effect of light quality on growth and vegetable quality in leaf lettuce, spinach and komatsuna. Environ. Control Biol. 2007, 45, 189–198. [Google Scholar] [CrossRef]
- Chinchilla, S.; Izzo, L.G.; Van Santen, E.; Gómez, C. Growth and physiological responses of lettuce grown under pre-dawn or end-of-day sole-source light-quality treatments. Horticulturae 2018, 4, 8. [Google Scholar] [CrossRef]
- Franklin, K.A.; Quail, P.H. Phytochrome functions in Arabidopsis development. J. Exp. Bot. 2010, 61, 11–24. [Google Scholar] [CrossRef] [PubMed]
- Ballaré, C.L. Light regulation of plant defense. Annu. Rev. Plant Biol. 2014, 65, 335–363. [Google Scholar] [CrossRef] [PubMed]
- Demotes-Mainard, S.; Péron, T.; Corot, A.; Bertheloot, J.; Le Gourrierec, J.; Pelleschi-Travier, S.; Crespel, L.; Morel, P.; Huché-Thélier, L.; Boumaza, R.; et al. Plant responses to red and far-red lights, applications in horticulture. Environ. Exp. Bot. 2016, 121, 4–21. [Google Scholar] [CrossRef]
- Huché-Thélier, L.; Crespel, L.; Le Gourrierec, J.; Morel, P.; Sakr, S.; Leduc, N. Light signaling and plant responses to blue and UV radiations-Perspectives for applications in horticulture. Environ. Exp. Bot. 2016, 121, 22–38. [Google Scholar] [CrossRef]
- Arena, C.; Tsonev, T.; Doneva, D.; De Micco, V.; Michelozzi, M.; Brunetti, C.; Centritto, M.; Fineschi, S.; Velikova, V.; Loreto, F. The effect of light quality on growth, photosynthesis, leaf anatomy and volatile isoprenoids of a monoterpene-emitting herbaceous species (Solanum lycopersicum L.) and an isoprene-emitting tree (Platanus orientalis L.). Environ. Exp. Bot. 2016, 130, 122–132. [Google Scholar] [CrossRef]
- Izzo, L.G.; Arena, C.; De Micco, V.; Capozzi, F.; Aronne, G. Light quality shapes morpho-functional traits and pigment content of green and red leaf cultivars of Atriplex hortensis. Sci. Hortic. 2019, 246, 942–950. [Google Scholar] [CrossRef]
- Hogewoning, S.W.; Wientjes, E.; Douwstra, P.; Trouwborst, G.; van Ieperen, W.; Croce, R.; Harbinson, J. Photosynthetic quantum yield dynamics: From photosystems to leaves. Plant Cell 2012, 24, 1921–1935. [Google Scholar] [CrossRef] [PubMed]
- Flint, L.H.; Mc, E.D.; Lister, A. Wave lengths of radiation in the visible spectrum promoting the germination of light-sensitive lettuce seed. Smithson. Misc. Collect. 1937, 96, 1–8. [Google Scholar]
- Jiao, Y.; Lau, O.S.; Deng, X.W. Light-regulated transcriptional networks in higher plants. Nat. Rev. Genet. 2007, 8, 217–230. [Google Scholar] [CrossRef]
- Zhang, J.; Zhang, Y.; Song, S.; Su, W.; Hao, Y.; Liu, H. Supplementary red light results in the earlier ripening of tomato fruit depending on ethylene production. Environ. Exp. Bot. 2020, 175, 104044. [Google Scholar] [CrossRef]
- Chia, P.L.; Kubota, C. End-of-day far-red light quality and dose requirements for tomato rootstock hypocotyl elongation. HortScience 2010, 45, 1501–1506. [Google Scholar] [CrossRef]
- Kasperbauer, M.J. Spectral distribution of light in a tobacco canopy and effects of end-of-day light quality on growth and development. Plant Physiol. 1971, 47, 775–778. [Google Scholar] [CrossRef]
- Meng, Q.; Runkle, E.S. Far-red radiation interacts with relative and absolute blue and red photon flux densities to regulate growth, morphology, and pigmentation of lettuce and basil seedlings. Sci. Hortic. 2019, 255, 269–280. [Google Scholar] [CrossRef]
- Yang, Z.C.; Kubota, C.; Chia, P.L.; Kacira, M. Effect of end-of-day far-red light from a movable LED fixture on squash rootstock hypocotyl elongation. Sci. Hortic. 2012, 136, 81–86. [Google Scholar] [CrossRef]
- Izzo, L.G.; Hay Mele, B.; Vitale, L.; Vitale, E.; Arena, C. The role of monochromatic red and blue light in tomato early photomorphogenesis and photosynthetic traits. Environ. Exp. Bot. 2020, 179, 104195. [Google Scholar] [CrossRef]
- Legris, M.; Boccaccini, A. Stem phototropism toward blue and ultraviolet light. Physiol. Plant. 2020, 169, 357–368. [Google Scholar] [CrossRef] [PubMed]
- Horrer, D.; Flütsch, S.; Pazmino, D.; Matthews, J.S.A.; Thalmann, M.; Nigro, A.; Leonhardt, N.; Lawson, T.; Santelia, D. Blue light induces a distinct starch degradation pathway in guard cells for stomatal opening. Curr. Biol. 2016, 26, 362–370. [Google Scholar] [CrossRef] [PubMed]
- Miao, Y.; Chen, Q.; Qu, M.; Gao, L.; Hou, L. Blue light alleviates ‘red light syndrome’ by regulating chloroplast ultrastructure, photosynthetic traits and nutrient accumulation in cucumber plants. Sci. Hortic. 2019, 257, 108680. [Google Scholar] [CrossRef]
- Chen, Y.; Li, T.; Yang, Q.; Zhang, Y.; Zou, J.; Bian, Z.; Wen, X. UVA Radiation is beneficial for yield and quality of indoor cultivated lettuce. Front. Plant Sci. 2019, 10, 1563:1–1563:31. [Google Scholar] [CrossRef]
- Wang, X.Y.; Xu, X.M.; Cui, J. The importance of blue light for leaf area expansion, development of photosynthetic apparatus, and chloroplast ultrastructure of Cucumis sativus grown under weak light. Photosynthetica 2015, 53, 213–222. [Google Scholar] [CrossRef]
- Liscum, E.; Askinosie, S.K.; Leuchtman, D.L.; Morrow, J.; Willenburg, K.T.; Coats, D.R. Phototropism: Growing towards an understanding of plant movement. Plant Cell 2014, 26, 38–55. [Google Scholar] [CrossRef] [PubMed]
- Fankhauser, C.; Christie, J.M. Plant phototropic growth. Curr. Biol. 2015, 25, 384–389. [Google Scholar] [CrossRef]
- Verdaguer, D.; Jansen, M.A.K.; Llorens, L.; Morales, L.O.; Neugart, S. UV-A radiation effects on higher plants: Exploring the known unknown. Plant Sci. 2017, 255, 72–81. [Google Scholar] [CrossRef] [PubMed]
- Islam, M.A.; Tarkowská, D.; Clarke, J.L.; Blystad, D.R.; Gislerød, H.R.; Torre, S.; Olsen, J.E. Impact of end-of-day red and far-red light on plant morphology and hormone physiology of poinsettia. Sci. Hortic. 2014, 174, 77–86. [Google Scholar] [CrossRef]
- Lichtenthaler, H.K.; Wellburn, A.R. Determinations of total carotenoids and chlorophylls a and b of leaf extracts in different solvents. Biochem. Soc. Trans. 1983, 11, 591–592. [Google Scholar] [CrossRef]
- Rapisarda, P.; Fallico, B.; Izzo, R.; Maccarone, E. A simple and reliable method for determining anthocyanins in blood orange juices. Agrochimica 1994, 1–2, 157–164. [Google Scholar]
- Musa, K.H.; Abdullah, A.; Kuswandi, B.; Hidayat, M.A. A novel high throughput method based on the DPPH dry reagent array for determination of antioxidant activity. Food Chem. 2013, 141, 4102–4106. [Google Scholar] [CrossRef] [PubMed]
- Tadolini, B.; Juliano, C.; Piu, L.; Franconi, F.; Cabrini, L. Resveratrol inhibition of lipid peroxidation. Free Radic. Res. 2000, 33, 105–114. [Google Scholar] [CrossRef]
- Sánchez-Rangel, J.C.; Benavides, J.; Heredia, J.B.; Cisneros-Zevallos, L.; Jacobo-Velázquez, D.A. The Folin-Ciocalteu assay revisited: Improvement of its specificity for total phenolic content determination. Anal. Methods 2013, 5, 5990–5999. [Google Scholar] [CrossRef]
- Blakesley, R.W.; Boezi, J.A. Short communication: A new staining technique for proteins gels using Coomassie brilliant blue G250. Anal. Biochem. 1977, 82, 580–582. [Google Scholar] [CrossRef]
- Kohyama, K.; Nishinari, K. Effect of soluble sugars on gelatinization and retrogradation of sweet potato starch. J. Agric. Food Chem. 1991, 39, 1406–1410. [Google Scholar] [CrossRef]
- Shyamala, B.N.; Jamuna, P. Nutritional content and antioxidant properties of pulp waste from Daucus carota and Beta vulgaris. Malays. J. Nutr. 2010, 16, 397–408. [Google Scholar] [CrossRef]
- Cataldo, D.A.; Haroon, M.H.; Schrader, L.E.; Youngs, V.L. Rapid colorimetric determination of nitrate in plant tissue by nitration of salicylic acid. Commun. Soil Sci. Plant Anal. 1975, 6, 71–80. [Google Scholar] [CrossRef]
- Chen, C.; Xia, R.; Chen, H.; He, Y. TBtools, a toolkit for biologists integrating various HTS-data handling tools with a user-friendly interface. bioRxiv 2018. [Google Scholar] [CrossRef]
- Li, Q.; Kubota, C. Effects of supplemental light quality on growth and phytochemicals of baby leaf lettuce. Environ. Exp. Bot. 2009, 67, 59–64. [Google Scholar] [CrossRef]
- Mickens, M.A.; Skoog, E.J.; Reese, L.E.; Barnwell, P.L.; Spencer, L.E.; Massa, G.D.; Wheeler, R.M. A strategic approach for investigating light recipes for ‘Outredgeous’ red romaine lettuce using white and monochromatic LEDs. Life Sci. Space Res. 2018, 19, 53–62. [Google Scholar] [CrossRef] [PubMed]
- Park, Y.; Runkle, E.S. Far-red radiation promotes growth of seedlings by increasing leaf expansion and whole-plant net assimilation. Environ. Exp. Bot. 2017, 136, 41–49. [Google Scholar] [CrossRef]
- Claypool, N.B.; Lieth, J.H. Physiological responses of pepper seedlings to various ratios of blue, green, and red light using LED lamps. Sci. Hortic. 2020, 268, 109371:1–109371:10. [Google Scholar] [CrossRef]
- Chen, X.; Xue, X.; Guo, W.; Wang, L.; Qiao, X. Growth and nutritional properties of lettuce affected by mixed irradiation of white and supplemental light provided by light-emitting diode. Sci. Hortic. 2016, 200, 111–118. [Google Scholar] [CrossRef]
- Gommers, C.M.M.; Visser, E.J.W.; Onge, K.R.S.; Voesenek, L.A.C.J.; Pierik, R. Shade tolerance: When growing tall is not an option. Trends Plant Sci. 2013, 18, 65–71. [Google Scholar] [CrossRef]
- Kalaitzoglou, P.; van Ieperen, W.; Harbinson, J.; van der Meer, M.; Martinakos, S.; Weerheim, K.; Nicole, C.C.S.; Marcelis, L.F.M. Effects of continuous or end-of-day far-red light on tomato plant growth, morphology, light absorption, and fruit production. Front. Plant Sci. 2019, 10, 322. [Google Scholar] [CrossRef]
- Bae, J.H.; Park, S.Y.; Oh, M.M. Supplemental irradiation with far-red light-emitting diodes improves growth and phenolic contents in Crepidiastrum denticulatum in a plant factory with artificial lighting. Hortic. Environ. Biotechnol. 2017, 58, 357–366. [Google Scholar] [CrossRef]
- Zhen, S.; van Iersel, M.W. Far-red light is needed for efficient photochemistry and photosynthesis. J. Plant Physiol. 2017, 209, 115–122. [Google Scholar] [CrossRef]
- Park, Y.; Runkle, E.S. Far-red radiation and photosynthetic photon flux density independently regulate seedling growth but interactively regulate flowering. Environ. Exp. Bot. 2018, 155, 206–216. [Google Scholar] [CrossRef]
- Naznin, M.T.; Lefsrud, M.; Gravel, V.; Azad, M.O.K. Blue light added with red LEDs enhance growth characteristics, pigments content, and antioxidant capacity in lettuce, spinach, kale, basil, and sweet pepper in a controlled environment. Plants 2019, 8, 93. [Google Scholar] [CrossRef]
- Qian, M.; Rosenqvist, E.; Flygare, A.M.; Kalbina, I.; Teng, Y.; Jansen, M.A.K.; Strid, Å. UV-A light induces a robust and dwarfed phenotype in cucumber plants (Cucumis sativus L.) without affecting fruit yield. Sci. Hortic. 2020, 263, 109110. [Google Scholar] [CrossRef]
- Tian, Y.; Wang, H.; Sun, P.; Fan, Y.; Qiao, M.; Zhang, L.; Zhang, Z. Response of leaf color and the expression of photoreceptor genes of Camellia sinensis cv. Huangjinya to different light quality conditions. Sci. Hortic. 2019, 251, 225–232. [Google Scholar] [CrossRef]
- Su, N.; Wu, Q.; Qi, N.; Liu, Y.; Li, N.; Cui, J. Effect of partial shading treatments on anthocyanin synthesis in the hypocotyls of soybean sprouts under UV-A irradiation. J. Plant Growth Regul. 2017, 36, 50–59. [Google Scholar] [CrossRef]
- Rouphael, Y.; Kyriacou, M.C.; Petropoulos, S.A.; De Pascale, S.; Colla, G. Improving vegetable quality in controlled environments. Sci. Hortic. 2018, 234, 275–289. [Google Scholar] [CrossRef]
- Viršilė, A.; Brazaitytė, A.; Vaštakaitė-Kairienė, V.; Miliauskienė, J.; Jankauskienė, J.; Novičkovas, A.; Laužikė, K.; Samuolienė, G. The distinct impact of multi-color LED light on nitrate, amino acid, soluble sugar and organic acid contents in red and green leaf lettuce cultivated in controlled environment. Food Chem. 2020, 310, 125799. [Google Scholar] [CrossRef]
- Garg, N.; Manchanda, G. ROS generation in plants: Boon or bane? Plant Biosyst. 2009, 143, 81–96. [Google Scholar] [CrossRef]
- Neugart, S.; Schreiner, M. UVB and UVA as eustressors in horticultural and agricultural crops. Sci. Hortic. 2018, 234, 370–381. [Google Scholar] [CrossRef]
- Chen, Y.; Zhang, X.; Guo, Q.; Cao, L.; Qin, Q.; Li, C.; Zhao, M.; Wang, W. Plant morphology, physiological characteristics, accumulation of secondary metabolites and antioxidant activities of Prunella vulgaris L. under UV solar exclusion. Biol. Res. 2019, 52, 17. [Google Scholar] [CrossRef]
- Zhang, T.; Shi, Y.; Piao, F.; Sun, Z. Effects of different LED sources on the growth and nitrogen metabolism of lettuce. Plant Cell Tissue Organ Cult. 2018, 134, 231–240. [Google Scholar] [CrossRef]
- Baroniya, S.S.; Kataria, S.; Pandey, G.P.; Guruprasad, K.N. Growth, photosynthesis and nitrogen metabolism in soybean varieties after exclusion of the UV-B and UV-A/B components of solar radiation. Crop J. 2014, 2, 388–397. [Google Scholar] [CrossRef]
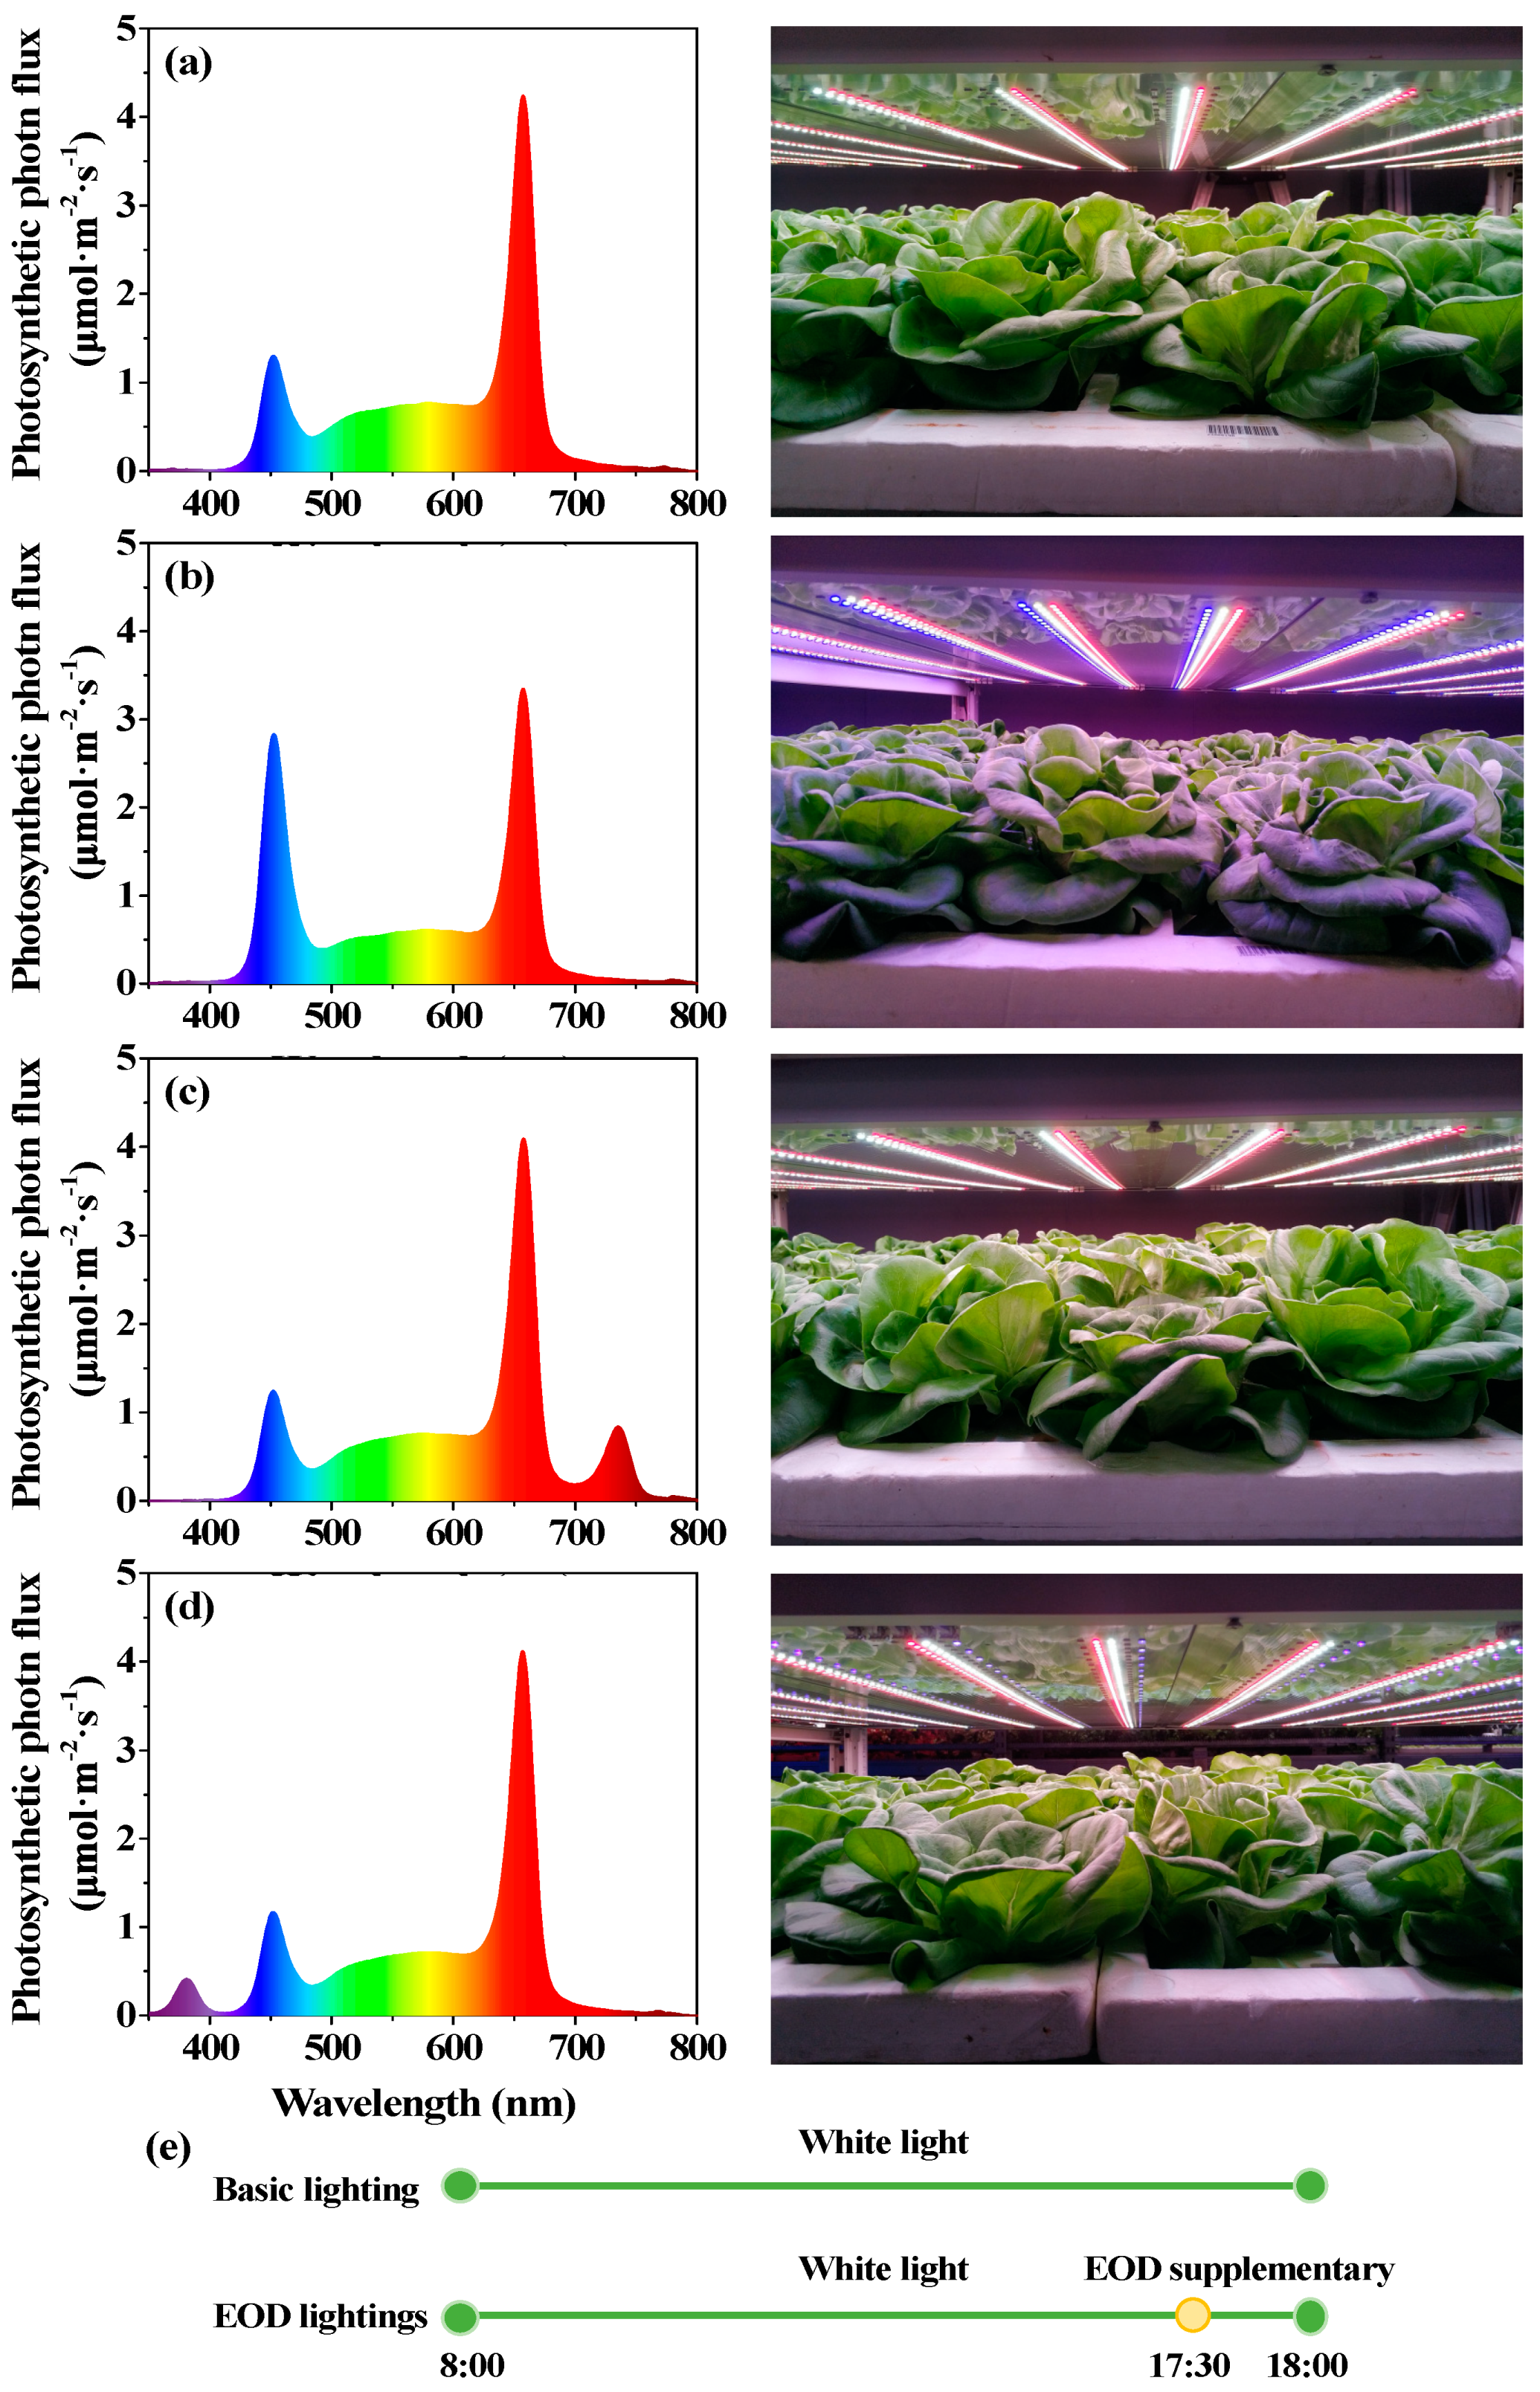




| Parameters | Lighting Treatments | |||
|---|---|---|---|---|
| W | EOD-B | EOD-FR | EOD-UV | |
| Single-band photon flux density (μmol·m−2·s−1) | ||||
| Ultraviolet light (350–400 nm) | 0.24 | 0.36 | 0.20 | 4.95 |
| Blue light (400–500 nm) | 46.12 | 83.70 | 43.72 | 41.65 |
| Green light (500–600 nm) | 69.46 | 55.09 | 68.58 | 64.34 |
| Red light (600–700 nm) | 137.38 | 107.84 | 137.03 | 135.19 |
| Far-red light (700–800 nm) | 4.79 | 3.93 | 25.99 | 5.91 |
| Integrated photon flux density (μmol·m−2·s−1) | ||||
| PPFD | 252.97 | 246.54 | 249.34 | 241.18 |
| YPFD | 222.54 | 209.94 | 219.59 | 212.94 |
| TPFD | 223.63 | 210.93 | 223.78 | 216.63 |
| Radiation ratio | ||||
| Red/Blue | 2.98 | 1.29 | 3.13 | 3.25 |
| Red/Green | 1.98 | 1.96 | 2.00 | 2.10 |
| Red/Far-red | 28.70 | 27.42 | 5.27 | 22.87 |
| Daily light integral (mol·m−2·d) | ||||
| 10 h | 9.11 | 8.88 | 8.98 | 8.68 |
| Interaction | Fresh Weight | Dry Weight | ||||
|---|---|---|---|---|---|---|
| Plant | Shoot | Root | Plant | Shoot | Root | |
| C | *** | *** | *** | *** | *** | *** |
| L | *** | *** | NS | *** | *** | NS |
| C × L | *** | *** | * | ** | ** | ** |
| Interaction | Moisture Content | Root/Shoot | ||
|---|---|---|---|---|
| Plant | Shoot | Root | ||
| C | ** | NS | *** | *** |
| L | ** | NS | NS | *** |
| C × L | ** | ** | * | ** |
| Interaction | Pigments | Pigment Ratio | ||||||
|---|---|---|---|---|---|---|---|---|
| Chl a | Chl b | Chl (a + b) | Caro | TA | Chl a/Chl b | Chl (a + b)/Caro | Chl (a + b)/TA | |
| C | *** | *** | *** | * | *** | NS | *** | *** |
| L | ** | ** | ** | NS | *** | *** | * | *** |
| C × L | NS | NS | NS | NS | *** | NS | NS | *** |
| Interaction | Antioxidant Capacity | Antioxidant Compounds | Nutrient Compounds | |||||
|---|---|---|---|---|---|---|---|---|
| DPPH | FRAP | TPC | TF | VC | SP | SS | Nitrates | |
| C | *** | *** | *** | *** | *** | *** | *** | *** |
| L | *** | * | ** | *** | ** | *** | NS | NS |
| C × L | *** | NS | NS | NS | NS | *** | *** | ** |
| Principal Components | F1 | F2 | F3 | F4 | F5 | F6 |
|---|---|---|---|---|---|---|
| Red butter | ||||||
| Eigen Value | 7.911 | 5.18 | 3.902 | 2.709 | 1.553 | 1.402 |
| Variability (%) | 30.428 | 19.922 | 15.007 | 10.42 | 5.972 | 5.393 |
| Cumulative % | 30.428 | 50.35 | 65.358 | 75.777 | 81.749 | 87.142 |
| Green butter | ||||||
| Eigen Value | 9.814 | 6.538 | 2.848 | 1.857 | 1.249 | 1.19 |
| Variability (%) | 37.745 | 25.145 | 10.952 | 7.143 | 4.804 | 4.576 |
| Cumulative % | 37.745 | 62.89 | 73.842 | 80.985 | 85.789 | 90.365 |
© 2020 by the authors. Licensee MDPI, Basel, Switzerland. This article is an open access article distributed under the terms and conditions of the Creative Commons Attribution (CC BY) license (http://creativecommons.org/licenses/by/4.0/).
Share and Cite
Li, Y.; Shi, R.; Jiang, H.; Wu, L.; Zhang, Y.; Song, S.; Su, W.; Liu, H. End-Of-Day LED Lightings Influence the Leaf Color, Growth and Phytochemicals in Two Cultivars of Lettuce. Agronomy 2020, 10, 1475. https://doi.org/10.3390/agronomy10101475
Li Y, Shi R, Jiang H, Wu L, Zhang Y, Song S, Su W, Liu H. End-Of-Day LED Lightings Influence the Leaf Color, Growth and Phytochemicals in Two Cultivars of Lettuce. Agronomy. 2020; 10(10):1475. https://doi.org/10.3390/agronomy10101475
Chicago/Turabian StyleLi, Yamin, Rui Shi, Haozhao Jiang, Linyuan Wu, Yiting Zhang, Shiwei Song, Wei Su, and Houcheng Liu. 2020. "End-Of-Day LED Lightings Influence the Leaf Color, Growth and Phytochemicals in Two Cultivars of Lettuce" Agronomy 10, no. 10: 1475. https://doi.org/10.3390/agronomy10101475
APA StyleLi, Y., Shi, R., Jiang, H., Wu, L., Zhang, Y., Song, S., Su, W., & Liu, H. (2020). End-Of-Day LED Lightings Influence the Leaf Color, Growth and Phytochemicals in Two Cultivars of Lettuce. Agronomy, 10(10), 1475. https://doi.org/10.3390/agronomy10101475


