Article

Variable Rate Nitrogen and Water Management for Irrigated Maize in the Western US

1
Department of Soil and Crop Sciences, Colorado State University, Fort Collins, CO 80523-1170, USA
2
Agriculture and Agri-Food Canada, St-Jean-sur-Richelieu, QC J3B 3E6, Canada
*
Author to whom correspondence should be addressed.
Agronomy 2020, 10(10), 1533; https://doi.org/10.3390/agronomy10101533
Submission received: 9 September 2020 / Revised: 25 September 2020 / Accepted: 2 October 2020 / Published: 9 October 2020

Abstract

:
Nitrogen (N) and water continue to be the most limiting factors for profitable maize (Zea Mays L.) production in the western US Great Plains. Precision application of N and water has the potential to significantly enhance input use efficiency without impairing yields. The overall objective of this study was to determine the most productive and efficient nitrogen and water management strategy for irrigated maize by using site-specific management zones and a proximal remote sensing approach. This study was conducted over 2016, 2017, 2018 and 2019 crop growing seasons near Fort Collins, Colorado, USA. Six nitrogen rates (0, 56, 112, 168, 224, and 280 kg N ha−1) were applied along experimental strips across three delineated management zones (low, medium, and high productivity). Four rates of irrigation were applied to maize (60%, 80%, 100%, and 120% of evapotranspiration) using a center pivot precision irrigation system equipped with zone control. Optical proximal sensor readings were acquired on all experimental strips four times during the growing season to assess four nitrogen management strategies (uniform, management zone (MZ), remote sensing (RS), and management zone remote sensing (MZRS)) on grain yield and nitrogen use efficiency (NUE). Results from this three-year study showed the significant interaction (p = 0.05) of zone vs. irrigation and irrigation vs. nitrogen across all years. In two of the three years (2016 and 2018), the high productivity zone benefitted from high irrigation rates, demonstrated by 16% and 18% yield increase from the lowest irrigation rate. In 2016, yield plateau was reached at 168 kg N ha−1 with 80% and 100% irrigation rates, whereas the plateau was reached at 112 kg N ha−1 in the 120% irrigation rate. These results demonstrate the possibility of fine-tuning zones, irrigation, and nitrogen to achieve optimum yield. While uniform and MZ nitrogen management strategies produced the highest grain yield, the best NUE was achieved via the RS strategy, followed by the MZ strategy. In this study, the MZRS strategy (combined MZ and RS) did not produce superior yield and NUE as compared to uniform and other strategies. However, there is a tremendous opportunity to fine-tune these two strategies, using other algorithms that are not explored in this study to improve the sustainability of maize production under irrigated conditions.

1. Introduction

In 2016, growers in the US harvested roughly 35.1 Mha of irrigated maize (Zea Mays L.) with an average yield of 11.7 Mg ha−1 [1]. The majority of these acres are not managed with the precision application of inputs. There is a tremendous opportunity to improve the profitability of maize production via the precision application of crop inputs such as nitrogen and water. Input use efficiency could be improved through precision agronomic research and the adoption of best management practices by growers [2]. Input use efficiency also depends on managing spatial variability that exists in crop fields [3]. Soil and crop scientists have developed ways to characterize spatial variability and have demonstrated that precision-farming practices enhance growers’ input use efficiency and productivity, mitigate environmental pollution [4,5], and maintain or increase profitability [6,7]. The advent of precision-farming technologies such as precision planters, sprayers, and irrigation systems allows growers to vary the application rates of inputs at every location of a crop field. While researchers and growers have become more aware of the implications of spatial and temporal variability in crop fields, there is still a need to develop an empirically proven strategy to optimize spatial management of fertilizer and water.
Nitrogen (N) is among the most limiting nutrients in maize production, and it must be applied at an optimum rate to maximize profitability. The prevailing approach for N application by farmers is to apply a uniform rate across an entire field. However, due to in-field spatial variability, uniform application leads to misappropriations of N applied relative to crop N need [8]. When N is under-applied, yields are limited, and economic returns are diminished [9]. When N is over-applied, up to 30% of N inputs may be lost due to nitrate leaching below the root zone [10]. The over application of N has shown to be a significant and hazardous non-point source pollutant in surface and subsurface waterways, as well as contributing to nitrous oxide emissions. The consequences of inefficient application of N fertilizer in agriculture have been shown to be harmful to ecosystems and human health [11].
Research has shown that the use of site-specific management zones (SSMZ) for variable rate application of N is a simple and effective way to increase nitrogen use efficiency (NUE) and mitigate N pollution of the environment [4,12,13,14]. The site-specific management zones are demarcated homogeneous sub-regions in a crop field that have similar and inherent yield limiting or conducive factors [15]. The use of SSMZ in a field allows for the ability to adjust N fertilizer rates to match crop requirements based on soil fertility. Management zone creation and delineation employs many methods, including remotely sensed imagery, soil electrical conductivity, soil surveys, and yield data [16,17,18,19]. These methods allow the characterization of soil macro-variability. Typically, management zones are generated to classify a sub region’s productivity into high, medium, and low productivity potential. With the SSMZ approach, N fertilizer is applied at a variable rate across a field and at a uniform rate within a management zone at rates determined to optimize productivity in each zone independently.
The management of N fertilizer is further complicated by the need to consider other environmental and management variables, most importantly water. Nitrogen is both highly mobile and soluble in the presence of water in soil. Crop growers must consider both precipitation and irrigation water when scheduling and applying N. Worldwide, 17% of cropland is irrigated and produces 40% of the total food supply [20]. Irrigated crop cultivation continually faces many challenges related to water management, notably competition for water from increasing municipal demand, and threats to the stability of water supply due to the increasing severity and likelihood of drought [21,22,23,24]. Precision irrigation management systems have the potential to significantly reduce water consumption by crops, by applying the right amount of water at the right place and at the right time, without impairing grain yields. While the technology and methods to implement precision irrigation have been available for over a decade, the adoption of and appreciation for precision irrigation is not yet widespread [25]. Research conducted at Colorado State University to quantify variability in soil water content has revealed that even a precision leveled field with uniform soil type and textural class show significant spatial variability in soil water content [26].
Variable rate irrigation (VRI), much like variable rate N management, requires further study and application in order to determine the most efficient use of water that also promotes grain yields. Variable rate prescription maps, which are employed to allocate different levels of water across a field, are typically static and may not change over a growing season. This makes VRI simple to apply, but does not account for changes in spatial and temporal variability over a growing season within a field. Furthermore, to implement VRI, it is necessary to quantify and categorize a field into irrigation management zones. Results from previous research are mixed, indicating that many common tools and soil attributes used to classify a field and manage VRI do not always adequately characterize variability in water availability during the growing season, and thus misallocations in timing, location, and amount of water applied for irrigation can occur [27,28].
Interactions between N rates, irrigation rates and grain yield have been well documented [29]. Higher rates of N result in increased water uptake at full irrigation when compared to low rates of N and limited irrigation [30,31]. Furthermore, the implementation of SSMZs for the management of N predates those for irrigation. Given that a field has previously been delineated for zone-based management of N fertilizer, it is conceivable that established zones may adequately characterize soil variability, as they relate to differences in soil factors affecting water availability. For example, soil texture can be inferred from bare soil color, which affects both N and water availability during the growing season [32]. The review of the literature does not indicate if zones delineated for N management can also be implemented for VRI, in such a way that increases or maintains grain yields within zones and across a field.
Commercially available proximal sensors are also used as tools for deciding in-season variable rate N management. The proximal sensing-based technique entails observing the optical properties of a crop to detect biotic or abiotic stresses [33,34,35,36,37]. Plant leaves contain chlorophyll a and b for the conversion of light energy to chemical energy, and the amount of solar radiation absorbed by a leaf is directly related to chlorophyll content and leaf area. Hence, chlorophyll content determines the photosynthetic potential and primary production of plants [38]. Additionally, chlorophyll content is a function of leaf N content and provides an indirect estimate of plant nitrogen status. Normalized Difference Vegetative Index (NDVI) is a widely used vegetative index and has been shown to correlate well with leaf N status and final grain yield [38,39,40]. Both the SSMZ and proximal sensing approaches aim to increase NUE and yield by determining the optimal rate of N to apply. However, coupling the two techniques (proximal sensing and management zones) together has proved challenging because SSMZs are determined with soil characteristics, while proximal sensing is based on crop canopy reflectance [41]. Quantifying and monitoring crop N response within a field and at the correct time in the growing season, and quantifying the unique soil variables that affect demand for N by the crop, must be accounted for in order to implement RS and SSMZ approaches individually, let alone in combination [42,43].
The overall objective of this research was to determine the most productive and efficient site-specific nutrient and water management strategy for irrigated maize. The specific objectives were as follows: (i) to assess crop grain yield response to variable rate nitrogen and water management across site-specific management zones and (ii) to assess the effects of four nitrogen management strategies that incorporate in-field macro-variability (soil-based) and micro-variability (based on proximal sensing of crop canopy) on grain yield and NUE.

2. Materials and Methods

2.1. Site Description

This study was conducted over the 2016, 2017, 2018, and 2019 crop growing seasons on field 3100 at Colorado State University’s Agricultural Research Development and Educational Center, in Fort Collins CO, USA (40°40′38.24′′ N, 104°58′44.76′′ W). The site has employed a continuous maize cropping system with a center pivot irrigation system equipped with GPS, telemetry, variable frequency drive motor, and drop nozzles for variable rate applications of water. Soils at the site are classified as a fine-loamy, mixed, super active, mesic, Aridic Haplustalf [44]. The soil series at the study site were characterized as Kim loam and Nunn clay loam. The study site was prepared with vertical tillage in the fall of 2015 after harvest of the previous maize crop. In the Spring season prior to planting across all three years, the starter fertilizer monoammonium phosphate (11–52–0) was applied at a uniform rate of 132 kg N ha−1 across the field and incorporated into the soil with a Brillion mulcher (Landoll Corporation, Marysville, KS, USA).
Site-specific management zones were previously delineated on the study field based on the methodology described by [13]. The field was classified into productivity potential management zones of low, medium, and high, and these are referred to as zones 1, 2, and 3, respectively (Figure 1). Specifically, bare-soil aerial imagery, topographic maps and the farmer’s experience of yield history were utilized to classify the areas of field into three management zones.

2.2. Experimental Design

For the purpose of objective (1), the experimental design consisted of a completely randomized block design with five treatments per block. The treatment strips (4.6 m) were planted across the entire length of the field in the east to west direction such that the treatment strips traversed over each management zone. Care was taken not to reuse the plots used in the previous year’s experiment to reduce the effect of residual nitrogen. Using a six-row John Deere precision vacuum planter (Deere & Company, Moline, IL, USA) with 76.2 cm row spacing, DKC 46-20 (Dekalb) maize hybrid was planted in all four growing seasons between the last week of April to first week of May. The seeding density was 94,000 seeds ha−1. Every year, pre-planting herbicide RoundUp® (Monsanto Company, St. Louis, MO, USA) was sprayed to control weeds. After field preparation, 132 kg ha−1 11-52-0 monoammonium phosphate and 5.6 kg ha−1 Zinc (36% Zinc Sulphate) was applied and incorporated using a mulcher. After fall harvest the field was vertically tilled every year. The first irrigation was started as soon as the planting was completed.
The nitrogen fertilizer rates chosen in this study were intended to encompass the range of N rates below and above the side-dress N rates typically used by growers for irrigated maize cropping systems in the western Great Plains. In years 2016 and 2019, five N rates of 0, 56, 112, 168 and 224 kg N ha−1 using 32% Urea Ammonium Nitrate (UAN) were side-dressed by dribbling UAN in between the maize rows at the V8 crop growth stage [45]. In years 2017 and 2018, N fertilizer was applied in the same manner but with an additional rate of 280 kg N ha−1 of 32% UAN, for a total of six N rates. A high clearance Lee Spider tractor (Lee Agra Inc., Lubbock, TX, USA) equipped with a differentially corrected GPS unit was used to side-dress UAN fertilizer. The tractor was equipped with a set of six drop tubes (one per maize row), and each drop tube had a gang of three nozzles that can be switched to provide a different N rate, which was calibrated for the purpose of this study. As an additional precaution, prior to N application, each experimental strip was flagged with a unique color to indicate the level of N rate to be applied.
Based on the input from collaborating farmers, three rates of irrigation calculated as 80%, 100% and 120% (low, medium, and high rates) of evapotranspiration (ET) were applied in the 2016 crop growing season. In years 2017, 2018 and 2019, irrigation rates were revised to 60%, 80%, and 100% of the ET (low, medium, and high rates). The experimental layout was designed such that some or all of the levels of irrigation were randomly applied to clusters of experimental plots within each strip to achieve combinations of every factor level (i.e., N rate, management zone, and irrigation rate). At each irrigation event, the 100% ET irrigation rate was used as the base application rate, and the other two rates varied accordingly. To schedule and determine the quantity of water applied for irrigation events, an online irrigation water management tool, Water Irrigation Scheduler for Efficient Application (WISE) [46], was used. The WISE tool uses a soil water balance approach by employing weather and soil data, which is readily available online, to model daily crop ET using the standardized Penman–Monteith equation for tall reference ET [47], a seasonal crop coefficient curve for maize [46], and plant available water in the soil. Irrigation was triggered, and the amount of irrigation was applied such that the soil water content level stayed above-, at- or near-maximum allowable depletion, as determined by the WISE model (186 mm), throughout the growing season. The experiment was conducted over four crop growing seasons from 2016 to 2019, however data for 2017 were not used in the analysis because of erroneous technical issues in experimental strips.
For objective 2, the experimental design and project work was planned to allow comparisons of four unique N management strategies. These N management strategies were as follows: (i) conventional uniform application of N, referred to as “uniform”; (ii) a variable rate N management strategy that consisted of applying a variable rate of N across management zones referred to as “MZ”; (iii) a proximal sensor-based variable rate N management strategy referred to as RS; and (iv) a variable rate N management strategy based on remote sensing within each management zone referred to as “MZRS”. Nitrogen use efficiency (NUE) was calculated as follows.
N U E = Kg g   G r a i n   h a 1 K g   N   h a 1
Grain was harvested with a six-row Case IH model 1660 (Case Corporation, Racine, WI, USA) combine harvester equipped with an XYZ yield monitoring system. The yield data was corrected for errors using the protocols described by [48] for subsequent statistical analysis.

2.3. Proximal Canopy Sensing

The GreenSeeker (Trimble Navigation Limited, Sunnyvale California, USA) hand-held sensor was used to measure normalized difference vegetation index (NDVI). The NDVI readings were acquired continuously by walking at the center row (third from the north) of every 6-row experimental strip, at the height of 0.8 m above the crop canopy in an east to west or west to east direction. The starting and ending point of each experimental strip and the time of data acquisition were the same for every sensor reading date. The GreenSeeker collects and records NDVI at 10Hz. Every 10 NDVI readings were averaged to create one-second NDVI measurement points and then geocoded at a constant travel speed of 1 m s−1. In 2016, NDVI was measured at the V9 crop growth stage, whereas in 2018, NDVI was measured the V10 crop growth stage. Data from only 2016 and 2018 were used for objective 2 because reliable NDVI data could not be collected in 2017 and 2019 due to unexpected technical complications.

2.4. Statistical Analysis

2.4.1. Zone, Nitrogen and Water Effects

For all three growing seasons (2016, 2018, and 2019), the factors and their levels were defined as irrigation rate (60%, 80%, 100%, and 120% of ET), nitrogen rate (0, 56, 112, 168, 224, and 280 kg N ha−1), and predetermined management zones (low, medium, and high). The response variable was harvested maize grain yield (Mg ha−1). A 2-level linear mixed model was fit to grain yield data where the study factors were assigned as fixed main and two-way interaction effects in the model. Three-way interaction was dropped from the model to simplify the model, as it was not significant. The random effects included were experimental strip and strip by management zone combinations to account for the design structure (split–split plot). All random effects were assumed to be independent and normally distributed with an expectation of mean zero and some variance component. The model was defined as:
Y i j k l =   µ   +   ( T i   +   R j   +   Z k )   2   +   B l   +   B ( Z ) l k   +   ε i j k l
where Yijkl is the predicted grain yield with N fertilizer rate i, irrigation rate j, located in MZ k, with overall mean µ. The squared term accounts for all fixed main effects and fixed two-way interactions of N rate with i = 1, … t, irrigation rate j = 1,… r, and MZ k = 1, … z. The random effects (εijkl) in the model included experimental strip l as well as MZ within each experimental strip B(Z)l(k) with l = 1, … b.
Using restricted maximum likelihood and Kenward–Roger degrees of freedom, F-tests were generated for the fixed effects using Type III ANOVA. Standard residual diagnostic plots were used to check the assumptions of the model. Data analysis was performed using R for Windows software, Version 3.3 [49].

2.4.2. Four N Management Strategies

A subset (n = 270 out of a total of ~9000 observations) of the data was randomly selected to create an orthogonal dataset comparing yield across four N management strategies. The data selection criteria for each strategy are described below and outlined in Table 1.
(i)
For the “uniform” N management strategy, yield observations were sub-sampled corresponding to uniform N rate of 224 kg N ha−1 independent of management zones.
(ii)
For the management zone N strategy (MZ), yield observations were sub-sampled based on their location within management zones 1, 2, or 3. For zone 1, yield observations corresponded to a lower level of N application and a high level of N for zone 3.
(iii)
For the proximal sensor-based N strategy (RS), a multi-step process was employed to prepare the yield dataset as follows: (a) Measured NDVI values were assigned to each yield pixel (21 m2). (b) The NDVI dataset was then classified using a k-means clustering algorithm (R Development Core Team, 2012) leading to five NDVI classes. (c) Each NDVI class was grouped with a level of N rate such that low NDVI classes were paired with a high level of N and vice versa for high NDVI classes.
(iv)
For the fourth N management strategy, remote sensing within zones (MZRS), steps (a) and (b) of strategy (iii) were performed within management zones leading to three NDVI classes per zone. These three NDVI classes within each management zone were grouped with corresponding levels of N such that low levels of N rate were grouped in zone 1 and high levels of N rate in zone 3.
The four N management strategies were then statistically analyzed to compare yield levels and NUE using ANOVA and Tukey’s HSD statistics. This was performed with the “aov” and “TukeyHSD” functions in R statistical package (agricolae) [49].

3. Results

3.1. Weather Summary during the Study Period

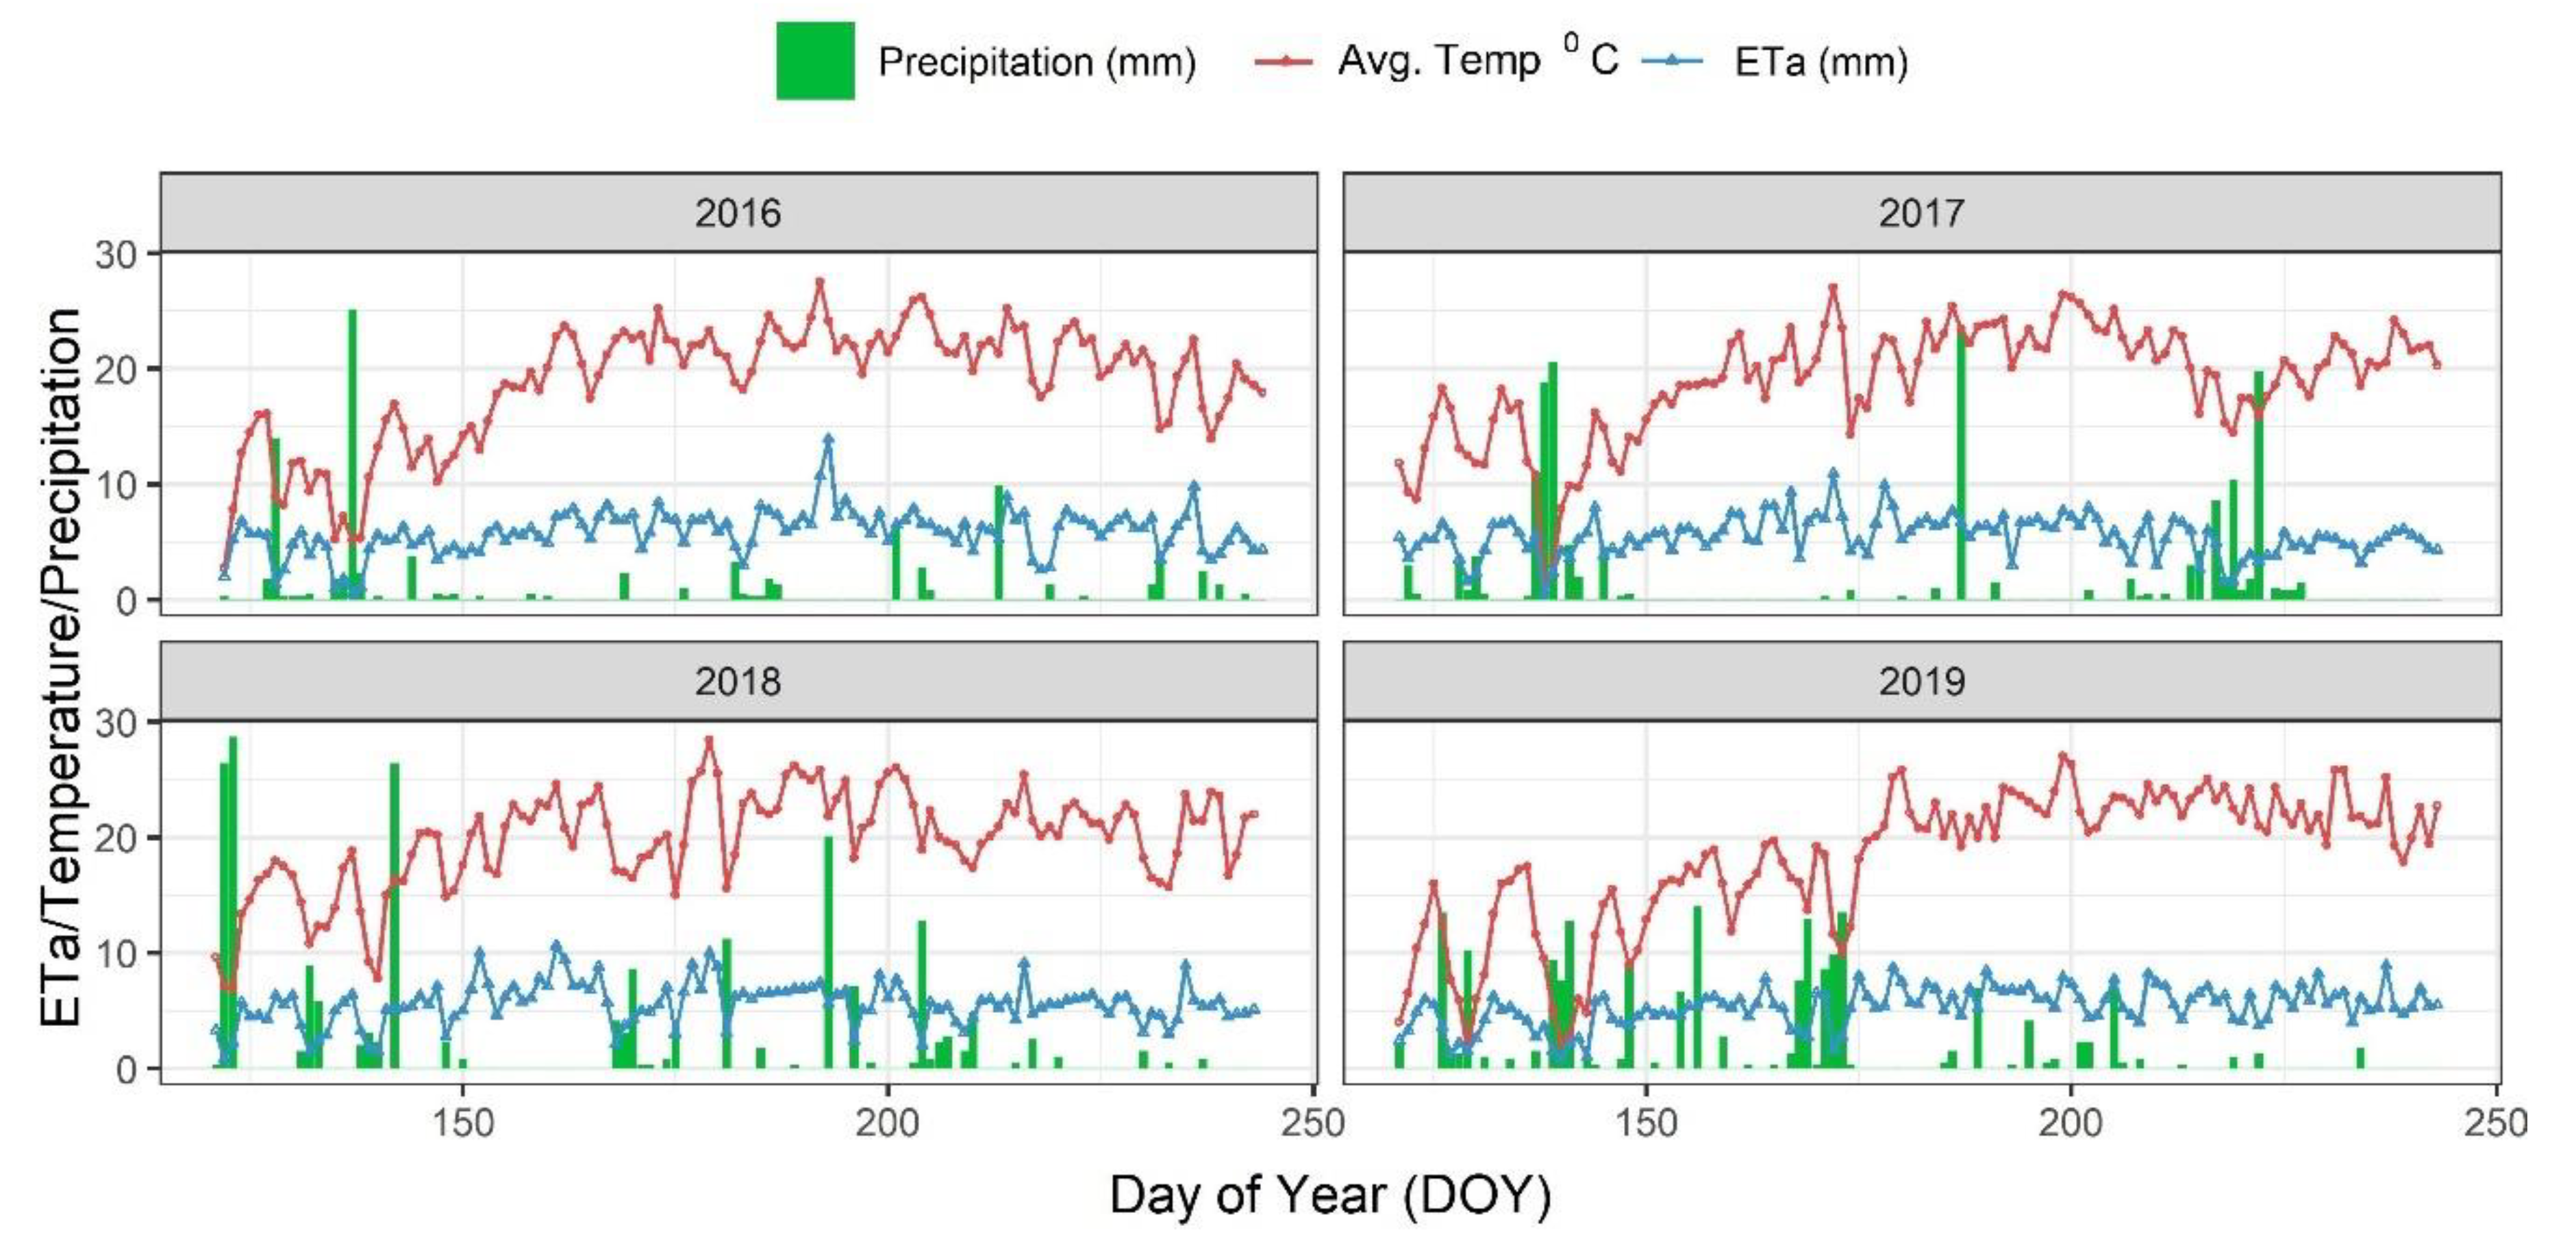
Northeastern Colorado is a semi-arid environment, and the study site is located in the rain shadow of the Front Range of the Rocky Mountains. Daily precipitation, average temperature and evapotranspiration for each growing season is presented in Figure 2. Some of the most notable weather information was as follows. In 2016, the mean temperature was 4.5% greater (1.5 °C) than the 30-year historical average, and nearly no precipitation occurred in July (DOY 182–212). Furthermore, 84% (i.e., 533 mm) of the water applied to the crop came from irrigation in 2016. In 2018, the crop experienced a significant hail event at the end of July, occurring at the R2 (second reproductive) growth stage. Extensive and significant damage to the crop canopy occurred as well as to the developing ears. However, the damage was observed to be uniform across the field and within treatment blocks. Thus, treatment effects could still be inferred for 2018.

3.2. Summary Statistics

A summary of maize crop yield categorized by year, zone, nitrogen rate and irrigation rate is presented in Table 2. The crop yield was normally distributed in all three years. While the average crop yield ranged from 8.81 to 10.67 Mg ha−1 across zones and years, the year 2019 had the lowest average yield in general. The increase in irrigation rate was reflected as an increase in the yield across all three years. As expected, the addition of N fertilizer increased maize yield.

3.3. Effect of Zone, Nitrogen and Irrigation Rates on Maize Yield

The results from mixed-model ANOVA (Table 3), with the same significant main and interaction effects in all years, indicate that our results are highly consistent across years. The main effects of nitrogen (NR) and irrigation (IR) were significant, whereas zone was not significant in all three years. However, in the presence of significant two-way interactions, a direct comparison of the main effects becomes irrelevant. The remainder of the Section 3 will focus on understanding the effects of the interactions among zone, nitrogen, and irrigation rates on maize yield.

3.3.1. Zone and Irrigation Interaction

There was a significant interaction (p < 0.001) between zone and irrigation rates (Table 3 and Figure 3). A detailed statistical comparison of yield across irrigation rates within each zone is shown in Table S1. In year 2016, the high productivity zone (3) benefitted from higher irrigation rates, with 16% and 18% greater yield as compared to 80% and 100% irrigation rates, respectively. Furthermore, in 2018, the highest irrigation rate (100%) in zone 3 produced significantly greater (10.71 Mg ha−1) yield as compared to lower irrigation rates. Such a response was not observed in the year 2019.
A further breakdown of the interaction between zone and irrigation is presented in Figure S1 by plotting the interaction at each nitrogen level. The interaction within each nitrogen rate follows the same trend as in the overall interaction (Figure 3). Only in year 2016 did we have an irrigation rate that was 120% of ET, and we observed that the high productivity zone (3) recorded significantly greater yield at all nitrogen levels as compared to lower irrigation rates. Year 2018 exhibited similar trend as in year 2016.

3.3.2. Zone and Nitrogen Interaction

Unexpectedly, there was no significant interaction between zones and nitrogen rates (Table 3) in any year. The mean yield ranges (from lowest and highest nitrogen rates) were 7.03–11.62 MG ha−1, 8.14–10.87 Mg ha−1, and 6.74–10.09 Mg ha−1, in years 2016, 2018, and 2019, respectively. Despite large ranges and an upward trend in yield with increasing nitrogen rate, no significant nitrogen effects were observed within zones, which was attributed to large standard errors of estimates.

3.3.3. Irrigation and Nitrogen Interaction

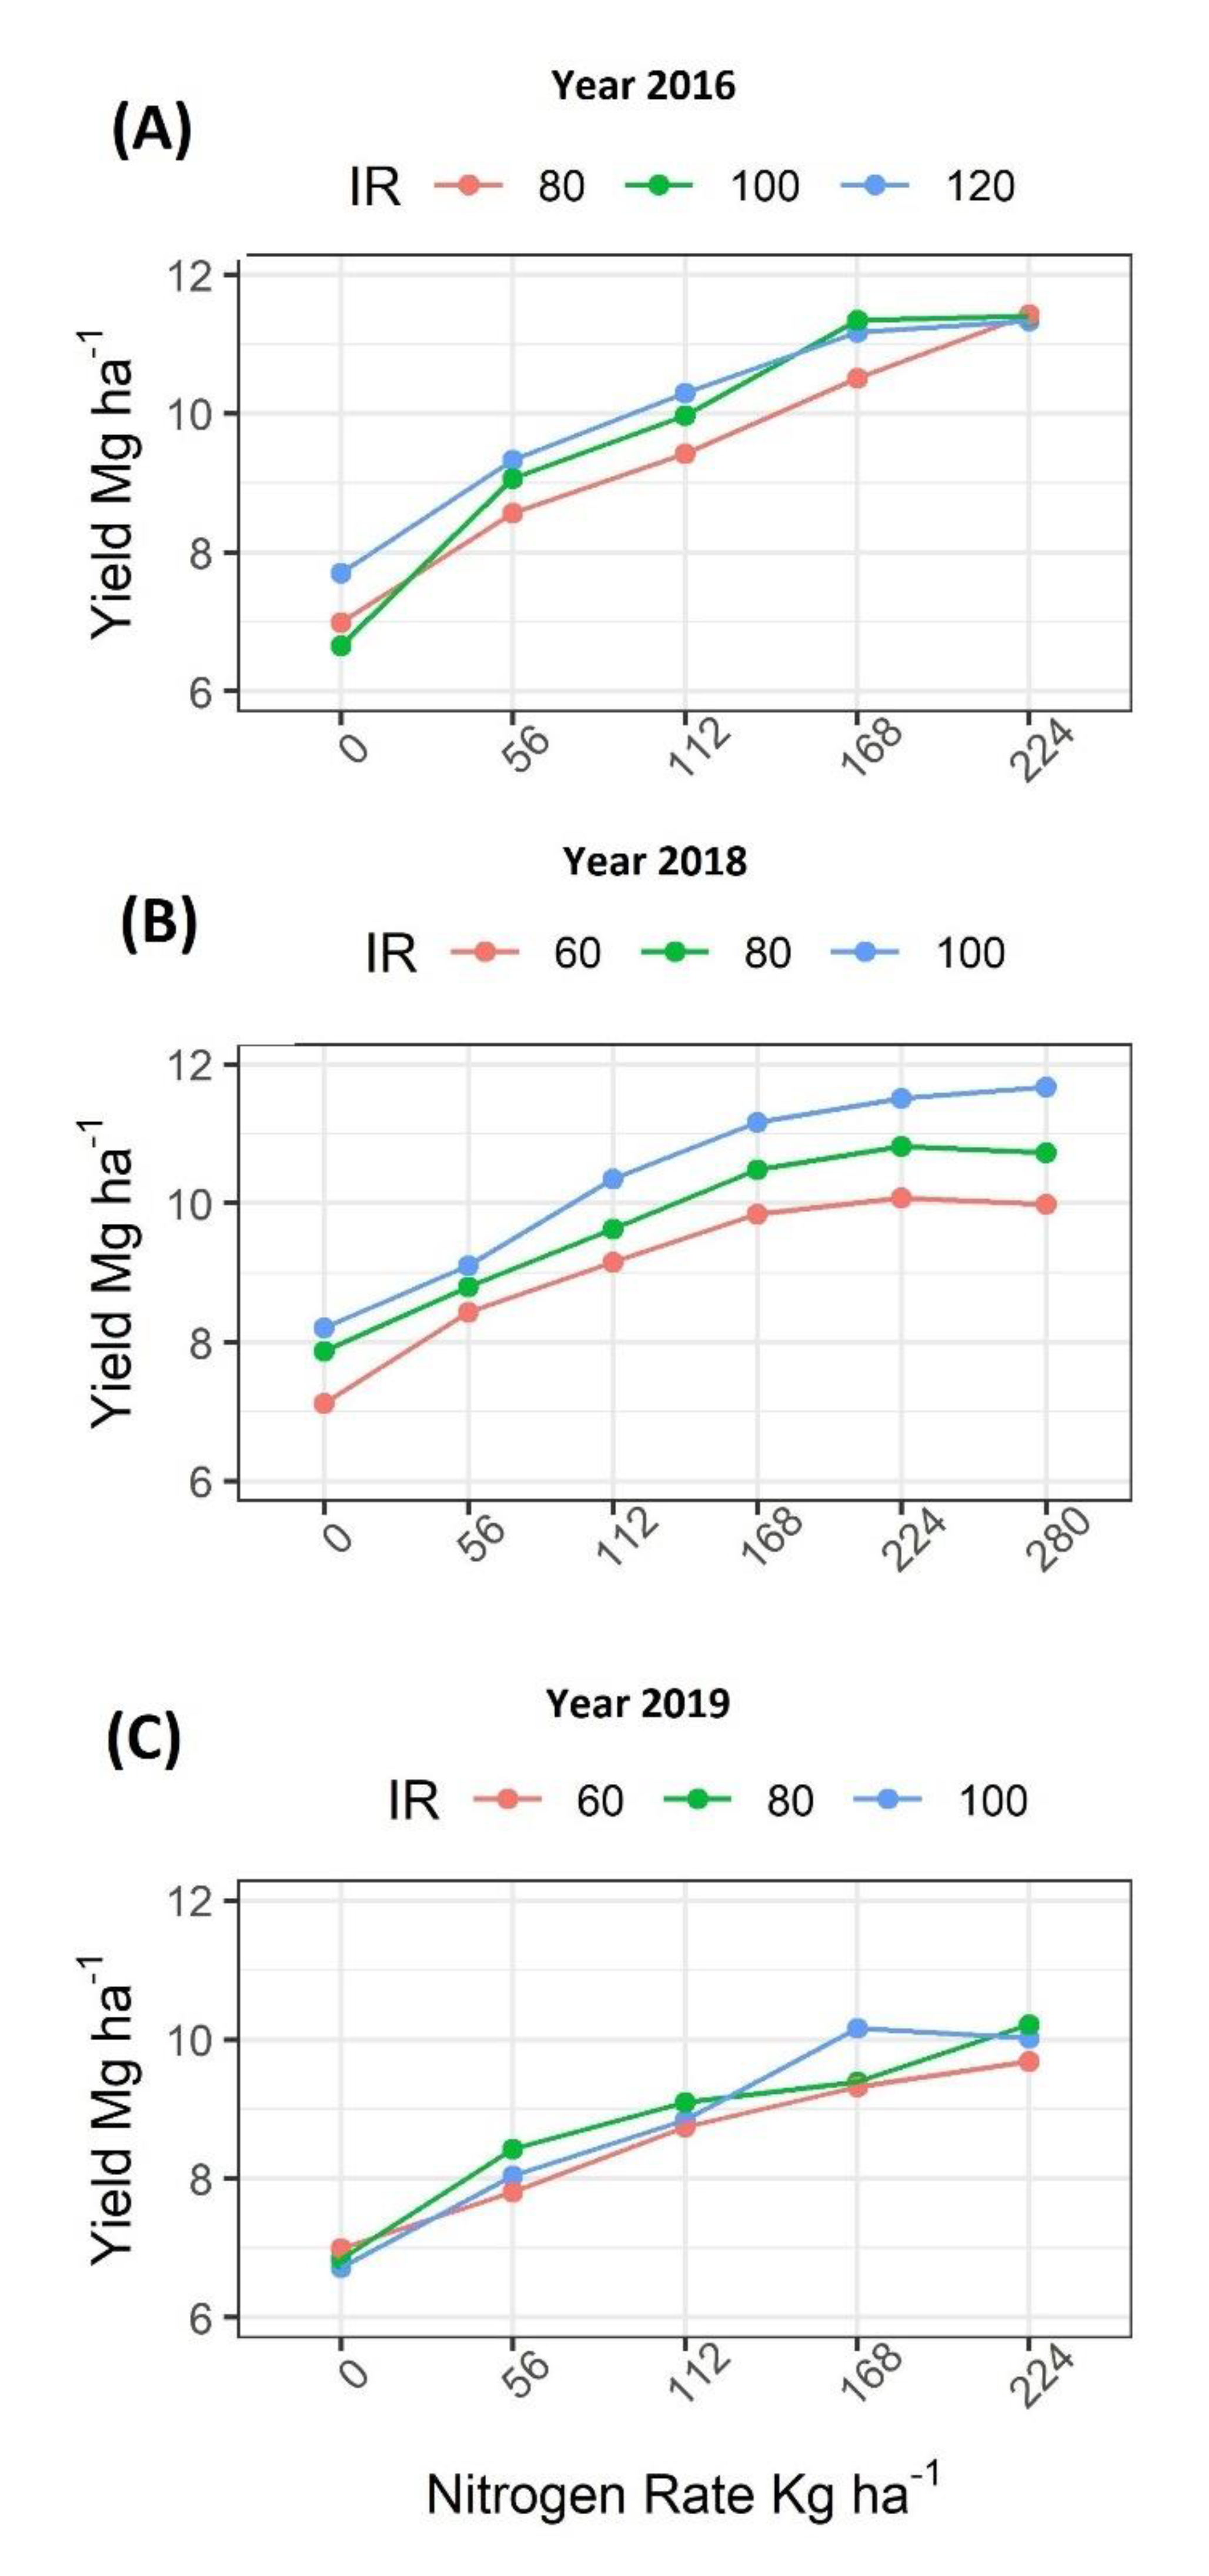
There was a significant interaction between irrigation and nitrogen rates (Table 3 and Figure 4). As expected, a typical maize nitrogen response curve was observed for all irrigation rates across all three years (Figure 4), and higher irrigation rates were associated with the better yield response of nitrogen. In year 2018, the interaction between irrigation and nitrogen rates was not evident in Figure 4. Still, it was statistically significant, and higher irrigation rates had better nitrogen yield responses as compared to lower rates. In 2016, the yield plateau was reached at 168 kg N ha−1 nitrogen rate in 80% and 100% irrigation rates, whereas in the 120% irrigation rate, the plateau was reached at 112 kg N ha−1 nitrogen rates. The plateau rate was identified as the rate of nitrogen beyond which there was no significant increase in yield (Table S2). The yield plateau at lower nitrogen rates combined with high irrigation rate shows the synergistic relationship of irrigation and nitrogen and the possibility to tweak nitrogen and irrigation rates for optimum yield. In 2018, surprisingly, there were no significant differences in yield between nitrogen rates within irrigation rates; however, there was a general increase in mean yield with increased nitrogen rate (Figure 4). Year 2019 followed a similar trend as in 2016; however, the yield plateau was reached at the 112 kg N ha−1 nitrogen rates in all irrigation rates. A more detailed breakdown of interaction between nitrogen and irrigation rate is presented in Figure S2 by plotting interactions within each management zone.

3.4. Nitrogen Management Strategies

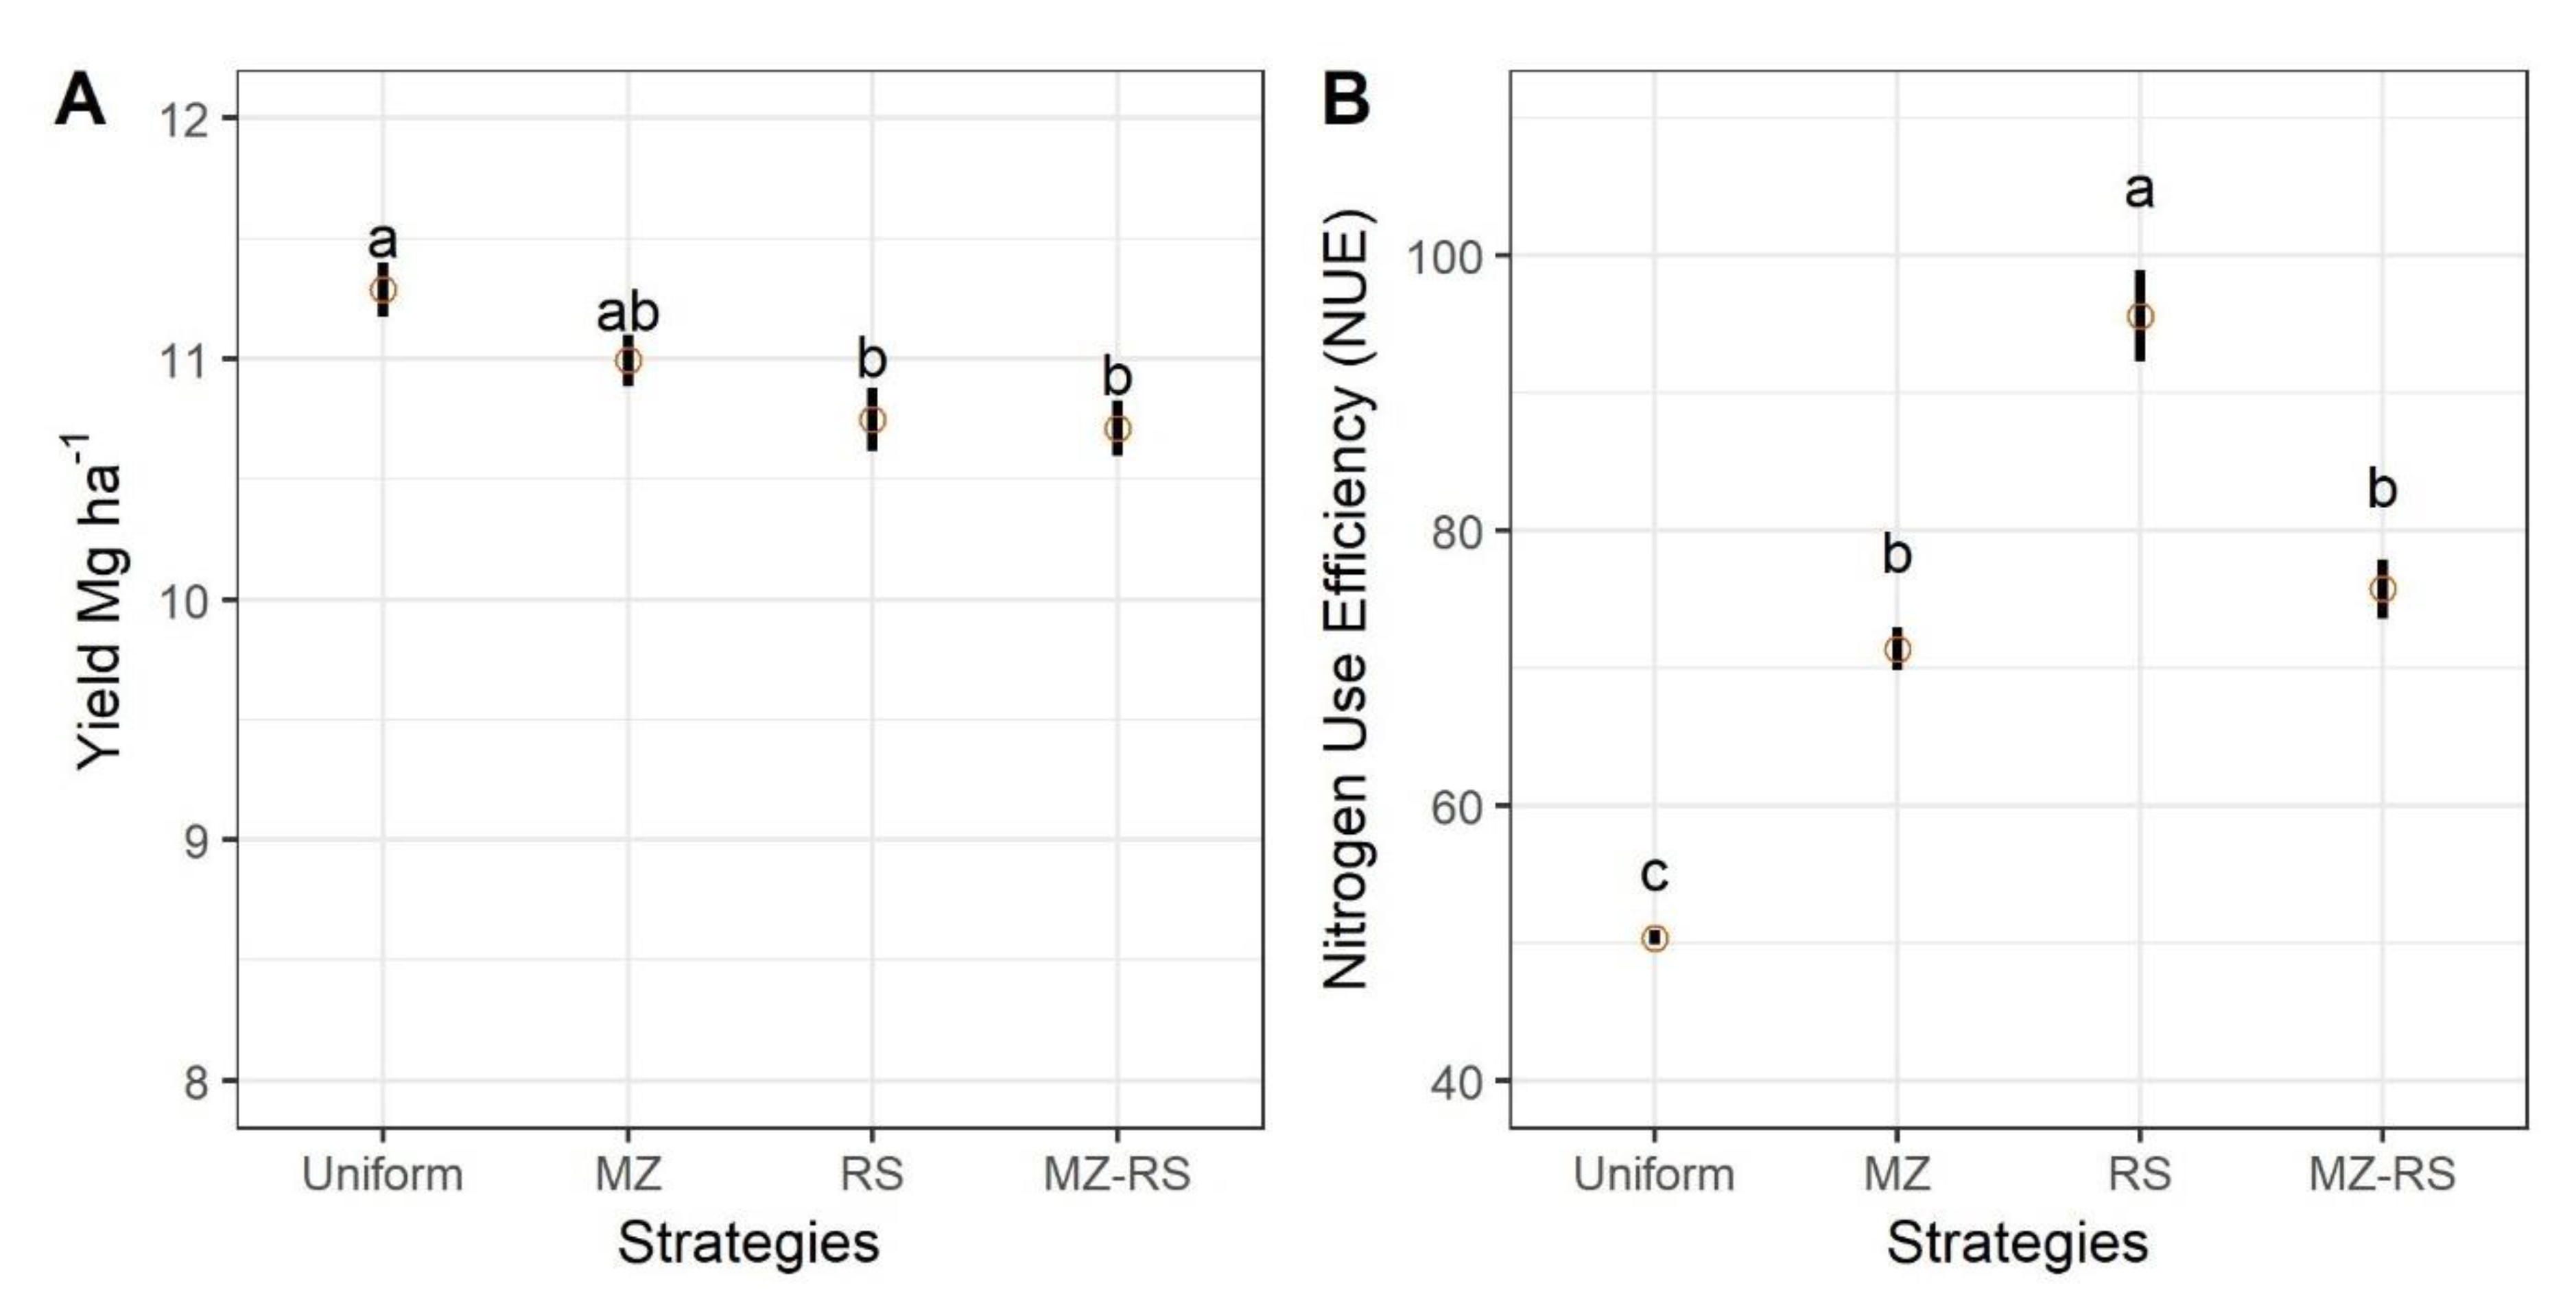
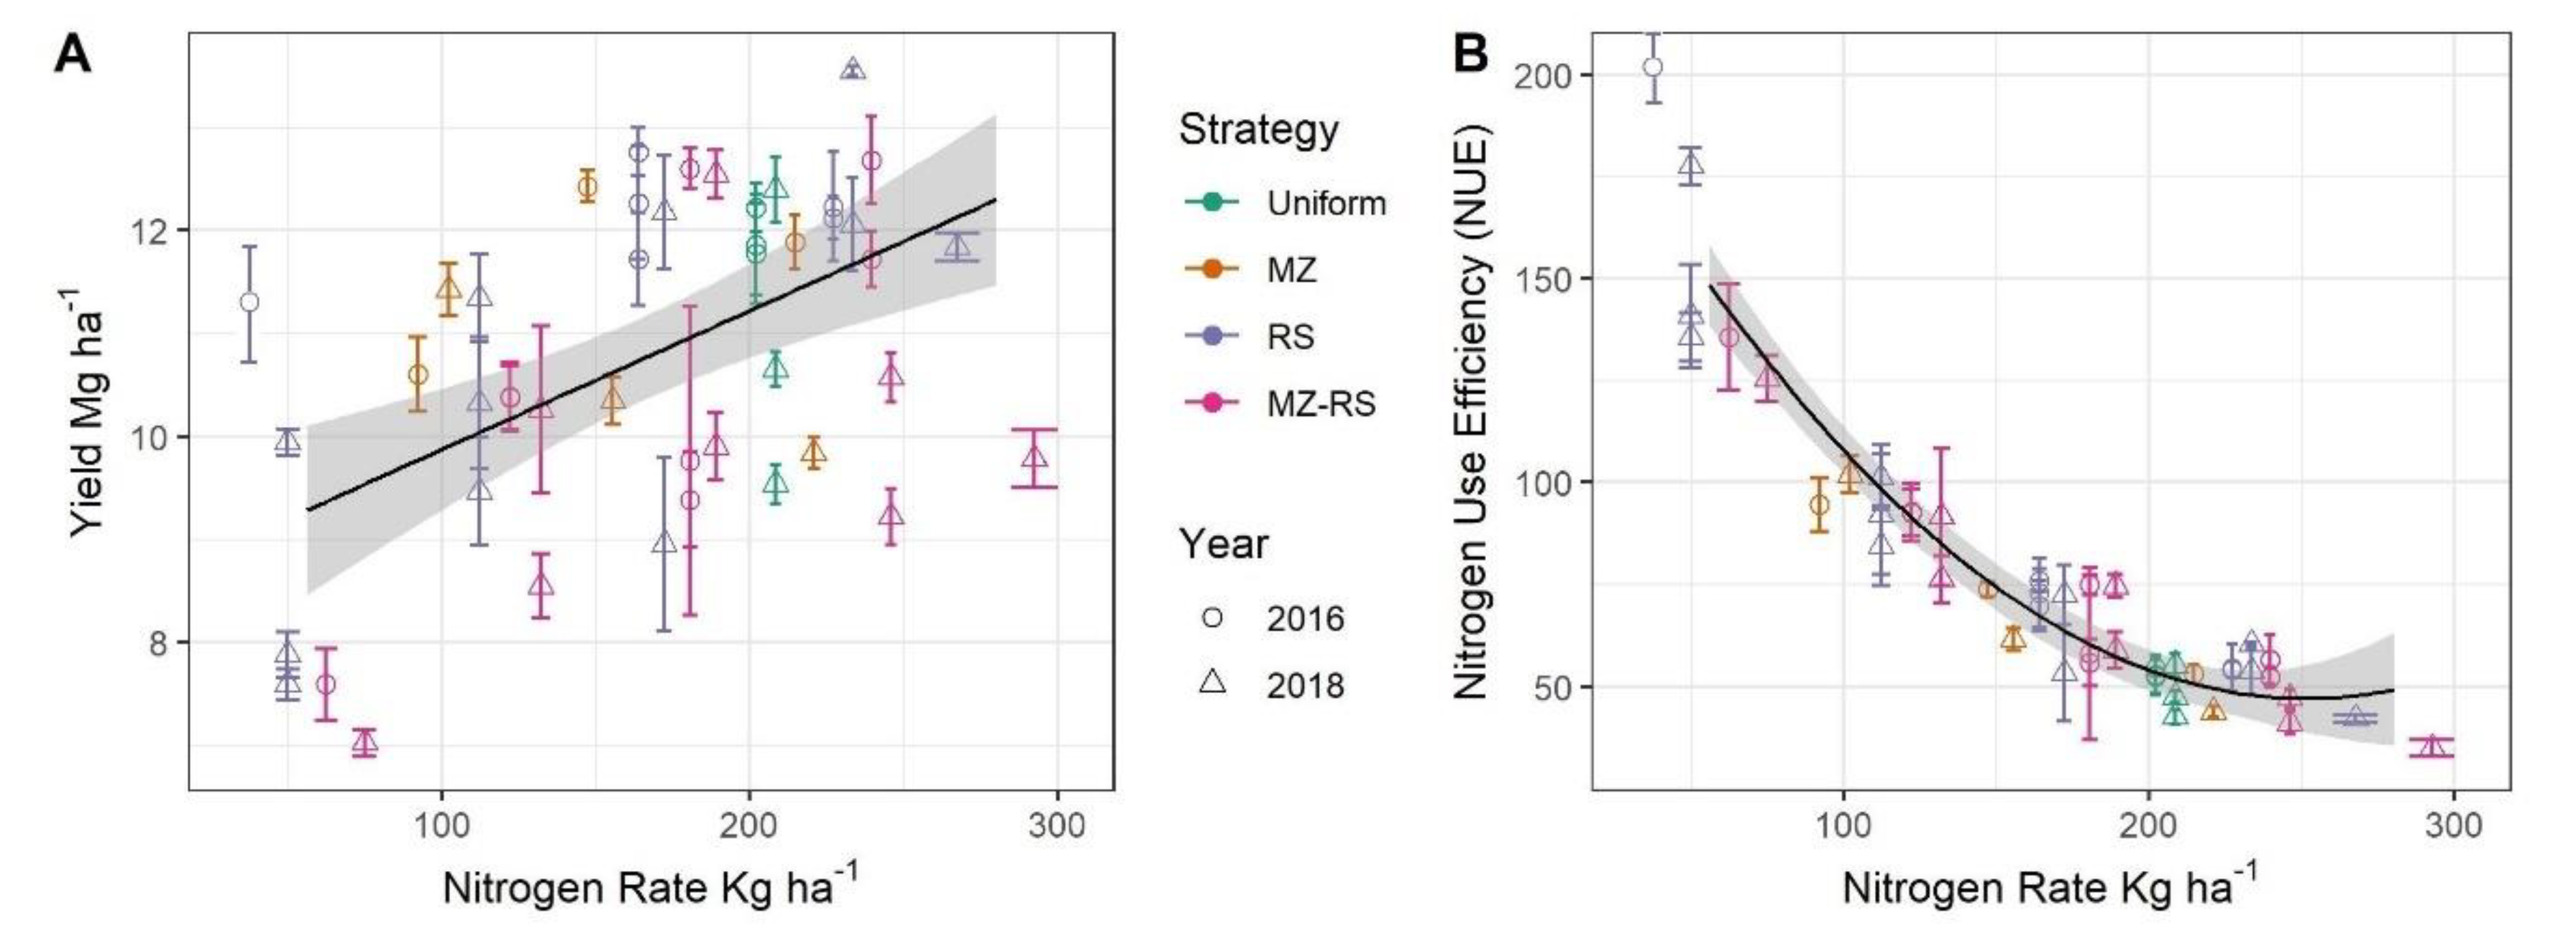
The four nitrogen management strategies evaluated in this study had a significant (p = 0.05) effect on the mean grain yield (Figure 5A). The uniform N management strategy, where 224 kg of N ha−1 was applied uniformly, produced the greatest grain yield (11.28 Mg ha−1); however, the MZ strategy resulted in a mean grain yield (10.99 Mg ha−1) that was statistically equivalent to the uniform N management strategy (p = 0.05). The RS (10.75 Mg ha−1) and MZRS (10.71 Mg ha−1) strategies underperformed as compared to the uniform strategy but were on par with the MZ strategy. Figure 6A shows the relationship of nitrogen rates with yield across 2016 and 2018, and four management strategies. We observed high variability in yield across the management zones and years, however a strong linear relation was observed between nitrogen rates and yield, as expected.
As presented in Figure 5B, all three N management strategies that employed a variable rate N fertilizer application resulted in significantly improved NUE when compared to the uniform strategy. As compared to the uniform strategy, the MZ, MZ-RS and RS strategies recorded 41%, 50%, and 89% more nitrogen use efficiency, respectively. While the average N rate applied was the same for every variable rate strategy, these strategies involved appropriating N fertilizer based on either or both micro and macro variability across the field as opposed to the uniform strategy. This resulted in increased efficiency but not necessarily increased grain yield. Figure 6B shows the exponential decay of NUE with increasing nitrogen rate. The green symbols in Figure 6B show the low NUE of the uniform strategy and the uniformly low variability in the uniform strategy.

4. Discussion

The results from the irrigation portion of this study are notable, given the variability in weather that occurred over all three growing seasons. It appears that in zones 1 and 2, a high irrigation rate can even be detrimental to grain yield where yield reductions ranged from 5% to 10% when comparing the highest rate of water applied to the middle rate (Figure S1, year 2016). The very high irrigation could have resulted in nitrate leaching or denitrification losses, causing a yield drag as suggested by Michalczyk et al. [50]. Another study has indicated that excess irrigation can result in decreases in grain yield due to reduced oxygen exchange between soil and the atmosphere, reductions in root growth and reduced transport of nutrients and water from roots to above-ground biomass [51]. These results seem to confirm that grain yield can be maximized, or significant losses avoided, when a slight deficit irrigation approach is undertaken [52,53,54]. In addition to yield losses, high irrigation/rainfall rates when exceeding soil water holding capacity result in losses of nutrients through drainage, leaching and run-off [29]. As indicated previously, the 2016 growing season was hot and dry even for the semi-arid conditions of Northeastern Colorado. It has been documented that the American Society of Civil Engineers’ (ASCE) standardized Penman–Monteith equation [47] for calculating reference ET, used by WISE to estimate crop ET in this study, can result in underestimations of ET in hot advective environments [55]. Thus, the irrigation applied could have been misappropriated such that the 120% ET rate was, in reality, a 100% ET rate. However, in two of the three years, the zone 3 mean grain yield was the most sensitive to the highest irrigation rate. Clearly, more research is needed to evaluate such aspects of irrigation when employing SSMZ, especially a robust analysis of soil conducted at a spatially dependent sampling scale to correctly identify and quantify the soil variables that drive variability in soil water content. However, VRI systems show promise in maximizing grain yield and water use within and across management zones. Additionally, the potential to couple variable rate center pivot with deficit irrigation management strategies may be possible at this field. The results from this study also indicate that management zones originally delineated for the purpose of N management can potentially also be employed for the management of VRI.
The lack of a significant interaction between zone and N rate in two of three site-years appears to be anomalous, as long-term research has documented that the variable rate N fertilizer optimizes and/or maximizes yield across management zones [7,12,13,56]. However, observations from this study are not unprecedented in past research. A study conducted in Nebraska that employed SSMZs and variable rate N with irrigated maize found no significant differences in grain yield at different levels of N across the field or amongst zones [57]. There are multiple reasons that could be attributed to the lack of significant zone and N interaction in this study. First, the year 2016 was an unusually dry year, where only 16% of the crop water need was met by precipitation. Though this study site had a sprinkler pivot irrigation system, field observations made during the season indicated periods of crop water stress in between irrigation cycles. Second, the study site underwent significant change in 2012, when it was precision leveled from a previous field-gradient of 3% to a gentle slope of <1% to accommodate a transition from a furrow irrigated system to a precision irrigated center pivot system. Finally, yield reductions associated with employing a continuous maize cropping system may limit the efficacy of using SSMZ. However, a review of the literature indicated that no study has been conducted to determine the effect of cropping system on SSMZ. The management zones currently employed at this study site were delineated prior to 2012 under a furrow irrigation system. Under furrow irrigation, water moved from west to east in the field. This is also reflected in the productivity potential of management zones delineated (Figure 1) on the field, as they followed a west to east gradient, where the eastern part of the field was the most productive or designated as the high management zone. It could be postulated that the management zones may have shifted, both spatially and temporally, due to the change in irrigation methodology. This would indicate that management zone delineation could also be related to management (e.g., furrow irrigation gradient) as opposed to restricting delineation patterns to soil properties. To date, minimal research has been conducted to determine how and if zones shift spatially with management habit modification and if there exists a necessity to reclassify fields as management changes occur. More research is needed to reclassify this field and similar other fields for the most efficient maize production systems. Recent research into SSMZ have also shown mixed results when comparing grain yield response to N applied in different amounts across fields and within zones [58,59]. Peralta, Assefa, Du, Barden and Ciampitti [59] found that applying more N in low and medium productivity zones did not always result in higher grain yields. It is suggested that these results are likely due to a lack of substantial differences in soil series present in a field, as a lack of soil series difference may result in similar depths of soil, water availability and temperatures. All these significantly impact N mineralization and availability during the growing season.
Significant irrigation and nitrogen interaction in all three years highlights the importance of fine-tuning water and fertilizer input for maximizing yield. Our results are in concordance with past studies, which showed a significant interaction of nitrogen and irrigation in maize yield and growth [60,61,62]. The results from the year 2016 show that at high nitrogen rates (224 kg N ha−1), irrigation rates did not affect yield, and all rates produced the highest yield that year. However, the same level of yield was obtained by using 100% ET irrigation and 168 kg N ha−1 nitrogen, or 80% ET and 224 kg N ha−1 nitrogen. In 2019, the yield achieved with 60% ET irrigation and 112 kg N ha−1 was statistically on par with all other combinations of higher irrigation and nitrogen rates. High N rates associated with low irrigation rates could result in excess N, which could not be used by the plant due to water stress. Over time, the excess N could be transported to waterways and contaminate the environment [4]. Our results are supported by the study by [63], who reported a synergistic relationship between irrigation and nitrogen rates and improvement in water use efficiency in maize; however, the maximum nitrogen rate was only 100 kg N ha−1. This result has important implications for the cost-effective management of agricultural inputs (water and fertilizer). If water is not limited, there is an opportunity to reduce the nitrogen rate without yield penalty, and vice versa. Given that the experiment was conducted in the semi-arid environment of Colorado, the effect of irrigation on yield was much more intense than N rates.
The comparison of yield and NUE from four nitrogen management strategies provided an interesting perspective on variable nitrogen management. It has been postulated in previous research that the combination of management zone and in-season crop canopy sensing could produce optimal N rates in terms of grain yield, and lead to more efficient N application [41,42,64,65]. A limitation with this study, which may explain the lack of grain yield advantage when combining proximal sensing and management zones, was the assignment of N rates to NDVI clusters within and without zones (i.e., the MZRS and RS strategies). This research is intended to be postdictive, whereby, under reasonable assumptions, N rates were assigned to NDVI clusters. The yield data that corresponded to the two N management strategies that involved the remote sensing of the canopy were sub-sampled, assuming that low NDVI values indicated that higher rates of N were required at side-dressing, and vice versa for high NDVI values, in order to achieve improved yields and enhance the efficiency of N application. Given advances in sensor technology and variable rate applicators, it is easy to envision an improvement to the RS and MZRS strategies that employ “drive and apply” sensing to variably apply N in the field based on remote sensing of the canopy as an applicator traverses a farm field. A recent study [66] on wheat in Brazil compared identical strategies through simulation. The corresponding RS strategy employed a previously developed algorithm [67] for maize. This algorithm employed a virtual reference strategy by using the 95th percentile value from a vegetation index collected on-the-go to calculate a sufficiency index, similar to research developed by [68]. To couple the MZ and RS strategies, a virtual reference within each zone was used. By quantifying the virtual reference within each zone, their methodology resulted in a zone-specific algorithm for N application rates to prevent over or under applications of N within zones based on canopy reflectance and zone. While the results from this study showed that grain yields might sometimes be reduced when implementing variable rate N strategies, as compared to the uniform N management, it does not imply that farmers would not choose progressive efficiency-centered approaches for N management. At both the individual farmer and societal levels, the need to consider productivity, efficiency and environmental sustainability related to N management is apparent [2]. In the United States, it has been estimated that the negative externalities of reactive anthropogenic N, of which agriculture is the single largest contributor, results in between USD 81–224 billion yr−1 in damages to human health and the environment [69], while in Europe, an attempt is being made to quantify a socially optimal N rate that, when considering the external costs of reactive N in the environment, arrives at 120 kg N ha−1 [70]. Often, the profitability of applying N at the agronomical optimum rate is insignificant when applying slightly more or less N, and high costs to the environment and human health can be mitigated or made worse by lowering or raising N rates by even small amounts. The North China Plain is an area of intensive agriculture where farmers on average apply 369 kg N ha−1 for growing winter wheat [71], and a study conducted there, to compare ecological and socially optimal N rates to agronomic and profitable N rates, concluded that N rates could be reduced to the benefit of human health and the environment without harming the livelihood of farmers [72]. They reported that a socially optimal N rate resulted in grain yields that were up to 5% lower than the agronomic rate, but applied N rates decreased by 58%, and NUE increased by up to 138%. Furthermore, it was found that reductions in yield did not result in a significant decrease in profits given the savings associated with less N applied. Pending a further economic analysis, it is conceivable that employing the MZRS strategy as presented here may still yet be a viable economic option, given that grain yield reductions on average were not large and NUE increases were significantly larger when compared to the uniform strategy. This approach may still be appealing to some farmers who consider their ecological footprint when managing N fertilizer, especially when considering that demand for grain in the US is relatively inelastic.

5. Conclusions

Precision nitrogen and water management, via management zone and proximal canopy sensing approaches, has tremendous potential to improve and optimize grain yield and nitrogen use efficiency in irrigated maize. The first goal of this study was to understand crop grain yield’s response to variable rate nitrogen and irrigation across site-specific management zones. Our results suggest that grain yield was affected by the interaction in management zone, irrigation and nitrogen. Variable rate irrigation showed promise in conserving water without significant reductions in grain yield if a moderate reduction (20%) in water is applied both across the entire field and within zones. Furthermore, there is evidence that site-specific management zones delineated for the purpose of N management could be used for the variable management of irrigation water as well. While further research is necessary to better understand how zones may shift in space and time as well as to characterize variability in soil water, the site-specific management approach could greatly benefit farmers who wish to simplify operations and manage N and water synergistically. The second goal of this study was to examine four variable rate N management strategies that captured both macro (soil-based) and micro (crop canopy based) variability. Our hypothesis that grain yield and NUE could be optimized using management zone and remote sensing strategies was supported by the results. Uniform rate nitrogen produced the best grain yield (statistically on par with the management zone approach) with the worst NUE among all nitrogen application strategies. These results will allow producers to choose a nitrogen management strategy that fits their needs. The remote sensing strategy will provide the best NUE with a compromise in grain yield, whereas the management zone strategy will provide the best grain yield with reasonable NUE. The strategies discussed in this paper could be further studied to develop a “drive and apply” method that fuses remote sensing of the canopy, classification statistics (clustering), management zones, and machine control to variably apply nitrogen fertilizer to optimize grain yield and NUE.

Supplementary Materials

The following are available online at https://www.mdpi.com/2073-4395/10/10/1533/s1, Figure S1: Interaction plots between zone and irrigation rates within each nitrogen rate for year 2016 (top-left), 2018 (top-right), and 2019 (bottom-left), Table S1: Comparison of maize yield within management zones across nitrogen rates for years 2016, 2018, and 2019, Figure S2: Interaction plots between nitrogen rate and irrigation rates within each zone for years 2016 (top), 2018 (middle), and 2019 (bottom)., Table S2: Comparison of maize yield among nitrogen rates, within irrigation rates across zones, for years 2016, 2018, and 2019.

Author Contributions

S.D.: Formal analysis, Visualization, Writing—review and editing. E.P.: Initial analysis, Investigation, Data collection and curation, Writing-initial draft, Visualization. L.L. Methodology, Supervision, Writing—review and editing. R.K.: Funding acquisition, Resources, Conceptualization, Project administration, Supervision, Writing—review and editing. A.A.: Supervision, Writing—review and editing. All authors have read and agreed to the published version of the manuscript.

Funding

This work was financially supported by the Colorado Corn Growers Research Administration, Colorado State University Agricultural Experiment Station and Colorado State University Cooperative Extension.

Conflicts of Interest

The authors declare that they have no known competing financial interests or personal relationships that could have appeared to influence the work reported in this paper.

References

  1. National Agricultural Statistics Service-United States Department of Agriculture (NASS-USDA) NASS-National Agricultural Statistics Service. Available online: http://www.nass.usda.gov/ (accessed on 6 July 2020).
  2. Tilman, D.; Cassman, K.G.; Matson, P.A.; Naylor, R.; Polasky, S. Agricultural sustainability and intensive production practices. Nature 2002, 418, 671–677. [Google Scholar] [CrossRef] [PubMed]
  3. De Lara, A.; Khosla, R.; Longchamps, L. Characterizing spatial variability in soil water content for precision irrigation management. Agronomy 2018, 8, 59. [Google Scholar] [CrossRef] [Green Version]
  4. Delgado, J.; Khosla, R.; Bausch, W.; Westfall, D.; Inman, D. Nitrogen fertilizer management based on site-specific management zones reduces potential for nitrate leaching. J. Soil Water Conserv. 2005, 60, 402–410. [Google Scholar]
  5. Sun, M.; Huo, Z.; Zheng, Y.; Dai, X.; Feng, S.; Mao, X. Quantifying long-term responses of crop yield and nitrate leaching in an intensive farmland using agro-eco-environmental model. Sci. Total Environ. 2018, 613, 1003–1012. [Google Scholar] [CrossRef]
  6. Hedley, C. The role of precision agriculture for improved nutrient management on farms. J. Sci. Food Agric. 2015, 95, 12–19. [Google Scholar] [CrossRef]
  7. Koch, B.; Khosla, R.; Frasier, W.; Westfall, D.; Inman, D. Economic feasibility of variable-rate nitrogen application utilizing site-specific management zones. Agron. J. 2004, 96, 1572–1580. [Google Scholar] [CrossRef] [Green Version]
  8. Khosla, R.; Shaver, T. Zoning in on nitrogen needs. Colo. State Univ. Agron. Newsl. 2001, 21, 24–26. [Google Scholar]
  9. Scharf, P.C.; Lory, J.A. Calibrating corn color from aerial photographs to predict sidedress nitrogen need. Agron. J. 2002, 94, 397–404. [Google Scholar] [CrossRef]
  10. Raun, W.R.; Schepers, J. Nitrogen management for improved use efficiency. Nitrogen Agric. Syst. 2008, 675–693. [Google Scholar]
  11. Stewart, B.; Lal, R. The nitrogen dilemma: Food or the environment. J. Soil Water Conserv. 2017, 72, 124–128. [Google Scholar] [CrossRef] [Green Version]
  12. Inman, D.; Khosla, R.; Westfall, D.; Reich, R. Nitrogen uptake across site specific management zones in irrigated corn production systems. Agron. J. 2005, 97, 169–176. [Google Scholar] [CrossRef]
  13. Khosla, R.; Fleming, K.; Delgado, J.; Shaver, T.; Westfall, D. Use of site-specific management zones to improve nitrogen management for precision agriculture. J. Soil Water Conserv. 2002, 57, 513–518. [Google Scholar]
  14. Joshi, V.R.; Thorp, K.R.; Coulter, J.A.; Johnson, G.A.; Porter, P.M.; Strock, J.S.; Garcia y Garcia, A. Improving site-specific maize yield estimation by integrating satellite multispectral data into a crop model. Agronomy 2019, 9, 719. [Google Scholar] [CrossRef] [Green Version]
  15. Reyes, J.; Wendroth, O.; Matocha, C.; Zhu, J. Delineating site-specific management zones and evaluating soil water temporal dynamics in a farmer’s field in Kentucky. Vadose Zone J. 2019, 18, 1–19. [Google Scholar] [CrossRef]
  16. Fleming, K.; Heermann, D.; Westfall, D. Evaluating soil color with farmer input and apparent soil electrical conductivity for management zone delineation. Agron. J. 2004, 96, 1581–1587. [Google Scholar] [CrossRef]
  17. Flowers, M.; Weisz, R.; White, J.G. Yield-based management zones and grid sampling strategies. Agron. J. 2005, 97, 968–982. [Google Scholar] [CrossRef]
  18. Gavioli, A.; de Souza, E.G.; Bazzi, C.L.; Schenatto, K.; Betzek, N.M. Identification of management zones in precision agriculture: An evaluation of alternative cluster analysis methods. Biosyst. Eng. 2019, 181, 86–102. [Google Scholar] [CrossRef]
  19. Song, X.; Wang, J.; Huang, W.; Liu, L.; Yan, G.; Pu, R. The delineation of agricultural management zones with high resolution remotely sensed data. Precis. Agric. 2009, 10, 471–487. [Google Scholar] [CrossRef]
  20. Fereres, E.; Connor, D. Sustainable water management in agriculture. In Challenges of the New Water Policies for the XXI Century; AA Balkema: Lisse, The Netherlands, 2004; pp. 157–170. [Google Scholar]
  21. Tilman, D.; Balzer, C.; Hill, J.; Befort, B.L. Global food demand and the sustainable intensification of agriculture. Proc. Natl. Acad. Sci. USA 2011, 108, 20260–20264. [Google Scholar] [CrossRef] [Green Version]
  22. Trnka, M.; Kersebaum, K.C.; Eitzinger, J.; Hayes, M.; Hlavinka, P.; Svoboda, M.; Dubrovský, M.; Semerádová, D.; Wardlow, B.; Pokorný, E. Consequences of climate change for the soil climate in Central Europe and the central plains of the United States. Clim. Change 2013, 120, 405–418. [Google Scholar] [CrossRef] [Green Version]
  23. Trnka, M.; Feng, S.; Semenov, M.A.; Olesen, J.E.; Kersebaum, K.C.; Rötter, R.P.; Semerádová, D.; Klem, K.; Huang, W.; Ruiz-Ramos, M. Mitigation efforts will not fully alleviate the increase in water scarcity occurrence probability in wheat-producing areas. Sci. Adv. 2019, 5, 12. [Google Scholar] [CrossRef] [PubMed] [Green Version]
  24. Feng, S.; Trnka, M.; Hayes, M.; Zhang, Y. Why do different drought indices show distinct future drought risk outcomes in the US Great Plains? J. Clim. 2017, 30, 265–278. [Google Scholar] [CrossRef]
  25. Evans, R.G.; LaRue, J.; Stone, K.C.; King, B.A. Adoption of site-specific variable rate sprinkler irrigation systems. Irrig. Sci. 2013, 31, 871–887. [Google Scholar] [CrossRef]
  26. De Lara, A.; Longchamps, L.; Khosla, R. Soil water content and high-resolution imagery for precision irrigation: Maize yield. Agronomy 2019, 9, 174. [Google Scholar] [CrossRef] [Green Version]
  27. Barker, J.B.; Heeren, D.M.; Neale, C.M.; Rudnick, D.R. Evaluation of variable rate irrigation using a remote-sensing-based model. Agric. Water Manag. 2018, 203, 63–74. [Google Scholar] [CrossRef] [Green Version]
  28. Lo, T.H.; Heeren, D.M.; Mateos, L.; Luck, J.D.; Martin, D.L.; Miller, K.A.; Barker, J.B.; Shaver, T.M. Field characterization of field capacity and root zone available water capacity for variable rate irrigation. Appl. Eng. Agric. 2017, 33, 559–572. [Google Scholar] [CrossRef]
  29. Roygard, J.K.; Alley, M.M.; Khosla, R. No-till corn yields and water balance in the mid-atlantic coastal plain. Agron. J. 2002, 94, 612–623. [Google Scholar]
  30. Hati, K.; Mandal, K.; Misra, A.; Ghosh, P.; Acharya, C. Evapo-transpiration, water-use efficiency, moisture use and yield of Indian mustard (Brassica juncea) under varying levels of irrigation and nutrient management in Vertisol. Indian J. Agric. Sci. 2001, 71, 639–643. [Google Scholar]
  31. Pandey, R.; Maranville, J.; Admou, A. Deficit irrigation and nitrogen effects on maize in a Sahelian environment: I. Grain yield and yield components. Agric. Water Manag. 2000, 46, 1–13. [Google Scholar] [CrossRef]
  32. Ge, Y.; Thomasson, J.A.; Sui, R. Remote sensing of soil properties in precision agriculture: A review. Front. Earth Sci. 2011, 5, 229–238. [Google Scholar] [CrossRef]
  33. Inman, D.; Khosla, R.; Mayfield, T. On-the-go active remote sensing for efficient crop nitrogen management. Sens. Rev. 2005, 25, 209–214. [Google Scholar] [CrossRef]
  34. Raun, W.; Johnson, G.; Sembiring, H.; Lukina, E.; LaRuffa, J.; Thomason, W.; Phillips, S.; Solie, J.; Stone, M.; Whitney, R. Indirect measures of plant nutrients. Commun. Soil Sci. Plan. 1998, 29, 1571–1581. [Google Scholar] [CrossRef]
  35. Shaver, T.; Khosla, R.; Westfall, D. Evaluation of two ground-based active crop canopy sensors in maize: Growth stage, row spacing, and sensor movement speed. Soil Sci. Soc. Am. J. 2010, 74, 2101–2108. [Google Scholar] [CrossRef]
  36. Longchamps, L.; Khosla, R. Early detection of nitrogen variability in maize using fluorescence. Agron. J. 2014, 106, 511–518. [Google Scholar] [CrossRef]
  37. Siqueira, R.; Longchamps, L.; Dahal, S.; Khosla, R. Use of fluorescence sensing to detect nitrogen and potassium variability in maize. Remote Sens. 2020, 12, 1752. [Google Scholar] [CrossRef]
  38. Hatfield, J.; Gitelson, A.A.; Schepers, J.S.; Walthall, C. Application of spectral remote sensing for agronomic decisions. Agron. J. 2008, 100, 117–131. [Google Scholar] [CrossRef] [Green Version]
  39. Naser, M.A.; Khosla, R.; Longchamps, L.; Dahal, S. Using NDVI to differentiate wheat genotypes productivity under dryland and irrigated conditions. Remote Sens. 2020, 12, 824. [Google Scholar] [CrossRef] [Green Version]
  40. Naser, M.A.; Khosla, R.; Longchamps, L.; Dahal, S. Characterizing variation in nitrogen use efficiency in wheat genotypes using proximal canopy sensing for sustainable wheat production. Agronomy 2020, 10, 773. [Google Scholar] [CrossRef]
  41. Roberts, D.F.; Ferguson, R.B.; Kitchen, N.R.; Adamchuk, V.I.; Shanahan, J.F. Relationships between soil-based management zones and canopy sensing for corn nitrogen management. Agron. J. 2012, 104, 119–129. [Google Scholar] [CrossRef] [Green Version]
  42. Cordero, E.; Longchamps, L.; Khosla, R.; Sacco, D. Spatial management strategies for nitrogen in maize production based on soil and crop data. Sci. Total Environ. 2019, 697, 133854. [Google Scholar] [CrossRef]
  43. Peralta, N.R.; Costa, J.L.; Balzarini, M.; Angelini, H. Delineation of management zones with measurements of soil apparent electrical conductivity in the southeastern pampas. Can. J. Soil Sci. 2013, 93, 205–218. [Google Scholar] [CrossRef]
  44. Natural Resources Conservation Service (NRCS). Soil Survey Staff. Natural resources conservation service, United States department of agriculture. In Soil Survey Geographic (SSURGO) Database for Northeast Tennessee; Natural Resources Conservation Service: Washington, DC, USA, 2010. [Google Scholar]
  45. Ritchie, S.; Hanway, J.; Benson, G. How a corn plant develops. Iowa State Univ. Coop. Ext. Serv. Spec. Rep. 1993, 48, 21. [Google Scholar]
  46. Andales, A.; Bauder, T.; Arabi, M. A mobile irrigation water management system using a collaborative GIS and weather station networks. In Practical Applications of Agricultural System Models to Optimize the Use of Limited Water; Ahuja, L.R., Ma, L., Lascano, R.J., Eds.; ASA, CSSA, SSSA: Madison, WI, USA, 2014; Volume 5, pp. 53–84. [Google Scholar]
  47. Walter, I.A.; Allen, R.G.; Elliott, R.; Jensen, M.; Itenfisu, D.; Mecham, B.; Howell, T.; Snyder, R.; Brown, P.; Echings, S. ASCE’s standardized reference evapotranspiration equation. In Proceedings of the Watershed Management and Operations Management 2000, Fort Collins, CO, USA, 20–24 June 2000; pp. 1–11. [Google Scholar]
  48. Khosla, R.; Flynn, B. Understanding and cleaning yield monitor data. Soil Sci. Step Step Field Anal. 2008, 113–130. [Google Scholar]
  49. De Mendiburu, F. Package ‘agricolae’. R Package Version (2020): 1–2. Available online: https://cran.r-project.org/web/packages/agricolae/index.html (accessed on 16 June 2020).
  50. Michalczyk, A.; Kersebaum, K.C.; Roelcke, M.; Hartmann, T.; Yue, S.-C.; Chen, X.-P.; Zhang, F.-S. Model-based optimisation of nitrogen and water management for wheat-maize systems in the North China Plain. Nutr. Cycl. Agroecosyst. 2014, 98, 203–222. [Google Scholar] [CrossRef]
  51. Kanwar, R.S.; Baker, J.L.; Mukhtar, S. Excessive soil water effects at various stages of development on the growth and yield of corn. Trans. Asae 1988, 31, 133–141. [Google Scholar] [CrossRef] [Green Version]
  52. Rathore, V.S.; Nathawat, N.S.; Bhardwaj, S.; Sasidharan, R.P.; Yadav, B.M.; Kumar, M.; Santra, P.; Yadava, N.D.; Yadav, O.P. Yield, water and nitrogen use efficiencies of sprinkler irrigated wheat grown under different irrigation and nitrogen levels in an arid region. Agric. Water Manag. 2017, 187, 232–245. [Google Scholar] [CrossRef]
  53. Stone, K.; Camp, C.; Sadler, E.; Evans, D.; Millen, J. Corn yield response to nitrogen fertilizer and irrigation in the southeastern Coastal Plain. Appl. Eng. Agric. 2010, 26, 429–438. [Google Scholar] [CrossRef]
  54. Zhang, H. Improving water productivity through deficit irrigation: Examples from Syria, the North China Plain and Oregon, USA. In Water Productivity in Agriculture: Limits and Opportunities for Improvements; CABI: Wallingford, UK, 2003; pp. 301–309. [Google Scholar]
  55. Gowda, P.H.; Chavez, J.L.; Colaizzi, P.D.; Evett, S.R.; Howell, T.A.; Tolk, J.A. ET mapping for agricultural water management: Present status and challenges. Irrig. Sci. 2008, 26, 223–237. [Google Scholar] [CrossRef] [Green Version]
  56. Hornung, A.; Khosla, R.; Reich, R.; Inman, D.; Westfall, D. Comparison of site-specific management zones. Agron. J. 2006, 98, 407–415. [Google Scholar] [CrossRef] [Green Version]
  57. Ferguson, R.B.; Hergert, G.W.; Schepers, J.; Gotway, C.; Cahoon, J.; Peterson, T. Site-specific nitrogen management of irrigated maize. Soil Sci. Soc. Am. J. 2002, 66, 544–553. [Google Scholar]
  58. Del Pilar, M.M.-P.; Cipriotti, P.A.; Urricariet, S.; Peralta, N.R.; Niborski, M. Using site-specific nitrogen management in rainfed corn to reduce the risk of nitrate leaching. Agric. Water Manag. 2018, 199, 61–70. [Google Scholar]
  59. Peralta, N.R.; Assefa, Y.; Du, J.; Barden, C.J.; Ciampitti, I.A. Mid-season high-resolution satellite imagery for forecasting site-specific corn yield. Remote Sens. 2016, 8, 848. [Google Scholar] [CrossRef] [Green Version]
  60. Ahmad, I.; Wajid, S.A.; Ahmad, A.; Cheema, M.J.M.; Judge, J. Optimizing irrigation and nitrogen requirements for maize through empirical modeling in semi-arid environment. Environ. Sci. Pollut. Res. 2019, 26, 1227–1237. [Google Scholar] [CrossRef] [PubMed]
  61. Hammad, H.M.; Farhad, W.; Abbas, F.; Fahad, S.; Saeed, S.; Nasim, W.; Bakhat, H.F. Maize plant nitrogen uptake dynamics at limited irrigation water and nitrogen. Environ. Sci. Pollut. Res. 2017, 24, 2549–2557. [Google Scholar] [CrossRef] [PubMed]
  62. Wang, Y.; Janz, B.; Engedal, T.; de Neergaard, A. Effect of irrigation regimes and nitrogen rates on water use efficiency and nitrogen uptake in maize. Agric. Water Manag. 2017, 179, 271–276. [Google Scholar] [CrossRef] [Green Version]
  63. Ogola, J.; Wheeler, T.; Harris, P. Effects of nitrogen and irrigation on water use of maize crops. Field Crop. Res. 2002, 78, 105–117. [Google Scholar] [CrossRef]
  64. Holland, K.; Schepers, J. Derivation of a variable rate nitrogen application model for in-season fertilization of corn. Agron. J. 2010, 102, 1415–1424. [Google Scholar] [CrossRef]
  65. Inman, D.; Khosla, R.; Reich, R.; Westfall, D. Normalized difference vegetation index and soil color-based management zones in irrigated maize. Agron. J. 2008, 100, 60–66. [Google Scholar] [CrossRef]
  66. Schwalbert, R.; Amado, T.J.; Horbe, T.A.; Stefanello, L.O.; Assefa, Y.; Prasad, P.; Rice, C.W.; Ciampitti, I.A. Corn yield response to plant density and nitrogen: Spatial models and yield distribution. Agron. J. 2018, 110, 970–982. [Google Scholar] [CrossRef]
  67. Holland, K.H.; Schepers, J.S. Use of a virtual-reference concept to interpret active crop canopy sensor data. Precis. Agric. 2013, 14, 71–85. [Google Scholar] [CrossRef]
  68. Raun, W.; Solie, J.; Stone, M.; Martin, K.; Freeman, K.; Mullen, R.; Zhang, H.; Schepers, J.; Johnson, G. Optical sensor-based algorithm for crop nitrogen fertilization. Commun. Soil Sci. Plan. 2005, 36, 2759–2781. [Google Scholar] [CrossRef] [Green Version]
  69. Sobota, D.J.; Compton, J.E.; McCrackin, M.L.; Singh, S. Cost of reactive nitrogen release from human activities to the environment in the United States. Environ. Res. Lett. 2015, 10, 025006. [Google Scholar] [CrossRef]
  70. Van Grinsven, H.J.; Holland, M.; Jacobsen, B.H.; Klimont, Z.; Sutton, M.A.; Willems, W.J. Costs and benefits of nitrogen for Europe and implications for mitigation. Environ. Sci. Technol. 2013, 47, 3571–3579. [Google Scholar] [CrossRef] [PubMed]
  71. Cui, Z.; Shi, L.; Xu, J.; Li, J.; Zhang, F.; Chen, X. Effects of N fertilization on winter wheat grain yield and its crude protein content and apparent N losses. Ying Yong Sheng Tai Xue Bao J. Appl. Ecol. 2005, 16, 2071–2075. [Google Scholar]
  72. Ying, H.; Ye, Y.; Cui, Z.; Chen, X. Managing nitrogen for sustainable wheat production. J. Clean. Prod. 2017, 162, 1308–1316. [Google Scholar] [CrossRef]
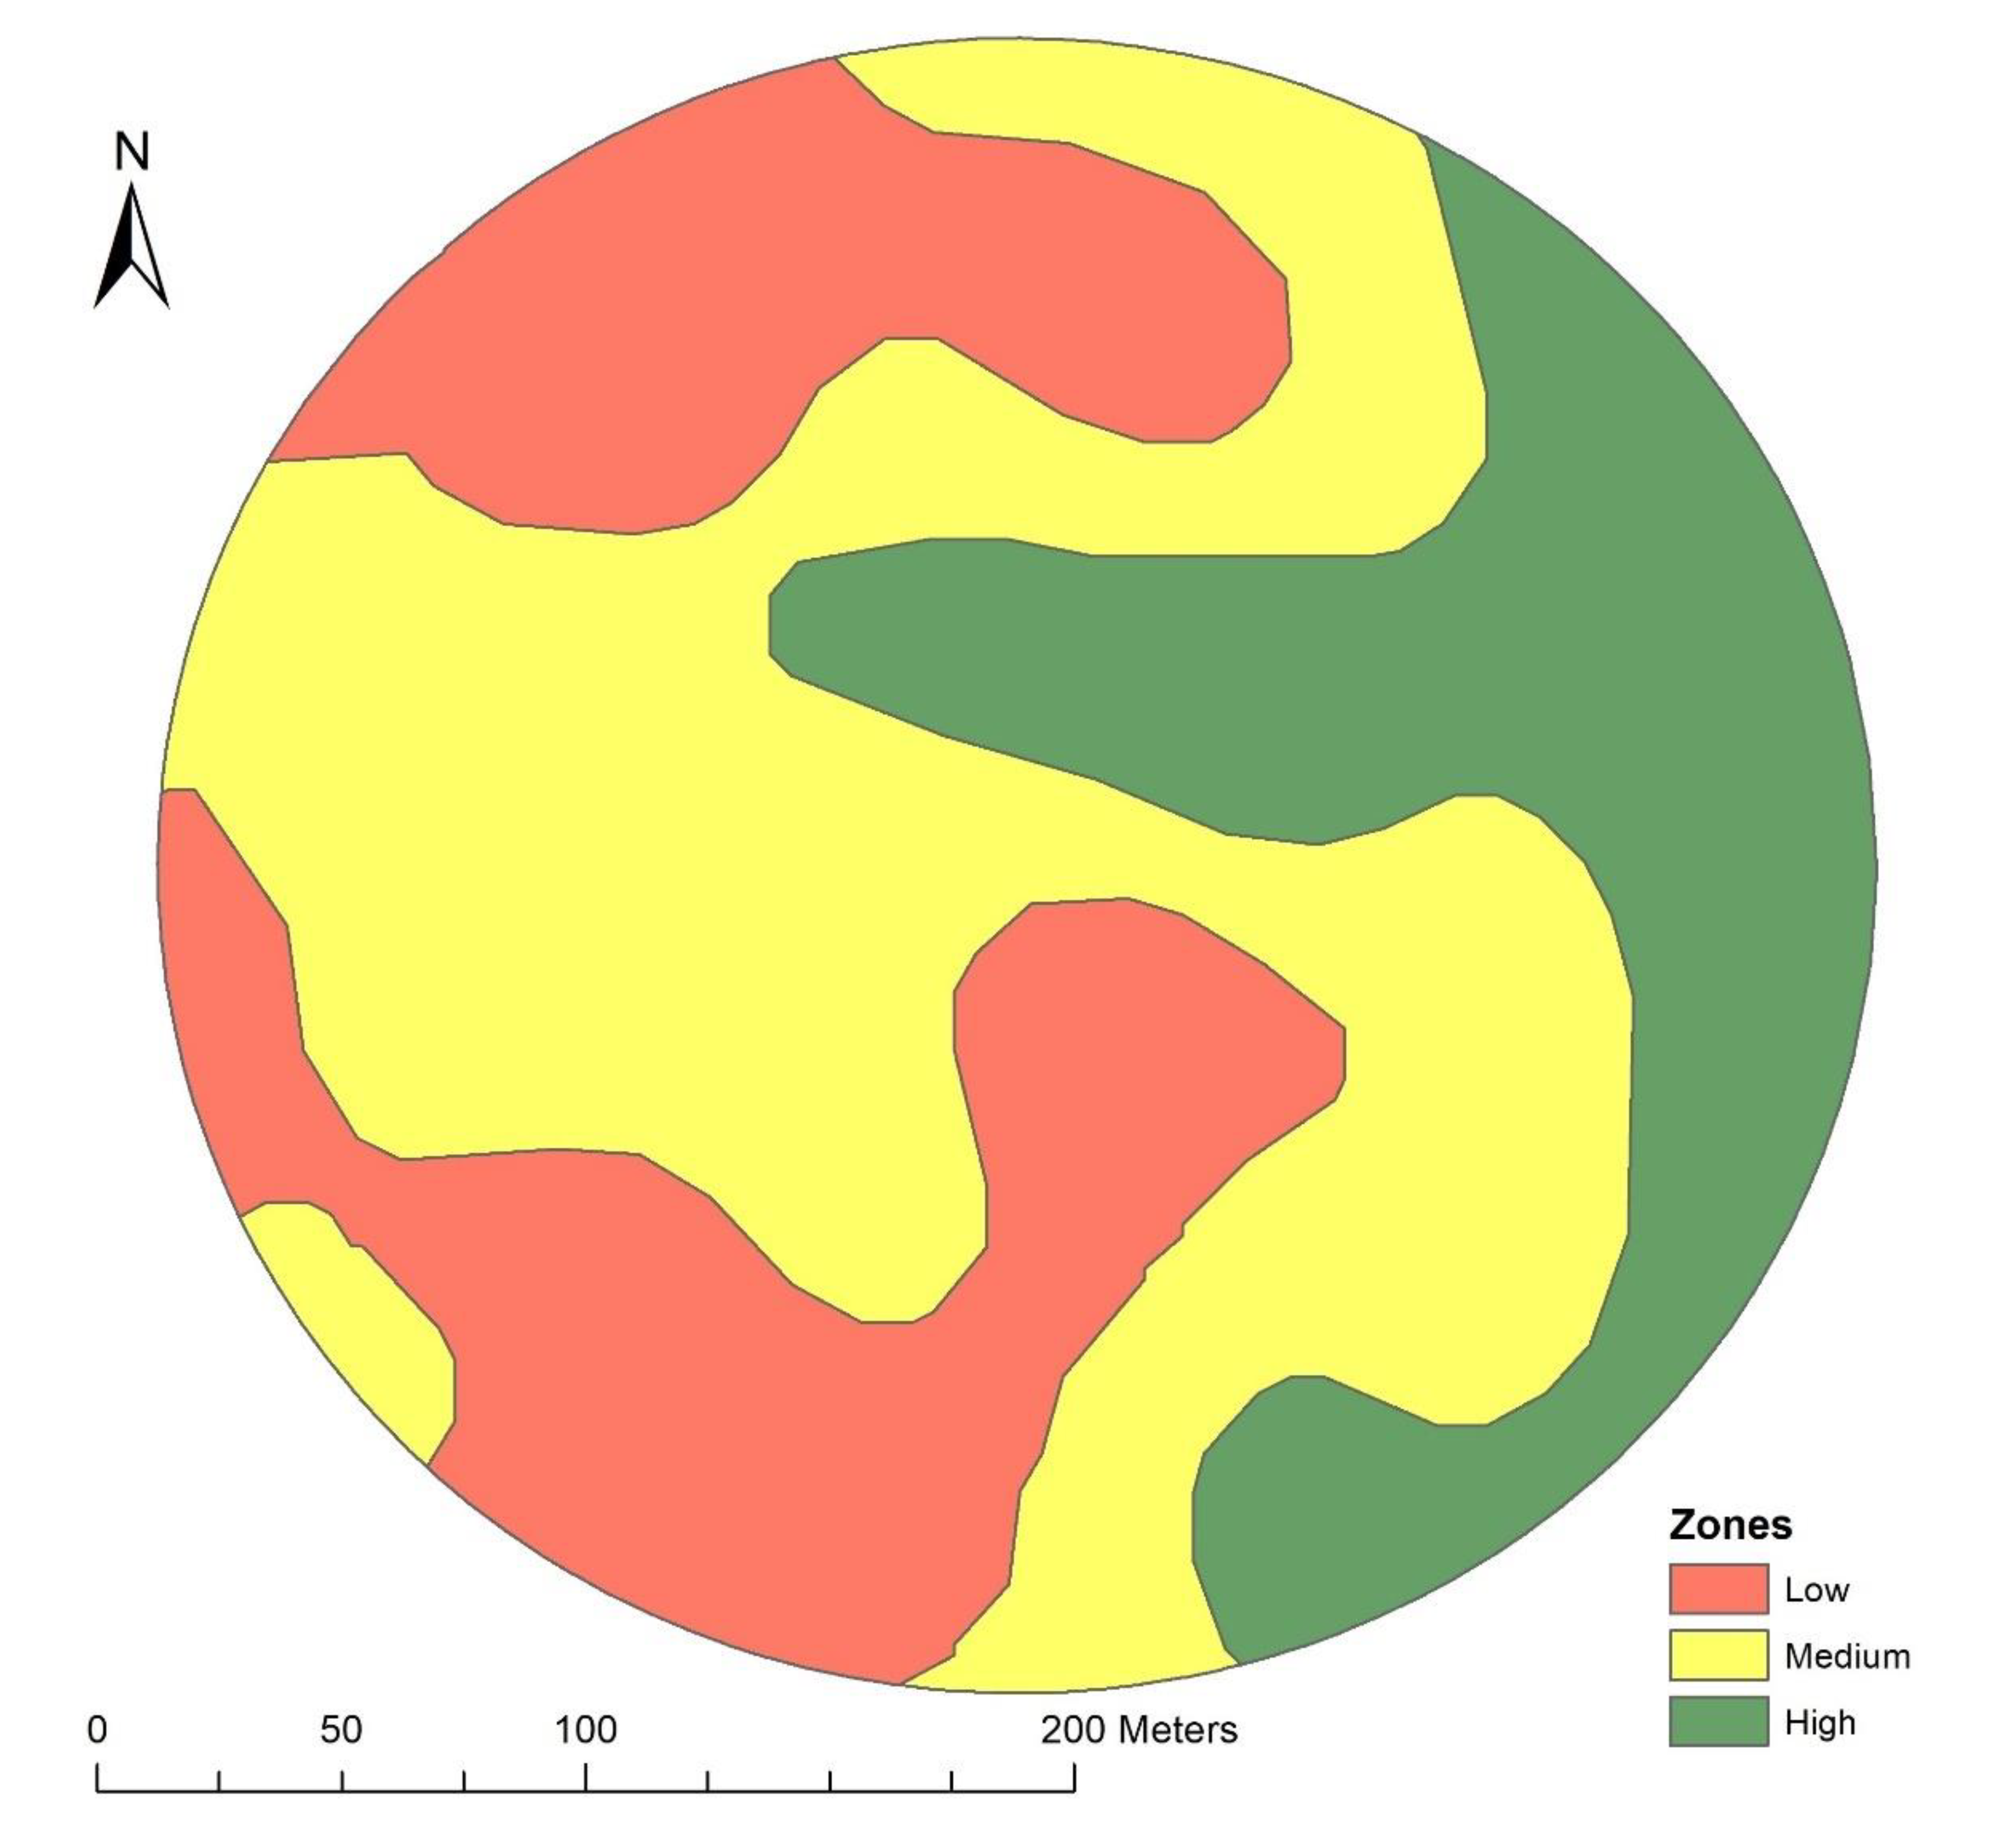
Figure 1. Field 3100 at ARDEC (Ag Research Development & Education Center), Fort Collins, CO, USA showing the management zones.
Agronomy 10 01533 g001
Figure 2. Time series plot of daily precipitation (mm), average temperature (0 °C), and actual evapotranspiration (ET) (mm) for the years 2016, 2017, 2018, and 2019 at the experiment site.
Agronomy 10 01533 g002
Figure 3. Interaction plots between zone and irrigation rates (IR) pooled across all nitrogen rates for year 2016 (A), 2018 (B), and 2019 (C).
Agronomy 10 01533 g003
Figure 4. Interaction plots between nitrogen rate and irrigation rates within each zone for year 2016 (A), 2018 (B), and 2019 (C).
Agronomy 10 01533 g004
Figure 5. Plots showing the effect of different nitrogen management strategies in (A) yield and (B) NUE. Different letters indicate significant difference between strategies (at α = 0.05).
Agronomy 10 01533 g005
Figure 6. Response of (A) maize grain yield (B) and nitrogen use efficiency (NUE) (kg grain/kg N) with respect to amount of applied nitrogen, in four nitrogen management strategies (uniform, MZ = management zones, RS = remote sensing, MZ-RS = management zones and remote sensing), across 2016 and 2018.
Agronomy 10 01533 g006
Table 1. Criteria and number of observations for each N management strategy across growing seasons 2016 and 2018.
StrategyObservationsN Rate
(kg N ha−1)
Management ZoneNDVI ClusterAverage N
(kg N ha−1)
Uniform270224AnyAny224
90112LowAny
MZ90168MediumAny168
90224HighAny
5456AnyHighest
54112AnyHigh
RS54168AnyMedium168
54224AnyLow
54280AnyLowest
3056LowHigh
30112LowMedium
30168LowLow
30112MediumHigh
MZRS30168MediumMedium168
30224MediumLow
30168HighHigh
30224HighMedium
30280HighLow
MZ = management zones, RS = remote sensing, MZRS = management zone and remote sensing, NDVI = normalized difference vegetation index.
Table 2. Summary statistics of yield (Mg ha−1) categorized by zone, irrigation rate and nitrogen rate, for years 2016, 2018, and 2019.
YearZoneNMeanMedianMinMaxSE
Nitrogen Rate
2016012677.037.011.9910.90.04
20165613528.758.842.0816.20.06
2016112126510.0210.371.9714.570.05
2016168115111.3611.751.9817.530.06
2016224105511.6211.862.116.940.05
201805428.048.141.9311.540.07
2018564988.88.962.213.20.07
20181124939.959.52.0914.790.1
201816848610.7710.722.6114.530.08
201822447910.8510.632.9215.050.08
201828048710.8710.862.0515.020.08
201902296.746.562.0513.570.08
2019565157.997.991.8810.60.05
20191122589.289.471.8912.470.11
20191685139.589.512.2713.20.06
201922440710.0910.23.4213.760.06
Irrigation Rate
20168021398.798.921.9714.560.05
2016100172510.310.781.9816.730.06
201612022269.9610.322.1617.530.05
20186010089.2192.0515.020.06
2018809449.989.791.9314.90.07
2018100103310.3410.552.0915.050.07
2019606438.868.91.9213.20.07
2019806578.888.993.1413.570.06
20191006228.929.011.8813.760.07
Zone
2016122119.279.591.9817.530.05
20162292210.1910.522.0716.940.04
201639578.869.031.9714.560.08
2018190810.6710.722.0515.050.08
2018210289.289.272.0914.910.07
2018310499.689.731.9313.760.04
201916208.828.782.2712.860.06
201929288.969.013.113.20.06
201933748.819.081.8813.760.11
N = number of observations, SE = standard error. Zone (1 = Low, 2 = Medium, and 3 = High). Irrigation rate shown as % ET. Nitrogen rate shown as (kg N ha−1).
Table 3. ANOVA for years 2016, 2018, and 2019 showing main effects and two-factor interactions.
2016 2018 2019
FactorsSSdfFpSSdfFpSSdfFp
NR191.271424.77<0.00128.6154.570.005984.47416.51<0.001
IR29.56827.65<0.001651.332260.07<0.00110.1523.970.021
Zone10.21422.640.0783.1621.260.3014.2521.660.208
NR: IR126.49188.19<0.00151.29104.09<0.00147.3584.63<0.001
NR: Zone21.10281.360.22913.65101.090.41123.4682.290.052
IR: Zone173.035422.41<0.001152.51430.44<0.00133.5346.55<0.001
SS = sum of squares (Type III), df = degrees of freedom, F =F value, p = p-value. NR = nitrogen rate, IR = irrigation rate.
Publisher’s Note: MDPI stays neutral with regard to jurisdictional claims in published maps and institutional affiliations.